
Why are resources now undermining economic performance
13
Why are resource limits now undermining economic performance? Global Footprint Network Mediterranean Ecological Footprint Initiative
-
Upload
global-footprint-network -
Category
Documents
-
view
222 -
download
2
description
The Ecological Footprint analysis of the Mediterranean countries.
Transcript of Why are resources now undermining economic performance

Why are resource limits now undermining economic performance?
Global Footprint NetworkMediterranean Ecological Footprint Initiative

Long ignored by decision-makers as irrelevant to economic planning and national prosperity, resource limitation is now a critical factor that determines a country’s success in the 21st century. Economic activities depend on access to ecological services and natural resources. However, the Mediterranean region’s access to essential ecological assets has never been as precarious as it is today. According to Global Footprint Network’s analysis, the region now uses approximately two and a half times more natural resources and ecological services than what its ecosystems can provide. This ecological deficit is dangerous. It will erode Mediterranean countries’ economic security and their capacity to guarantee the well-being of their citizens. Reporting the implications of growing ecological deficits for the Mediterra-nean region’s ecosystems and economies is at the heart of Global Footprint Network’s Mediterranean Ecological Footprint Initiative. For the complete analysis and country factsheets, please refer to the Mediter-ranean Ecological Footprint Trends report at www.footprintnetwork.org/med
Are Mediterranean countries at risk?
1

HUMAN CONSUMPTION IS COMPARED TO NATURE’S PRODUCTION / The Ecological Footprint measures people’s use of cropland, forests, grazing land, and fishing grounds for providing resources and absorbing waste (carbon from fossil fuel burning). Biocapacity measures how much biologically productive area is available to produce these resources and services.
Regenerated Resources renewed and waste absorbed.
Consumed Resources used and waste generated.
1. Cropland2. Grazing land3. Fisheries4. Forests5. Carbon (Footprint)6. Settlements
BIOPRODUCTIVE AREAS
Supply of and demand for ecological assets can be measured through the Ecological Footprint, a resource accounting tool. On the demand side, the Ecological Footprint measures the ecological assets (biologically productive land and sea area, or biocapacity) that a given popula-tion requires to produce the natural resources and services it consumes. This includes plant-based food and fiber products, livestock and fish products, timber and other forest products, sequestration of waste (CO2 from fossil fuel burning), and space for urban infrastructure. On the supply side, biocapacity tracks the ecological assets available in each country and at the global level. Both measures are expressed in global hectares (gha)—globally comparable, standardized hectares with world average productivity. Consumption values are derived by tracking production, imports and exports. Each country’s Ecological Footprint can be compared to its biocapacity. If a population’s demand for ecological assets exceeds the country’s supply, that country runs an ecological deficit. It is like comparing income and expenses.
How are ecological assets measured?
32

A WIDENING GAP BETWEEN SUPPLY AND DEMAND / The Mediterranean region’s per person Ecological Footprint (red line) increased, while the biocapacity (green line) per resident decreased. As a result, the ecological deficit (red shaded area) expanded 230 percent from 1961 to 2008.
0
1
2
3
4
2005200019951990198519801975197019651960
Glo
bal
hect
ares
per
cap
ita
Ecological Footprint Biocapacity
Can the region’s ecosystems meet the needs of its residents?From 1961 to 2008, the Mediterranean’s per capita Ecological Footprint increased by 52 percent, while per capita biocapacity in the region decreased 16 percent. The average Mediterranean resident now has an Ecological Footprint of 3.1 global hectares (gha), but only 1.3 gha per person are available in the region. In less than 50 years, the growing gap in supply and demand created a 230 percent increase in the region’s ecological deficit (represented by the shaded area in the right graph). Already in 1961, the needs of the Mediterranean region as a whole exceeded its ecosystems’ capacity to produce resources and services. By 2008, only 40 percent of the region’s Ecological Footprint was met by local ecological assets. The deficit has been met by depleting local stocks and overloading global carbon sinks (34 percent of the Footprint), as well as importing resources such as food and energy from outside the region (26 percent of the Footprint). The widening gap between demand and supply makes the stability of the region highly dependent on the availability of ecological assets outside the Mediterranean region, as well as its ability to pay for accessing the resources and services they produce.
54
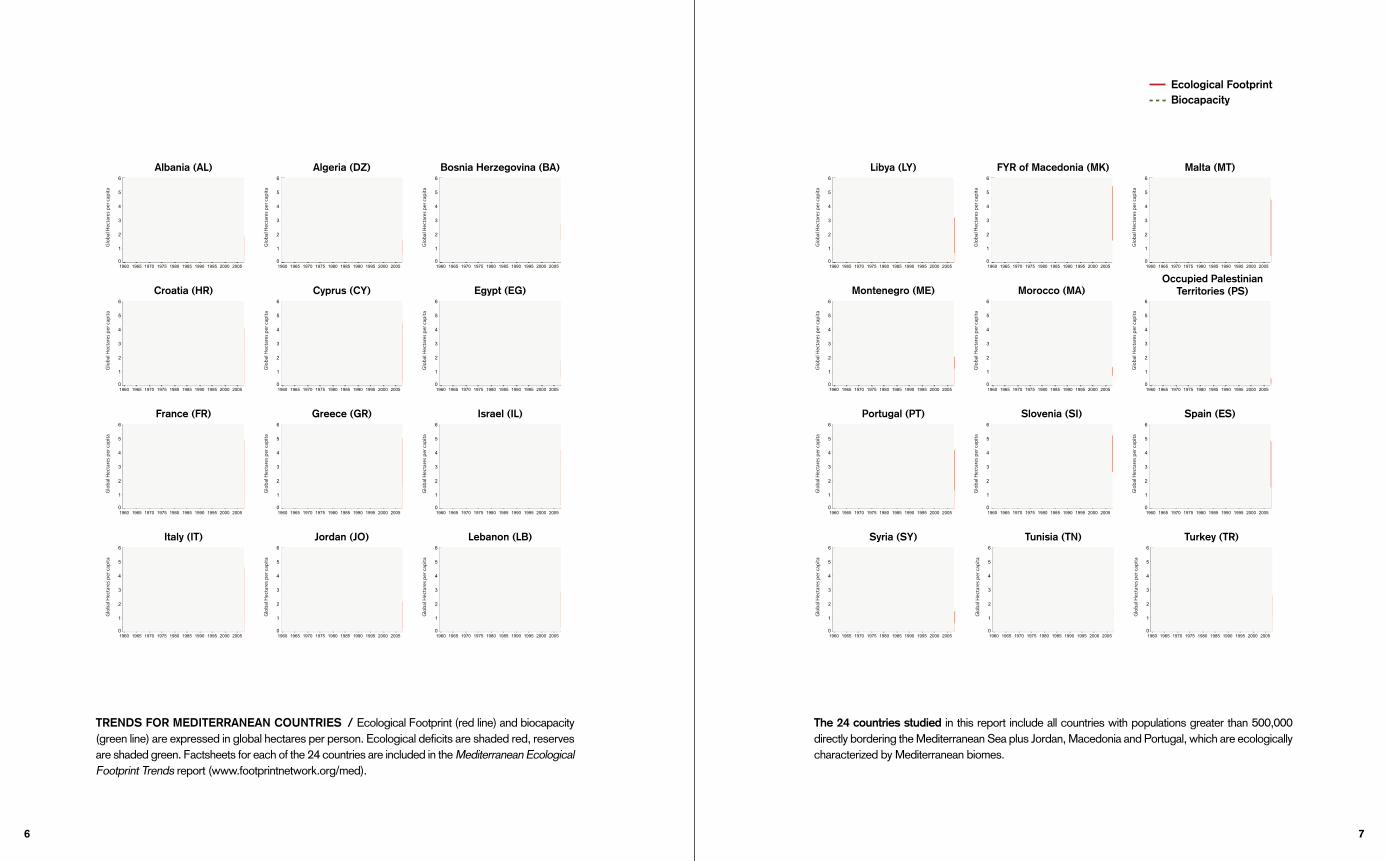
The 24 countries studied in this report include all countries with populations greater than 500,000 directly bordering the Mediterranean Sea plus Jordan, Macedonia and Portugal, which are ecologically characterized by Mediterranean biomes.
TRENDS FOR MEDITERRANEAN COUNTRIES / Ecological Footprint (red line) and biocapacity (green line) are expressed in global hectares per person. Ecological deficits are shaded red, reserves are shaded green. Factsheets for each of the 24 countries are included in the Mediterranean Ecological Footprint Trends report (www.footprintnetwork.org/med).
Albania (AL) Libya (LY)
0
1
2
3
4
5
6
2005200019951990198519801975197019651960
Glo
bal H
ecta
res
per c
apita
0
1
2
3
4
5
6
2005200019951990198519801975197019651960
Glo
bal H
ecta
res
per c
apita
Algeria (DZ) FYR of Macedonia (MK)
0
1
2
3
4
5
6
2005200019951990198519801975197019651960G
loba
l Hec
tare
s pe
r cap
ita0
1
2
3
4
5
6
2005200019951990198519801975197019651960
Glo
bal H
ecta
res
per c
apita
Bosnia Herzegovina (BA) Malta (MT)
0
1
2
3
4
5
6
2005200019951990198519801975197019651960
Glo
bal H
ecta
res
per c
apita
0
1
2
3
4
5
6
2005200019951990198519801975197019651960
Glo
bal H
ecta
res
per c
apita
Croatia (HR) Montenegro (ME)
0
1
2
3
4
5
6
2005200019951990198519801975197019651960
Glo
bal H
ecta
res
per c
apita
0
1
2
3
4
5
6
2005200019951990198519801975197019651960
Glo
bal H
ecta
res
per c
apita
Cyprus (CY)
0
1
2
3
4
5
6
2005200019951990198519801975197019651960
Glo
bal H
ecta
res
per c
apita
Morocco (MA)
0
1
2
3
4
5
6
2005200019951990198519801975197019651960
Glo
bal H
ecta
res
per c
apita
Egypt (EG)
0
1
2
3
4
5
6
2005200019951990198519801975197019651960
Glo
bal H
ecta
res
per c
apita
0
1
2
3
4
5
6
2005200019951990198519801975197019651960
Glo
bal H
ecta
res
per c
apita
Portugal (PT)
0
1
2
3
4
5
6
2005200019951990198519801975197019651960
Glo
bal H
ecta
res
per c
apita
France (FR)
0
1
2
3
4
5
6
2005200019951990198519801975197019651960
Glo
bal H
ecta
res
per c
apita
Greece (GR)
0
1
2
3
4
5
6
2005200019951990198519801975197019651960
Glo
bal H
ecta
res
per c
apita
Slovenia (SI)
0
1
2
3
4
5
6
2005200019951990198519801975197019651960
Glo
bal H
ecta
res
per c
apita
Spain (ES)
0
1
2
3
4
5
6
2005200019951990198519801975197019651960
Glo
bal H
ecta
res
per c
apita
Israel (IL)
0
1
2
3
4
5
6
2005200019951990198519801975197019651960
Glo
bal H
ecta
res
per c
apita
Syria (SY)
0
1
2
3
4
5
6
2005200019951990198519801975197019651960
Glo
bal H
ecta
res
per c
apita
Italy (IT)
0
1
2
3
4
5
6
2005200019951990198519801975197019651960
Glo
bal H
ecta
res
per c
apita
Jordan (JO)
0
1
2
3
4
5
6
2005200019951990198519801975197019651960
Glo
bal H
ecta
res
per c
apita
Tunisia (TN)
0
1
2
3
4
5
6
2005200019951990198519801975197019651960
Glo
bal H
ecta
res
per c
apita
Turkey (TR)
0
1
2
3
4
5
6
2005200019951990198519801975197019651960
Glo
bal H
ecta
res
per c
apita
Lebanon (LB)
0
1
2
3
4
5
6
2005200019951990198519801975197019651960
Glo
bal H
ecta
res
per c
apita
Ecological Footprint
Biocapacity
Ecological FootprintBiocapacity
Occupied Palestinian Territories (PS)
76

SUPPLY GOES DOWN, RESOURCE PRICES GO UP / Consumption in the Mediterranean region is exceeding the local ecological budget. This forces Mediterranean countries to rely on global ecological assets as the world’s diminishing resources have become more expensive.
Glo
bal h
ecta
res
per
capi
ta
0
1
2
3
4
Ecological Footprint Biocapacity
World:Mediterranean:
1960 1965 1970 1975 1980 1985 1990 1995 2000 2005
Com
mod
ity p
rices
inde
xed
to 2
000
0
50
100
150
200
250
300
350
400
FoodEnergy
Raw MaterialsMetals and Minerals
1960 1965 1970 1975 1980 1985 1990 1995 2000 2005
Why is it getting harder to obtain resources?
Regional and global resource trends during the last five decades, as distinguished by three phases in the right graphs, have placed the Mediterranean in an ever more precarious state. In the first phase (1961-1970), when the region was already in an ecological deficit, its residents were consuming more resources and ecological services than local ecosystems were able to produce. But because the planet had an ecological reserve, and was able to provide more resources and services than humanity required, the region could rely on foreign ecosystems to satisfy its needs. In the second phase (1971-2000), the Mediterranean’s gap between supply of and demand for ecological assets continued to grow while, globally, humanity’s demand for natural resources and services overtook the planet’s ability to produce them. The world went into ecological overshoot, and the global competition for resources started to increase. But prices were slow to react. As of 2000, this gap between supply and demand has grown both regionally and globally. The international commodity markets have also tightened, contributing to the rising prices of the world’s diminishing resources.
98

MEDITERRANEAN’S TOP TRADING PARTNERS / The Mediterranean region’s import dependence has increased 70 percent during the last 30 years. Meanwhile, countries exporting resources to the region have moved towards larger ecological deficits (red shaded) or lost their ecological reserves (green shaded). This may compromise exporter countries’ future ability to supply the Mediterranean region.
More than ever before, the Mediterranean region is dependent on trade. Reliance on foreign ecological assets, notably to provide food and other essential commodities, has increased by approximately 70 percent in the last three decades. During the same period, the Mediterranean’s major trade partners saw a steady increase in their ecological deficits. In addition, trade relationships have shifted from countries with ecological reserves (e.g., Canada, Argentina) to those with ecological deficits (e.g., Germany, Belgium, the Netherlands and China). Global ecological overshoot, when our demands for nature’s products and services exceed the planet’s ability to renew them, also increased during this time. By 2008, humanity was using 52 percent more resources and ecological services than were available globally. As resources are getting scarcer and competition for them is heating up, the Mediterranean’s exposure to world market price volatility and supply disruption is increasing. Nations in the region now need to factor in the resource constraints of their trade partners and recognize the risk it poses to their own economic prosperity.
Is security of supply at risk?
NorwayUnited Kingdom
ArgentinaDenmark
NetherlandsIceland
United StatesSaudi Arabia
CanadaIraq
Germany
Belgium
Netherlands
China
Russian Federation
United Kingdom
United States
Denmark
Ukraine
Sweden
2008Total imports (gha): 142,218,949
1977Total imports (gha) 30,229,534
Ecological DebtorsFootprint greater than biocapacity 150% 100 –150% 50–100% 0 – 50%
Ecological CreditorsBiocapacity greater than Footprint 0 – 50% 50–100% 100 –150% 150%
1110
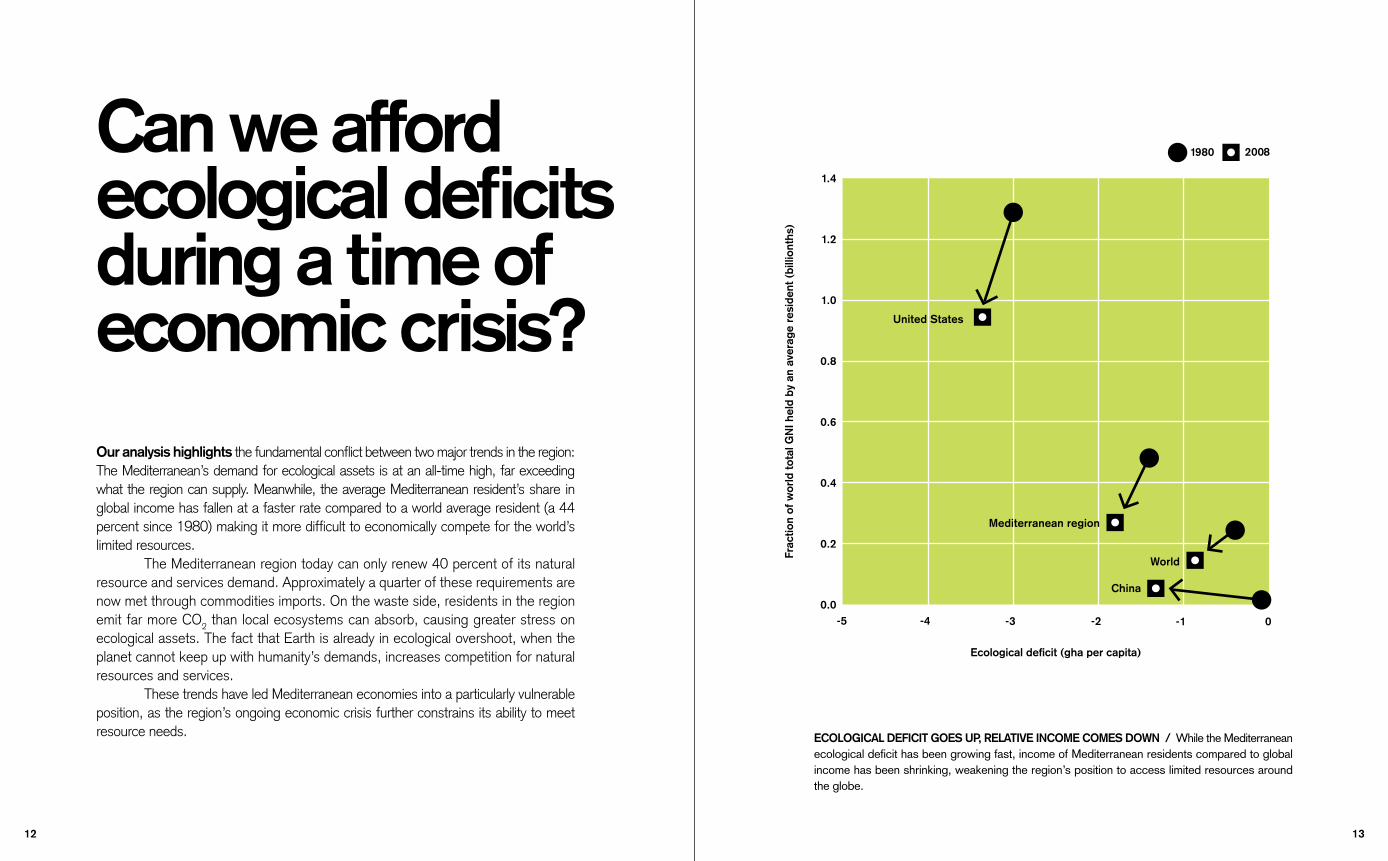
ECOLOGICAL DEFICIT GOES UP, RELATIVE INCOME COMES DOWN / While the Mediterranean ecological deficit has been growing fast, income of Mediterranean residents compared to global income has been shrinking, weakening the region’s position to access limited resources around the globe.
1.4
1.2
1.0
0.8
0.6
0.4
0.2
0.0-5 -4 -3 -2 -1 0
United States
Mediterranean region
World
China
1980 2008
Frac
tion
of w
orld
tota
l GN
I hel
d by
an
aver
age
resi
dent
(bi
llion
ths)
Ecological deficit (gha per capita)
Our analysis highlights the fundamental conflict between two major trends in the region: The Mediterranean’s demand for ecological assets is at an all-time high, far exceeding what the region can supply. Meanwhile, the average Mediterranean resident’s share in global income has fallen at a faster rate compared to a world average resident (a 44 percent since 1980) making it more difficult to economically compete for the world’s limited resources. The Mediterranean region today can only renew 40 percent of its natural resource and services demand. Approximately a quarter of these requirements are now met through commodities imports. On the waste side, residents in the region emit far more CO2 than local ecosystems can absorb, causing greater stress on ecological assets. The fact that Earth is already in ecological overshoot, when the planet cannot keep up with humanity’s demands, increases competition for natural resources and services. These trends have led Mediterranean economies into a particularly vulnerable position, as the region’s ongoing economic crisis further constrains its ability to meet resource needs.
Can we afford ecological deficits during a time of economic crisis?
1312
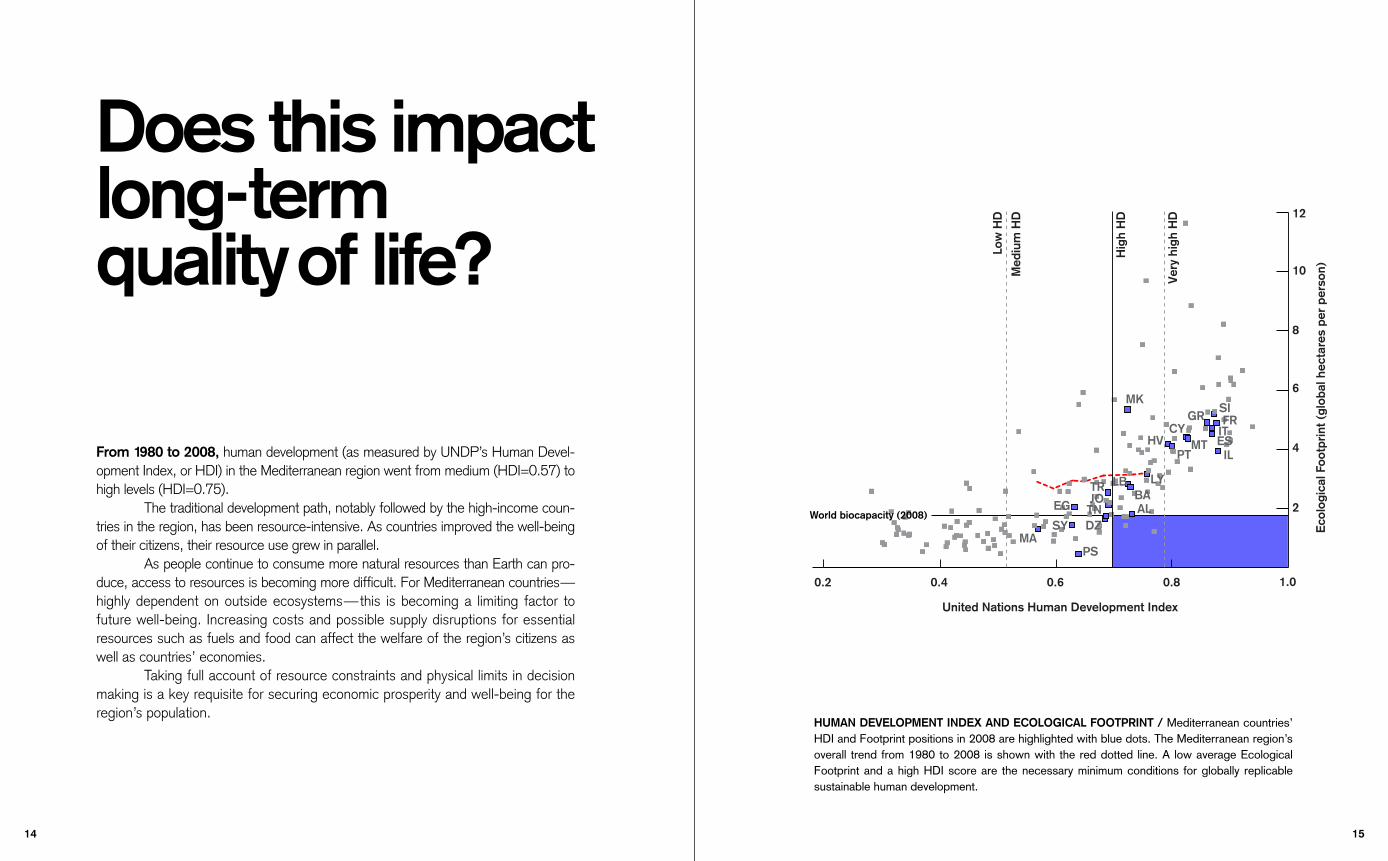
HUMAN DEVELOPMENT INDEX AND ECOLOGICAL FOOTPRINT / Mediterranean countries’ HDI and Footprint positions in 2008 are highlighted with blue dots. The Mediterranean region’s overall trend from 1980 to 2008 is shown with the red dotted line. A low average Ecological Footprint and a high HDI score are the necessary minimum conditions for globally replicable sustainable human development.
Does this impact long-term quality of life?
From 1980 to 2008, human development (as measured by UNDP’s Human Devel-opment Index, or HDI) in the Mediterranean region went from medium (HDI=0.57) to high levels (HDI=0.75). The traditional development path, notably followed by the high-income coun-tries in the region, has been resource-intensive. As countries improved the well-being of their citizens, their resource use grew in parallel. As people continue to consume more natural resources than Earth can pro-duce, access to resources is becoming more difficult. For Mediterranean countries— highly dependent on outside ecosystems—this is becoming a limiting factor to future well-being. Increasing costs and possible supply disruptions for essential resources such as fuels and food can affect the welfare of the region’s citizens as well as countries’ economies. Taking full account of resource constraints and physical limits in decision making is a key requisite for securing economic prosperity and well-being for the region’s population.
0.2 0.4 0.6 0.80
22
4
6
8
10
12
Ecol
ogic
al F
ootp
rint (
glob
al h
ecta
res
per
pers
on)
United Nations Human Development Index
1.0
ILESIT
GR FRSI
PT
CYMTHV
LYBA
LB
MK
ALDZ
JOTN
SYMA
EG
Low
HD
Med
ium
HD
Hig
h H
D
Very
hig
h H
D
TR
World biocapacity (2008)
PS
1514

What if more countries are bidding on fewer resources?
1716

Leaders today require strategies that address the twin trends of shrinking resource supply and our growing demands upon the planet. Staying on the current trajectory brings great risk. As policies and investments increase resource consumption, the Med-iterranean region’s economic ability to succeed in the global competition for resources is vanishing. Global Footprint Network and its partners have the tools and programs necessary to help countries thrive in a resource-constrained world. These programs help economic decision-makers to react to resource limitation, and to demonstrate that it is both in countries’ own self-interests and within their power to reverse these dangerous resource trends. Even in this resource-constrained world, countries can remain economically successful. It all comes down to decisions: What tools will governments use to help plan policy and investment? How will they measure their country’s full wealth, risks and vulnerabilities? How will they prepare for the tightening competition for resources? How will their decisions generate net wealth? By showing decision-makers that they can be more successful by operating within nature’s budget, Global Footprint Network aims to help them create a stable and prosperous economy.
How we can track risks and opportunities.
1918

Paolo LombardiDirector, WWF Mediterranean Programme
Yolande Valle-NeffDirector, UNESCO Office in Venice
Mathis WackernagelPresident, Global Footprint Network
Lynda ManssonDirector General, MAVA Foundation
Hugues Ravenel Director, Plan Bleu
“We call on governments and international institutions to consider Ecological Footprint and biocapacity to assess the state of ecological assets, and to measure progress towards sustainable development and green economy in the Mediterranean region.”
For the complete analysis and country factsheets, please refer to the Mediterranean Ecological Footprint Trends report at www.footprintnetwork.org/med
20

Venice OfficeRegional Bureau for Scienceand Culture in Europe
United Nations(GXFDWLRQDO��6FLHQWL¿F�DQG
Cultural Organization
Analysis:
Funding:
Support:
The UNESCO Venice Office is developing an educational and training platform on the application of the Ecological Footprint in SEE and Mediterranean countries, using in particular the network of MAB Biosphere Reserves as special demonstration and learning places.
WWF’s mission is to build a future in which people live in harmony with nature. The WWF Mediterranean initiative aims at conserving the natural wealth of the Mediterranean and reducing human footprint on nature for the benefit of all.
Plan Bleu aims to produce information and knowledge in order to alert decision-makers and other stakeholders to environmental risks and sustainable development issues in the Mediterranean, and to shape future scenarios to guide decision-making processes.
The MAVA Foundation was established in 1994 and is a family-led, Swiss-based philanthropic foundation whose mission is to engage in strong partnerships to conserve biodiversity for future generations.
Global Footprint Network promotes a sustainable economy by advancing the use of the Ecological Footprint, a resource management tool that measures how much nature we have, how much we use and who uses what.