Who’s Afraid of the Cashless Society? · Who’s afraid of the cashless society? Belgian survey...
50
- 1 - Who’s afraid of the cashless society? Belgian survey evidence WORK IN PROGRESS PLEASE DO NOT QUOTE WITHOUT PERMISSION Ellen Loix Ph.D. Candidate Centre for Work, Organisational and Economic Psychology (WOEPS) Free University of Brussels Roland Pepermans Full Professor Centre for Work, Organisational and Economic Psychology (WOEPS) Free University of Brussels Leo Van Hove * Associate Professor Centre for Economic, Monetary, and Financial Policy (ECON) Free University of Brussels Abstract: to be added. JEL classification: E41, O30 1. Introduction Recent years have seen a boom in research on payment systems. There is today a steady stream, if not a wave, of papers on topics such as interchange fees and large-value payment systems. Papers on payment behaviour, however, continue to come in trickles at best. In a paper written in 1997, Kennickell and Kwast stress that up to that point much of the discussion of new electronic payment instruments had revolved around potential public policy concerns or had focused on the supply side of the market. In contrast, they point out, "relatively little of the discussion ... ha[d] addressed the demand side of the market, or such questions as: What types of products are consumers likely to be actually willing to pay for? What are the characteristics of current and likely future purchasers of electronic products and services? How quickly will consumers adopt electronic technologies?" (Kennickell and Kwast, 1997, p. 1; emphasis in original). * Corresponding author: Leo Van Hove, ECON – 2C147, Vrije Universiteit Brussel, Pleinlaan 2, B-1050 Brussels, Belgium. Tel: +32 2 629.21.25 - Fax: +32 2 629.20.60 - e-mail: [email protected] - home page: <http://econ.vub.ac.be/cfec/leo.htm>. The authors would like to thank Dirk Syx, former CEO of Banksys, for commissioning the survey. They also thank Jean-Michel Dasnoy, Françoise Nollet, and Joël Peczenik (Banksys) for their help in setting up the questionnaire, and Jean-Pierre Wanquet (Ipsos Brussels) for the field work. They are also indebted to Benny Geys and Bruno Heyndels for their help with the data on Belgian municipalities.
-
Upload
trinhtuyen -
Category
Documents
-
view
235 -
download
0
Transcript of Who’s Afraid of the Cashless Society? · Who’s afraid of the cashless society? Belgian survey...

- 1 -
Who’s afraid of the cashless society?Belgian survey evidence
WORK IN PROGRESSPLEASE DO NOT QUOTE WITHOUT PERMISSION
Ellen LoixPh.D. Candidate
Centre for Work, Organisational and Economic Psychology (WOEPS)Free University of Brussels
Roland PepermansFull Professor
Centre for Work, Organisational and Economic Psychology (WOEPS)Free University of Brussels
Leo Van Hove *
Associate ProfessorCentre for Economic, Monetary, and Financial Policy (ECON)
Free University of Brussels
Abstract: to be added.JEL classification: E41, O30
1. Introduction
Recent years have seen a boom in research on payment systems. There is today a steady stream, ifnot a wave, of papers on topics such as interchange fees and large-value payment systems. Paperson payment behaviour, however, continue to come in trickles at best. In a paper written in 1997,Kennickell and Kwast stress that up to that point much of the discussion of new electronic paymentinstruments had revolved around potential public policy concerns or had focused on the supply sideof the market. In contrast, they point out, "relatively little of the discussion ... ha[d] addressed thedemand side of the market, or such questions as: What types of products are consumers likely to beactually willing to pay for? What are the characteristics of current and likely future purchasers ofelectronic products and services? How quickly will consumers adopt electronic technologies?"(Kennickell and Kwast, 1997, p. 1; emphasis in original).
* Corresponding author: Leo Van Hove, ECON – 2C147, Vrije Universiteit Brussel, Pleinlaan 2, B-1050 Brussels,Belgium. Tel: +32 2 629.21.25 - Fax: +32 2 629.20.60 - e-mail: [email protected] - home page:<http://econ.vub.ac.be/cfec/leo.htm>. The authors would like to thank Dirk Syx, former CEO of Banksys, forcommissioning the survey. They also thank Jean-Michel Dasnoy, Françoise Nollet, and Joël Peczenik (Banksys) fortheir help in setting up the questionnaire, and Jean-Pierre Wanquet (Ipsos Brussels) for the field work. They are alsoindebted to Benny Geys and Bruno Heyndels for their help with the data on Belgian municipalities.

- 2 -
Kennickell and Kwast's observation is still valid today. The reason behind the relative neglect ofthe consumer side is also unchanged. The lack of research is primarily due to the scarcity of data,which typically have to be generated by means of (costly) surveys (o.c., p. 2; Boeschoten, 1998,p. 117). Researchers in the U.S. can exploit the extremely rich source of information that is thetriennial Survey of Consumer Finances (SCF); see Avery et al. (1986), Duca and Whitesell (1995),Kennickell and Kwast (1997), Stavins (2001), Mester (2003), Hayashi and Klee (2003), andKlee (2005). The Dutch central bank also has a tradition of regularly conducting expendituresurveys that can be used to analyse the payment behaviour of households; see Mot and Cramer(1992), and Boeschoten (1992, 1998) and the references therein. The Austrian central bank, for itspart, has been conducting a 'payment card survey' at quarterly intervals since 1996, and alsocommissioned a more detailed 'payment behaviour survey' in 1996 and again in 2000; seeMooslechner et al. (2002).
Efforts in other countries are typically of a one-off nature, as is ours. Concretely, we have benefitedfrom the fact that in order to celebrate its 15th birthday in 2004, Banksys - the national EFTPOSoperator in Belgium - decided to commission a unique, large-scale payments survey among 1,008Belgian consumers. The present paper uses part of the data generated by this survey to explains theadoption and usage of debit cards, credit cards, electronic money, and retailer cards in terms of(1) respondents’ socio-demographic and financial characteristics, (2) their propensity to adopt newtechnologies, and (3) supply-side factors. The same approach is also used to analyse respondents’willingness to embrace an all-electronic payments environment; in other words, their attitudetoward the much-heralded cashless society.
The contribution of the paper is threefold. First, when it comes to electronic money, the setting ofthe survey is unique. Belgium is one of the very few countries with a (relatively) successfulelectronic purse scheme, called Proton (Van Hove, 2004, 2005) 1. Earlier surveys on card-basede-money were either restricted to small-scale pilots – see Plouffe et al. (2001) for Canada, Westland(2002) for Hong Kong, Truman et al. (2003) for the U.S., Penz et al. (2004) for Austria, andM’Chirgui (2004) for France – or conducted in countries where e-purse usage at the retail Point ofSale is distinctly lower than in Belgium – see Mooslechner et al. (2002) for Austria, andJonker (2005) for the Netherlands 2. The problem with analysing payment behaviour in a trialsetting is that the equipment is typically made available at a reduced price, or in some cases evengiven free. Such subsidies tend to bias consumers and merchants toward adoption. The problemwith a high share of e-purse usage outside of the retail environment is that in some cases consumers 1 An electronic purse is a chip card that can store prepaid value to be used for low-value payments at multiple retailers.See Van Hove, L., 1996-2005, "A selected bibliography on electronic purses (and electronic money)", web site<http://econ.vub.ac.be/cfec/purses.htm>.2 In the Netherlands, a recent survey by Millward Brown has confirmed that the Dutch see the local Chipknip electronicpurse primarily as a universal parking card and only infrequently use it in shops (Source: “Nederland wil niet aan deChipknip", De Telegraaf, April 14, 2005).

- 3 -
may not have a real choice. For example, in the Netherlands, a number of municipalities saw theintroduction of the euro as the perfect moment to start collecting parking fees electronically and doaway with cash payment and the associated vandalism. As of 1 January 2002, the use of the localChipknip e-purse has become compulsory at all parking meters in the cities of Rotterdam andNijmegen, and in Purmerend 3. This explains why in a recent survey conducted by DeNederlandsche Bank (DNB), the Dutch central bank, the second most-cited reason for choosing topay by e-purse at parking meters was simply "cash not accepted", with 23% of the responses(Jonker, 2005, Table 3, p. 11). To put things into perspective, in September 2004 - when the DNBsurvey was held - parking accounted for 31% of the total number of Chipknip payments 4 vs. only13% for retail, 21% for vending, and 30% for 'catering' 5. Catering refers primarily to cafeterias andrestaurants in companies and schools. Some of these closed environments may also be cashless.Another example of 'forced' adoption are e-purses that started out as public transit cards and onlylater migrated to the retail sector, as the Octopus card in Hong Kong has done. As is explained inVan Hove (2005), commuters in Hong Kong had little choice but to use the Octopus card. A surveyconducted in May/June 2001 among 507 Hong Kong residents found that 94.3% of the respondentsowned an Octopus card, and that literally all cardholders used it (Paynter and Law, 2004). Themajority (62.1%) of the respondents who did not own a card suggested that the major reason was"because they [did] not need to have one or rarely used the services supported by the system". Thebottom line is simple: people use the Octopus card because they require the services. Since the bulkof Proton payments are conducted in the retail environment, such 'forced' adoption is no issue in ouranalysis.
A second contribution of the paper is that we have detailed controls for the effect of location.Controlling for location has been done earlier in U.S. studies on consumers’ choice of paymentinstrument; see Stavins (2001), and Hayashi and Klee (2003). However, in both studies mentionedthe only information on the geographic location of the respondents is their Census division. Ourcontrols for location are less crude. We have ZIP codes for where respondents live, as well as ZIPcodes for where they work. These ZIP codes allowed us to distinguish between richer and poorercommunes, between urban regions and the countryside, etc. From separate sources - the Banksysdatabase and the Belgian banks - we also have data on the number of POS terminals and ATMs perZIP code. This allowed us to control more explicitly for supply-related factors.
Thirdly, we have also included in our analysis the propensity to adopt new technologies, in line withwhat has been done earlier - for other payment instruments - by Mantel (2000), Hayashi and
3 Source: De Nederlandsche Bank, Quarterly Bulletin, March 2002, p. 25.4 In 2002, no less than half of these parking meter payments took place in the three cities with Chipknip-only parking(Source: De Nederlandsche Bank, Current developments in payments and securities transactions, Quarterly Bulletin,March 2003, p. 20).5 Source: Chipknip website at <http://www.chipknip.nl/>, visited on January 23, 2005.

- 4 -
Klee (2003), and Borzekowski and Kiser (2004). We have, among other things, constructed a‘technology index’ based on respondents’ use of PCs, the Internet, mobile phones, PDAs, andbanking services via mobile phone. To the best of our knowledge, such an index has not yet beenused in an analysis of the adoption of electronic money. In any case, the combination ofdemographic and financial characteristics, detailed supply-side factors, and new technologyadoption in a single analysis is unique where e-money is concerned. In addition, with the exceptionof retailer cards, we are also able to gauge the impact of the cost of a payment instrument asperceived by consumers.
The remainder of this paper is structured as follows. Section 2 provides some backgroundinformation on the Belgian payment system. Section 3 discusses the set-up of the survey andpresents the data. Section 4 examines the results of our logit analyses. Section 5 compares ourresults with the existing literature, and Section 6 concludes.
2. Background on the Belgian payment system
If one uses the well-established distinction between giro countries, cheque countries, and cashcountries, Belgium is a prime example of a giro country. Indeed, if one looks at the number of non-cash payments, the credit transfer is by far the most commonly used payment medium in Belgium.The use of cheques, which until 1992 were the second most frequently used cashless paymentinstrument, has been declining steadily as commercial banks gradually increased cheque fees. Thedeath-blow came with the removal of the payment guarantee of the so-called eurocheque on1 January 2002 6. Today, cheques have all but disappeared in Belgium (see below). As is the casefor most countries, hard data on cash use in Belgium is not available. According to a study by DeGrauwe et al. (1999), cash still accounted for 75% of retail payments in 1998, compared to a mere9% for payment cards. Given the uptake in card usage documented below, the relative importanceof cash payments is probably substantially lower today, although in terms of numbers cash is stillbelieved to be the single most important means of payment at the POS.
Since our survey did not cover remote payments (see Section 3), Tables 1 and 2 only show data onthe penetration and use of non-cash means of payment that can be used at the POS; that is, debitcards, credit cards, the Proton electronic purse, and cheques. Given that the Belgian populationamounted to 10.3 million at end-2003, Table 1 shows a very high penetration of theBancontact/Mister Cash debit card. Bancontact and Mister Cash are the names of the two ATM-EFTPOS networks - each of which was backed by different commercial banks - that merged in1989 to form Banksys. As of that date, Banksys became the national EFTPOS operator, jointly
6 In this system, merchants knew that all cheques would be honoured up to an amount of BEF 7,000 (roughlyEUR 175), irrespective of whether the drawer’s current account had sufficient cover.

- 5 -
owned by the majority of Belgian banks. The Belgian Post Office had a competing network, calledPostomat, but this was much smaller and the network eventually disappeared in 2000. So, crucially,there is in Belgium today only one EFTPOS network and there are thus no interoperabilityproblems whatsoever.
The Proton electronic purse saw the light of day on February 18, 1995. On that day, Banksysstarted a pilot in the cities of Louvain and Wavre. [The 30,000 Proton cards mentioned for 1995 inTable 1 were cards in circulation in these cities.] In May 1996, Banksys commenced expansion ofthe Proton network, making Belgium one of the first countries in the world where a reloadableintersector e-purse was launched on a nation-wide scale. By the end of 1997, the Protoninfrastructure was in place in the 24 most important cities. One year later, the whole of Belgiumwas covered. Initially, the Proton card was only available as a stand-alone card. It was only at theturn of 1996-1997 that the Belgian banks started mounting the Proton application on their debitcards, which from that moment on where equipped with a chip. At first sight, Table 1 seems toshow that the penetration of the Proton card approaches that of the Bancontact/Mister Cash debitcard. However, as is stressed in Van Hove (2004, 2005) and as will be shown below, many Protoncards are in fact ‘sleeping’ cards. This is because from 1997 onwards, the Belgian banks simplysent account holders a combined debit/e-purse card when their old magstripe cards came up forrenewal. Unsurprisingly, many of the unsolicited e-purses have remained unused. At end-2003,only some 2.1 out of the 8.8 million cards that carried a Proton application were in active use 7. InJuly 2004, when our survey was held, the number of active Proton cards was close to 2 million– which corresponds to 20% of the Belgian population. In an international perspective, this is ahigh level; see Van Hove (2004, 2005). Finally, Table 1 shows that credit cards are far lesscommon than debit cards in Belgium. Moreover, most cards with a credit function are of thedelayed debit type. Consistent figures on retailer cards with a payment function are unavailable.
Table 2 presents data on non-cash payments in Belgium for the year 1995, and for 2000-2003. Thetop part shows the number of payments, the bottom part shows their value. In both parts, the left-hand panel gives absolute figures and the right-hand panel gives shares. Note that the shares do notsum up to 100 because we focus on payment media that can be used at the POS so that credittransfers, for example, are not included. This is particularly apparent in the bottom-right panel: in2003, credit transfers accounted for no less than 98.8% of the total value of cashless transactions inBelgium. Starting with cheques, the volume figures in Table 2 illustrate nicely the gradual drop intheir popularity, as well as the blow dealt – in 2002 – by the removal of the eurocheque guarantee.In terms of value, cheques have held their ground somewhat better because the small number ofcheques that are still written – a theoretical average of 2.3 per Belgian per year – are for large-value
7 Banksys considers a Proton card to be in active use when it has performed at least one transaction in the previous sixmonths.

- 6 -
payments. As the bulk of these cheques are not written in shops, Table 2 demonstrates that debitcards are today the dominant non-cash payment medium at the POS. Table 2 also shows asubstantial jump in e-purse usage between 2001 and 2002. This was due to the introduction of thephysical euro on 1 January 2002. Unfamiliar as they were with the new coins and banknotes, noless than 700,000 Belgians joined the ranks of Proton users in January 2002 (Van Hove, 2004).However, as the 2003 figure in Table 2 already indicates – and as is documented in more detail inVan Hove (2005) – a large part of this ‘euro effect’ has since vanished. Finally, while the use ofcredit cards increased considerably between 1995 and 2000, their relative importance has remainedfairly stable over the period 2000-2003. However, in recent years credit card usage has probablyincreased now that supermarkets have started accepting them.
Table 3 places Belgians’ payment behaviour in an international perspective by looking at thenumber of transactions per capita in the countries listed in the CPSS ‘Red Book’ 8. Starting againwith cheques, the Table again shows their quasi-disappearance in Belgium, just as in Germany, theNetherlands, and Sweden. Table 3 also shows that while debit cards may be, as pointed out whendiscussing Table 2, the dominant non-cash payment medium at the POS in Belgium, their frequencyof use is by no means exceptional internationally. Suffice it to refer to the figures for Canada,Sweden, and the Netherlands. This might be an indication of higher cash use in Belgium. Turningto e-purses, Belgium has the highest usage of all CPSS countries, barring Singapore. The entry forSingapore is not a typo. Rather, the high figure is due to the use of the ez-link card for publictranport and the use of the CashCard in the Electronic Road Pricing scheme - where it iscompulsory. Finally, credit card use in Belgium is only a fraction of that in Anglo-Saxon countries.
3. The survey
As mentioned in the Introduction, on the occasion of its 15th birthday, Banksys commissioned alarge-scale payments survey among Belgian consumers. The survey was conducted in July 2004.In total 1,008 respondents aged 15 and older were interviewed face-to-face in their homes during 30to 40 minutes. Use was made of quota - on characteristics such as age, sex, education level, andlanguage - in order to ensure that the sample was representative on a national scale. The field workwas conducted by IPSOS Brussels; the scientific supervision was in the hands of the Centre forWork, Organisational and Economic Psychology (WOEPS), and the Centre for Economic,Monetary, and Financial Policy (ECON), both of the Vrije Universiteit Brussel (Free University ofBrussels).
8 Some caution is required when interpreting these figures as the definition of what constitutes a credit and a debit cardmay differ across countries. France and Germany are two salient cases.

- 7 -
In line with Banksys’ core business, the survey focused on electronic means of payment used at thePOS; namely, debit cards, credit cards, electronic purses, and (to a lesser extent) retailer cards.However, there were also a number of cash-related questions, as cash is probably still the dominantmeans of payment at the POS. As mentioned, cheques were not included in the survey because theyhave de facto almost disappeared (see Section 2).
On a first level, apart from the typical socio-demographic and financial characteristics, consumerswere asked whether they had heard of the means of payment surveyed, whether they owned them,and, if so, how frequently they used them. On a second level, respondents were asked to scorepayment instruments on different criteria. Finally, there were also a number of future-orientedquestions. The answers to the latter questions pointed out, for example, that 71% of users could livewithout their Bancontact/MisterCash debit card for one week at most. However, at the same time67% of respondents indicated that even in an environment where literally all payments could besettled electronically, they would still continue to use (some) cash. In other words, while themajority of Belgians are keen debit card users, there is apparently still quite some resistance againstthe possible advent of the cashless society. In our logit analyses described in Section 4, wetherefore wanted to find out which consumers own a specific electronic means of payment, whichowners use it, which users use them frequently, and, finally, whether or not these ‘segments’coincide with the demarcation between consumers who are ‘afraid’ of the cashless society and thosewho are not.
The model behind our logit analysis is similar to the one used – mostly implicitly – in the existingliterature. Specifically, subject to appropriate budget and availability constraints, a consumer isassumed to adopt or use a payment instrument only if this increases her utility. As in Klee (2005,p. 9), it is assumed that utility is a function of income, age and other demographic characteristics.Following Mantel (2000) and Hayashi and Klee (2003), we also included new product adoptionfactors in our analysis, in line with the idea that some consumer segments are natural innovators andearly adopters. Yet other papers emphasise that supply-side factors are also important. Forexample, the number of POS terminals may differ across regions. Given that payment cardnetworks exhibit significant indirect network externalities - implying that the number of card usershas a positive impact on the number of accepting merchants and vice versa - this is something thatwe have tried to control for. Other factors unfortunately remain unobserved. In Belgium, all banksoffer the same debit card (Bancontact/Mister Cash) and electronic purse (Proton) in conjunctionwith a current account, as well as a comparable range of credit cards. There was thus no need tocontrol for bank affiliation. However, not everyone may be offered a credit card. Also, severalstudies have shown that transaction characteristics also have an influence on payment choice 9.
9 In a study for the Netherlands, Mot and Cramer (1992) control for the size of the payment, the type of commodity orservice, and the place of purchase. Their results are not reported in this paper because they do not consider payment

- 8 -
However, since our survey was not set up as a budget survey, it did not ask respondents to report onindividual transactions. Hence, we were unable to include transaction characteristics.
Table 4 provides an overview of all variables used. For ease of interpretation, the explanatoryvariables have been grouped into four broad categories: socio-demographic, financial, technology,and supply-side. The same categories are also used when reporting our results and when comparingthem with those of earlier studies. In the category of socio-demographic variables, we questionedour respondents on the same aspects as earlier studies. Moreover, we added one aspect, namelylanguage, since it is not impossible that cultural differences between the Dutch and French speakingpart of Belgium have an influence on payment behaviour. In terms of financial characteristics,respondents were asked to indicate the class congruent with their personal monthly income aftertaxes. However, nearly 30% of our sample refused to answer. It thus appears that questionsconcerning the personal income level remain a sensitive issue in Belgium (see also Van Dam andVan den Bosch, 1997). Concerning technology use, respondents were asked to indicate – on a 6-point scale - their frequency of use of a mobile phone, a personal computer, the internet, a PDA andbanking services via mobile phone. Based on this, we constructed a new variable by adding up theintensity-of-use responses across technologies (the range is thus between 5 and 30). This‘technology index’ is meant to measure the degree of resistance to new technologies. However, inour analyses, we also wanted to determine the influence of separate technologies. To that end, wetransformed the original (ordinal) intensity-of-use response format to a dummy-use format (seeTable 4). Finally, there is the category of the supply-side variables. Inspired by earlier studies, weasked respondents for the ZIP code of their home as well as their place of work. Based on this, wewere able to determine the corresponding region and province 10. However, Stavins in her study forthe U.S. explicitly regrets that “the only information on geographic location of the respondents istheir Census division, an area larger than that where network externalities are likely to exist”(2001, p. 29; emphasis added). We therefore constructed several control variables for location thatare less crude. Specifically, we were able to link the ZIP codes of our respondents to data on themedian income level and density of communes available in databases from the Belgian NationalInstitute for Statistics (see Table 4 for more details). Note that a commune typically has multipleZIP codes. We were also able to compute the number of POS terminals and ATMs per ZIP code(based on information available in the Banksys database and obtained from the Belgian banks,respectively 11). We also combined data from the databases mentioned to construct variables thatmeasure the availability of ATMs (number of ATMs/km2, number of ATMs/inhabitants).
cards. This is because in 1987 debit cards did not yet exist in the Netherlands and credit card payments numbered lessthan 1% of the sample.10 The number of missing data for “Region work” and “Province work” is about 26%. At first sight, this may appear arather large number, yet these missing data include respondents who are not working; cf. the variable ‘employment’:student (9.5%), unemployed (6.3%) and housewife/man (9.7%).11 Unfortunately, at this point in our analysis, the number of POS terminals refers to the total number ofBancontact/Mister Cash and Proton terminals per ZIP code. We still hope to find a way to separate these two types.

- 9 -
Besides the explanatory variables, Table 4 also outlines the predicted variables, i.e. the differenttypes of payment cards and the resistance to a cashless society. Concerning the latter variable, wealready mentioned that 67% of the respondents indicated that even in an environment whereliterally all payments could be settled electronically, they would still continue to use (some) cash.Concerning the former, the debit card is not only the best known (98%), but also the paymentinstrument with the highest penetration (89%) and use (86%) payment among our sample. Creditcards are also relatively well known (86%), but – in line with the statistics presented in Section 2 -their degree of penetration in terms of ownership (33%) and use (29%) is much lower. Still, creditcards are more popular than retailer cards, which appear to be known by 63% 12 of our sample, butowned and used by only some 15%. Finally, the reader will note that only 45% of the respondentsindicated that they owned a Proton e-purse, whereas Table 1 shows that at end-2003 there were 8.8million cards with a Proton application in circulation, corresponding to a theoretical penetration rateof some 85% of the Belgian population. In other words, e-purse ownership appears to be severelyunderestimated. Interestingly, a similar phenomenon has arisen in just about every survey on e-purses that we are aware of. In a survey conducted in Luxembourg in early 2001, 48% ofrespondents stated that they possessed a miniCASH e-purse (Colson and Havé, 2002, p. 11),whereas the (theoretical) penetration rate at that time was roughly 70%. In the 'payment cardsurvey' commissioned by the Austrian central bank and conducted in the fourth quarter of 2001,ownership of the Quick e-purse was estimated to be 22%, whereas the actual figure was probablymore than three times as high (Mooslechner et al., 2002, p. 96 and 98). The recent surveyconducted by the Dutch central bank also suffers from the same problem (DNB, 2005; Jonker,2005). The DNB points out that "in reality, the share of prepaid card owners in the Dutchpopulation is about 2/3" (o.c., p. 56). Yet, only 55% of the respondents attested to having one.Both the Austrian and Dutch central bank think that the explanation lies in a lack of awareness; cf."many consumers are unaware that their debit card can double as a prepaid card" (ibidem).However, in our survey, there is reason to assume that even consumers who were aware of thehybrid nature of their payment card may have answered 'no' when asked whether they owned aProton e-purse. Indeed, in this specific case the concepts of 'ownership' and 'adoption' are vague.As explained in Section 2, Belgian banks have typically provided all their debit card holders with acard that also contains the Proton e-purse application. However, the latter application is onlyactivated when the card is loaded a first time. It is also only upon activation that the annual fee (ofup to 5 euro) for the use of Proton becomes due. To complicate matters further, some banks do notcharge this annual fee for specific consumer segments. Also, many Belgians have a so-calledpackage account that bundles current account management with the use of one or more payment
The number of ATMs, for its part, only refers to the ATMs that are operated by Banksys and are open to all holders of adebit card. It does not include the so-called ‘private’ ATMs, self-service terminals owned by an individual bank thatare typically located in the lobby of bank branches and can only be used by customers of that bank.12 We suspect that a substantial part of the respondents who indicated that they had heard of a retailer card in fact mighthave confused a retailer card that can be used for payments at the POS with a simple loyalty card issued by retailers.

- 10 -
cards. As a result, a consumer who knew that her debit card carried a Proton e-purse maynevertheless have denied 'owning' one because she had never activated it (and had thus never paidfor it). At the same time, the holder of a package account may have answered 'yes' even though hetoo had never loaded his e-purse, simply because he knew that the e-purse application resided on hiscard and could be activated at any moment at no additional cost to him. The bottom line is that ourresults concerning e-purse ownership should be interpreted with caution. With hindsight, we shouldperhaps have asked respondents whether they had activated their Proton e-purse.
4. Results of logit analyses
In order to analyse several models composed of the explanatory and predicted variables mentionedin the previous Section (see also Table 4), we performed binary logit as well as ordinal logitregression analyses using the statistical package SPSS13. More specifically, when assessing whichvariables determine whether respondents know, possess and use a specific payment card, andwhether they are ‘afraid’ of the cashless society, we made use of binary logit regression analyses.When assessing which variables determine the intensity of use (i.e. “type of user”), we made use ofordinal logit regression analyses.
To prepare our logit analyses, we first calculated the correlations among all explanatory variables aswell as the correlations between the explanatory and predicted variables. Whereas a highcorrelation is desired in the latter case, this is not desirable in the former as it is an indication ofmulticollinearity. For our data-set, it turned out that some supply-side variables demonstratedmulticollinearity: the number of POS terminals and ATMs were highly related to each other as wellas to the number of ATMs/km2 and the number of ATMs/inhabitants. As these variables are basedon comparable measures (and were constructed as alternatives), a high correlation is only logical.We obviously avoided using them together in a single model. Furthermore, we also did notincorporate explanatory variables having a non-significant correlation with the predicted variables.In a second step, we performed a logit analysis for the remaining explanatory variables.Accordingly, we only used the significant ones to build the general models. To do so, we startedwith continuous explanatory variables followed by the ordinal and dummy ones. During thisprocess, explanatory variables which became insignificant were eliminated from the model.Eventually, we obtained a model with a good fit (i.e., a significant chi square) and which onlyretained explanatory variables that have a significant effect on the predicted variable.
Tables 5 to Table 9 display the regression models for each predicted variable. For each variable wepresent two alternative models: a model I where we introduce the technologies separately, and amodel II where we use our index of ‘technology fear’. For all binary logit regression models (seeabove), we report the estimates and the standard errors of each explanatory variable as well as the

- 11 -
marginal effects. The latter coefficients are easier to interpret than the usual logit parameters (i.e.,estimates) as they indicate the change of probabilities in percentage points upon a change of theexplanatory variables by one unit. For the ordinal logit regression model (i.e., “type of user”),however, it is not necessary to calculate marginal effects as the estimates are easy to interpret.Moreover, it even appears unadvisable to calculate marginal effects for ordinal logit regressionmodels as they complicate model-understanding (see e.g. Boes and Winkelmann, 2005).
In the following subsections, the results of the logit analyses are presented. First, we outline theresults for each type payment card, followed by an alternative look at the same results. Finally, wedescribe the logit models explaining the fear for a cashless society and as well as a number ofadditional results that are not displayed in the Tables, i.e. the influence of the (perceived) cost of thepayment instruments.
4.1. Debit cards (see Table 5)
Concerning the socio-demographic variables, it appears that age has a negative influence inpractically all logit models: older persons have heard less of the debit card, and they possess and useit less. If they use a debit card, they are a less intensive user. Sex, education and household sizeonly have an influence on the use and intensity of use of the debit card: women, higher educatedpersons and persons living in larger families are more prone to use debit cards and to use them moreintensively. Finally, employment mainly has an influence on the intensity of debit card use:students use it significantly less intensively compared to the other categories. It also has aninfluence on the possession of a debit card, but only in model I.
Income mainly has an influence on the (intensity of) use of a debit card, although it also influencesthe possession of a debit card in model II. In general, persons with a high income use debit cardsmore and also more intensively. An interesting finding here is that the result for respondents whorefused to answer the income-question is similar to that for respondents with a higher income. Thismight indicate that higher income persons were more inclined to refuse to answer the income-question.
With regard to technology, it appears from model I that use of a mobile phone and the internet has apositive impact on the possession of a debit card. Furthermore, use of a debit card and its intensityof use are also influenced by the use of a mobile phone. Congruent with these results, model IIshows that the technology index also has a major influence on the possession of a debit card, on itsuse and its intensity of use: persons showing a lower propensity to adopt new technologies are lesslikely to own and use a debit card. When they do use one, they are less frequent users.

- 12 -
Of all the supply-side variables used in our study, only two turned out to be influential. For one, theregion where the respondent lives has an effect on debit card awareness: consumers living inFlanders have heard significantly less of the Bancontact/Mister Cash card. Furthermore, thenumber of ATMs/inhabitants in the commune where the respondent lives has a negative effect onthe possession and use of a debit card: a larger number of ATMs/inhabitants corresponds with lowerdebit card ownership and use. The explanation might be that since most Banksys ATMs areintegrated in the outside wall of a bank branch, the variable in a way also captures the availability ofhuman tellers.
4.2. Credit cards (see Table 6)
As for the socio-demographic variables, only language and education have an influence on theawareness of credit cards: Dutch speaking persons have heard significantly less of credit cards aswell as less educated persons. Education has an significant negative effect on credit cardownership, use and intensity of use. Finally, employment also has an effect: ownership and use of acredit card as well as a high intensity of credit card use is most common among managers and theself-employed and – rather surprisingly – also among retired persons.
Income has an influence on all predicted aspects of a credit card: in general, a higher income iscorrelated with a higher awareness of credit cards, credit card ownership, credit card use as well asintensity of use.
Overall, our technology variables appear to have no effect on whether respondents have heard ofcredit cards. However, use of the internet as well as our index for ‘technology fear’ do have aninfluence on credit card ownership, use and intensity of use: all these metrics are higher for internet-users and lower for persons showing a lower propensity to adopt new technologies. Finally, use ofa personal computer and a PDA has a positive influence on the intensity of credit card use.
Again, most supply-side variables turned out to have no significant impact. Only the number ofATMs/inhabitants in the commune where the respondent lives has a negative influence on whetherthe respondent has heard of a credit card.
4.3. Electronic purses (see Table 7)
With regard to the socio-demographic variables, only age has an impact on all predicted aspects ofthe e-purse: older persons are significantly less aware of the existence of the e-purse. They alsopossess it less, use it less and if they used, they are less intensive users. Education mainly has animpact on e-purse use and its intensity of use, although it also has an influence on e-purse

- 13 -
ownership in model I. In general, a higher level of education is related to a higher and a moreintense use of the e-purse.
Income has no impact on any of the predicted aspects of the e-purse, but our technology variableshave: persons showing resistance to new technologies are less likely to own an e-purse; they are lesslikely to use it and typically use it less intensively. Also, use of a personal computer has a positiveinfluence on e-purse awareness, while use of banking services via mobile phone has a positiveinfluence on e-purse ownership and use.
Finally, concerning the supply-side variables, the province where the respondent lives has an effecton e-purse ownership: when compared to persons living in Hainaut, persons living in FlemishBrabant, Antwerp and Limburg more often own an e-purse. Finally, the number of ATMs/km2 ofthe commune where the respondent lives shows a negative influence on e-purse ownership and use.
4.4. Retailer cards (see Table 8)
For the socio-demographic variables, sex mainly has an influence on the use of retailer cards and onits intensity of use: women use retailer cards more and more intensively. Education has a positiveinfluence both on the awareness of retailer cards and on the intensity of use. Employment andhousehold size have an impact on retailer card ownership, use and intensity of use: whereas ourresults for employment are not very clear-cut, it appears that a one person-family is more prone toown and use a retailer card as well as to use it more intensively.
Income only has a positive influence on the intensity of retailer card use, whereas technology has noinfluence on any of the predicted aspect of retailer cards.
Finally, unlike for other payment cards, several supply-side variables prove to have a significantinfluence. The province where the respondent lives has an influence on awareness, ownership andintensity of use: consumers living in the provinces situated in the Dutch speaking part of Belgiumare in general less aware of the existence of retailer cards; they are also less likely to own and useone. Furthermore, the number of ATMs/inhabitants of the commune where the respondent lives hasa negative influence on awareness. Finally, the number of ATMs/km2 of the commune where therespondent lives has a negative impact on the intensity of retailer card use.

- 14 -
4.5. An alternative look at our results: Know, Possess, Use and Type of user
In the previous subsection, we presented our results payment instrument per payment instrument.In this heading, we interpret the same results but with a focus on the ‘levels’ in our analysis:awareness, adoption, use, and intensity of use:
Know: it is difficult to say which of the four categories of our explanatory variables has a majorinfluence on awareness. The results vary from one payment instrument to another;
Possess: ownership of a payment card appears to be mainly determined by employment andincome. Our technology index also has a large impact, whereas the impact of separate technologiesis less clear-cut. The influence of supply-side variables varies;
Use: use appears to be mainly determined by education and to a lesser degree by sex andemployment. Income also has an important influence. Again, the technology index has animportant effect, whereas the impact of the separate technologies is again less clear-cut. Finally, theimpact of the supply-side variables varies;
Type of user: the intensity of use of a payment instrument appears to be mainly determined byeducation, employment and income and to a lesser degree by age. For technology, the technologyindex again has a major influence on the intensity of use, and to a certain extent also the use of amobile phone. Finally, for the supply side variables, again little can offered in terms of generalremarks.
4.6. Resistance to the a cashless society and the cost of payment instruments
Table 9 displays the variables that best explain the resistance to a cashless society. Of the socio-demographic variables, only employment has an influence: particularly the self-employed are moreresistant to the cashless society. Income appears to have no impact, while technology does: personsusing a mobile phone are less resistant to a cashless society, while persons who have a resistance tonew technologies are also more likely to cling to good old cash. Finally, of the supply-sidevariables, only the number of ATMs/km2 of the commune where the respondent lives shows anegative influence, meaning that persons who live in a commune with a greater availability ofATMs have a lower resistance to a cashless society.
To end the overview of our results, we also briefly mention a number of results concerning the(perceived) cost of a payment instrument. As mentioned in section 3, in our survey respondentswere asked to score payment instruments on different criteria by means of Likert scales. All

- 15 -
respondents had to do this for cash plus for one additional payment instrument, excluding retailercards (based on quota). As a result, we only have values for the perceived cost of debit cards, creditcards and e-purses for roughly one third of our sample. Hence, we could not incorporate theseexplanatory variables in the above logit analyses for the total sample. The results are neverthelessof interest.
In general, the cost of cash has little influence. Only for the possession and use of a credit cardthere is an impact: persons who consider cash as expensive are less inclined to own and use a creditcard. For debit and credit cards, we found no significant impact at all of their (perceived) cost.However, the cost of the e-purse has an influence on its possession and use: persons who consideran e-purse as expensive are significantly less prone to own and use it. Intensity of use though,seems not to be influenced by the cost of an e-purse. This makes sense because, as is explained inSection 3, there is only a fixed cost: an annual fee of up to 5 euro.
5. Comparison of results
This Section compares our results with those of earlier studies. In an attempt to do this in asystematic way, we have summarised both our results and those of other authors in three tables; oneper payment instrument, see Tables 10, 11, and 12. In the Tables, explanatory variables are listed inthe columns, subdivided in the four categories that have also been used in previous Sections.Horizontally, a distinction is made between ownership, use, and frequency of use of the respectivepayment instrument. Within each 'level', studies are listed chronologically (based on the year of thesurvey, as opposed to the year of publication of the paper). For each study, the first columnindicates in a condensed manner the dependent variable (e.g., "owner (y/n)"), as well as the countryand year of the survey (e.g., "AT, 2001" - for Austria, 2001). For the U.S., it is also indicatedwhich of the studies make use of SCF data. This highlights that a number of studies use the samedata set. The 1998 SCF data are even analysed in three distinct studies (Stavins, 2001; Hayashi andKlee, 2003; Klee, 2005). As will be shown below, some of the outcomes are neverthelessdifferent 13. The final column of our Tables gives the reference.
A number of caveats are in order concerning the Tables. First, the list of explanatory variables isnot necessarily comprehensive. That is, the authors may have included additional variables in theirregressions 14. The tables only list those variables for which our regressions provide a point ofcomparison. Second, the studies are not always fully comparable. For example, the methods used 13 Conversely, Klee (2005) is the only one to analyse adoption patterns through time. To that end, she uses data fromthe 1995, 1998 and 2001 waves of the SCF. She finds that "while the income and demographic characteristics that arecorrelated with use and holdings differs according to payment instrument, the characteristics that are correlated witheach payment instrument are remarkably consistent over time, for a wide range of payment instruments" (o.c., p. 9).14 For example, Klee (2005) also includes the number of years the head of family worked for his or her currentemployer.

- 16 -
may differ. Most of the studies listed make use of either logit or probit analysis, but there areexceptions. Some rely on univariate correlations (HBD, 2002), some early studies even simplypresent descriptive results (Avery et al., 1986; Virén, 1994). The unit of observation may alsodiffer. For example, the unit of observation in the American SCF is the household, in our survey itis the respondent. As a result, in the U.S. studies that rely on SCF data, 'sex' and 'age' refer tocharacteristics of the head of the household 15. The analysis by Borzekowski and Kiser (2004) iseven situated on the level of states in the U.S., so that their results should be interpreted as, forexample, 'states with a higher share of Internet users show a higher frequency of use of debit cards'(see Table 10).
A third caveat is that a given concept, such as 'occupational status', may have been operationaliseddifferently. In order to avoid ending up with completely unwieldy tables, such divergentoperational variables have in several cases nevertheless been placed in the same column, at the costof lower comparability. For example, the column that we have labeled 'employment' regroupsresults obtained for dummies on whether the respondent (or head of family) is self-employed, aswell as results obtained for dummies that simply capture whether the respondent has a job or not.In the tables this is indicated in small print below the plus and minus signs. Other columns forwhich this approach was followed are 'technology' (where different studies test differentinnovations), and 'urban' (major city or not, rural/non-rural). Finally, the small print below the plusand minus signs is also used to clarify what the baseline is for the variable. For example, in thecolumn labeled 'sex', a minus sign always indicates that women are less likely to adopt or use, butfor the sake of clarity this is always repeated explicitly.
5.1. Debit cards
Starting our comparison with debit cards (in Table 10), it can first of all be noted that sex apparentlyhas no significant impact on ownership. On this point our results for Belgium are in line with thosefor Austria and the Netherlands. However, the results concerning the link between sex and debitcard use differ across countries. All U.S. studies find no impact, whereas Jonker (2005) for theNetherlands and the present paper for Belgium find that women have a higher probability of being a(frequent) user of debit cards 16. Interestingly, in an older study for the Netherlands - which doesnot consider payment cards - Mot and Cramer (1992) notice that the strong univariate finding thatwomen pay more in cash largely disappears in their multivariate analysis in which they control forthe size and nature of the payment as well as the place of purchase. Mot and Cramer (o.c., p. 496)point out that women typically pay smaller amounts, pay more often in shops and have less full-
15 Also, Hayashi and Klee (2003, p. 180, note 15) point out that if a household in the SCF has both a male and a female,it is coded as a male headed household.16 Virén (1994) finds the opposite, but this is an older study. It also relies on univariate correlations.

- 17 -
time jobs than men. These are all factors that encourage the use of cash, according to their logitanalysis. Their conclusion is therefore that "it would seem that the influence of gender reflects theinfluence of the division of labour within households, in which women bear a smaller share of thepaid and a larger share of the unpaid work, such as shopping" (ibidem) 17.
Turning to age, it is striking that all U.S. studies find a significant negative impact, as do we forBelgium (except in one of the two models for ownership). For Austria, Mooslechner et al. (2002)also find a negative relationship between age and debit card ownership. This contrasts with theresults for Finland and particularly the Netherlands. Jonker (2005, p. 12) points out that "age doesnot seem to play a role in choosing the debit card to pay with. In contrast to e-purses, debit cardshave come into general use across all age groups". It is tempting to link the difference in resultsbetween the U.S., Belgium, and Austria on the one hand and Finland and the Netherlands on theother to differences in 'maturity' of the payment product. Indeed, debit cards are a relatively newphenomenon in the U.S. In Belgium, debit cards have been around for quite some time, but - asnoted in Section 2 - their frequency of use is by no means exceptional in an internationalperspective, with 53.5 transactions per capita per year (see Table 3). This holds a fortiori forAustria, with a frequency of 19.5. This compares with figures of 71.2 for the Netherlands (seeTable 3) and 79.6 for Finland 18. The fact that in our regressions for Belgium the marginal effect ofage is low can also be framed in this product life-cycle perspective.
At the level of debit card ownership, we find no significant impact of education, as does an earlierstudy for the Netherlands (HBD, 2002). Mooslechner et al. (2002), on the other hand, find asignificant positive impact. At the levels of use and frequent use, the impact of education isstraightforward: a high school or college degree increases the probability. There is only one studythat finds no impact, namely Hayashi and Klee (2003). However, it has to be stressed that for thispart of their study Hayashi and Klee do not use SCF data but a different sample of U.S. consumers"drawn primarily from users of the Internet" (o.c., p. 176) 19. They also explicitly control for thepropensity to adopt new technologies. It is interesting to note that in our regressions, thesignificance of the education variable drops when our index for 'technology fear' is included (inmodel II). The same is true in our regressions for e-purses (see Table 12). At the level ofownership, the variable is even no longer significant. This may be due to the fact that thetechnology index as a continuous variable interferes with education as an ordinal variable. The
17 Af first sight, this explanation seems to clash with Jonker's finding that women have a lower probability of being afrequent e-purse user (see Table 12). However, the latter result may be due to the specific nature of Chipknip usage(see Section 1), with a predominance of payments for parking and in cafeterias of companies.18 All figures relate to 2003. The figures for Austria and Finland are not included in Table 3 and were calculated basedon data taken from the ECB 'Blue Book', August 2005.19 Tellingly, about 70 per cent of the respondents in the sample used the Internet to purchase goods, while the nationalaverage at that time was only 19 per cent (o.c., p. 178).
- 18 -
former may also incorporate the latter as it is likely that higher educated persons have a lowerresistance to new technologies.
In U.S. studies, household size - when included - has no impact on debit card use. We find forBelgium that the larger the household, the higher the probability that the respondent is a frequentuser. Our results concerning the distinction between users and non-users are less clear-cut:households with 2 or 3 persons are more likely to be debit cards users than singles, but above thatlevel the relationship breaks down. Concerning occupational status, Mooslechner et al. (2002) forAustria and Stavins (2001) for the U.S. find that having a job increases the probability of having,c.q. using a debit card. Klee (2005) finds that the self-employed in the U.S. are less likely to use adebit card. Our results for Belgium are less clear-cut: we find a positive correlation between havinga job and owning a debit card in one of our models, but we find no significant impact on theprobability of using the card, and hard-to-interpret results at the level of user types. However, inline with Jonker (2005) for the Netherlands we find that students are less likely to be frequent debitcard users.
There is some variance in the results for income. At the level of ownership, Mooslechner etal. (2002) find no effect, as do we in one of our models. At the level of use as well as the level offrequent use, the majority of the studies, including ours, find a significant positive impact. Thereare, however, exceptions: Kennickell and Kwast (1997) and Stavins (2001) find no effect,Borzekowski and Kiser (2004) even find a negative effect. This diversity is all the more remarkablesince, as pointed out at the beginning of this Section, some of the U.S. studies use the same data set.For one, Kennickell and Kwast (1997) and Klee (2005) both use 1995 SCF data (and rely on probitanalysis). At first sight, the absence of a significant impact of income in the first study might bedue to the fact that Kennickell and Kwast use a 1 per cent level of statistical significance. However,they stress that "none of the reported insignificant variables would be reclassified even if thesignificance level were increased to 10 percent" (o.c., p. 12, note 20). The difference in resultsmight be due to a different set of explanatory variables. Specifically, Klee has a dummy for self-employed that is not present in the first study. Turning to the studies that use the 1998 SCF data,Stavins (2001) finds no significant impact of income, while Hayashi and Klee (2003) and Klee(2005) do. However, an important difference is that Stavins simply uses the respondent's annualhousehold income, while Hayashi and Klee split up the observations into 5 categories, and Kleeuses the log of family income. Finally, Borzekowski and Kiser (2004) argue that the "negativealthough not highly significant variable on per-capita income is consistent with higher-incomeconsumers having more payment options, and, in particular, better access to credit" (o.c., p. 17).However, as pointed out earlier, their results should not be interpreted on an individual level. Byusing the per-capita income at the state level, Borzekowski and Kiser in fact simply make adistinction between richer and poorer states.

- 19 -
Turning to technology, our results for Belgium confirm Hayashi and Klee's (2003) earlier findingfor the U.S. that a consumer's use of new technologies is a significant predictor of electronicpayment use. The results of Borzekowski and Kiser go in the same direction but, again, have to beinterpreted on the level of states. Finally, where the supply-side factors are concerned, it is strikingthat - unlike Stavins (2001) and Hayashi and Klee (2003) for the U.S., and Jonker (2005) for theNetherlands - none of our regressions indicate an impact of location (as measured by the provinceof residence). We do, however, find a significant impact of the availability of ATMs (see Section4).
5.2. Credit cards
Table 11 tries to summarise the existing empirical evidence on credit card ownership, c.q. use.Starting again with sex, somewhat to our surprise, we find no significant impact in any or ourregressions on any of the levels. Apart from Belgium, the general picture is that in the U.S. - atleast in recent years - sex has no impact on either ownership or use of a credit card; see Stavins(2001) and Klee (2005). Outside of the U.S., studies typically find that women have a lowerprobability of owning/using/frequently using a credit card; see Mooslechner et al. (2002) forAustria/Virén (1994) for Finland/Jonker (2005) for the Netherlands.
Where the impact of age is concerned, it is again useful to make a distinction between the U.S. andother (i.e., European) countries. For the U.S., at the level of ownership, the earlier studies eitherfind no clear-cut results or a positive link, with families with heads in the 55-64 and 65-74categories having a higher probability of owning a credit card. In later years, this link is no longersignificant; see the results obtained by Klee (2005) for 1998 and 2001. Where credit card use isconcerned, Stavins (2001) finds a significant positive impact with 1998 data. For Europeancountries, the results vary. Mooslechner et al. (2002) and Jonker (2005) find negative impact - forownership in Austria and frequent use in the Netherlands, respectively. We find no significantimpact at all, just like Virén (1994) for credit card use in Finland.
Turning to education, the results are even more straightforward than in the case of debit cards: thevast majority of studies find a positive impact. The exception is Jonker (2005) for the Netherlands.Jonker finds no significant link between an individual's level of education and whether that personis a frequent credit card user or not.
When included, U.S. studies find that household size has a negative impact on both credit cardownership and use. We find no such effects for Belgium. Predictably, most studies find that beingpart of the labour force is positively linked with owning and using a credit card. However, at thelevel of frequent use, Jonker (2005) finds no such link for the Netherlands. Our results are again

- 20 -
difficult to summarise because we have several categories (as opposed to a simple dummy variable)and also because 'student' is the reference (rather than 'unemployed'). However, overall we do findthat occupational status has a significant impact. One level down, managers and the self-employedare the categories that are most likely to be heavy users of credit cards.
As noted above, the majority of the studies find a significant positive impact of income on(frequent) use of debit cards. There were, however, exceptions. For credit cards, there appears tobe little doubt: there is a positive impact, no matter how measured, no matter what country and nomatter what level, including ownership.
Finally, we again find a clear link between a consumer's use of new technologies and her use ofpayment cards. The results for the supply-side are also similar. The only differences are theadditional evidence provided by Duca and Whitesell (1995) and Avery at al. (1986), and the factthat Jonker (2005) now does not find that the type of village, c.q. city has a significant impact.
5.2. Electronic purses
As becomes evident from Table 12, the body of empirical evidence on e-purses is still limited.However, the available studies by and large appear to go in the same direction: no significant resultfor sex, occupational status or income, a positive impact of the level of education, and a negativeimpact of age. However, the results obtained by Jonker (2005) are different on a number of points.Jonker's result for age is less dissimilar than the question mark in the table might indicate: she doesfind, for example, that people in the 25-34 age bracket are more often a frequent e-purse user thanthe elderly (the reference group). However, the question mark is there because for people in theyoungest age group (15-24) she finds a negative (albeit not significant) coefficient. Jonker's resultsregarding sex and income are more dissimilar: she finds that men and people in the higher incomecategories are relatively intensive e-purse users. Perhaps this is related with the type of paymentsfor which the Chipknip is predominantly used (see above).
6. Conclusions
A first important observation is that our results are robust, in three respects. For one, exceptperhaps in one case, all variables have the expected sign. Secondly, whether new technologies areconsidered separately (model I) or condensed in a technology index (model II) does not in the vastmajority of cases affect the significance of the other variables 20. Thirdly, our results are alsoconsistent when analysed per type of payment instrument. For credit cards, the same factors
20 There are only two exceptions: on the level of e-purse ownership the impact of education disappears in model II, andage and income have a significant impact on debit card ownership in model II, but not in model I.

- 21 -
(education, occupational status, income and propensity to adopt new technologies) prove to beimportant at the level of ownership, use as well as intensity of use. This is also true for e-purses,albeit with a different set of explanatory variables: age, education, and technology adoption provesignificant on all three levels. Interestingly, for debit cards, we find the same set of variables foruse and intensity of use (sex, age, education, income, and technology adoption), but thedeterminants of ownership are different (sex and education disappear altogether, age and income areonly significant in one of the two models, and occupational status now plays a role, as does theavailability of ATMs). It is tempting to link this with the fact that in Belgium debit cards are farmore pervasive than credit cards and (activated) e-purses.
If one looks at our results per explanatory variable, a first finding is that sex is not a significantfactor in any of our regressions for credit cards or e-purses, and also not at the level of awarenessand ownership in the case of debit cards. However, women are more likely to be (frequent) users ofdebit cards. As pointed out in Section 5, this might reflect that women do a larger share of theshopping 21. As expected, age has a negative impact in all our regressions for the e-purse (even atthe level of awareness) and in most of our regressions for the debit card (not for awareness, and notin model I for ownership). On the other hand, somewhat surprisingly, we find no significant impactof age in our regressions for credit cards. Our results for education appear plausible. For the debitcard or the e-purse, we mostly find no significant impact at the two ‘lowest’ levels of our analysis(awareness and ownership 22); for the two ‘higher’ levels we find the expected positive impact. Thelatter is also true for all four levels in our credit card regressions. Unsurprisingly, occupationalstatus matters for credit card ownership (as well as use and intensity of use). Our regressionsindicate that it also matters for debit card ownership, but not for debit card use, nor at any of thelevels in our e-purse regressions. Interestingly, the type of profession proves to be an importantdeterminant of the degree of resistance against the cashless society, with the self-employed showingthe highest preference for cash. There are also some less significant results for other categories.Where the self-employed are concerned, our finding probably reflects the fact that they still receiverelatively large amounts of cash. Related to this, their fear for the cashless society might also belinked to tax evasion behaviour.
Moving from socio-demographic to financial characteristics, income always has the expected signbut its impact differs – in a logical way - across payment instruments. For credit cards, incomeproves important at almost all levels (even in one of the models for awareness). Income is alreadysomewhat less important for debit cards, in the sense that awareness is not influenced, and
21 This raises the question why this does not also appear in our regressions for the e-purse. However, debit cards ande-purse are used in different places (for example, supermarkets vs. newspaper shops or bakeries), and thus for differenttypes of goods. Perhaps the work division between men and women is less marked for the type of payments for whiche-purses can be used.22 Education has a significant impact on ownership in one of the two models for the e-purse.

- 22 -
ownership only in one of our two models. Finally, income has no significant impact in any of ourregressions for the e-purse. The logic behind these results might be that the lower the average valueof a typical payment for a payment instrument, the less important income becomes as a determinantof payment behaviour.
As already pointed out, whether new technologies are considered separately or together in an indexdoes usually not affect the significance of the other variables. Also, in our regressions, if anindividual technology gives a significant result in model I, so will the index in model II. Strongerstill, we find significant effects in literally all our regressions, except – and this is in itself alsointeresting – for retailer cards. However, in model I the type of technology that gives significantresults differs from one payment instrument to another. Perhaps we are reading too much into ourresults, but there seems to be a pattern in this. If one accepts that in Belgium today the e-purse isthe most ‘innovative’ payment technology, followed by credit cards and then debit cards 23, and ifone uses the degree of penetration of the other technologies as reported in Table 4 to rank them indescending order of innovativeness (PDA, mobile banking, internet, PC, mobile phone), then it isstriking that mobile phone use gives a significant result for the debit card, Internet use for creditcards, and mobile banking for the e-purse. In other words, given that 89 per cent of our sampleowns a debit card, and 81 per cent uses a mobile phone, it is tempting to conclude that the non-adopters and non-users of debit cards are a ‘hard core’ of consumers who either have no access to,are unable to handle or outright refuse to adopt just about any technological innovation. In the sameline of reasoning, given that only 31 per cent of our sample uses an e-purse, it is not surprising thatone needs a more innovative technology to separate the users from the majority of non-users. Thefact that it is again the mobile phone that separates those who ‘fear’ the cashless society (33.2 percent of our sample) from those who do not (66.8 per cent), also fits in this hypothesis.
Our results concerning the supply-side factors are so far somewhat disappointing: we basically onlyfind significant results for the availability of Banksys ATMs in the municipality where therespondent lives (either measured per km2 or per 1,000 inhabitants). For debit cards, we find thatthe higher this number of ATMs, the lower the probability that the respondent has a debit card. Theexplanation might be that since most Banksys ATMs are integrated in the outside wall of a bankbranch, the variable in a way also captures the availability of human tellers. The fact that theavailability of ATMs has no significant impact on debit card use (for payments, not for withdrawingcash) seems only normal. If anything, one would expect an impact of the number of POS terminalshere. For credit cards, the availability of ATMs has no effect on either adoption or usage – which isagain only logical. It does, however, have an impact on consumers’ awareness of credit cards.Again the explanation might be that the variable captures the presence of banks more than anythingelse. Interestingly, for the e-purse, the number of ATMs does have an impact – and a negative one 23 The argument here is that in Belgium it has taken credit cards longer to enter mainstream use.

- 23 -
– on both ownership and use. For this variable we had no a priori expectations concerning its signsince an ATM can be used both to load a Proton card and withdraw cash. The negative sign seemsto indicate that the availability of cash dominates. Finally, we also find that the higher the numberof Banksys ATMs, the lower the resistance against the cashless society. We have as yet no goodexplanation for this finding.
Instead of looking at our results per explanatory variable, as we have just done, it is also interestingto analyse them per ‘level’. From this angle, it is interesting to repeat that for credit cards and thee-purse the set of factors that yield significant results - although different between the two paymentinstruments – is identical across the levels of ownership, use as well as intensity of use. In bothcases, the factors that determine awareness are different from those at higher levels. For the debitcard, we only find the same set of variables for use and intensity of use, not for ownership (norawareness). If one focuses on the level of awareness, it is interesting that age plays a role for thedebit card and the e-purse, but not for credit cards. Conversely, education, income and even supply-side factors matter for credit card awareness, but not for the debit card and the e-purse. PC usersare also more aware of Proton than others.
Finally, if one compares our results with the existing literature, one can say that our results for thedemographic and financial characteristics are mostly in line with the ‘conventional wisdom’ on theadoption of electronic payment instruments. There are, however, a number of exceptions. Ourresults furthermore confirm Hayashi and Klee’s (2003) finding that the adoption of other newtechnologies is a significant predictor of electronic payment adoption and usage. One could evensay that our results strengthen their finding because we are the first to demonstrate it for e-purses, aswell as for the resistance against the cashless society. We also find a logical correlation betweenthe innovativeness of the payment instrument and the predictor. This said, our results for thesupply-side factors are somewhat disappointing so far, but we still hope to find ways to improvethem.

- 24 -
References
Abrazhevich, D., Designing for user acceptance of electronic payment systems: a user perspective, doctoraldissertation, Technische Universiteit Eindhoven, The Netherlands, February 2004.
Avery, R. B., Elliehausen, G. E., Kennickell, A. B. en P. A. Spindt, The use of cash and transaction accounts byAmerican families, Federal Reserve Bulletin, Vol. 72, February 1986, p. 87-108.
Boes, S. and R. Winkelmann, Ordered response models, forthcoming in Algemeines Statistisches Archiv, retrievedfrom the internet, September 28, 2005 <http://www.unizh.ch/sts/research/publications/pdf/ordered.pdf>.
Boeschoten, W. C., Currency use and payment patterns, Kluwer Academic Publishers, Dordrecht/Boston/London,1992
Boeschoten, W. C., Cash management, payment patterns and the demand for money, De Economist, Vol. 146, Nr. 1,1998, p. 117-142.
Daniels, K. N. and N. B. Murphy, The impact of technological change on household transactions account balances: anempirical cross-section study, Journal of Financial Services Research, Vol. 8, Nr. 2, April 1994, p. 113-119.
De Nederlandsche Bank, Payment products as perceived by consumers, Quarterly Bulletin, March 2005, p. 55-63.
Duca, J. V. and W. C. Whitesell, Credit cards and money demand: a cross-sectional study, Journal of Moany, Credit,and Banking, Vol. 27, Nr. 2, May 1995, p. 604-623.
Hayashi, F. and E. Klee, Technology adoption and consumer payments: evidence from survey data, Review of NetworkEconomics, Vol. 2, Nr. 2, June 2003, p. 175-190.
Jonker, N., Payment products as perceived by consumers - a public survey, mimeo, De Nederlandsche Bank, May2005.
Hoofdbedrijfschap Detailhandel (HBD), Afrekenen in winkels 2002 - Meningen, feiten en mogelijkheden totverandering, Hoofdbedrijfschap Detailhandel, The Hague, 2002.
Kennickell, A. B. and M. L. Kwast, Who uses electronic banking? Results from the 1995 Survey of ConsumerFinances, paper prepared for presentation at the Annual Meetings of the Western Economic Association, Seattle,Washington, July 1997.
Klee, E., Families’ use of payment instruments during a decade of change in the U.S. payment system, mimeo, Boardof Governors of the Federal Reserve System, February 8, 2005.
Loix, E., Pepermans, R. and L. Van Hove, De Belgische consumenten over elektronisch betalen: resultaten van eenopiniepeiling (The Belgian consumer and electronic payments: results of a cardholder survey), Bank- enFinanciewezen/Revue Bancaire et Financière, Vol. 69, Nr. 1, January 2005, p. 16-28.
Mantel, B., Why do consumers pay bills electronically? An empirical analysis, Economic Perspectives, FederalReserve Bank of Chicago, Fourth Quarter, 2000, p. 30-45.
Mantel, B. and T. McHugh, Competition and innovation in the consumer e-payments market? Considering thedemand, supply, and public policy issues, Emerging Payments Occasional Working Paper Series, Nr. EPS-2001-4,Federal Reserve Bank of Chicago, December 2001.
M’Chirgui, Z., An empirical evidence of the electronic purse's adoption: the case of Moneo, paper presented at theLIIIème Congrès annuel de l'Association Française de Science Economique, Paris, September 16-17, 2004.
Mester, L. J., Changes in the use of electronic means of payment: 1995-2001, Business Review, Federal Reserve Bankof Philadelphia, Third Quarter, 2003, p. 18-20.

- 25 -
Mooslechner, P., Stix, H. and K. Wagner, The payment habits of Austrian households - Results of a study on the useof payment cards and the structure of payment transactions in 2000, Focus on Austria (Oesterreichische Nationalbank),Nr. 1, 2002, p. 89-117.
Mot, E. S. and J. S. Cramer, Mode of payment in household expenditures, De Economist, Vol. 140, Nr. 4, 1992,p. 488-500.
Paynter, J. and P. Law, Can Octopus reach out its tentacles to sustain growth? The case of smart card technology inHong Kong, Innovation: Management, Policy & Practice, Vol. 6, Nr. 3, December 2004, p 416–429.
Penz, E., Meier-Pesti, K. and E. Kirchler, It’s practical, but no more controllable: social representations of theelectronic purse in Austria, Journal of Economic Psychology, Vol. 25, Nr. 6, December 2004, p. 771-787.
Plouffe, C. R., Vandenbosch, M., and J. Hulland, Intermediating technologies and multi-group adoption: acomparison of consumer and merchant adoption intentions toward a new electronic payment system, The Journal ofProduct Innovation Management, Vol. 18, Nr. 2, March 2001, p. 65-81.
Stavins, J., Effect of consumer characteristics on the use of payment instruments, New England Economic Review(Federal Reserve Bank of Boston), Nr. 3, 2001, p. 19-31.
Truman G. E., Sandoe K. and T. Rifkin, An empirical study of smart card technology, Information & Management,Vol. 40, Nr. 6, July 2003, p. 591-606.
Van Dam, R. and K. Van den Bosch, K, Hoeveel armen zijn er in België? Resultaten van diverse studies, IUAP-IV,1997.
Van Hove, L., Electronic purses in Euroland: why do penetration and usage rates differ?, SUERF Studies, Nr. 2004/4,July 2004.
Van Hove, L., What future for electronic purses?, forthcoming in Lammer, Th. (ed.), Handbuch E-Money, E-Payment& M-Payment, Springer Verlag, 2005.
Virén, M., Demand for different payment media in Finland, Bank of Finland Bulletin, Vol. 68, Nr. 2, February 1994,p. 12-16.
Westland, Chr. J., Preference ordering cash, near cash and electronic cash, Journal of Organizational Computing andElectronic Commerce, Vol. 12, Nr. 3, 2002, p. 223-242.

- 26 -
Table 1 – Number of payment cards in circulation (at year-end, in thousands)
1995 2000 2001 2002 2003
Bancontact/Mister Cashdebit cards
6,715 8,371 9,423 9,914 10,448
Proton cards 30 8,396 8,543 8,271 8,803
Credit cards 2,271 2,746 2,809 2,805 2,838
Sources: Belgian Bankers Association, Banksys.

- 27 -
Table 2 – Non-cash payments in Belgium
1995 2000 2001 2002 2003 1995 2000 2001 2002 2003
Number of payments (in millions) Share of paymentsdebit cards 184.5 379.7 432.1 505.3 542.8 16.7 27.0 27.6 29.4 31.6
credit cards 28.5 53.8 60.8 57.1 68.7 2.6 3.8 3.9 3.3 4.0
e-purses 0.7 51.3 60.5 120.8 107.1 0.1 3.6 3.9 7.0 6.2
cheques 117.1 70.7 60.1 28.9 23.7 10.6 5.0 3.8 1.7 1.4
Value of payments (in billions of euro) Share of paymentsdebit cards 8.9 19.3 21.7 25.0 27.1 0.1 0.1 0.1 0.2 0.2
credit cards 2.2 5.5 6.6 6.1 7.3 0.0 0.0 0.0 0.0 0.1
e-purses 0.0 0.2 0.3 0.0 0.0 0.0 0.0 0.0 0.0 0.0
cheques 304.6 86.8 98.8 99.3 86.4 3.3 0.5 0.6 0.7 0.6
Sources: CPSS, ‘Red Book’, various issues, complemented with Banksys data. The latter were used to split up the CPSS debit/credit card figures for 1995.

- 28 -
Table 3 – International comparison of payment media use, 2003(number of transactions per inhabitant)
debit cards credit cards e-purses cheques
Belgium 53.2 6.6 10.3 2.3Canada 81.7 51.7 nav 45.7
France 70.6 nav 0.3 63.9
Germany 20.2 7.1 0.5 1.6Hong Kong nav nav nav 18.3
Italy 10.5 6.4 neg 8.7Japan 0.1 19.9 nav 1.3
Netherlands 71.2 2.7 6.7 neg
Singapore 25.3 nav 367 20.9Sweden 74.6 9.9 neg neg
Switzerland 33.1 11 2.6 64.6United Kingdom 56.7 43.8 nav 91.1
United States 63.4 62.9 nav 126.1
CPSS average 44.5 37.2 7.3 59.3Source: CPSS, ‘Red Book’, March 2005.

- 29 -
Table 4 – Variable definitions and summary statistics
Variable DescriptionPercentage of total
sample(n= 1,008)
Socio-demographicSex
Female Male
Equals 1 if respondent is male.Equals 2 if respondent is female.
52.647.4
Age
15-25 26-35 36-45 46-55
56-65 66+
Indicates respondent is between 15-25 years old.Indicates respondent is between 26-35 years old.Indicates respondent is between 36-45 years old.Indicates respondent is between 46-55 years old.
Indicates respondent is between 56-65 years old.Indicates respondent is over 66 years old.Note: For our analyses we have used “Age” as a continuousvariable which has a mean = 47.308 and St. Dev. = 17.802.
14.518.417.517.7
12.719.3
Language Dutch French
Indicates respondent’s mother tongue is Dutch.Indicates respondent’s mother tongue is French.
52.447.6
Education Primary school Lower secondary school Higher secondary school
Higher education – non university University degree
Indicates respondent’s highest attained education level.17.624.833.3
17.27.1
Household size
1 person 2 persons 3 persons 4 persons
5+ persons (Missing data)
Indicates respondent lives on his/her own.Indicates respondent lives in a family of 2 persons.Indicates respondent lives in a family of 3 persons.Indicates respondent lives in a family of 4 persons.
Indicates respondent lives in a family of 5 or more persons.
22.334.116.217.4
9.0(1.0)
Employment
Student Unemployed Housewife/man Retired
Blue-collar worker White-collar worker Civil servant
Management Liberal profession Self-employed Other
Indicates respondent is a student.Indicates respondent is unemployed.Indicates respondent is a housewife/man.Indicates respondent is retired.
Indicates respondent is a blue-collar worker.Indicates respondent is a white-collar worker.Indicates respondent is a civil servant.
Indicates respondent is a manager.Indicates respondent has a liberal profession.Indicates respondent is self-employed.Indicates respondent has another employment than the ones
mentioned above.
9.56.39.721.7
11.622.74.1
1.91.08.53.0

- 30 -
Table 4 – Variable definitions and summary statistics (continued)
Variable DescriptionPercentage of total
sample(n= 1,008)
FinancialMonthly income after taxes
< € 750 € 750 - € 1500 € 1500 - € 2250
€ 2250 - € 3000 > € 3000 no income refused to answer
do not know
Indicates respondent has an income below € 750.Indicates respondent has an income between € 750 and € 1500.Indicates respondent has an income between € 1500 and € 2250.
Indicates respondent has an income between € 2250 and € 3000.Indicates respondent has an income over € 3000.Indicates respondent has no income.Indicates respondent refused to answer the income question.
Indicates respondent does not know his/her income.
11.029.612.8
4.02.36.627.9
5.9
TechnologyMobile phonePersonal computerInternet
PDABanking services via mobile phone
Equals 1 if respondent uses a mobile phone.Equals 1 if respondent uses a personal computer.Equals 1 if respondent uses the internet.
Equals 1 if respondent uses a personal digital assistant.Equals 1 if respondent uses banking services via mobile phone.Note: Based on the former items we have constructed a“Technology index” (indicating the degree of resistance for newtechnologies). To do so, we have used another response format,i.e. “frequency of use” instead of the dummy format presentedhere. As such, this variable has a mean = 21.102 and St. Dev. =5.878.
81.358.450.3
6.26.9
Supply-sideRegion home Flanders
Wallonia Brussels Capital Region (Missing data)
Indicates respondent lives in Flanders.
Indicates respondent lives in Wallonia.Indicates respondent lives in Brussels Capital Region.
52.5
32.413.4(1.7)
Region work Flanders Wallonia Brussels Capital Region
(Missing data)
Indicates respondent works in Flanders.Indicates respondent works in Wallonia.Indicates respondent works in Brussels Capital Region
39.023.111.7
(26.2)Province home West-Flanders
East-Flanders Brussels Capital Region Flemish Brabant Antwerp
Limburg Walloon Brabant Namur
Liège Luxembourg Hainaut (Missing data)
Indicates respondent lives in West-Flanders.
Indicates respondent lives in East-Flanders.Indicates respondent lives in Brussels Capital Region.Indicates respondent lives in Flemish Brabant.Indicates respondent lives in Antwerp.
Indicates respondent lives in Limburg.Indicates respondent lives in Walloon Brabant.Indicates respondent lives in Namur.
Indicates respondent lives in Liège.Indicates respondent lives in Luxembourg.Indicates respondent lives in Hainaut.
14.5
8.013.46.010.1
13.90.22.1
12.52.315.4(1.7)

- 31 -
Table 4 – Variable definitions and summary statistics (continued)
Variable DescriptionPercentage of total
sample(n= 1,008)
Supply-sideProvince work
West-Flanders East-Flanders Brussels Capital Region
Flemish Brabant Antwerp Limburg Walloon Brabant
Namur Liège Luxembourg
Hainaut (Missing data)
Indicates respondent works in West-Flanders.Indicates respondent works in East-Flanders.Indicates respondent works in Brussels Capital Region.
Indicates respondent works in Flemish Brabant.Indicates respondent works in Antwerp.Indicates respondent works in Limburg.Indicates respondent works in Walloon Brabant.
Indicates respondent works in Namur.Indicates respondent works in Liège.Indicates respondent works in Luxembourg.
Indicates respondent works in Hainaut.
11.35.811.7
4.09.08.90.1
1.59.81.5
10.2(26.2)
POS home Indicates number of POS of ZIP-code where respondent lives(Mean = 402.645; St. Dev. = 480.664)
POS work Indicates number of POS of ZIP-code where respondent works(Mean = 580.451; St. Dev. = 607.664)
ATMs home Indicates number of Banksys ATMs of ZIP-code where respondent lives
(Mean = 4.181; St. Dev. = 5.539)ATMs work Indicates number of Banksys ATMs of ZIP-code where respondent works
(Mean = 6.054; St. Dev. = 7.049)Median income level home (in €) Indicates median income level of commune where respondent lives
(Mean = 11756.703; St. Dev. = 1777.961)Median income level work (in €) Indicates median income level of commune where respondent works
(Mean = 11332.478; St. Dev. = 1679.285)
Density home Number of inhabitants per km2 in commune where respondent lives(Mean = 1131.320; St. Dev. = 2798.479)
Density work Number of inhabitants per km2 in commune where respondent works(Mean = 955.137; St. Dev. = 2215.841)
Number of ATMs/km2 home Indicates number of Banksys ATMs/km2 of commune where respondent lives(Mean = 0.138; St. Dev. = 0.186)
Number of ATMs/km2 work Indicates number of Banksys ATMs/km2 of commune where respondent works
(Mean = 0.174; St. Dev. = 0.215)Number of ATMs/inhabitants home Number of Banksys ATMs per 1,000 inhabitants in commune where respondent lives
(Mean = 2.920; St. Dev. = 3.577)Number of ATMs/inhabitants work Number of Banksys ATMs per 1,000 inhabitants in commune where respondent works
(Mean = 4.661; St. Dev. = 5.623)

- 32 -
Table 4 – Variable definitions and summary statistics (continued)
Variable DescriptionPercentage of total
sample(n= 1,008)
Payment instrumentsDebit card
Know Possess Use
Type of user Non users Light users Medium users
Heavy users
Equals 1 if respondent has heard of debit card (BC/MC).Equals 1 if respondent possesses debit card.Equals 1 if respondent uses debit card.
Classifies the respondent based on intensity of debit card-use: Never At most once a month Once a week or at least once within two weeks
Daily
98.089.086.0
14.09.751.1
25.2Credit card Know
Possess Use Type of user
Non users Light users Medium users
Heavy users
Equals 1 if respondent has heard of credit card (e.g. Visa,
Mastercard, American Express, Diners).Equals 1 if respondent possesses credit card.Equals 1 if respondent uses credit card.Classifies the respondent based on intensity of credit card-use:
Never At most once a month Once a week or at least once within two weeks
Daily
86.5
33.029.4
70.618.39.9
1.2E-purse (Proton) Know Possess
Use Type of user Non users
Light users Medium users Heavy users
Equals 1 if respondent has heard of Proton.Equals 1 if respondent possesses Proton.
Equals 1 if respondent uses Proton.Classifies the respondent based on intensity of Proton-use: Never
At most once a month Once a week or at least once within two weeks Daily
88.844.6
31.4
68.8
10.412.78.3
Retailer card
Know
Possess
Use Type of user Non users Light users
Medium users Heavy users
Equals 1 if respondent heard of retailer card (e.g. Delhaize Plus,Colruyt).Equals 1 if respondent possesses retailer card.
Equals 1 if respondent uses retailer card.Classifies the respondent based on intensity of retailer card-use: Never At most once a month
Once a week or at least once within two weeks Daily
63.3
15.8
14.6
85.43.5
10.30.8
Resistance to cashless societyContinues to use cash Equals 1 if respondent continues to use cash even when he/she
could pay electronically everywhere.66.8

- 33 -
Table 5 – Logit analyses: Debit card
Variable Debit cardKnow Possess Use Type of user
Model I:Technologies separately
Estimate
(SE)
ME Estimate
(SE)
ME Estimate
(SE)
ME Estimate
(SE)
Sex
Female
Male
0.597***(0.210)
(reference)
0.069 0.394***(0.136)
(reference)Age -0.054***
(0.017)-0.001 -0.022***
(0.008)-0.003 -0.014**
(0.007)
Education Primary school
Lower secondary school
Higher secondary school
Higher educ. – non univ.
University degree
***(reference)
0.096
(0.279)0.767**(0.306)
1.286***(0.447)0.713
(0.489)
0.012
0.092
0.154
0.086
-0.889***(0.316)
-0.661**
(0.291)-0.014(0.281)
0.436(0.288)
(reference)
Employment Student
Unemployed
Housewife/man
Retired
Blue-collar worker
White-collar worker
Civil servant
Management
Liberal profession
Self-employed
Other
***(reference)
1.923***(0.634)1.194**(0.477)
0.878**(0.423)0.994**
(0.457)2.229***(0.512)1.192*
(0.684)1.067
(1.067)
0.593(1.101)1.134**(0.503)
1.593**(0.816)
0.192
0.119
0.088
0.099
0.223
0.119
0.107
0.059
0.113
0.159
-1.092**(0.461)
-0.062(0.442)-0.257(0.425)
-0.302(0.413)-0.089
(0.407)0.174
(0.387)-0.237
(0.479)-0.145(0.594)
-0.289(0.749)-0.197(0.427)
(reference)

- 34 -
Table 5 – Logit analyses: Debit card (continued)
Variable Debit cardKnow Possess Use Type of user
Model I:Technologies separately
Estimate
(SE)
ME Estimate
(SE)
ME Estimate
(SE)
ME Estimate
(SE)
Household size
1 person
2 persons
3 persons
4 persons
5+ persons
**(reference)
0.582**(0.253)
1.112***(0.433)
0.076(0.348)0.205
(0.423)
0.070
0.133
0.009
0.025
-0.449*(0.260)0.013
(0.244)0.253
(0.264)0.167
(0.259)(reference)
Monthly income after taxes < € 750
€ 750 - € 1500
€ 1500 - € 2250
€ 2250 - € 3000
> € 3000
no income
refused to answer
do not know
***0.760*
(0.432)1.724***(0.409)
1.694***
(0.478)2.029**(0.830)
0.637(0.745)0.155
(0.488)
1.528***(0.407)
(reference)
0.091
0.207
0.203
0.243
0.076
0.019
0.183
0.869***
(0.328)1.155***(0.300°
1.358***
(0.327)1.186***(0.415)
0.315(0.506)0.619*(0.373)
1.199***(0.294)
(reference)
Mobile phone(user is reference)
-0.999***(0.250)
-0.099 -0.935***(0.249)
-0.112 -0.826***(0.180)
Internet
(user is reference)
-0.890***
(0.309)
-0.089
Region work Flanders
Wallonia
Brussels Capital Region
**-1.847***
(0.670)
-1.309(0.831)
(reference)
-0.037
-0.026
Number of ATMs/inhabitantshome
-0.69***(0.026)
-0.069 -0.111***(0.025)
-0.013
Intercept 7.891***(1.219)
0.158 2.003***(0.300)
0.200 1.133*(0.614)
0.14
Pseudo R2
Likelihood ratioNo. of observations
0.028133.267
1008
0.080611.287
1008
0.143650.961
1008
0.2282056.904
1008

- 35 -
Table 5 – Logit analyses: Debit card (continued)
Variable Debit cardKnow Possess Use Type of user
Model II :Technology Index
Estimate
(SE)
ME Estimate
(SE)
ME Estimate
(SE)
ME Estimate
(SE)
Household size
1 person
2 persons
3 persons
4 persons
5+ persons
**
(reference)
0.638**
(0.250)1.156***(0.432)0.070
(0.344)0.234
(0.420)
0.077
0.139
0.008
0.028
-0.498*(0.260)-0.015
(0.244)0.211
(0.424)0.089
(0.730)(reference)
Monthly income after taxes < € 750
€ 750 - € 1500
€ 1500 - € 2250
€ 2250 - € 3000
> € 3000
no income
refused to answer
do not know
***0.948**
(0.429)1.699***(0.394)
1.941***
(0.499)1.844**(0.806)
1.807*(1.807)0.182
(0.481)
1.692***(0.400)
(reference)
0.095
0.167
0.194
0.184
0.181
0.018
0.169
***0.707*
(0.429)1.748***(0.407)
1.733***
(0.477)2.021**(0.831)
0.581(0.749)0.053
(0.484)
1.485***(0.403)
(reference)
0.085
0.210
0.208
0.243
0.070
0.006
0.178
0.877***
(0.327)1.232***(0.299)
1.373***
(0.326)1.141***(0.415)
0.206(0.507)0.613*(0.372)
1.237***(0.293)
(reference)
Technology Index -0.066***(0.025)
-0.007 -0.040*(0.025)
-0.005 -0.065***(0.015)
Number of ATMs/inhabitants
home
-0.071***
(0.026)
-0.007 -0.104***
(0.025)
-0.012
Intercept 3.633***
(0.538)
0.363 1.810**
(0.737)
0.217
Pseudo R2
Likelihood ratioNo. of observations
0.073
617.8791008
0.133
662.2031008
0.226
2103.6781008
Note: Superscripts *, ** and *** indicate that the coefficient was significantly different from zero at the 10%, 5% and 1%level, respectively.
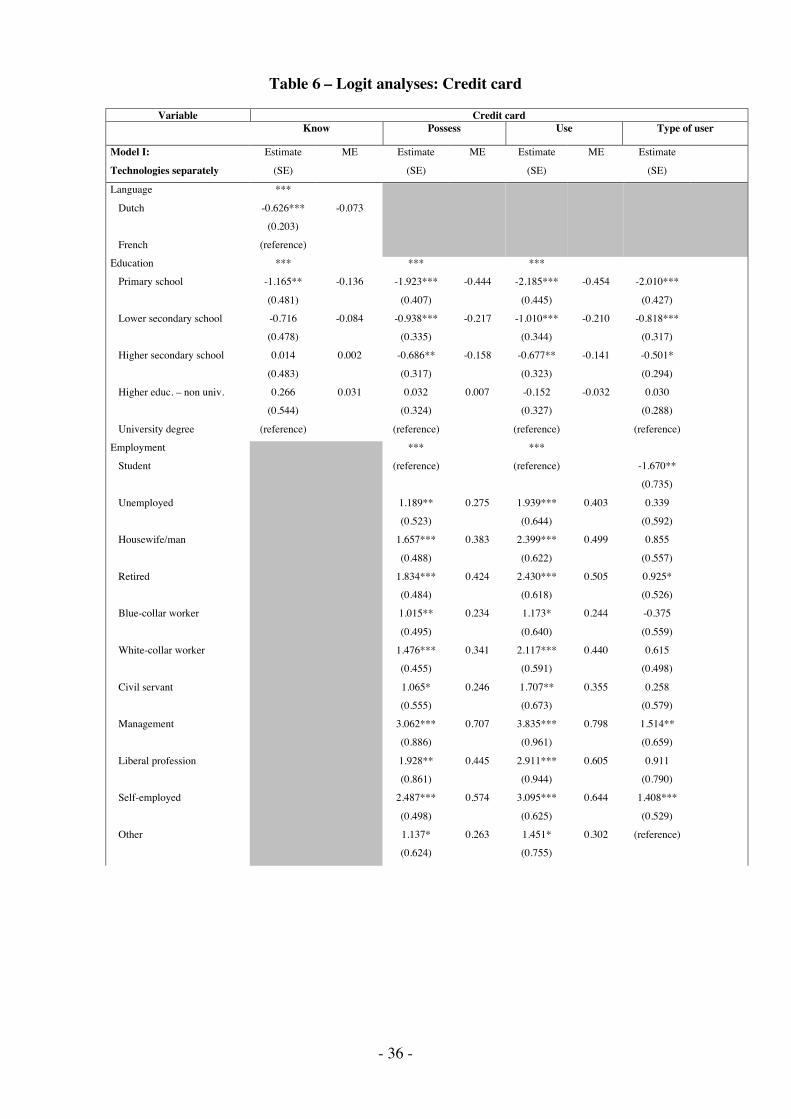
- 36 -
Table 6 – Logit analyses: Credit card
Variable Credit cardKnow Possess Use Type of user
Model I:Technologies separately
Estimate
(SE)
ME Estimate
(SE)
ME Estimate
(SE)
ME Estimate
(SE)
Language
Dutch
French
***
-0.626***(0.203)
(reference)
-0.073
Education Primary school
Lower secondary school
Higher secondary school
Higher educ. – non univ.
University degree
***-1.165**
(0.481)-0.716(0.478)0.014
(0.483)0.266
(0.544)
(reference)
-0.136
-0.084
0.002
0.031
***-1.923***
(0.407)-0.938***
(0.335)-0.686**
(0.317)0.032
(0.324)
(reference)
-0.444
-0.217
-0.158
0.007
***-2.185***
(0.445)-1.010***
(0.344)-0.677**
(0.323)-0.152(0.327)
(reference)
-0.454
-0.210
-0.141
-0.032
-2.010***
(0.427)-0.818***
(0.317)-0.501*
(0.294)0.030
(0.288)
(reference)Employment Student
Unemployed
Housewife/man
Retired
Blue-collar worker
White-collar worker
Civil servant
Management
Liberal profession
Self-employed
Other
***(reference)
1.189**(0.523)
1.657***
(0.488)1.834***(0.484)1.015**
(0.495)1.476***(0.455)
1.065*(0.555)
3.062***(0.886)
1.928**(0.861)
2.487***
(0.498)1.137*(0.624)
0.275
0.383
0.424
0.234
0.341
0.246
0.707
0.445
0.574
0.263
***(reference)
1.939***(0.644)
2.399***
(0.622)2.430***(0.618)1.173*
(0.640)2.117***(0.591)
1.707**(0.673)
3.835***(0.961)
2.911***(0.944)
3.095***
(0.625)1.451*(0.755)
0.403
0.499
0.505
0.244
0.440
0.355
0.798
0.605
0.644
0.302
-1.670**(0.735)
0.339(0.592)0.855
(0.557)0.925*(0.526)-0.375
(0.559)0.615
(0.498)
0.258(0.579)1.514**(0.659)
0.911(0.790)
1.408***
(0.529)(reference)

- 37 -
Table 6 – Logit analyses: Credit card (continued)
Variable Credit cardKnow Possess Use Type of user
Model I:Technologies separately
Estimate
(SE)
ME Estimate
(SE)
ME Estimate
(SE)
ME Estimate
(SE)
Monthly income after taxes
< € 750
€ 750 - € 1500
€ 1500 - € 2250
€ 2250 - € 3000
> € 3000
no income
refused to answer
do not know
***
0.214(0.471)0.578
(0.424)1.091**(0.546)0.796
(0.728)19.053
(8488.001)
-0.395(0.484)-0.292(0.410)
(reference)
0.025
0.068
0.128
0.093
2.229
-0.047
-0.034
***
-0.517(0.463)0.257
(0.379)0.881**(0.400)1.178**
(0.503)0.956
(0.644)
-0.017(0.546)0.205
(0.370)
(reference)
-0.119
0.059
0.204
0.272
0.221
-0.004
0.047
***
-0.196(0.511)0.654
(0.417)1.092**(0.436)
1.373***
(0.529)0.784
(0.621)
-0.144(0.662)0.539
(0.406)
(reference)
-0.042
0.136
0.227
0.286
0.163
-0.030
0.112
-0.121(0.494)0.630
(0.399)1.033**(0.413)1.167**
(0.480)1.103**(0.540)
-0.090(0.644)0.640*(0.387)
(reference)
Personal computer
(user is reference)
-0.378*
(0.281)Internet(user is reference)
-0.721***(0.186)
-0.167 -0.932***(0.195)
-0.194 -0.541**(0.262)
PDA(user is reference)
-1.395***(0.288)
Number of ATMs/inhabitantshome
-0.074***(0.024)
-0.009
Intercept 2.680***(0.603)
0.314 -1.456**(0.581)
-0.336 -2.363***(0.716)
-0.492
Pseudo R2
Likelihood ratioNo. of observations
0.074707.823
1008
0.2141035.970
1008
0.237947.477
1008
0.263685.396
1008

- 38 -
Table 6 – Logit analyses: Credit card (continued)
Variable Credit cardKnow Possess Use Type of user
Model II :Technology Index
Estimate
(SE)
ME Estimate
(SE)
ME Estimate
(SE)
ME Estimate
(SE)
Education
Primary school
Lower secondary school
Higher secondary school
Higher educ. – non univ.
University degree
***
-1.861*(0.409)-0.929*
(0.336)-0.695*(0.318)0.057
(0.326)(reference)
-0.430
-0.215
-0.161
0.013
***
-2.132*(0.447)-1.022*
(0.345)-0.701*(0.324)-0.131
(0.329)(reference)
-0.443
-0.213
-0.146
-0.027
-2.002***(0.423)
-0.896***
(0.313)-0.616**(0.289)-0.038
(0.285)(reference)
Employment Student
Unemployed
Housewife/man
Retired
Blue-collar worker
White-collar worker
Civil servant
Management
Liberal profession
Self-employed
Other
***(reference)
1.281**(0.526)
1.768***(0.493)
2.010***(0.493)1.082**
(0.498)1.569***(0.458)1.161**
(0.557)3.057***(0.887)
1.946**(0.860)
2.493***(0.499)
1.300**(0.633)
0.296
0.408
0.464
0.250
0.362
0.268
0.706
0.450
0.576
0.300
***(reference)
2.043***(0.647)
2.508***(0.626)
2.607***(0.625)1.243*
(0.642)2.223***(0.593)
1.816***
(0.674)3.841***(0.962)
2.945***(0.946)
3.089***(0.625)
1.626**(0.763)
0.425
0.522
0.542
0.259
0.462
0.378
0.799
0.613
0.643
0.338
-1.589**(0.746)
0.458(0.598)1.024*(0.566)
1.042**(0.535)-0.360
(0.570)0.596
(0.511)0.313
(0.588)1.668**(0.665)
1.288*(0.786)
1.460***(0.540)
(reference)

- 39 -
Table 6 – Logit analyses: Credit card (continued)
Variable Credit cardKnow Possess Use Type of user
Model II :Technology Index
Estimate
(SE)
ME Estimate
(SE)
ME Estimate
(SE)
ME Estimate
(SE)
Monthly income after taxes
< € 750
€ 750 - € 1500
€ 1500 - € 2250
€ 2250 - € 3000
> € 3000
no income
refused to answer
do not know
***
-0.469(0.465)0.285
(0.382)0.851**(0.401)1.084**
(0.504)0.860
(0.650)
0.040(0.549)0.251
(0.373)
(reference)
-0.108
0.066
0.197
0.250
0.199
0.009
0.058
**
-0.121(0.515)0.678
(0.422)1.076**(0.438)1.281**
(0.530)0.674
(0.630)
-0.061(0.665)0.614
(0.411)
(reference)
-0.025
0.141
0.224
0.266
0.140
-0.013
0.128
-0.143(0.495)0.609
(0.399)0.969**(0.412)1.086**
(0.477)0.956*(0.539)
-0.156(0.647)0.647*(0.387)
(reference)
Technology Index -0.076***
(0.017)
-0.018 -0.093***
(0.018)
-0.019 -0.757***
(0.710)
Intercept -0.347(0.624)
-0.080 -1.016(0.753)
-0.211
Pseudo R2
Likelihood ratioNo. of observations
0.2181031.676
1008
0.240943.976
1008
0.2551202.014
1008
Note: Superscripts *, ** and *** indicate that the coefficient was significantly different from zero at the 10%, 5% and 1%level, respectively.

- 40 -
Table 7 – Logit analyses: E-purseVariable E-purse
Know Possess Use Type of user
Model I:Technologies separately
Estimate
(SE)
ME Estimate
(SE)
ME Estimate
(SE)
ME Estimate
(SE)
Age -0.021***
(0.007)
-0.002 -0.026***
(0.004)
-0.006 -0.024***
(0.005)
-0.005 -0.019***
(0.005)Education
Primary school
Lower secondary school
Higher secondary school
Higher educ. – non univ.
University degree
***
-0.797***(0.317)
-0.665**
(0.290)-0.485**(0.280)-0.030*
(0.305)(reference)
-0.197
-0.164
-0.120
-0.007
***
-1.174***(0.331)
-0.964***
(0.290)-0.581**(0.275)-0.313*
(0.295)(reference)
-0.254
-0.208
-0.125
-0.068
-1.035***(0.317)
-0.854***
(0.272)-0.479*(0.256)-0.227
(0.273)(reference)
Mobile phone
(user is reference)
-0.513**
(0.232)Personal computer
(user is reference)
-0.637***
(0.245)
-0.063
Banking services via mobilephone (user is reference)
-0.879***(0.290)
-0.217 -0.742***(0.262)
-0.163
Province home West-Flanders
East-Flanders
Brussels Capital Region
Flemish Brabant
Antwerp
Limburg
Walloon Brabant
Namur
Liège
Luxembourg
Hainaut
***-0.302(0.263)0.142
(0.301)0.328
(0.270)0.770**(0.345)0.564**(0.284)
0.693***(0.256)
--
0.152(0.500)-0.139(0.274)0.026
(0.485)(reference)
-0.075
0.035
0.081
0.190
0.139
0.171
-
0.038
-0.034
0.006
Number of ATMs/km2 home -1.141**(0.484)
-0.282 -0.965**(0.419)
-0.208
Intercept 3.464***(0.337)
0.343 2.227***(0.460)
0.550 1.758***(0.400)
0.380
Pseudo R2
Likelihood ratioNo. of observations
0.034661.950
1008
0.1221215.979
1008
0.0861125.579
1008
0.072838.638
1008

- 41 -
Table 7 – Logit analyses: E-purse (continued)
Variable E-purseKnow Possess Use Type of user
Model II :Technology Index
Estimate
(SE)
ME Estimate
(SE)
ME Estimate
(SE)
ME Estimate
(SE)
Age -0.020***
(0.007)
-0.002 -0.021***
(0.005)
-0.005 -0.018***
(0.005)
-0.004 -0.015***
(0.005)Education
Primary school
Lower secondary school
Higher secondary school
Higher educ. – non univ.
University degree
**
-0.914***(0.347)
-0.750**
(0.300)-0.445(0.279)-0.214
(0.296)(reference)
-0.197
-0.162
-0.096
-0.046
-0.829**(0.332)
-0.662**
(0.283)-0.338(0.262)-0.129
(0.275)(reference)
Technology Index -0.053**
(0.023)
-0.005 -0.053***
(0.014)
-0.013 -0.047***
(0.016)
-0.010 -0.043***
(0.015)
Province home
West-Flanders East-Flanders
Brussels Capital Region
Flemish Brabant
Antwerp
Limburg
Walloon Brabant
Namur
Liège
Luxembourg
Hainaut
**
(reference)0.440
(0.299)
0.578*(0.296)
1.072***(0.335)
0.720***(0.276)
1.012***
(0.258)--
0.603
(0.487)0.234
(0.269)
0.513(0.470)0.425
(0.262)
0.109
0.143
0.265
0.178
0.250
-
0.149
0.058
0.127
0.105
Number of ATMs/km2 home -1.209**
(0.476)
-0.299 -1.073**
(0.420)
-0.232
Intercept 4.278***(0.446)
0.424 1.525***(0.311)
0.377 1.621***(0.371)
0.350
Pseudo R2
Likelihood ratioNo. of observations
0.033662.950
1008
0.1101228.950
1008
0.0861124.741
1008
0.0751736.980
1008
Note: Superscripts *, ** and *** indicate that the coefficient was significantly different from zero at the 10%, 5% and 1%level, respectively.

- 42 -
Table 8 – Logit analyses: Retailer card
Variable Retailer cardKnow Possess Use Type of user
Model I:Technologies separately
Estimate
(SE)
ME Estimate
(SE)
ME Estimate
(SE)
ME Estimate
(SE)
Sex
Female
Male
0.515**(0.217)
(reference)
0.064 0.484**(0.208)
(reference)Education Primary school
Lower secondary school
Higher secondary school
Higher educ. – non univ.
University degree
***-0.437
(0.314)-0.409(0.301)0.053
(0.295)0.265
(0.325)
(reference)
-0.101
-0.095
0.012
0.061
-0.902*
(0.485)-0.479(0.427)-0.239
(0.404)0.179
(0.416)
(reference)Employment Student
Unemployed
Housewife/man
Retired
Blue-collar worker
White-collar worker
Civil servant
Management
Liberal profession
Self-employed
Other
***(reference)
0.895(0.664)1.266**
(0.620)0.558
(0.577)0.294
(0.644)1.810***(0.532)
1.803***(0.683)1.054
(1.204)
--
0.891
(0.644)1.029
(0.792)
0.119
0.168
0.074
0.039
0.241
0.240
0.140
-
0.119
0.137
***(reference)
1.315**(0.600)1.148**
(0.582)0.782
(0.544)0.781
(0.586)1.760***(0.504)
1.015(0.693)0.539
(1.172)
--
0.929
(0.606)0.732
(0.756)
0.164
0.144
0.091
0.098
0.220
0.127
0.067
-
0.116
0.092
-0.902(0.770)
0.304(0.652)0.213
(0.634)-0.108(0.605)-0.037
(0.635)0.475
(0.575)
-0.331(0.738)-1.363(1.208)
--
-0.393
(0.666)(reference)

- 43 -
Table 8 – Logit analyses: Retailer card (continued)
Variable Retailer cardKnow Possess Use Type of user
Model I:Technologies separately
Estimate
(SE)
ME Estimate
(SE)
ME Estimate
(SE)
ME Estimate
(SE)
Household size
1 person
2 persons
3 persons
4 persons
5+ persons
**
0.881*(0.480)-0.100
(0.479)0.418
(0.497)0.118
(0.504)(reference)
0.117
-0.013
0.056
0.016
*
0.994**(0.431)0.340
(0.427)0.536
(0.450)0.393
(0.450)(reference)
0?124
0.043
0.0670
0.049
0.861*(0.423)0.177
(0.418)0.354
(0.442)0.343
(0.440)(reference)
Monthly income after taxes < € 750
€ 750 - € 1500
€ 1500 - € 2250
€ 2250 - € 3000
> € 3000
no income
refused to answer
do not know
-0.239(0.530)
-0.318(0.480)-0.157(0.511)
-0.119(0.635)
-
--0.947(0.780)-0.109
(0.470)(reference)

- 44 -
Table 8 – Logit analyses: Retailer card (continued)
Variable Retailer cardKnow Possess Use Type of user
Model I:Technologies separately
Estimate
(SE)
ME Estimate
(SE)
ME Estimate
(SE)
ME Estimate
(SE)
Province home
West-Flanders
East-Flanders
Brussels Capital Region
Flemish Brabant
Antwerp
Limburg
Walloon Brabant
Namur
Liège
Luxembourg
Hainaut
***
-0.470*(0.273)
-1.058***
(0.303)0.007
(0.284)-1.090***
(0.331)-1.265***
(0.285)
-1.336***(0.272)-1.561(1.446)
-0.778(0.510)-0.078
(0.290)-0.466(0.501)
(reference)
-0.109
-0.245
0.002
-0.253
-0.293
-0.310
-0.504
-0.180
-0.018
-0.108
***
1.683***(0.434)-0.648
(0.718)0.890**(0.430)-0.108
(0.623)-0.881(0.628)
-1.673**(0.702)
--
0.835(0.886)0.252
(0.492)-0.461(1.119)
(reference)
0.224
-0.086
0.118
-0.014
-0.117
-0.223
-
0.111
0.034
-0.061
***
0.891***(0.286)
-1.837***
(0.633)0.104
(0.304)-0.883*
(0.524)-1.074**(0.432)
----
-0.482(0.790)-0.579
(0.359)-1.517(1.057)
(reference)
0.111
-0.230
0.013
-0.010
-0.134
-
-
-0.060
-0.072
-0.190
Number of ATMs/km2 home 1.243***
(0.854)Number of ATMs/inhabitantshome
-0.103***(0.023)
-0.024
Intercept 1.594
(0.334)
0.370 -2.071***
(0.711)
-0.275 -3.379***
(0.625)
-0.422
Pseudo R2
Likelihood ratioNo. of observations
0.101
1191.3111008
0.164
509.1111008
0.145
657.5871008
0.200
775.4891008
Note: Superscripts *, ** and *** indicate that the coefficient was significantly different from zero at the 10%, 5% and 1%level, respectively.

- 45 -
Table 9 – Logit analyses: Resistance to cashless society
Variable Resistance to cashless societyModel I:Technologies separately
Estimate Standard Error: SE Marginal effect: ME
Employment
Student Unemployed Housewife/man Retired
Blue-collar worker White-collar worker Civil servant
Management Liberal profession Self-employed Other
***
(reference)0.758**0.5030.474*
0.751**0.084**-0.243
-0.2571.985*
1.091***-0.149
0.3610.3180.474
0.3030.2510.392
0.5191.0760.3450.429
0.1680.1110.105
0.1660.019-0.054
-0.0570.4390.241-0.033
Mobile phone (user is reference) 0.704*** 0.215 0.156
Number of ATMs/km2 home -1.093 *** 0.377 -0.242
Intercept 0.379* 0.221 0.084
Pseudo R2
Likelihood ratioNo. of observations
0.0591186.150
1008
Model II :Technology Index
Estimate Standard Error: SE Marginal effect: ME
Employment Student
Unemployed Housewife/man Retired Blue-collar worker
White-collar worker Civil servant Management
Liberal profession Self-employed Other
***(reference)
0.624*0.3090.2460.550*
-0.023-0.280-0.216
1.970*1.052***
-0.324
0.3660.3360.3010.310
0.2530.3940.521
1.0820.3460.437
0.1380.0680.0540.069
-0.005-0.062-0.048
0.4420.233-0.072
Technology Index 0.047*** 0.015 0.010
Number of ATMs/km2 home -1.130*** 0.377 -0.250
Intercept -0.338 0.330 0.075
Pseudo R2
Likelihood ratioNo. of observations
0.057
1188.1331008
Note: Superscripts *, ** and *** indicate that the coefficient was significantly different from zero at the 10%, 5% and 1%level, respectively.

- 46 -
Table 10 – Determinants of debit card ownership, c.q. use
socio-demographic financial technology supply-side
sex age edu-cation
householdsize
employ-ment
student retired income techno-logy 1
techno-logy 2
urban location
owner (y/n)AT, 2001
0 - ** + ** / + **
has job/ / 0 / / + **
size muni-cipality
/ Mooslechneret al. (2002)
owner (y/n)NL, 2002
0 0 0 / / / / / / / / / HBD (2002)
owner (y/n) model IBE, 2004
model II
0
0
0
- ***
0
0
0
0
+ ***
0
- ***
0
/
/
0
+ ***
+ ***
GSM andInternet use
/
/
- ***
technologyfear
/
/
0province
0province
this paper
user (y/n)FI, 1992
-female less
0 / / / 0 / / / / / / Virén (1994)
user (y/n)US, 1995, SCF
/ - ** + ** / / / / 0 / / / / Kennickelland Kwast(1997)
user (y/n)US, 1995, SCF
0 - *** + ***
college0 0
self-employed/ 0 + ** / / / / Klee (2005)
user (y/n)US, 1998, SCF
0 - ** + **
high school,college
0 - **
self-employed/ - ** + ** / / / / Klee (2005)
user (y/n)US, 1998, SCF
0 - + 0 +employed
/ / 0 / / / censusdivision
Stavins (2001)

- 47 -
Table 10 – Determinants of debit card ownership, c.q. use (continued)
socio-demographic financial technology supply-side
sex age edu-cation
householdsize
employ-ment
student retired income techno-logy 1
techno-logy 2
urban location
user (y/n)US, 1998, SCF
0 - ** + ** / / / / + ** + **
direct deposit
/ / censusdivision
Hayashi andKlee (2003)
user (y/n)US, 2001, SCF
0 - ** + **
college0 - **
self-employed/ - ** + ** / / / / Klee (2005)
user (y/n)US, 2001
0 - ** 0 / / / / + ** + **
direct deposit+ **
Internet
purchase
/ censusdivision
Hayashi andKlee (2003)
user (y/n) model IBE, 2004
model II
+ ***
female more
+ ***
female more
- ***
- ***
+ ***
+ **
? **
? **
0
0
0
0
/
/
+ ***
+ ***
+ ***
GSM use
/
/
- *
technologyfear
/
/
0province
0province
this paper
frequency of useUS, 1986-2002
/ ? ***
45-64 most+ *** / / / / - * + ***
Internet use0
computer
ownership
/ / Borzekowskiand Kiser(2004)
frequent user (y/n)NL, 2004
+ **
female more0 + ** / 0 - ** / + **
low income less/ / - **
major cityprovince Jonker (2005)
type of user model IBE, 2004
model II
+ ***
female more
+ ***
female more
- **
- ***
+ ***
+ **
+ ***
+ **
? **
? ***
- **
- ***
/
/
+ ***
+ ***
+ ***
GSM use
/
/
- ***
technologyfear
/
/
0province
0province
this paper
Note: Plus and minus signs indicate that the coefficient was positive and significant, c.q. negative and significant. A zero shows no effect. A question mark indicates that theimpact was not consistent across categories. Superscripts *, ** and *** indicate that the coefficient was significantly different from zero at the 10%, 5% and 1% level, respectively.
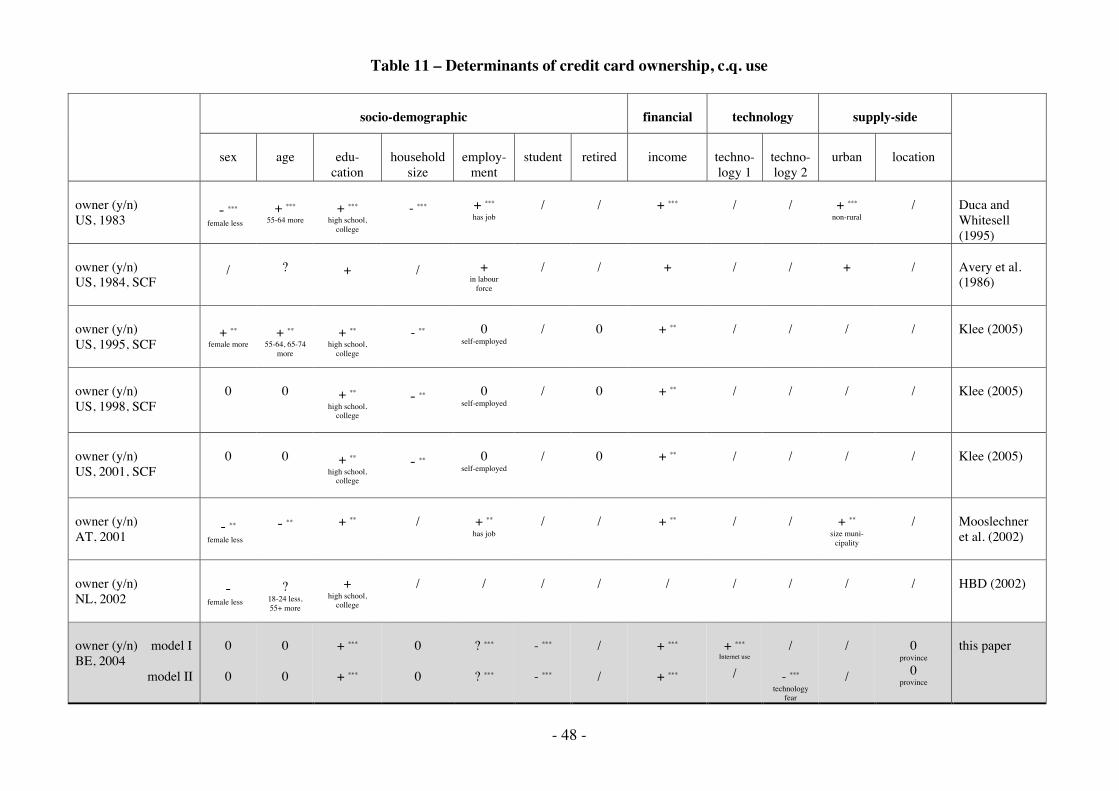
- 48 -
Table 11 – Determinants of credit card ownership, c.q. use
socio-demographic financial technology supply-side
sex age edu-cation
householdsize
employ-ment
student retired income techno-logy 1
techno-logy 2
urban location
owner (y/n)US, 1983
- ***
female less+ ***
55-64 more+ ***
high school,college
- *** + ***
has job/ / + *** / / + ***
non-rural/ Duca and
Whitesell(1995)
owner (y/n)US, 1984, SCF
/ ? + / +in labour
force
/ / + / / + / Avery et al.(1986)
owner (y/n)US, 1995, SCF
+ **
female more+ **
55-64, 65-74more
+ **
high school,college
- ** 0self-employed
/ 0 + ** / / / / Klee (2005)
owner (y/n)US, 1998, SCF
0 0 + **
high school,college
- ** 0self-employed
/ 0 + ** / / / / Klee (2005)
owner (y/n)US, 2001, SCF
0 0 + **
high school,college
- ** 0self-employed
/ 0 + ** / / / / Klee (2005)
owner (y/n)AT, 2001
- **
female less
- ** + ** / + **
has job/ / + ** / / + **
size muni-cipality
/ Mooslechneret al. (2002)
owner (y/n)NL, 2002
-female less
?18-24 less,55+ more
+high school,
college
/ / / / / / / / / HBD (2002)
owner (y/n) model IBE, 2004
model II
0
0
0
0
+ ***
+ ***
0
0
? ***
? ***
- ***
- ***
/
/
+ ***
+ ***
+ ***
Internet use
/
/
- ***
technologyfear
/
/
0province
0province
this paper

- 49 -
Table 11 – Determinants of credit card ownership, c.q. use (continued)
socio-demographic financial technology supply-side
sex age edu-cation
householdsize
employ-ment
student retired income techno-logy 1
techno-logy 2
urban location
user (y/n)US, 1984, SCF
/ ? + / +in labour
force
/ / + / / + / Avery et al.(1986)
user (y/n)FI, 1992
-female less
0 / / 0 / / / / / / / Virén (1994)
user (y/n)US, 1998, SCF
0 + + - +employed
/ / + / / / censusdivision
Stavins (2001)
user (y/n) model IBE, 2004
model II
0
0
0
0
+ ***
+ ***
0
0
? ***
? ***
- ***
- ***
/
/
+ ***
+ **
+ ***
Internet use
/
/
- ***
technologyfear
/
/
0province
0province
this paper
frequent user (y/n)NL, 2004
- **
female less- ** 0 / 0 0 / + ** / / 0 province Jonker (2005)
type of user model IBE, 2004
model II
0
0
0
0
+ ***
+ ***
0
0
? **
? **
- **
- **
/
/
+ ***
+ **
+PC*,
Internet**,PDA***
/
/
- ***
technologyfear
/
/
0province
0province
this paper
Note: Plus and minus signs indicate that the coefficient was positive and significant, c.q. negative and significant. A zero shows no effect. A question mark indicates that theimpact was not consistent across categories. Superscripts *, ** and *** indicate that the coefficient was significantly different from zero at the 10%, 5% and 1% level, respectively.

- 50 -
Table 12 – Determinants of e-purse ownership, c.q. use
socio-demographic financial technology supply-side
sex age edu-cation
householdsize
employ-ment
student retired income techno-logy 1
techno-logy 2
urban location
owner (y/n)AT, 2001
0 - ** + ** / 0 / / 0 / / 0size muni-
cipality
/ Mooslechneret al. (2002)
owner (y/n)NL, 2002
0 -55+ less
+ / / / / / / / / / HBD (2002)
owner (y/n) model IBE, 2004
model II
0
0
- ***
- ***
+ ***
0
0
0
0
0
0
0
/
/
0
0
+ ***
banking via
GSM
/
/
- ***
technologyfear
/
/
province
province
this paper
user (y/n) model IBE, 2004
model II
0
0
- ***
- ***
+ ***
+ **
0
0
0
0
0
0
/
/
0
0
+ ***
banking via
GSM
/
/
- ***
technologyfear
/
/
0province
0province
this paper
frequent user (y/n)NL, 2004
- **
female less
? **
25-34 more+ ** / 0 0 / + **
low income less
/ / 0 province Jonker (2005)
type of user model IBE, 2004
model II
0
0
- ***
- ***
+ ***
+ **
0
0
0
0
0
0
/
/
0
0
+ ***
GSM use
/
/
- ***
technologyfear
/
/
0province
0province
this paper
Note: Plus and minus signs indicate that the coefficient was positive and significant, c.q. negative and significant. A zero shows no effect. A question mark indicates that theimpact was not consistent across categories. Superscripts *, ** and *** indicate that the coefficient was significantly different from zero at the 10%, 5% and 1% level, respectively.