WHO SITS IN JUDGMENT ON STATE COURTS? - The …gavelgap.org/pdf/gavel-gap-report.pdfthe gavel gap...
30
Gavel gap The WHO SITS IN JUDGMENT ON STATE COURTS? BY TRACEY E. GEORGE AND ALBERT H. YOON
-
Upload
dangnguyet -
Category
Documents
-
view
214 -
download
1
Transcript of WHO SITS IN JUDGMENT ON STATE COURTS? - The …gavelgap.org/pdf/gavel-gap-report.pdfthe gavel gap...
Gavel gapThe
WHO SITS IN JUDGMENT ON
STATE COURTS?
BY TRACEY E. GEORGE AND ALBERT H. YOON

Gavel gapThe WHO SITS IN JUDGMENT ON STATE COURTS? 2
1 | S U M M A R Y
2 | B A C KG R O U N D
3 | R E S U LT S
4 | C O N C L U S I O N
5 | AT T R I B U T I O N & A C K N O W L E D G E M E N T S
6 | A P P E N D I X
For most individuals and organizations, state courts are the “law” for all effective purposes. State courts are America’s courts. But, we know surprisingly little about who serves on state courts—i.e., state judges—despite their central and powerful role. This lack of information is especially significant because judges’ backgrounds have important implications for the work of courts. The characteristics of those who sit in judgment can affect the internal workings of courts as well as the external perception of courts and judges. The background of judges can influence how they make decisions and impact the public’s acceptance of those decisions. We need to know more about state judges.
In order to address this serious shortcoming in our understanding of America’s courts, we have constructed an unprecedented database of state judicial biographies. Our dataset—the State Bench Database—includes more than 10,000 current sitting judges on state courts of general jurisdiction. Although state judges are public servants, little is known about them. Unlike their counterparts on the federal courts, much of the information is non-public, and in many instances, not even collected in a systematic way.
Using the State Bench Database, we examine the gender, racial, and ethnic composition of state courts. We then compare the composition of state courts to the composition of the general population in each state. We find that courts are not representative of the people whom they serve—that is, a gap exists between the bench and the citizens. We call this gap the Gavel Gap.
This study’s principal findings are:Women have entered law schools and the legal profession in large numbers for the last forty years, but are underrepresented on state courts. Women comprise roughly one-half of the U.S. population and one-half of American law students. But, less than one-third of state judges are women. In some states, women are underrepresented on the bench by a ratio of one woman on the bench for every four women in the state. Not a single state has as many women judges as it does men.
“For most individuals and organizations, state courts are the “law” for all effective purposes.”
“Although state judges are public servants, little is known about them.”

Gavel gapThe WHO SITS IN JUDGMENT ON STATE COURTS? 3
People of color make up roughly four in ten people in the country but fewer than two in ten judges; and, in sixteen states, judges of color account for fewer than one in ten state judges. The story of racial diversity in state courts is one of sharp contrasts. In the five states with the best representation, minorities are represented at roughly the same rate on state courts as they are in the general population (and in a few states, they are even better represented). But, in the five states with the worst representation, minorities appear to be nearly absent from the judiciary.
This study is based on the work of a team of independent researchers at Vanderbilt University and the University of Toronto. With support from the American Constitution Society, the researchers collected and coded biographical data on over 10,000 judges serving on state supreme courts, state intermediate appellate courts, and state general
jurisdiction trial courts. A complete explanation of this study’s methodology is below.
The findings from this study have several important implications. First, they should inform the current method of identifying and selecting judges. Second, they demonstrate that we need a better process for developing a pipeline of women and minorities to serve as judges.
Our courts must be representative in order to fulfill their purposes. Our laws are premised in part on the idea that our courts will be staffed by judges who can understand the circumstances of the communities which they serve. Our judicial system depends on the general public’s faith in its legitimacy. Both of these foundational principles require a bench that is representative of the people whom the courts serve.
BACKGROUNDSTATE COURTS AS AMERICA’S COURTS
The United States Supreme Court is undoubtedly the most visible and well-known court in America. Its decisions, including Brown v. Board of Education, Roe v. Wade, and Obergefell v. Hodges, have had a tremendous impact on the civil rights and liberties of all Americans. But the U.S. Supreme Court’s reach is limited. The Supreme Court decides fewer than 100 cases per year. Moreover, it addresses only questions of federal law. While we often hear a person say that she will take her case “all the way to the Supreme Court,” the reality is that the justices decide few cases and only a subset of legal issues. Accordingly, in nearly every case and for any legal issue, when we think of judges making these decisions in America, we are usually thinking of state judges.
Americans are primarily concerned with matters such as finances, family, health, and safety. State courts have
authority over these basic matters of daily life. If a tenant refuses to pay rent and her landlord threatens to evict her, a state court would hear the dispute. If divorced parents fight over the custody of a child, a state court will resolve the matter. If a car accident leaves a passenger badly injured, the victim will likely go to state court to seek recovery. If a suspect is arrested for assault, a state judge will hold the arraignment and eventually preside over the trial (or more likely take the plea bargain). The work of courts in America is the work of state courts.
What cases do state courts hear?State courts handle more than 90% of the judicial business in America. According to the Court Statistics Project, a joint effort of the National Center for State Courts and the Conference of State Court Administrators, approximately 94 million cases were brought in American state trial courts in 2013.1 In a single year, nearly one case was filed for every three people in the United States. Roughly one billion cases entered the state judicial system over the past decade.
“We find that courts are not representative of the people whom they serve—that is, a gap exists between the bench and the citizens.”
“State courts handle more than 90% of the judicial business in America.”
Gavel gapThe WHO SITS IN JUDGMENT ON STATE COURTS? 4
State courts are open to the full range of disputes that arise in this country. State judicial systems are courts of “general jurisdiction” which means they can hear questions of state and federal law. By contrast, federal courts are courts of “limited” jurisdiction which means that they can only hear subjects assigned to them by the U.S. Constitution or federal statute.
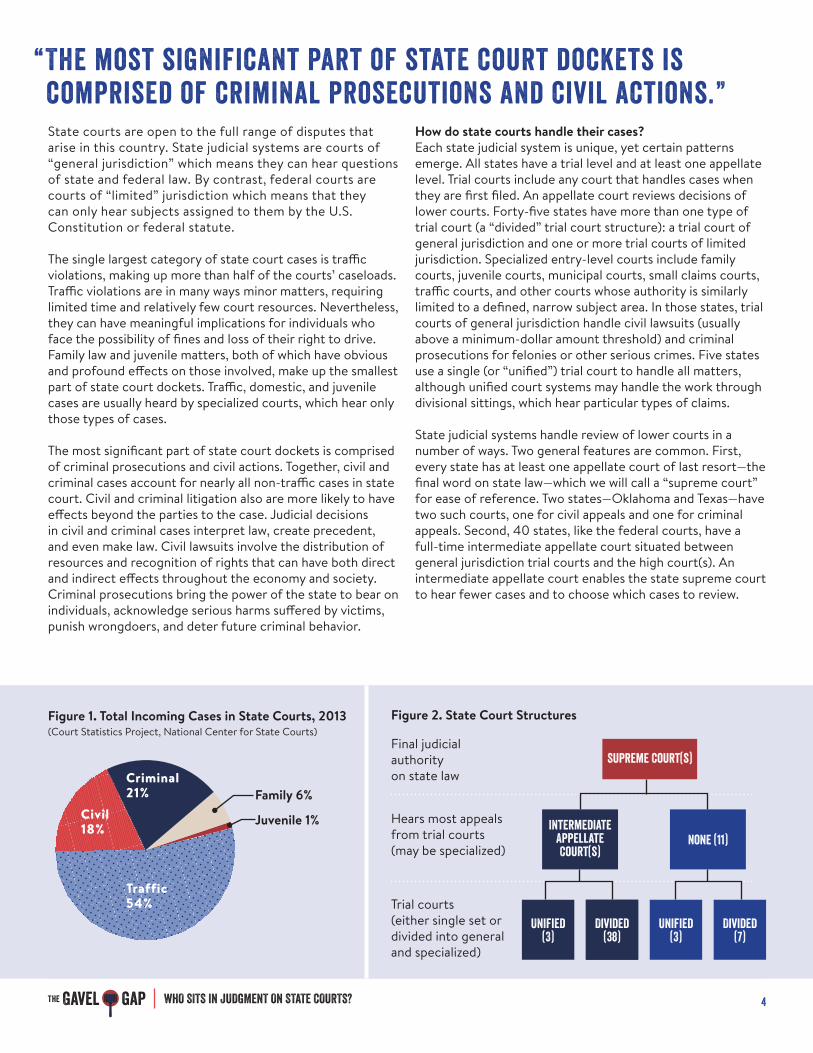
The single largest category of state court cases is traffic violations, making up more than half of the courts’ caseloads. Traffic violations are in many ways minor matters, requiring limited time and relatively few court resources. Nevertheless, they can have meaningful implications for individuals who face the possibility of fines and loss of their right to drive. Family law and juvenile matters, both of which have obvious and profound effects on those involved, make up the smallest part of state court dockets. Traffic, domestic, and juvenile cases are usually heard by specialized courts, which hear only those types of cases.
The most significant part of state court dockets is comprised of criminal prosecutions and civil actions. Together, civil and criminal cases account for nearly all non-traffic cases in state court. Civil and criminal litigation also are more likely to have effects beyond the parties to the case. Judicial decisions in civil and criminal cases interpret law, create precedent, and even make law. Civil lawsuits involve the distribution of resources and recognition of rights that can have both direct and indirect effects throughout the economy and society. Criminal prosecutions bring the power of the state to bear on individuals, acknowledge serious harms suffered by victims, punish wrongdoers, and deter future criminal behavior.
How do state courts handle their cases?Each state judicial system is unique, yet certain patterns emerge. All states have a trial level and at least one appellate level. Trial courts include any court that handles cases when they are first filed. An appellate court reviews decisions of lower courts. Forty-five states have more than one type of trial court (a “divided” trial court structure): a trial court of general jurisdiction and one or more trial courts of limited jurisdiction. Specialized entry-level courts include family courts, juvenile courts, municipal courts, small claims courts, traffic courts, and other courts whose authority is similarly limited to a defined, narrow subject area. In those states, trial courts of general jurisdiction handle civil lawsuits (usually above a minimum-dollar amount threshold) and criminal prosecutions for felonies or other serious crimes. Five states use a single (or “unified”) trial court to handle all matters, although unified court systems may handle the work through divisional sittings, which hear particular types of claims.
State judicial systems handle review of lower courts in a number of ways. Two general features are common. First, every state has at least one appellate court of last resort—the final word on state law—which we will call a “supreme court” for ease of reference. Two states—Oklahoma and Texas—have two such courts, one for civil appeals and one for criminal appeals. Second, 40 states, like the federal courts, have a full-time intermediate appellate court situated between general jurisdiction trial courts and the high court(s). An intermediate appellate court enables the state supreme court to hear fewer cases and to choose which cases to review.
“The most significant part of state court dockets is comprised of criminal prosecutions and civil actions.”
Figure 2. State Court StructuresFigure 1. Total Incoming Cases in State Courts, 2013 (Court Statistics Project, National Center for State Courts)
Traffic54%
Criminal21% Family 6%
Juvenile 1%Civil 18%
Final judicial authority on state law
Hears most appeals from trial courts (may be specialized)
Trial courts (either single set or divided into general and specialized)
Intermediate Appellate Court(s)
None (11)
Supreme Court(s)
Unified (3)
Divided (38)
Unified (3)
Divided (7)
Gavel gapThe WHO SITS IN JUDGMENT ON STATE COURTS? 5
STATE JUDGES AS AMERICA’S JUDGES
State trial and appellate judges do the work of America’s courts. Thus, it is important to understand the process by which states choose the people who will resolve disputes, enforce law, and make law on our behalf. Any process of selection will inevitably have an impact on who is selected. Each state has a distinct selection process for its judicial system. By focusing on the most salient features of those selection systems, however, the states can be grouped into helpful categories.
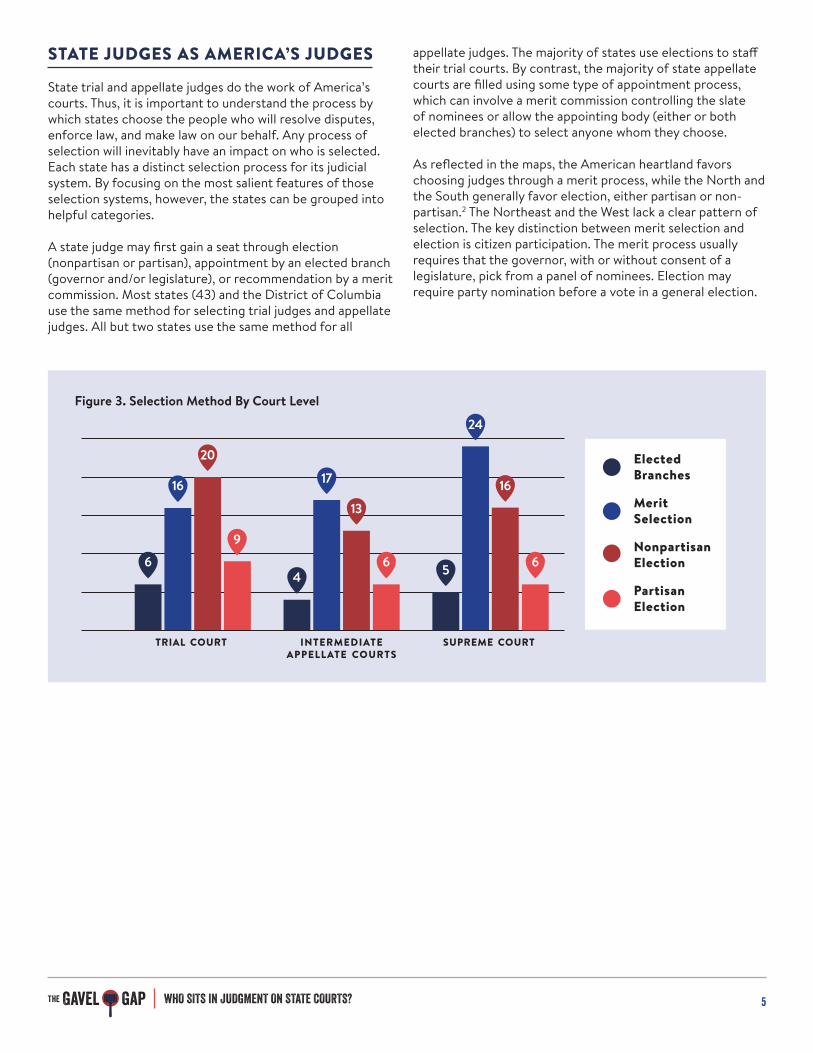
A state judge may first gain a seat through election (nonpartisan or partisan), appointment by an elected branch (governor and/or legislature), or recommendation by a merit commission. Most states (43) and the District of Columbia use the same method for selecting trial judges and appellate judges. All but two states use the same method for all
appellate judges. The majority of states use elections to staff their trial courts. By contrast, the majority of state appellate courts are filled using some type of appointment process, which can involve a merit commission controlling the slate of nominees or allow the appointing body (either or both elected branches) to select anyone whom they choose.
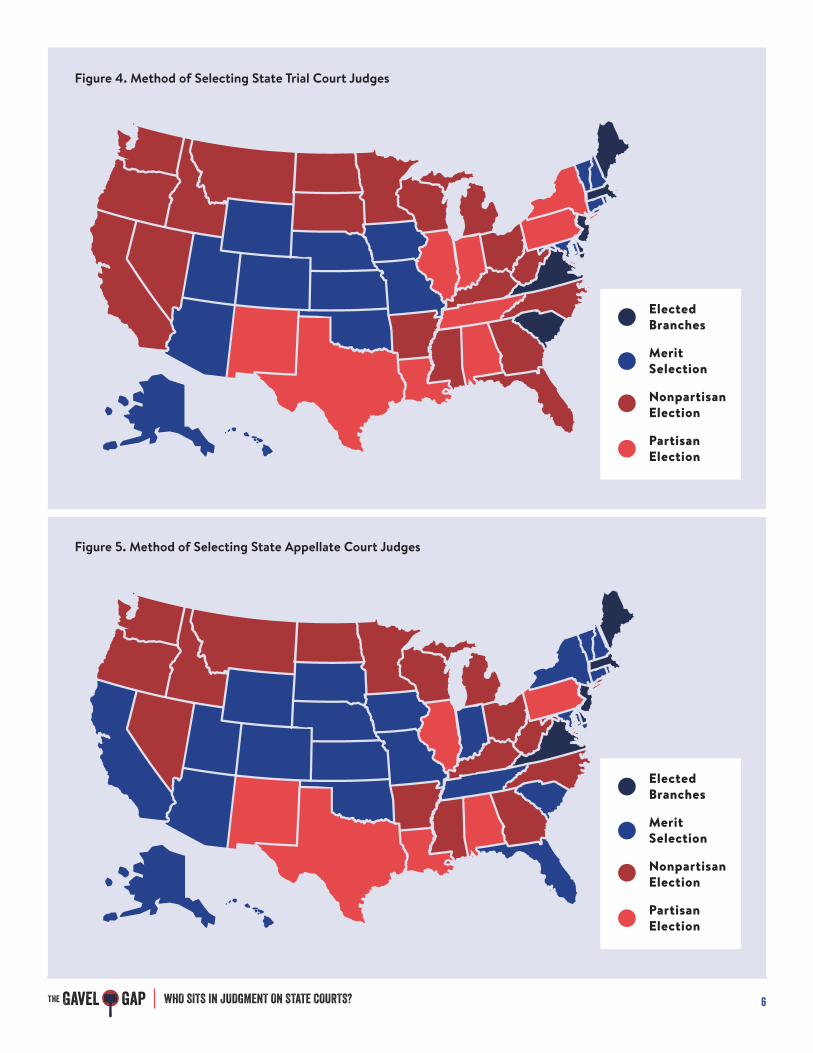
As reflected in the maps, the American heartland favors choosing judges through a merit process, while the North and the South generally favor election, either partisan or non-partisan.2 The Northeast and the West lack a clear pattern of selection. The key distinction between merit selection and election is citizen participation. The merit process usually requires that the governor, with or without consent of a legislature, pick from a panel of nominees. Election may require party nomination before a vote in a general election.
Figure 3. Selection Method By Court Level
trial court intermediate appellate courts
supreme court
64
6
16 17
24
20
13
16
9
Elected Branches
Merit Selection
Nonpartisan Election
Partisan Election
5 6
Gavel gapThe WHO SITS IN JUDGMENT ON STATE COURTS? 6
Figure 4. Method of Selecting State Trial Court Judges
Figure 5. Method of Selecting State Appellate Court Judges
Elected Branches
Merit Selection
Nonpartisan Election
Partisan Election
Elected Branches
Merit Selection
Nonpartisan Election
Partisan Election

Gavel gapThe WHO SITS IN JUDGMENT ON STATE COURTS? 7
RESULTSState courts are America’s courts. State judges are powerful public officials. But, we know surprisingly little about the men and women who serve as state judges. Few states release detailed biographical information about their judges. Existing non-government sources generally rely on incomplete or unreliable information. We seek to remedy this shortcoming through the construction of the State Bench Database.
We collected biographical data for every judge sitting on a state appellate court or a state trial court of general jurisdiction as of December 2014. When constructing our dataset, we used only sources that had the hallmarks of credibility and reliability. The sources included state government webpages, press releases, and printed directories; professional association, practitioner, and university publications; academic journals; newspapers; judges’ official campaign websites; judicial directories; and confidential telephone interviews with judges and lawyers.
A note about our calculation on the numbers of women and minorities on the bench. First, our figures are estimates. We are not directly observing these characteristics of the judges but rather collecting it from secondary sources. Second, even after exhausting available sources, we are missing race and ethnicity data on roughly five percent of the judges. We were able to identify gender for nearly all of the judges in the database. Our estimates are based on available data. Third, the database includes only judges who were listed as serving on the court in December 2014. If a state experienced significant turnover in its composition of judges in the interim, our figures may contrast with the state’s current judicial composition.
More than half of state trial judges and state appellate judges are white men according to the State Bench Database figures. We compare our estimates to the U.S. Census Bureau estimates of the representation of all four groups in the U.S. population in 2014.3 Women of color are the most underrepresented group (only 40% of their relative numbers in the general population) while white men are overrepresented (nearly double their relative numbers).
Figure 7. Race & Gender on State Appellate Courts
Figure 8. Race & Gender in the United States
Figure 6. Race & Gender on State Trial Courts
White Men57%
White Men58%
Men of Color9%
Men of Color12%
Women of Color 8%
Women of Color 8%
White Women 26%
White Women 22%
White Men30%
White Women 31%
Men of Color 19%
Women of Color 20%
“More than half of state trial judges and state appellate judges are white men according to the State Bench Database figures.”
Gavel gapThe WHO SITS IN JUDGMENT ON STATE COURTS? 8
REPRESENTATIVENESS OF STATE JUDICIARIES
For every state, we calculated the gap between the representation of women or minorities on the bench and the representation of each group in the general population. A truly representative judiciary would have the same ratio of women and minorities on the bench as it does in the general population. The Gavel Gap is how much the state falls short of that forecast.
We calculate the Gavel Gap by dividing the difference between the proportion of women and/or minorities on the bench and women and/or minorities in the general population by the proportion of women and/or minorities in the general population. The formula for the Gender Gavel Gap is ((fraction of judges who are women – fraction of general population who are women) ÷ fraction of general population who are women). Thus, if half of a state’s judges were women and half of its general population were women, the state would have no
gap ((.50-.50)/.50=0). If ten percent of a state’s judges were women and half of its general population were women, the state would have a gap of -.80 ((.10-.50)/.50=-.80). That is, the state has 80% fewer women on the bench than we would have predicted based on its general population. Stated differently, the state has only 20% of the number of women on the bench as we would expect.
The representativeness score is a positive presentation of where a state stands on achieving the proportion of women and/or minorities on the bench as it has in its general population. We rank each state based on the level of representation that it appears to have achieved based on the State Bench Database estimates.
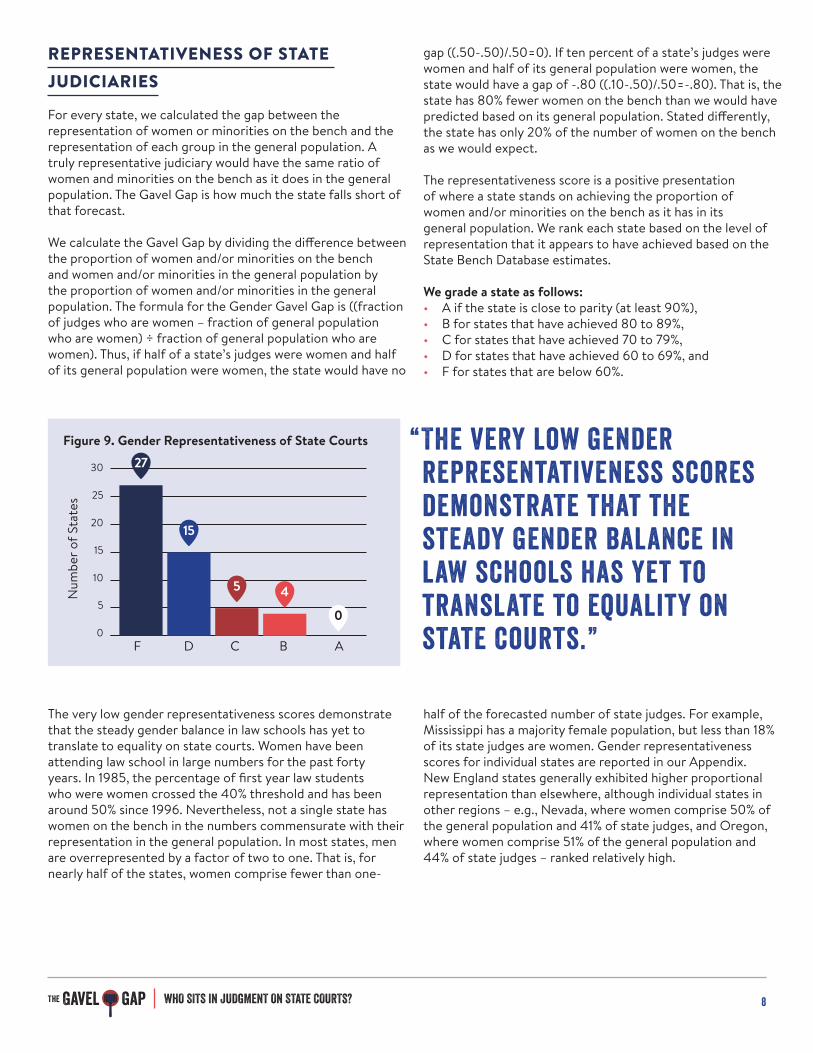
We grade a state as follows:• A if the state is close to parity (at least 90%),• B for states that have achieved 80 to 89%,• C for states that have achieved 70 to 79%,• D for states that have achieved 60 to 69%, and• F for states that are below 60%.
The very low gender representativeness scores demonstrate that the steady gender balance in law schools has yet to translate to equality on state courts. Women have been attending law school in large numbers for the past forty years. In 1985, the percentage of first year law students who were women crossed the 40% threshold and has been around 50% since 1996. Nevertheless, not a single state has women on the bench in the numbers commensurate with their representation in the general population. In most states, men are overrepresented by a factor of two to one. That is, for nearly half of the states, women comprise fewer than one-
half of the forecasted number of state judges. For example, Mississippi has a majority female population, but less than 18% of its state judges are women. Gender representativeness scores for individual states are reported in our Appendix. New England states generally exhibited higher proportional representation than elsewhere, although individual states in other regions – e.g., Nevada, where women comprise 50% of the general population and 41% of state judges, and Oregon, where women comprise 51% of the general population and 44% of state judges – ranked relatively high.
“The very low gender representativeness scores demonstrate that the steady gender balance in law schools has yet to translate to equality on state courts.”
Figure 9. Gender Representativeness of State Courts
0
5
10
15
20
25
30
Num
ber o
f Sta
tes
F D C B A
27
15
5 4
0

Gavel gapThe WHO SITS IN JUDGMENT ON STATE COURTS? 9
“Not a single state has women on the bench in the numbers commensurate with their representation in the general population.”
The racial and ethnic representativeness of state courts data reveals a flatter distribution for ethnic representation on state courts. In a near majority of states (24), minority judges fell below 50% of proportional representation of the general population. Many of the states which fared poorly on the gender score also performed poorly on ethnic representation. For example, Oklahoma ranked 41st out of 51 on the gender score (with 50% female population but only 21% women judges), and 46th out of 51 on the race and ethnic minority representation score (with 33% minority population but only 8% minority judges).
The general representativeness of state courts is reflected in an overall Gavel Gap index which considers the representation of both women and minorities on state courts. Two small jurisdictions—Hawaii (ranked 1st) and the District of Columbia (2nd)—lead the group. Twenty-six states earn failing scores.
“In a near majority of states (24), minority judges fell below 50% of proportional representation of the general population.”
Figure 10. Racial and Ethnic Representativeness of State Courts
Figure 11. Overall Representativeness of State Courts
Num
ber o
f Sta
tes
Num
ber o
f Sta
tes
F FD DC CB BA A0
5
10
15
20
25
30
0
5
10
15
20
25
30
35 3226
6
15
5
8
1 1
7
1
Gavel gapThe WHO SITS IN JUDGMENT ON STATE COURTS? 10
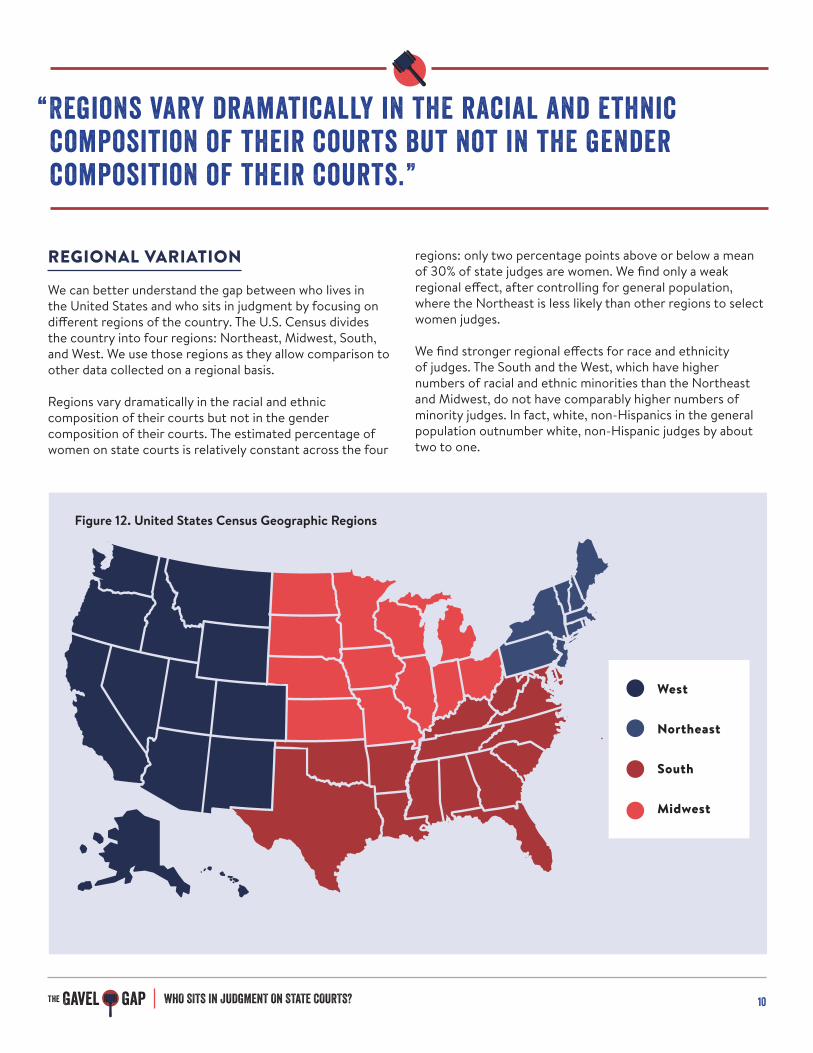
Figure 12. United States Census Geographic Regions
REGIONAL VARIATION
We can better understand the gap between who lives in the United States and who sits in judgment by focusing on different regions of the country. The U.S. Census divides the country into four regions: Northeast, Midwest, South, and West. We use those regions as they allow comparison to other data collected on a regional basis.
Regions vary dramatically in the racial and ethnic composition of their courts but not in the gender composition of their courts. The estimated percentage of women on state courts is relatively constant across the four
regions: only two percentage points above or below a mean of 30% of state judges are women. We find only a weak regional effect, after controlling for general population, where the Northeast is less likely than other regions to select women judges.
We find stronger regional effects for race and ethnicity of judges. The South and the West, which have higher numbers of racial and ethnic minorities than the Northeast and Midwest, do not have comparably higher numbers of minority judges. In fact, white, non-Hispanics in the general population outnumber white, non-Hispanic judges by about two to one.
“Regions vary dramatically in the racial and ethnic composition of their courts but not in the gender composition of their courts.”
West
Northeast
South
Midwest

Gavel gapThe WHO SITS IN JUDGMENT ON STATE COURTS? 11
Figure 14. Racial and Ethnic Minorities as a Percentage of the General Population and of State Courts by Census Region
northeast midwest south west
Minorities Minority judges
0
10
20
30
40
50
33.18
41.69
48.73
23.31
19.7421.12
22.96
13.76
Figure 13. Women as a Percentage of the General Population and of of State Courts by Census Region
0
10
20
30
40
50
60
northeast midwest south west
Women Women Judges
51.29 50.97 50.1650.71
31.9228.09
32.93
28.25

Gavel gapThe WHO SITS IN JUDGMENT ON STATE COURTS? 12
CRIMINAL JUSTICE AND RACE
State trial judges have a great deal of authority and discretion over criminal prosecutions. State appellate courts review only a fraction of criminal convictions, and much of that oversight is limited by design and by necessity. Legal doctrines which govern evidentiary, procedural, and substantive rulings require or result in substantial deference to trial judges by using standards of review such as clearly erroneous and abuse of discretion and by limiting reversal to errors which were likely to affect the outcome. Trial judges play central roles in both plea bargaining and sentencing; however, plea bargaining and sentencing are subject to little appellate oversight. Finally, appellate courts lack the capacity to review the large numbers of criminal rulings made by trial judges on a
daily basis. Thus, even if appellate courts could closely audit a criminal conviction, they are highly likely to affirm it.
Trial judges are the ultimate authority for almost all criminal defendants. And, those defendants are disproportionately minorities. The Bureau of Justice Statistics estimated that in 2009 in the 75 largest counties, nearly half (44%) of felony defendants were non-Hispanic African Americans and nearly one-quarter (24%) were Hispanic/Latino.4 We estimate that more than three-quarters of trial judges are white. As recently as May 2016, the U.S. Supreme Court has found unconstitutional jury-selection practices that produce an all-white jury.5 Yet, the reality is that minority defendants face a nearly all-white trial bench in many states.
“State trial judges have a great deal of authority and discretion over criminal prosecutions.”
DEFENDANTS TRIAL JUDGES
White30%
Other2%
AfricanAmerican 7%
Hispanic/Latino5%
Other 8%
Hispanic/Latino 24%
AfricanAmerican44%
White80%

Gavel gapThe WHO SITS IN JUDGMENT ON STATE COURTS? 13
ATTRIBUTIONABOUT THE AUTHORS
ACKNOWLEDGEMENTS
TRACEY E. GEORGEProfessor of Law and Political Science, Vanderbilt University
Professor George holds the Charles B. Cox III and Lucy D. Cox Family Chair in Law and Liberty at Vanderbilt University. She is the Director of the Cecil D. Branstetter Litigation and Dispute Resolution Program. She brings a social science perspective to the study of judges and courts, judicial selection and elections, legal education and the legal profession, and contract law and theory. Professor George was previously on the faculty at Northwestern University and the University of Missouri-Columbia. She is a member of the American Law Institute. Professor George earned her undergraduate degree from SMU, her M.A. in political science from Washington University in St. Louis, and her J.D. from Stanford University.
ALBERT H. YOONProfessor of Law and Economics, University of Toronto Faculty of Law
Professor Yoon holds the Chair in Law and Economics at the University of Toronto. His primary research areas are the legal profession, civil procedure, judicial behavior, American political development, and corporate law. Professor Yoon was previously on the faculty at Northwestern University School of Law, a Robert Wood Johnson Scholar in Health Policy Research at U.C. Berkeley, a Law and Public Affairs Fellow at Princeton University, and a Russell Sage Visiting Scholar in New York City. He is a recipient of the Ronald H. Coase Prize from the University of Chicago for the best published paper in Law & Economics, and is a member of the American Law Institute. Professor Yoon received his undergraduate degree from Yale University, and his J.D. and Ph.D. (Political Science) from Stanford University.
The authors thank our outstanding team of research assistants: Timo Vink and Elizabeth White at the University of Toronto and David Adams, Cyle Catlett, Tracee Clements, David Creasy, Julia Gillespie, Dan Metzger, and Erik Peterson at Vanderbilt University. We also thank Greg Goelzhauser, Lisa Hall, Michael Kang, Eric Lesh, Joanna Shepherd, Jennifer Bennett Shinall, Jason Sowards, and the numerous judges who were willing to provide valuable advice and assistance on this project.
CONCLUSIONPresident Barack Obama has emphasized the diversity of his appointments to the federal judiciary, including landmark appointments of people of color and LGBT people. As Christopher Kang, who was in charge of the judicial nomination process for President Obama, explained “when the men and women who deliver justice look more like the
communities they serve, there is greater confidence in our justice system overall.”6 We find that state courts do not look like the communities they serve, which has ramifications for the functioning of our judicial system and the rule of law. Our findings are particularly important given the vital role state courts play in our democracy, in our economy, and in our daily lives.
Gavel gapThe WHO SITS IN JUDGMENT ON STATE COURTS? 14
APPENDIX
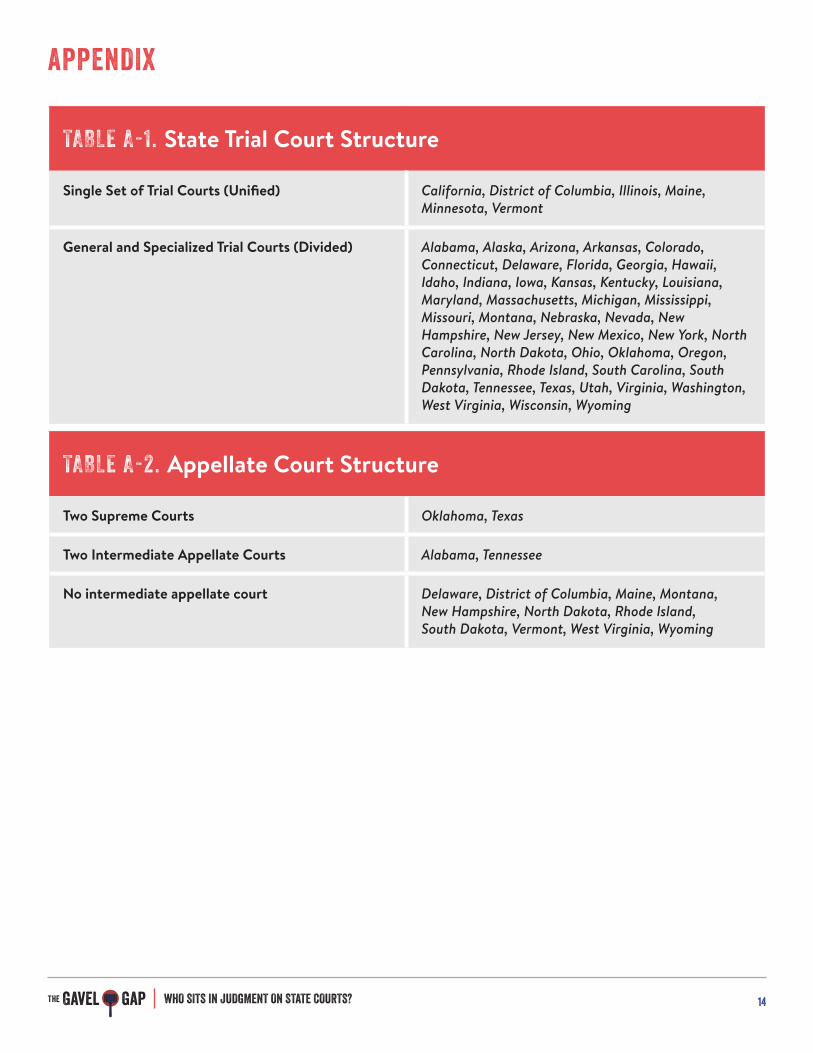
TABLE A-1. State Trial Court Structure
Single Set of Trial Courts (Unified) California, District of Columbia, Illinois, Maine, Minnesota, Vermont
General and Specialized Trial Courts (Divided) Alabama, Alaska, Arizona, Arkansas, Colorado, Connecticut, Delaware, Florida, Georgia, Hawaii, Idaho, Indiana, Iowa, Kansas, Kentucky, Louisiana, Maryland, Massachusetts, Michigan, Mississippi, Missouri, Montana, Nebraska, Nevada, New Hampshire, New Jersey, New Mexico, New York, North Carolina, North Dakota, Ohio, Oklahoma, Oregon, Pennsylvania, Rhode Island, South Carolina, South Dakota, Tennessee, Texas, Utah, Virginia, Washington, West Virginia, Wisconsin, Wyoming
TABLE A-2. Appellate Court Structure
Two Supreme Courts Oklahoma, Texas
Two Intermediate Appellate Courts Alabama, Tennessee
No intermediate appellate court Delaware, District of Columbia, Maine, Montana, New Hampshire, North Dakota, Rhode Island, South Dakota, Vermont, West Virginia, Wyoming
Gavel gapThe WHO SITS IN JUDGMENT ON STATE COURTS? 15
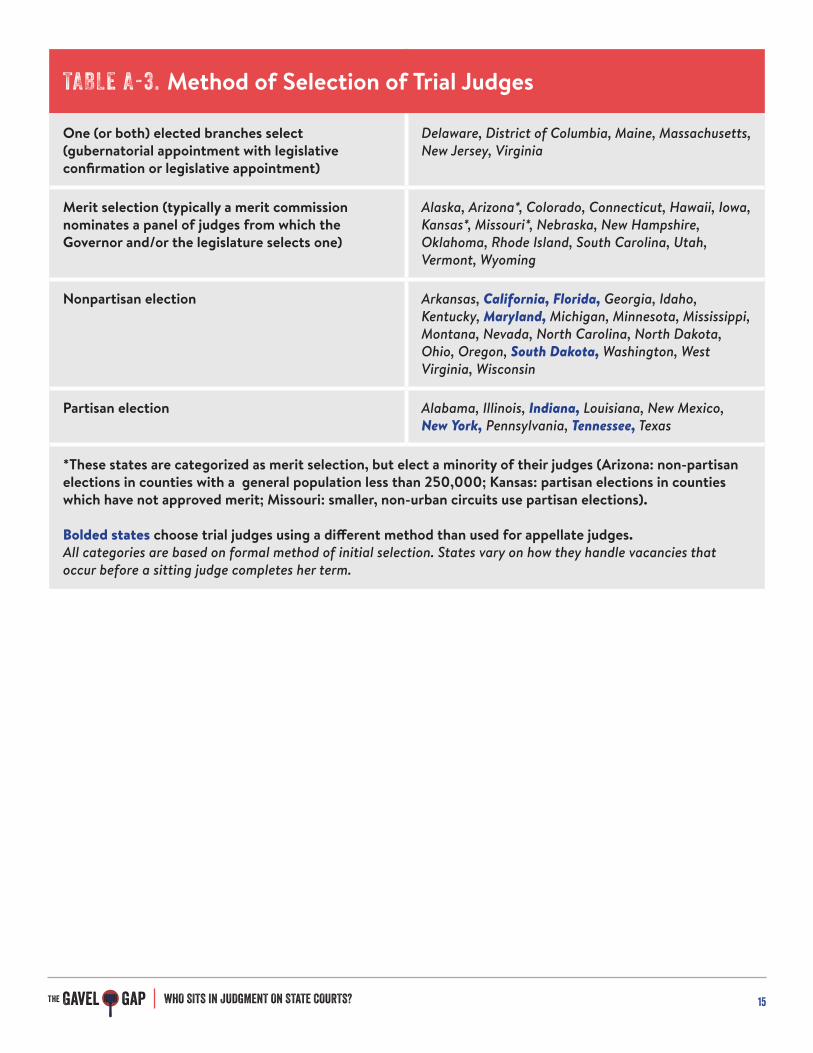
TABLE A-3. Method of Selection of Trial Judges
One (or both) elected branches select (gubernatorial appointment with legislative confirmation or legislative appointment)
Delaware, District of Columbia, Maine, Massachusetts, New Jersey, Virginia
Merit selection (typically a merit commission nominates a panel of judges from which the Governor and/or the legislature selects one)
Alaska, Arizona*, Colorado, Connecticut, Hawaii, Iowa, Kansas*, Missouri*, Nebraska, New Hampshire, Oklahoma, Rhode Island, South Carolina, Utah, Vermont, Wyoming
Nonpartisan election Arkansas, California, Florida, Georgia, Idaho, Kentucky, Maryland, Michigan, Minnesota, Mississippi, Montana, Nevada, North Carolina, North Dakota, Ohio, Oregon, South Dakota, Washington, West Virginia, Wisconsin
Partisan election Alabama, Illinois, Indiana, Louisiana, New Mexico, New York, Pennsylvania, Tennessee, Texas
*These states are categorized as merit selection, but elect a minority of their judges (Arizona: non-partisan elections in counties with a general population less than 250,000; Kansas: partisan elections in counties which have not approved merit; Missouri: smaller, non-urban circuits use partisan elections).
Bolded states choose trial judges using a different method than used for appellate judges.All categories are based on formal method of initial selection. States vary on how they handle vacancies that occur before a sitting judge completes her term.

Gavel gapThe WHO SITS IN JUDGMENT ON STATE COURTS? 16
TABLE A-4. Method of Selection of Intermediate Appellate Judges*
One (or both) elected branches select Massachusetts, New Jersey, New York,7 Virginia
Merit selection Alaska, Arizona, California, Colorado, Connecticut, Florida, Hawaii, Indiana, Iowa, Kansas, Maryland, Missouri, Nebraska, Oklahoma, South Carolina, Tennessee**, Utah
Nonpartisan election Arkansas, Georgia, Idaho, Kentucky, Michigan, Minnesota, Mississippi, Nevada, North Carolina, Ohio, Oregon, Washington, Wisconsin
Partisan election Alabama, Illinois, Louisiana, New Mexico, Pennsylvania, Texas
No intermediate appellate court Delaware, District of Columbia, Maine, Montana, New Hampshire, North Dakota, Rhode Island, South Dakota, Vermont, West Virginia, Wyoming
*North Dakota’s intermediate appellate court does not have permanent judges. The state supreme court selects three active or retired judges (or attorneys) to serve on the intermediate appellate court for a term not to exceed one year.
**Tennessee changed its method of appellate judge selection in January 2015 from merit selection (a nominating commission submitted a list of three nominees to the governor who picked one) to elected branch selection (gubernatorial nomination with legislative confirmation). None of the judges in the State Bench Database were selected under the new method.
Bolded states choose intermediate appellate judges by a different method than they use for supreme court judges.
All categories are based on formal method of initial selection. States vary on how they handle vacancies that occur during a judicial term.

Gavel gapThe WHO SITS IN JUDGMENT ON STATE COURTS? 17
TABLE A-5. Method of Selection of Supreme Court Judges
One (or both) elected branches select Delaware, District of Columbia, Maine, Massachusetts, New Jersey, Virginia
Merit selection Alaska, Arizona, California, Colorado, Connecticut, Florida, Hawaii, Indiana, Iowa, Kansas, Maryland, Missouri, Nebraska, New Hampshire, New York, Oklahoma, Rhode Island, South Carolina, South Dakota, Tennessee*, Utah, Vermont, Wyoming
Nonpartisan election Arkansas, Georgia, Idaho, Kentucky, Michigan, Minnesota, Mississippi, Montana, Nevada, North Carolina, North Dakota, Ohio, Oregon, Washington, West Virginia, Wisconsin
Partisan election Alabama, Illinois, Louisiana, New Mexico, Pennsylvania, Texas
* Tennessee changed its method of appellate judge selection in January 2015 from merit selection (a nominating commission submitted a list of three nominees to the governor who picked one) to elected branch selection (gubernatorial nomination with legislative confirmation). None of the judges in the State Bench Database were selected under the new method.
All categories are based on formal method of initial selection. States vary on how they handle vacancies that occur before a sitting judge completes her term.

Gavel gapThe WHO SITS IN JUDGMENT ON STATE COURTS? 18
TABLE A-6. Gender Breakdown of All State Courts (2014)
Percentage Male Percentage Female Total Number
State Appellate Judges .6659 .3341 1,688
State Trial Judges .7041 .2959 8,607
All State Court Judges .6978 .3022 10,295
U.S. Population .4927 .5073 321,000,000
TABLE A-7. Race/ Ethnicity Breakdown of All State Courts (2014)
Percentage White Non-Hispanic
Percentage African-American
Percentage Hispanic
Percentage Other Race
State Appellate Judges .8270 .0794 .0515 .0421
State Trial Judges .7990 .0708 .0550 .0753
All State Court Judges .8036 .0722 .0544 .0698
U.S. Population .6172 .1238 .1766 .0824
TABLE A-8. Race and Gender Breakdown of All State Courts (2014)
Percentage White Men
Percentage Men of Color
PercentageWhite Women
Percentage Women of Color
State Appellate Judges .5804 .1237 .2186 .0773
State Trial Judges .5705 .0954 .2565 .0776
All State Court Judges .5787 .1191 .2249 .0773
U.S. Population .3041 .1886 .3131 .1942
Gavel gapThe WHO SITS IN JUDGMENT ON STATE COURTS? 19
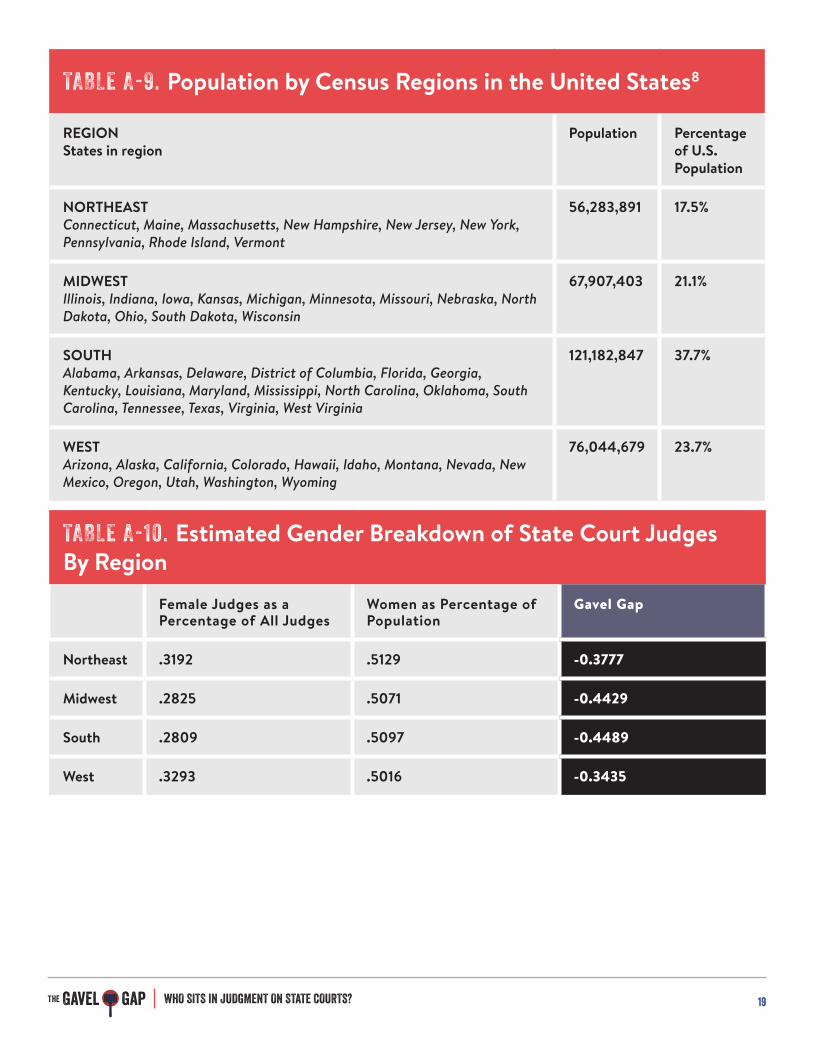
TABLE A-9. Population by Census Regions in the United States8
REGIONStates in region
Population Percentage of U.S. Population
NORTHEASTConnecticut, Maine, Massachusetts, New Hampshire, New Jersey, New York, Pennsylvania, Rhode Island, Vermont
56,283,891 17.5%
MIDWESTIllinois, Indiana, Iowa, Kansas, Michigan, Minnesota, Missouri, Nebraska, North Dakota, Ohio, South Dakota, Wisconsin
67,907,403 21.1%
SOUTHAlabama, Arkansas, Delaware, District of Columbia, Florida, Georgia, Kentucky, Louisiana, Maryland, Mississippi, North Carolina, Oklahoma, South Carolina, Tennessee, Texas, Virginia, West Virginia
121,182,847 37.7%
WESTArizona, Alaska, California, Colorado, Hawaii, Idaho, Montana, Nevada, New Mexico, Oregon, Utah, Washington, Wyoming
76,044,679 23.7%
TABLE A-10. Estimated Gender Breakdown of State Court Judges By Region
Female Judges as a Percentage of All Judges
Women as Percentage of Population
Gavel Gap
Northeast .3192 .5129 -0.3777
Midwest .2825 .5071 -0.4429
South .2809 .5097 -0.4489
West .3293 .5016 -0.3435
Gavel gapThe WHO SITS IN JUDGMENT ON STATE COURTS? 20
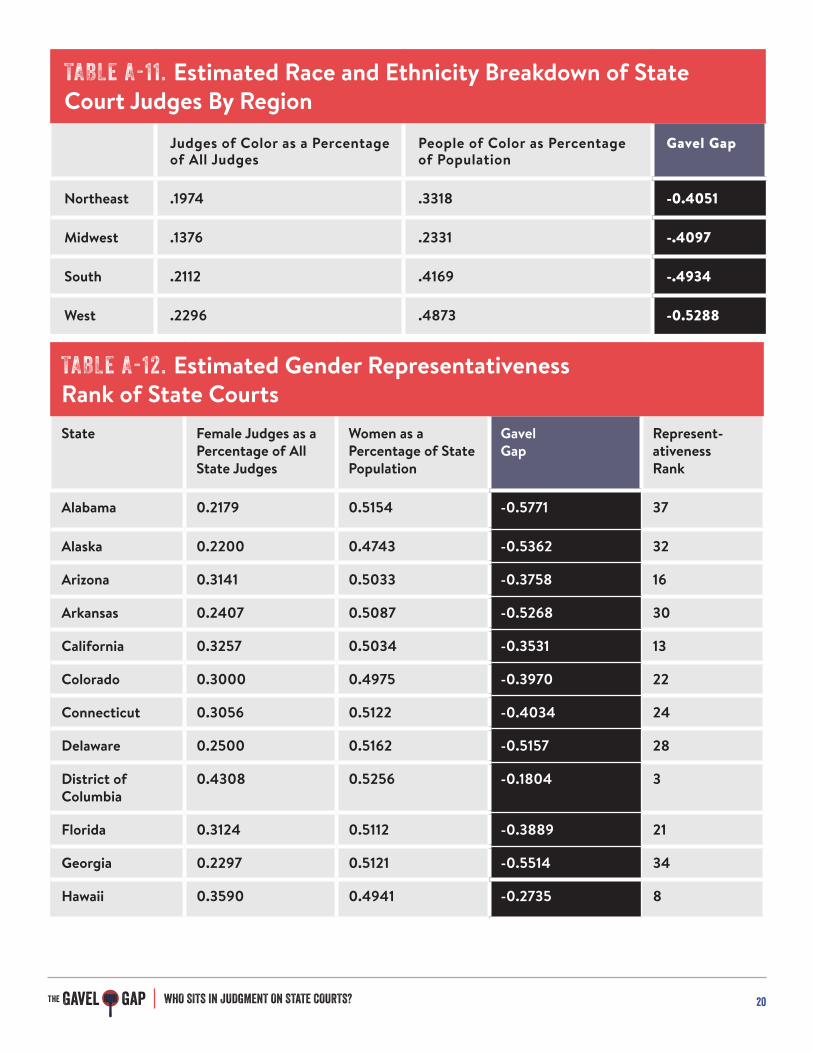
TABLE A-11. Estimated Race and Ethnicity Breakdown of State Court Judges By Region
Judges of Color as a Percentage of All Judges
People of Color as Percentage of Population
Gavel Gap
Northeast .1974 .3318 -0.4051
Midwest .1376 .2331 -.4097
South .2112 .4169 -.4934
West .2296 .4873 -0.5288
TABLE A-12. Estimated Gender Representativeness Rank of State CourtsState Female Judges as a
Percentage of All State Judges
Women as a Percentage of State Population
Gavel Gap
Represent-ativenessRank
Alabama 0.2179 0.5154 -0.5771 37
Alaska 0.2200 0.4743 -0.5362 32
Arizona 0.3141 0.5033 -0.3758 16
Arkansas 0.2407 0.5087 -0.5268 30
California 0.3257 0.5034 -0.3531 13
Colorado 0.3000 0.4975 -0.3970 22
Connecticut 0.3056 0.5122 -0.4034 24
Delaware 0.2500 0.5162 -0.5157 28
District of Columbia
0.4308 0.5256 -0.1804 3
Florida 0.3124 0.5112 -0.3889 21
Georgia 0.2297 0.5121 -0.5514 34
Hawaii 0.3590 0.4941 -0.2735 8

Gavel gapThe WHO SITS IN JUDGMENT ON STATE COURTS? 21
TABLE A-12. Estimated Gender Representativeness Rank of State CourtsState Female Judges as a
Percentage of All State Judges
Women as a Percentage of State Population
Gavel Gap
Represent-ativenessRank
Idaho 0.1698 0.4992 -0.6599 50
Illinois 0.3050 0.5093 -0.4010 23
Indiana 0.2093 0.5074 -0.5875 40
Iowa 0.2362 0.5034 -0.5307 31
Kansas 0.1818 0.5016 -0.6375 47
Kentucky 0.2778 0.5076 -0.4528 26
Louisiana 0.2883 0.5109 -0.4357 25
Maine 0.3182 0.5104 -0.3765 18
Maryland 0.3966 0.5154 -0.2303 6
Massachusetts 0.3704 0.5151 -0.2810 9
Michigan 0.3307 0.5087 -0.3499 12
Minnesota 0.3946 0.5030 -0.2155 5
Mississippi 0.1765 0.5142 -0.6568 49
Missouri 0.2414 0.5095 -0.5262 29
Montana 0.2449 0.4977 -0.5080 27
Nebraska 0.2239 0.5021 -0.5541 35
Nevada 0.4138 0.4974 -0.1682 2
New Hampshire 0.3333 0.5060 -0.3412 11
New Jersey 0.3199 0.5120 -0.3752 15
New Mexico 0.4078 0.5047 -0.1921 4
New York 0.3219 0.5148 -0.3746 14
North Carolina 0.2155 0.5128 -0.5797 38
Gavel gapThe WHO SITS IN JUDGMENT ON STATE COURTS? 22
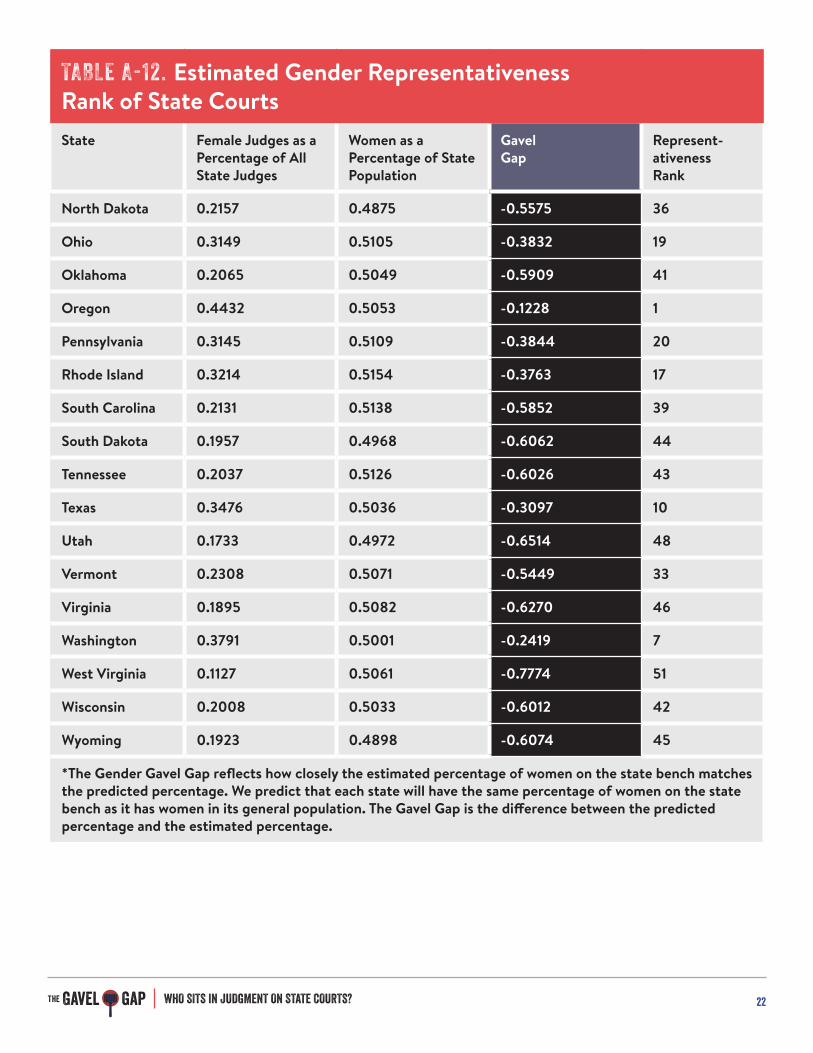
TABLE A-12. Estimated Gender Representativeness Rank of State CourtsState Female Judges as a
Percentage of All State Judges
Women as a Percentage of State Population
Gavel Gap
Represent-ativenessRank
North Dakota 0.2157 0.4875 -0.5575 36
Ohio 0.3149 0.5105 -0.3832 19
Oklahoma 0.2065 0.5049 -0.5909 41
Oregon 0.4432 0.5053 -0.1228 1
Pennsylvania 0.3145 0.5109 -0.3844 20
Rhode Island 0.3214 0.5154 -0.3763 17
South Carolina 0.2131 0.5138 -0.5852 39
South Dakota 0.1957 0.4968 -0.6062 44
Tennessee 0.2037 0.5126 -0.6026 43
Texas 0.3476 0.5036 -0.3097 10
Utah 0.1733 0.4972 -0.6514 48
Vermont 0.2308 0.5071 -0.5449 33
Virginia 0.1895 0.5082 -0.6270 46
Washington 0.3791 0.5001 -0.2419 7
West Virginia 0.1127 0.5061 -0.7774 51
Wisconsin 0.2008 0.5033 -0.6012 42
Wyoming 0.1923 0.4898 -0.6074 45
*The Gender Gavel Gap reflects how closely the estimated percentage of women on the state bench matches the predicted percentage. We predict that each state will have the same percentage of women on the state bench as it has women in its general population. The Gavel Gap is the difference between the predicted percentage and the estimated percentage.
Gavel gapThe WHO SITS IN JUDGMENT ON STATE COURTS? 23
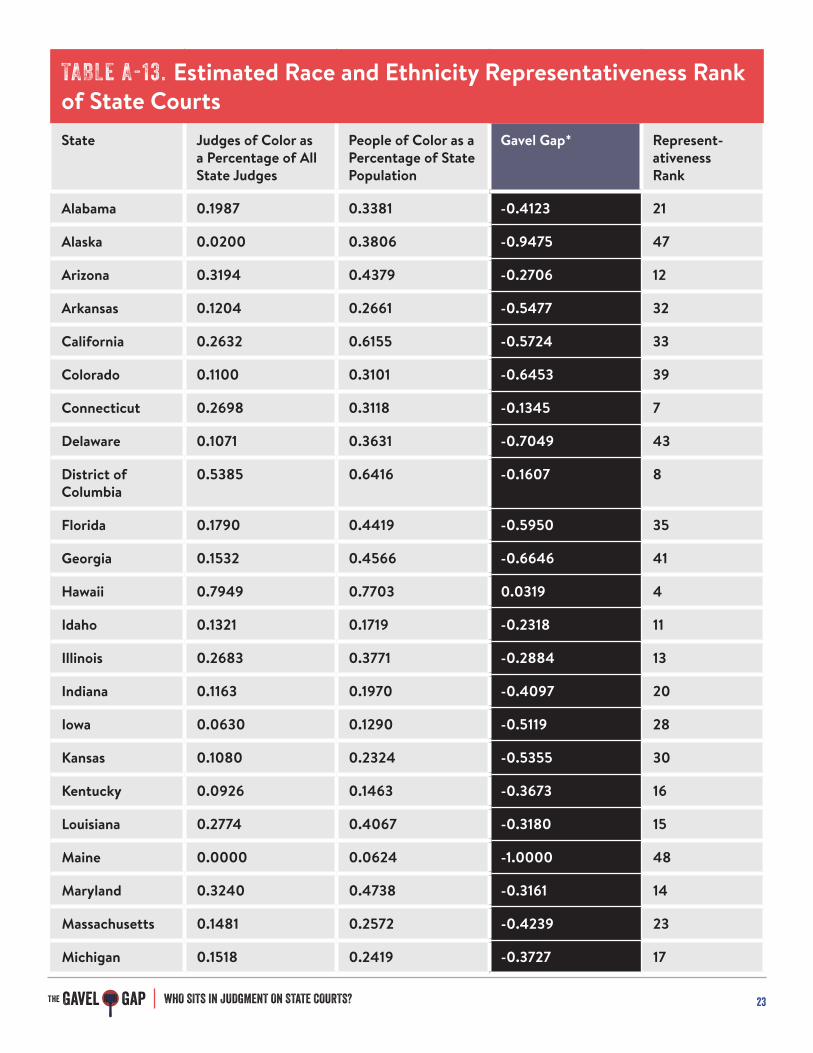
TABLE A-13. Estimated Race and Ethnicity Representativeness Rank of State CourtsState Judges of Color as
a Percentage of All State Judges
People of Color as a Percentage of State Population
Gavel Gap* Represent-ativenessRank
Alabama 0.1987 0.3381 -0.4123 21
Alaska 0.0200 0.3806 -0.9475 47
Arizona 0.3194 0.4379 -0.2706 12
Arkansas 0.1204 0.2661 -0.5477 32
California 0.2632 0.6155 -0.5724 33
Colorado 0.1100 0.3101 -0.6453 39
Connecticut 0.2698 0.3118 -0.1345 7
Delaware 0.1071 0.3631 -0.7049 43
District of Columbia
0.5385 0.6416 -0.1607 8
Florida 0.1790 0.4419 -0.5950 35
Georgia 0.1532 0.4566 -0.6646 41
Hawaii 0.7949 0.7703 0.0319 4
Idaho 0.1321 0.1719 -0.2318 11
Illinois 0.2683 0.3771 -0.2884 13
Indiana 0.1163 0.1970 -0.4097 20
Iowa 0.0630 0.1290 -0.5119 28
Kansas 0.1080 0.2324 -0.5355 30
Kentucky 0.0926 0.1463 -0.3673 16
Louisiana 0.2774 0.4067 -0.3180 15
Maine 0.0000 0.0624 -1.0000 48
Maryland 0.3240 0.4738 -0.3161 14
Massachusetts 0.1481 0.2572 -0.4239 23
Michigan 0.1518 0.2419 -0.3727 17

Gavel gapThe WHO SITS IN JUDGMENT ON STATE COURTS? 24
TABLE A-13. Estimated Race and Ethnicity Representativeness Rank of State CourtsState Judges of Color as
a Percentage of All State Judges
People of Color as a Percentage of State Population
Gavel Gap* Represent-ativenessRank
Minnesota 0.1472 0.1856 -0.2073 9
Mississippi 0.2647 0.4274 -0.3807 18
Missouri 0.1092 0.1988 -0.4508 25
Montana 0.2041 0.1327 0.5374 1
Nebraska 0.1791 0.1951 -0.0821 6
Nevada 0.1954 0.4850 -0.5971 36
New Hampshire 0.0000 0.0872 -1.0000 39
New Jersey 0.2343 0.4315 -0.4571 27
New Mexico 0.3689 0.6109 -0.3961 19
New York 0.2414 0.4347 -0.4446 24
North Carolina 0.2069 0.3591 -0.4238 22
North Dakota 0.0000 0.1340 -1.0000 50
Ohio 0.0938 0.1989 -0.5286 29
Oklahoma 0.0761 0.3298 -0.7693 46
Oregon 0.0973 0.2296 -0.5763 34
Pennsylvania 0.1215 0.2212 -0.4509 26
Rhode Island 0.0714 0.2546 -0.7194 44
South Carolina 0.1148 0.3615 -0.6825 42
South Dakota 0.2391 0.1696 0.4097 2
Tennessee 0.0926 0.2536 -0.6349 38
Texas 0.2568 0.5647 -0.5451 31
Utah 0.0800 0.2066 -0.6127 37
Vermont 0.0000 0.0647 -1.0000 51

Gavel gapThe WHO SITS IN JUDGMENT ON STATE COURTS? 25
TABLE A-13. Estimated Race and Ethnicity Representativeness Rank of State CourtsState Judges of Color as
a Percentage of All State Judges
People of Color as a Percentage of State Population
Gavel Gap* Represent-ativenessRank
Virginia 0.2876 0.3686 -0.2198 10
Washington 0.0995 0.2961 -0.6639 40
West Virginia 0.0845 0.0751 0.1259 3
Wisconsin 0.0492 0.1779 -0.7232 45
Wyoming 0.1538 0.1590 -0.0323 5
*The Race and Ethnicity Gavel Gap reflects how closely the estimated percentage of racial and ethnic minorities on the state bench matches the predicted percentage. We predict that each state will have the same percentage of racial and ethnicity minorities on the state bench as it has racial and ethnic minorities in its general population. The Gavel Gap is the difference between the predicted percentage and the estimated percentage.
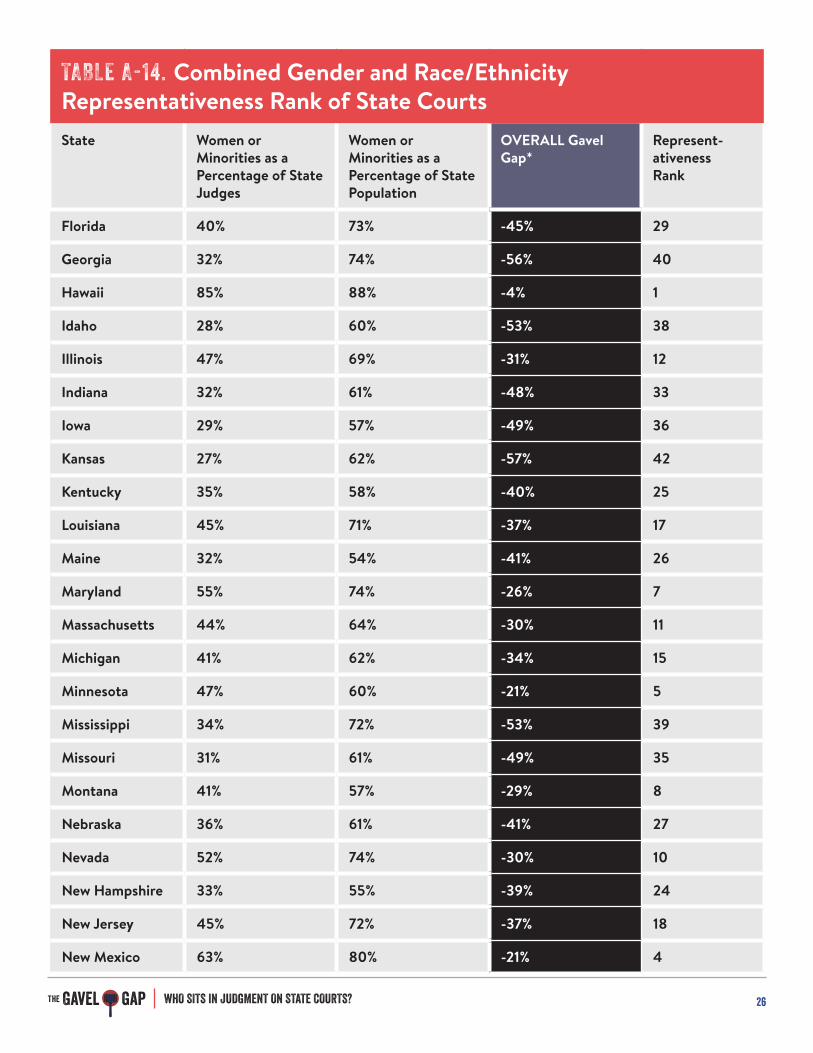
TABLE A-14. Combined Gender and Race/Ethnicity Representativeness Rank of State CourtsState Women or
Minorities as a Percentage of State Judges
Women or Minorities as a Percentage of State Population
OVERALL GavelGap*
Represent-ativenessRank
Alabama 36% 68% -47% 32
Alaska 24% 67% -64% 50
Arizona 54% 73% -26% 6
Arkansas 33% 64% -48% 34
California 49% 81% -39% 23
Colorado 37% 67% -45% 30
Connecticut 46% 65% -29% 9
Delaware 29% 70% -59% 43
District of Columbia
72% 84% -14% 2
Gavel gapThe WHO SITS IN JUDGMENT ON STATE COURTS? 26
TABLE A-14. Combined Gender and Race/Ethnicity Representativeness Rank of State CourtsState Women or
Minorities as a Percentage of State Judges
Women or Minorities as a Percentage of State Population
OVERALL GavelGap*
Represent-ativenessRank
Florida 40% 73% -45% 29
Georgia 32% 74% -56% 40
Hawaii 85% 88% -4% 1
Idaho 28% 60% -53% 38
Illinois 47% 69% -31% 12
Indiana 32% 61% -48% 33
Iowa 29% 57% -49% 36
Kansas 27% 62% -57% 42
Kentucky 35% 58% -40% 25
Louisiana 45% 71% -37% 17
Maine 32% 54% -41% 26
Maryland 55% 74% -26% 7
Massachusetts 44% 64% -30% 11
Michigan 41% 62% -34% 15
Minnesota 47% 60% -21% 5
Mississippi 34% 72% -53% 39
Missouri 31% 61% -49% 35
Montana 41% 57% -29% 8
Nebraska 36% 61% -41% 27
Nevada 52% 74% -30% 10
New Hampshire 33% 55% -39% 24
New Jersey 45% 72% -37% 18
New Mexico 63% 80% -21% 4
Gavel gapThe WHO SITS IN JUDGMENT ON STATE COURTS? 27
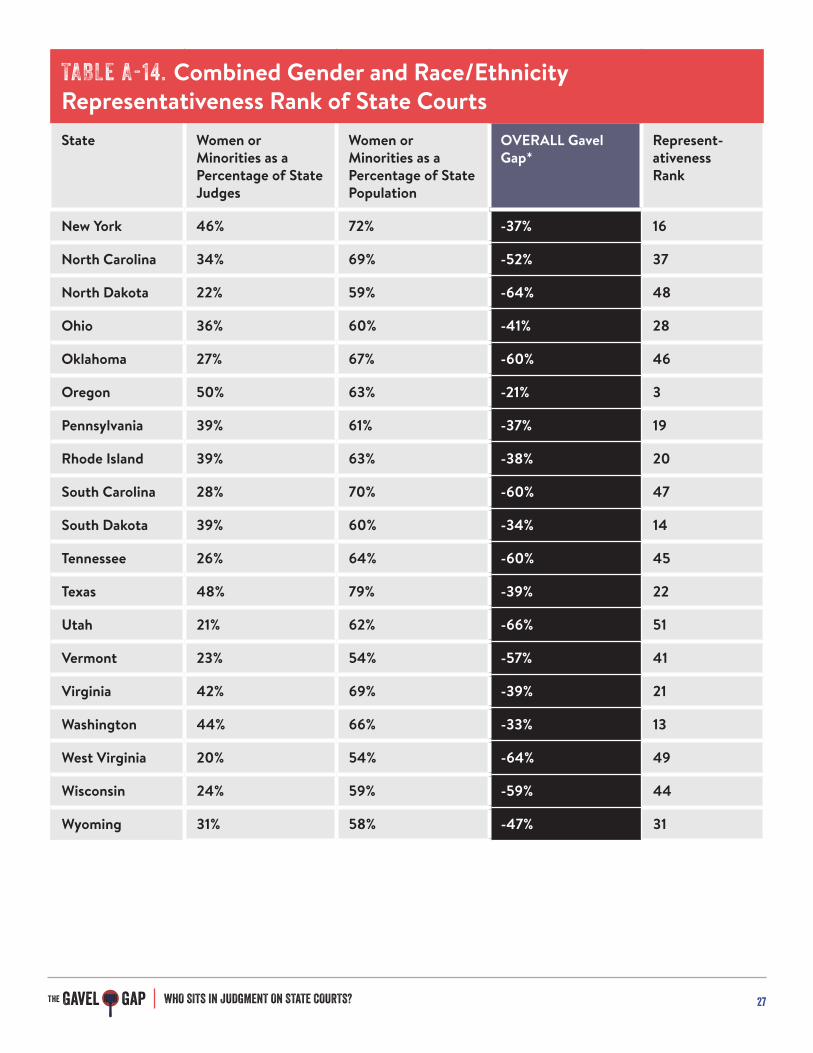
TABLE A-14. Combined Gender and Race/Ethnicity Representativeness Rank of State CourtsState Women or
Minorities as a Percentage of State Judges
Women or Minorities as a Percentage of State Population
OVERALL GavelGap*
Represent-ativenessRank
New York 46% 72% -37% 16
North Carolina 34% 69% -52% 37
North Dakota 22% 59% -64% 48
Ohio 36% 60% -41% 28
Oklahoma 27% 67% -60% 46
Oregon 50% 63% -21% 3
Pennsylvania 39% 61% -37% 19
Rhode Island 39% 63% -38% 20
South Carolina 28% 70% -60% 47
South Dakota 39% 60% -34% 14
Tennessee 26% 64% -60% 45
Texas 48% 79% -39% 22
Utah 21% 62% -66% 51
Vermont 23% 54% -57% 41
Virginia 42% 69% -39% 21
Washington 44% 66% -33% 13
West Virginia 20% 54% -64% 49
Wisconsin 24% 59% -59% 44
Wyoming 31% 58% -47% 31
Gavel gapThe WHO SITS IN JUDGMENT ON STATE COURTS? 28
Sources1 Court Statistics Project, Examining the Work of State Courts: An Overview of 2013 State Court Caseloads, http://www.courtstatistics.org/~/media/Microsites/Files/CSP/EWSC_CSP_2015.ashx (a joint project of the Conference of State Court Administrators and the National Center for State Courts).
2 If a state uses a different method for selecting supreme court judges and intermediate appellate court judges, the appellate judge map reflects the state’s method of selecting supreme court judges.
3 United States Census Bureau, American Community Survey, https://www.census.gov/programs-surveys/acs/news/data-releases.html.
4 Bureau of Justice Statistics, Felony Defendants in Large Urban Counties, 2009 Statistical Tables http://www.bjs.gov/content/pub/pdf/fdluc09.pdf
5 Foster v. Chatman, No. 14-8349 (May 23, 2016).
6 Christopher Kang, “Editorial: President Obama, Nominate the First Asian-American Supreme Court Justice,” NBC News, Feb. 14, 2016, http://www.nbcnews.com/news/asian-america/editorial-president-obama-nominate-first-asian-american-supreme-court-justice-n518496.
7 The governor of New York appoints judges to its intermediate appellate court (Appellate Division) from the general jurisdiction trial courts (supreme court). The governor appoints judges to the state court of last resort (Court of Appeals) from a nominating commission’s list and with the consent of the state senate.
8 United States Census Bureau, Regions and Divisions, http://www.census.gov/econ/census/help/geography/regions_and_divisions.html; United States Census Bureau, United States Population Growth by Region, https://www.census.gov/popclock/data_tables.php?component=growth.