Who Owns the Media? - World Banksiteresources.worldbank.org/INTWDRS/Resources/477365...1 Who Owns...
52
1 Who Owns the Media? Simeon Djankov, Caralee McLiesh, Tatiana Nenova, and Andrei Shleifer 1 World Bank, World Bank, World Bank, and Harvard University June, 2001 Abstract We examine the patterns of media ownership in 97 countries around the world. We find that almost universally the largest media firms are owned by the government or by private families. Government ownership is more pervasive in broadcasting than in the printed media. Government ownership of the media is generally associated with less press freedom, fewer political and economic rights, and, most conspicuously, inferior social outcomes in the areas of education and health. It does not appear that adverse consequences of government ownership of the media are restricted solely to the instances of government monopoly. 1 We thank Mei-Ling Lavecchia, Stefka Slavova, and especially Lihong Wang for excellent research assistance, and Tim Besley, Edward Glaeser, Simon Johnson, Lawrence Katz, Philip Keefer, Aart Kraay, Rafael La Porta, Mark Nelson, Russell Pittman, and Andrew Weiss for helpful comments. Roumeen Islam, Director of the World Development Report 2001, provided valuable input at all stages of the project. The collection of the data was organized and financed by the World Development Report 2001: Institutions for Markets.
Transcript of Who Owns the Media? - World Banksiteresources.worldbank.org/INTWDRS/Resources/477365...1 Who Owns...

1
Who Owns the Media?
Simeon Djankov, Caralee McLiesh, Tatiana Nenova, and Andrei Shleifer1
World Bank, World Bank, World Bank, and Harvard University
June, 2001
Abstract
We examine the patterns of media ownership in 97 countries around the world. We find that
almost universally the largest media firms are owned by the government or by private families.
Government ownership is more pervasive in broadcasting than in the printed media. Government
ownership of the media is generally associated with less press freedom, fewer political and economic
rights, and, most conspicuously, inferior social outcomes in the areas of education and health. It does not
appear that adverse consequences of government ownership of the media are restricted solely to the
instances of government monopoly.
1 We thank Mei-Ling Lavecchia, Stefka Slavova, and especially Lihong Wang for excellent research assistance, and Tim Besley, Edward Glaeser, Simon Johnson, Lawrence Katz, Philip Keefer, Aart Kraay, Rafael La Porta, Mark Nelson, Russell Pittman, and Andrew Weiss for helpful comments. Roumeen Islam, Director of the World Development Report 2001, provided valuable input at all stages of the project. The collection of the data was organized and financed by the World Development Report 2001: Institutions for Markets.
2
I. Introduction
In modern economies and societies, the availability of information is central to better decision
making by citizens and consumers. In political markets, citizens require information about candidates to
make intelligent voting choices. In economic markets, including financial markets, consumers and
investors require information to select products and securities. The availability of information is a crucial
determinant of the efficiency of political and economic markets (Simons 1948, Stigler 1961, Stiglitz
2000).
In most countries, citizens and consumers receive the information they need through the media,
including newspapers, television, and radio. The media serve as the intermediaries that collect information
and make it available to citizens and consumers. A crucial question, then, is how the media should be
optimally organized. Should newspapers or television channels be state or privately owned? Should the
media industry be organized as a monopoly, or competitively? While there is some theoretical discussion
of these issues, our empirical knowledge of the possible forms of organization of the media industry, and
their consequences for economic and political markets, remains extremely limited.
Consider some theoretical issues first. A Pigouvian economist, who believes that governments
maximize the welfare of consumers, would conclude that information should be provided by a
government-owned monopoly. First, information is a public good – once it is supplied to some
consumers, it is costly to keep it away from others, even if they had not paid for it. Second, the provision
as well as dissemination of information is subject to strong increasing returns: there are significant fixed
costs of organizing information gathering and distribution facilities, but once these costs are incurred, the
marginal costs of making the information available are relatively low. For both of these independent
reasons, a strong welfare-theoretic case for organizing the media as a government owned monopoly can
3
be made. Indeed, these arguments were adduced by the management of the newly formed British
Broadcasting Corporation (BBC) in support of maintaining a publicly subsidized monopoly on radio and
television in Britain (Coase 1950), and subsequently repeated in many developing countries.
In the case of the media industry, one additional argument animates the advocates of public
ownership, namely consumer ignorance. In the extreme form, this argument holds that private owners
use the media to serve the governing classes (Lenin 1925). In the more subtle version, argued for many
years by the BBC, state ownership protects the public from exposure to “extreme” views. In modern
versions, state ownership of at least some media is supposed to expose the public to information, such as
culture, which might not be otherwise provided by privately owned firms. This “Sesame Street”
argument, in addition to the standard industrial organization ones, mediates in favor of state ownership of
the media in the minds of many observers.
In contrast, those who believe in less than fully benevolent government are led to a different
conclusion. In their view, a government monopoly in the media would distort and manipulate information
to entrench the incumbent government, preclude voters and consumers from making informed decisions,
and ultimately undermine both democracy and markets. Because private and independent media supply
alternative views to the public, they enable voters and consumers to choose among political candidates,
commodities, and securities – with less fear of abuse by unscrupulous politicians, producers, and
promoters (Sen 1984, 1999, Besley and Burgess 2000). Moreover, competition among media firms
assures that voters and consumers obtain, on average, unbiased and accurate information. The role of
such private and competitive media is held to be so important for the checks-and-balances system of
modern democracy, that they have come to be called “the fourth estate.” A cynical view of a
government’s motives thus leads to a very different prescription for the optimal organization of the media

4
than does the benign view.
Interestingly, even the Pigouvian economists, who adopt the perspective of a benevolent
government when considering other industries and advocate both heavy regulation and nationalization,
avoid this position with respect to the media (Henry Simons 1948, W. Arthur Lewis 1955, Gunnar
Myrdal 1953). Coase (1974) points to this hypocrisy of Pigouvian economists: in the very industry where
the case for state ownership is theoretically attractive, they shy away from taking this case seriously.
Thus, according to Coase: “It is hard to believe that the general public is in a better position to evaluate
competing views on economic and social policy than to choose between different kinds of food (p. 389).”
Nonetheless, the assumption of benevolent government often stops at the doorstep of the media, perhaps
because economists want to protect their own right to supply information without being subject to
regulation.2
These debates notwithstanding, there is precious little evidence on the organization of the media
industries in different countries and its consequences. Our paper aims to fill this gap. We collect data on
ownership patterns of media firms – newspapers, television, and radio – in 97 countries. Our paper
provides a first systematic look at the extent of state and private ownership of media firms around the
world, of the different kinds of private ownership, and of the prevalence of monopoly across countries
and segments of the media industry. Our basic finding is that the two dominant forms of ownership of
media firms around the world is that by the state and by concentrated private owners, i.e., controlling
families.
Demsetz (1989) and Demsetz and Lehn (1985) hypothesize that the “amenity potential”, also
2 Much of the available discussion deals with the traditional industrial organization aspects of the media industry, such as product variety and market power, rather than on the broader social consequences of media ownership (Spence and Owen 1977, Motta and Polo 1997).

5
known as “the private benefits of control” (Grossman and Hart 1988), arising from owning media outlets
is extremely high. In other words, the non-financial benefits, such as fame and influence, obtained by
controlling a newspaper or a television station must be considerably higher than those from controlling a
firm of comparable size in, say, the bottling industry. Economic theory then predicts that private control
of media firms should be highly concentrated: with no controllers to enjoy the amenity potential, widely
held firms are not a stable institutional form. Put differently, the control of widely held firms with a high
amenity potential is up-for-grabs (Bebchuk 1999). Our findings are broadly consistent with these
predictions.
Having established the importance of state ownership of the media, we ask first: in which
countries is government ownership of the media higher? We find that government ownership of the
media is higher in countries that are poorer, have more autocratic regimes, and higher overall state
ownership in the economy. These results cast doubt on the proposition that state ownership of the media
serves benevolent ends.
We then consider the consequences of state ownership of the media, as measured by freedom of
the press, development of economic and political markets, and social outcomes. To this end, we run
regressions of a variety of outcomes across countries on state ownership of the media, holding constant
the level of development, the degree of autocracy, and overall state ownership of the economy.
We find pervasive evidence of “bad” outcomes associated with state ownership of the media
(especially the press), holding country characteristics constant. The evidence is inconsistent with the
Pigouvian view of state ownership of the media. Still, since we only have a cross-section of countries,
we cannot decisively interpret this evidence as causal, i.e., as showing that state ownership of the media
rather than some omitted country characteristic is responsible for the bad outcomes. We note, however,

6
that the omitted characteristic must be quite closely related to the inclination of the government to control
information flows, since we are controlling for a number of dimensions of “badness” in the regressions.
In addition to discussing media ownership patterns and their consequences, we examine the role
of media monopolies. Recall that Lenin and the founders of the BBC insisted on monopoly, for reasons
of technology and benevolent censorship. But even ignoring this particular argument, one can still wonder
whether any government participation in the media is detrimental to freedom or just the state monopoly.
Any government ownership may be bad because the government has the power to advantage the media
firms that it owns. Alternatively, private competition may assure that alternative views are supplied to
voters and consumers, and prevent government firms from distorting the information they supply too
heavily. Only the data can resolve which one of these theoretically plausible views better describes
reality.
Section II describes our data on ownership of the media. Section III examines the economic and
political determinants of media ownership. Section IV then focuses on the consequences of state media
ownership for freedom of the press, the efficiency of economic and political markets, and a range of
social outcomes across countries. Section V addresses the question of whether the effects of government
ownership stem from the very existence of such ownership, or from government monopoly. Section VI
summarizes the findings and concludes.
II. Ownership Data
This section focuses on patterns of ownership in the media industry. Because ownership bestows
control (Grossman and Hart 1986), it shapes the information provided to voters and consumers.
Ownership, of course, is not the only determinant of media content. In many countries, even with private

7
ownership, the government regulates the media industry, provides direct subsidies and advertising
revenues to media outlets, restricts access to newsprint and information collection, and harasses
journalists. We discuss these modes of control as well.
Construction of the Database
We gather new data on media ownership in 97 countries. We focus on newspapers and
television, since these are the primary sources of news on political, economic and social issues.
Data on radio ownership are limited. Radio reaches a high proportion of the population, even in
the lowest income and literacy countries, but it largely delivers entertainment. The radio market is also
highly regional, which precludes any single station from achieving a large market share. As a crude index,
we gather ownership data on the top radio station as measured by peak adult audience, and on an “all-
news” radio station when one exists in a country.
Our selection of sample countries is driven by data availability. First, we identify the countries for
which we have information on control variables. Since we are interested in the consequences of state
ownership of the media, we need to make sure that our results are not driven by differences in the levels
of economic development, the level of political competition, or of broad state intervention in the economy.
To this end, we control for general levels of state ownership in the economy, a measure of autocracy,
and GNP per capita. We use the Fraser Institute (2000) index of the involvement of state owned
enterprises (SOEs) in the economy, which is based upon the number of SOEs, their prevalence in
particular sectors of the economy, and their share of gross domestic output. 3 A total of 133 countries
have the SOE index, GNP per capita, and autocracy data for 1999. Of those, we exclude 5
3 For 6 countries, we construct this index using World Bank’s (2000) data on state enterprises.
8
observations because a) the country is in civil war (Democratic Republic of Congo, Sierra Leone), or b)
the entity cannot be classified as a country (Hong Kong), or c) no daily newspapers exist (Belize,
Tajikistan). We also exclude 31 countries lacking sufficient data on media ownership. The final sample
of 97 countries includes 21 in Africa, 9 in the Americas, 17 in Asia and the Pacific, 7 in Central Asia and
the Caucasus, 16 in Central and Eastern Europe, 11 in Middle East and North Africa and 16 in Western
Europe.
Within countries, we select media outlets on the basis of market share of the audience and
provision of local news content for the year 1999. This approach focuses on who controls the majority of
information flows on domestic issues to citizens. We exclude entertainment and sport media, as well as
foreign media outlets, if they do not provide local news content. We include in our sample the five largest
daily newspapers, as measured by share in the total circulation of all dailies, and the five largest television
stations, as measured by share of viewing.4 We consult three primary data sources to selecting these
outlets. First, we use Zenith Media Market and Media Fact Book 2000 publications, which are
organized by region, including Western Europe, Central and Eastern Europe, Asia Pacific, Middle East
and Africa, and the Americas. Zenith Media’s rankings of newspapers are checked with the World
Association of Newspapers (WAN) World Press Trends 2000 report. WAN data are also used as the
source for total newspaper circulation, which is not reported by Zenith Media. Finally, we use the
European Institute for the Media Media in the CIS report as a primary source for countries in the former
4 Following the World Association of Newspapers definition, newspapers are considered dailies if they are published at least four times per week. In the initial phase of the data gathering (first 12 countries) we focused on the top 10 media enterprises in the daily newspaper and television markets. We subsequently reduced the sample to five firms per media, for two reasons. First, the difference in market coverage from increasing the sample of companies from five to 10 was marginal. In the first 12 countries, the top five newspapers account for an average of 62.4% of total circulation, and the top 10 for 74.1%. The correlation between the two is 94.2%. For the sample as a whole, the top five newspapers account for an average of 66.7% of total circulation. Television markets are even more concentrated – on average the top five firms cover 89.5% of total viewing. Second, 20 countries in our sample do not have more than five daily newspapers, and 42 countries
9
Soviet Union. Alternative sources are sought in two cases: when there is an inconsistency in data
reported by primary sources, or when none of the sources covers the country in question. When this
occurs, we use local media survey firms, World Bank external affairs offices, U.S. Department of State
information offices, and direct contact with the media outlets.
Where possible, we rely on company annual reports and WorldScope database for information
on ownership of media firms. Many of our sample companies are not covered by WorldScope, and
operate in countries with limited disclosure requirements. Accordingly, we also use business news reports
in Lexis Nexis and the Financial Times databases, country specific company handbooks, media surveys
and internet information services (see Table 1 for a description of the variables and the main data
sources). In all cases, we verify the ownership and other information externally by contacting World
Bank External Affairs offices, Embassies in Washington DC, and regional or in-country media
organizations.
Ownership data are for December 1999 or the closest date for which reliable data was available.
For the majority of firms in the sample, ownership structures are stable over time. Timing is a significant
issue only in the transition economies, where many media enterprises have been privatized or have
increasing rates of foreign ownership. For these countries, we strictly enforce the December 1999 date
of ownership information, even when we have more recent data.
We follow La Porta, Lopez-de-Silanes, and Shleifer (1999) in identifying the ultimate controlling
shareholder of each media outlet. We focus explicitly on voting rights as opposed to cash flow rights
ownership of firms. For each firm, we identify the legal entities and families who own significant voting
do not have more than five television stations.
10
stakes.5 This provides us with the first level of ownership. For each legal entity, then, we identify its
ownership structure by determining all significant vote holders -- the second level of ownership. We
continue to identify vote holders at each level of ownership until we reach an entity for which it is not
possible to break down the ownership structure any further.
The entity that ultimately controls the highest number of voting rights, but no less than 20% at
every link of the chain, is defined as the ultimate owner. Such control can be gained through direct
ownership of more than 20% of voting rights of a media enterprise, or indirectly through a chain of
intermediate owners. For example, an individual X may control newspapers Z when he holds over 20%
of the voting rights in Company Y, which in turn owns over 20% of the voting rights in Z. With indirect
holdings, we define the percentage of ultimate ownership as the minimum holding along the chain of
control.
After identifying the ultimate owner, we classify each media outlet into one of the four main
categories of owners: the state, families,6 widely held corporations, and “other.” Examples of other
controlling entities are employee organizations, trade unions, political parties, the Church, not-for-profit
foundations, and business associations. We define a corporation as widely held if there is no owner with
20% or more of the voting rights. We also keep track of whether the ultimate owner is a foreign family,
entity or government.7
5 The cut-off level of voting stakes depends on the mandatory disclosure levels in the country. In no case, however, is that threshold higher than 5%. 6 We use families as a unit of analysis and do not look within families. 7 In a few instances, the owner of voting rights in a media firm does not hold the broadcast license. In these cases, firm and not license ownership determines control. We do this because control of all broadcast licenses ultimately belongs to the government, and licenses can be revoked depending on the strength of property rights in a country.

11
Examples of Media Ownership
The construction of the ownership variables is best illustrated through examples of ownership
structures of individual firms. We start with a simple case of family ownership. In Argentina, the third
largest newspaper, with a daily circulation of 177,000, is La Nacion. The owner of each share in La
Nacion is entitled to one vote. There are two large shareholders in La Nacion (Figure 1): the Saguier
family, with 72% of capital and votes, and Grupo Mitre, with 28% of capital and votes. Grupo Mitre is in
turn 100% owned by the Mitre family. Although the Mitre family holds an indirect control of 28% in La
Nacion, we follow the chain of control of the largest shareholder at each level of ownership. We
therefore record the Saguier family as the ultimate owner, and classify La Nacion as family owned.
A more complex example of family ownership is the Norwegian television station TVN (Figure
2). TVN is the second largest television station with local content in Norway, as measured by share of
viewing. It is 50.7% controlled by Scandinavian Broadcasting Systems (SBS), and 49.3% by the largest
Norwegian television station, TV2. We follow the chain of control along SBS rather than TV2, since
SBS holds the majority of votes in TVN. Although Mr Sloan (the Chairman and CEO of SBS) holds a
9.8% share of voting rights in SBS, the only voting interest above 20% is held by the Netherlands United
Pan-Europe Communications (UPC), with 23.3% of the vote. The majority shareholder of UPC is
UnitedGlobal Com (51%). UnitedGlobal Com is in turn controlled by the Schneider family, through a
combination of 3 direct interests totaling 21.9%, as well as 50% control of a voting agreement with
69.2% control of votes. We classify TVN as family owned and the Schneider family as the ultimate
owner.
State ownership takes different forms. The British Broadcasting Corporation (BBC) is classified
as state owned. It is funded by government license fees and advertising. The Board of Governors is

12
appointed by Royal Prerogative, in practice the Prime Minister, and is accountable to the government.
The BBC Charter specifies a number of safeguards to ensure its independence from government
interference. By comparison, the largest television station in Myanmar is controlled directly by the
Ministry of Information and Culture, and the second largest station is controlled directly by the Myanmar
Military. In both cases the state retains full powers to manage content and appoint and remove staff.
Similarly, in Turkmenistan, the state maintains direct control over the press: President Niyazov is officially
declared the founder and owner of all newspapers in the country.
In a number of cases, we need to distinguish between state and political party ownership. In
Kenya, the ruling party Kenyan African National Union (KANU) is the ultimate owner of the daily
newspaper Kenya Times, the country’s fourth largest daily. Yet we do not classify Kenya Times as state
owned, because if there were a change of government the ownership would remain with KANU. In
contrast, control of the Kenyan Broadcasting Corporation (KBC) would remain with the state regardless
of the political party in power, so we classify KBC as state owned. Ruling party ownership also occurs in
Malaysia and Cote d’Ivoire. We place these firms in the ‘other’ category, along with more clear-cut
cases of media owned by opposition political parties. In several cases, family ownership is closely
associated with the state. In Kazakhstan, President Nazarbayev’s daughter and son-in-law between
them control seven of the 12 media outlets in our country sample. In Saudi Arabia, members of the
Royal Family are the ultimate owners of two of the five most popular dailies. In cases where there is a
direct family relationship between the ultimate owner and the head of state, and the governing system is a
single party state, we classify the media enterprise as state owned.
Other associations between families and state are prevalent throughout our sample. In Ukraine,
the Deputy Prime Minister holds over 30% of the top television station, while in Malawi the owner of the
13
Nation newspaper is the Minister of Agriculture and Vice-President of the ruling UDF party. Neither of
these positions are head of state in single party governments and we therefore classify both media outlets
as family owned. Other unofficial links to the state were documented in country files, but did not influence
our classification of ultimate ownership. In Russia, the close associations between the owner of one of the
main TV stations, Mr Berezovsky, and the then-President Yeltsin are well documented.8 In Indonesia,
the daughter of ex-President Suharto still controls one of the main television stations. In an effort to be
conservative in our measures of state control, in all these cases we classified the media outlets as family
owned, since a change in government would sever the link between the politician and the media owner.
Media regulations and ownership
Throughout the world, governments regulate media using measures ranging from content
restrictions in broadcasting licenses to Constitutional freedom of expression provisions. The types of
regulations and their enforcement vary significantly within our sample countries.
In some cases, ownership is influenced directly by regulation. In Norway, for example,
regulations restrict owners from holding more than one third of shares in media enterprises. Similar
restrictions on ownership apply in Israel. Regulations of foreign ownership and cross media ownership
are also prevalent. Of the 49 countries surveyed by the World Association of Newspapers, 14 have
explicit restrictions on foreign ownership of newspapers. In Brazil, for example, foreign ownership of
voting capital of media enterprises is prohibited, and foreign participation in non-voting capital is limited to
30%. Not surprisingly, foreign owners are absent from the Brazilian sample. A further 21 of WAN
countries regulate cross media ownership. In Australia, proprietors of major metropolitan newspapers
8 Mr Berezovsky wrote that “…we helped Yeltsin defeat the Communists at the polls, using privately owned TV
14
are not permitted to own controlling interests in free-to-air television stations in the same market. As a
result, the ultimate owner of the Nine Network television station, the Packer family, is limited to a 14.99%
ownership stake in the one of Australia’s leading publishers, John Fairfax Holdings.
Our data do not account for regulations that can substitute for state ownership as a means to
control content. Singapore Press Holdings (SPH) publishes all of the top 5 daily newspapers in Singapore
(Figure 3). Shares of SPH are divided into two categories: ordinary shares, which carry one share per
vote, and management shares, which carry 200 votes per share. The ownership structure of SPH is
characterized by complex cross holdings, with three major groups of shareholders evident in the data.
First, the Lee family controls a total of 47.23% of votes through 4 companies. Second, the state holds a
total of 27.23% of votes through various intermediary institutions. Third, there are a number of minority
shareholdings held in nominee accounts at widely held financial institutions.9 Ownership of nominee
accounts is not disclosed. It is possible that they are owned by families or the state, in which case our
estimate of their control is conservative. We classify the Lee family as the ultimate owner of SPH. Yet
by law, the government must approve the owners of management shares of SPH, and can require owners
to sell shares. We say that SPH is family owned, and note that this is a conservative measure of the true
influence of the state over SPH.
We use similar approaches in other cases of structural government influence of media firms. In
Saudi Arabia, the government approves the appointment of editors-in-chief of newspapers, and also has
the right to dismiss them. Although clearly this increases the influence of the state on press content, we
stations.” Washington Post, Oct. 26, 2000, p. A27. 9 In particular, Raffles Nominees Pre Ltd holds 7.74% in SPH, 10.11% in Overseas Union Bank Ltd, and 19.44% in United Overseas Bank Ltd. GSBC Nominees Pte Ltd controls 3.98% of SPH, 5.88% of the Overseas-Chinese Banking Corporation, 3.42% of Overseas Union Bank, and 4.31% of United Overseas Bank. Finally, Citibank Nominees Ltd controls 1.63% of SPH, 3.82% of the Overseas-Chinese Banking Corporation, 4.08% of Overseas Union Bank, and 2.77% of United Overseas Bank.
15
apply a conservative definition of state ownership and classify these newspapers as family owned. In
Malaysia, newspapers are required to renew their licenses annually. Editors of newspapers that publish
critical views of government have been pressured to resign.10 In this environment, self-censorship
becomes the norm. In all these instances, we nonetheless rely on ownership in constructing our measures,
thus underestimating state influence.
State subsidies and state advertisement revenues enable governments to influence media content.
Such subsidies are common in transition and African countries. In Cameroon, for example, the state
refused to advertise in privately owned press after critical coverage of government. Defamation laws also
influence content by repressing investigative journalism.
Direct regulations of content may interact with ownership. The North Korean Constitution states
that the role of the press is to “serve the aims of strengthening the dictatorship of the proletariat, bolstering
the political unity and ideological conformity of the people and rallying them solidly behind the Party and
the Great Leader in the cause of revolution.”11 In the Netherlands, the content of public service
programming must be at least 25% news, 20% culture, and 5% education. Italy requires that 50% of
broadcasting be of European origin. Because of these extensive regulations, our ownership classification
is a conservative estimate of the true influence of the state over content.
Variable Construction
We construct two ownership variables from these data. First, we compute the percentage of
firms in each category – state or private. For example, two out of the top five newspaper enterprises in
10 Report of United Nations Special Rapporteur on the Promotion and the Protection of the Right to Freedom of Opinion and Expression, mission to Malaysia, 23 December 1998. 11 1975, Article 53 Chapter 4 of the Constitution.
16
the Philippines are classified as state owned, as are three out of the top five television stations. We
record Philippine newspaper market ownership as 40% state owned when measured by count, and
television market ownership as 60% when measured by count. Second, we weight the ownership
variable by market share. In the Philippines, the two state owned newspapers account for 22.2% and
21.3% of circulation for the top 5 newspapers respectively, so the newspapers are 43.5% state owned
when measured by market share. In television, the three state owned Philippine stations account for only
17.5% of the share of viewing for the top 5 television stations, so the television market is 17.5% state
owned as measured by market share.
The market share variables, while more precise as a metric of state control, have the disadvantage
that, in the countries with regional newspapers, such as the United States, the market share of any single
firm is small. As a consequence, the variables we define are not properly compared to those in countries
with national newspapers. This criticism, of course, is less compelling for television firms, which are
typically national. The regressions presented below use market share variables, but our results are
virtually identical using the counts.
For the radio market, we create a dummy equal to 1 if the top radio station is state owned, and 0
otherwise.
III. Patterns in Media Ownership
Descriptive Statistics
Table 2 presents descriptive statistics on the ownership of newspaper and television markets in
97 countries. Countries are organized first by region and then sorted in alphabetical order. Several
patterns emerge from the data.
17
Our first significant finding is that families and the state own the media throughout the world
(Figure 4). In the sample of 97 countries, only 4% of media enterprises are widely held. Less than 2%
have other ownership structures, and a mere 2% are employee owned. On average, family controlled
newspapers account for 57% of the total, and family controlled television stations for 34% of the total.
State ownership is also vast. On average, the state controls approximately 29% of newspapers and 60%
of television stations. The state owns a huge share – 72% - of the top radio stations. Based on these
findings, for the remaining analysis we classify ownership into 3 categories: state, private (which is the sum
of family, widely held and employee categories), and other.
The nearly total absence of firms with dispersed ownership in the media industry is extreme, even
by comparison with the La Porta et al. (1999) finding of high levels of ownership concentration in large
firms around the world. This result is consistent with the Demsetz (1989) and Demsetz and Lehn (1985)
insight that the large amenity potential of ownership media outlets creates competitive pressures toward
ownership concentration. In a sense, both the governments and the controlling private shareholders get
the same benefit from controlling media outlets: the ability to influence public opinion and the political
process.
We say that the state has a monopoly in a media market if the share of state controlled firms
exceeds 75%. As Table 2 shows, a total of 21 countries have government monopolies of daily
newspapers, and 43 countries have state monopolies of television stations with local news. Table 2 also
shows that families and the state control the media regardless of whether ownership is measured by count
or weighted by market share.
Television has significantly higher levels of state ownership than newspapers. 12 To explain this
12 Only five countries (Ghana, Philippines, Uganda, Ukraine and Uzbekistan) have more state control of the top 5
18
finding, a Pigouvian would focus on public goods, and note that television broadcasts are at least in part
non-excludable and non-rivalrous. Television also has higher fixed costs than publishing, and more
significant economies of scale. The private sector might then under-provide broadcasting services,
particularly in smaller markets serving remote areas, ethnic minorities or students. These theories are
central to many of the laws on public broadcasters in Europe. Alternatively, from the political
perspective, privately owned newspapers are easier to censor than privately owned TV. Because
television can be broadcast live, control of content is more likely to require ownership. In this case,
governments that want to censor news would own television.13
The simple statistics presented so far raise many questions. The evidence suggests that there are
large private benefits of media ownership. Throughout the world, media are controlled by parties likely to
value these private benefits: the families and the state. In particular, the extent of state ownership of the
media (particularly in TV and radio) is striking, suggesting that governments extract value through control
of information flows in the media. We cannot as yet tell from this evidence whether high government
ownership derives from a benign attempt to cure market failures and protect consumers, or from a less
benign attempt to control the flows of information. In the subsequent analysis, we attempt to distinguish
these two hypotheses.
Determinants of Media Ownership
In this section, we examine how ownership patterns are associated with different characteristics of
newspapers than television stations. 13 A further argument is that the extent of required regulation of TV is higher because of difficulties in defining property rights for broadcasting frequencies. It may be optimal from an efficiency standpoint for the state to control television stations directly, as opposed to regulating the sector and spending resources in monitoring compliance. These arguments have been disputed by Coase (1959) and others, who do not see any need for government ownership and regulation arising from the peculiar technological features of broadcasting frequencies.
19
countries. We examine very basic determinants of media ownership, such as geography, the level of
development, the government’s proclivity to intervene in the economy, and political regime. For all of
these characteristics, it is hard to argue that causality runs from media ownership to these very basic
country characteristics rather than the other way around.
Table 2 shows that the data exhibit distinct regional patterns. State ownership of newspapers and
television is significantly higher in African and Middle East and North African (MENA) countries. On
average, governments in Africa control of 61% of the top 5 daily newspaper circulation and reach 85% of
the audience for the top 5 television stations. Two-thirds of African countries have state monopolies on
television broadcasting. With the exception of Israel, all MENA countries have a state monopoly over
television broadcasting. State ownership of newspapers – which averages 50% share of circulation - is
also high in MENA countries.
By contrast, newspapers in Western Europe and the Americas are held predominately privately.
In Western Europe none of the top five daily newspapers are owned by the state. In the Americas, the
majority of the newspapers have been owned and managed by single families for many decades. State
ownership of television is also overwhelmingly lower in the Americas than in other regions. None of the
top 5 stations in Brazil, Mexico, Peru and the United States are state owned; this occurs in only one other
country (Turkey) in our sample. In Western Europe, in contrast, a substantial number of public
broadcasters push the regional state ownership average to 48% by count and 55% by share.
Countries in the Asia-Pacific, Central and Eastern Europe, and the former Soviet Union have
ownership patterns closer to the sample mean. 14
14 Ownership within each of these regions varies dramatically. Indonesia and Thailand have low state ownership of the media, compared with full state monopolies in North Korea and Myanmar. The predominantly privately owned media in Estonia and Moldova contrasts with the full s tate control in Belarus and Turkmenistan.

20
Poorer countries have higher state ownership of newspapers and television (Table 3a). State
ownership is reported after dividing the sample into quartiles of GNP per capita in 1999. The average
state ownership of newspapers (by share) falls sharply from 49.7% for the lowest income quartile to
0.0% for the highest income quartile. In television, the lowest income quartile averages 78.0% state
ownership (by share), compared with 52.7% for the highest income quartile.
Countries with higher state ownership in the economy as a whole also have higher ownership of
the media (Table 3b). Countries in the lowest quartile of SOE index, which reflects high economy-wide
state ownership, average 48.5% state newspaper ownership (by share) and 78.6% television ownership
(by share). In contrast, countries in the highest quartile of SOE index (low economy-wide state
ownership) average only 20.3% state ownership of newspapers (by share) and 60.4% state ownership of
television (by share).15
Table 3c shows that autocratic governments are more likely to own media outlets. The
relationship is monotonic over the autocracy quartiles.
In Table 3d, we consider whether per capita income, autocracy, and the SOE index have
independent influences on state ownership of the media. Generally, all three variables have a significant
effect in a regression. In the analysis of the consequences of state ownership of the media, we
accordingly control for per capital income, the SOE index, and the autocracy measure.
Table 3e presents data on the incidence of state media monopolies – defined as a more than 75%
15 We also considered how state ownership varies according to the origin of commercial law in a country. Legal origins are classified into 5 categories: English, French, German, Socialist, and Scandinavian. Two countries (Iran and Saudi Arabia) cannot be classified in any of these groups since they practice traditional Islamic law. Legal origin has been interpreted as a proxy for the strength of property rights and inclination of the government to intervene in an economy (La Porta et al., 1998, 1999). It could, therefore, be argued that legal origin influences the extent to which a state chooses to control media. We find that, in television, the average state ownership is remarkably similar across legal origins. State ownership of newspapers in countries of German and Scandinavian is significantly lower than French and Socialist origin countries. For every other combination, state ownership of television or newspapers does

21
market share – around the world (with the exception of Singapore there are no private media monopolies
in our sample). Two interesting findings emerge from the table. First, state monopoly is considerably
more common in the television than in the newspaper market. Second, state monopoly is largely a feature
of poor countries – there are almost no incidents of state monopolies of newspapers, and relatively few of
television, in the upper two quartiles of income distribution. These data themselves do not distinguish
among theories - a Pigouvian can easily explain why television and low income levels call for state
monopoly.
Still, the preliminary evidence presents considerable challenges to the benign (Pigouvian) view of
government ownership of the media. The less developed, more interventionist, and more autocratic
countries are the ones with higher state ownership of the media. The market failure argument for state
ownership suggests the opposite: the richer, more democratic countries should cure market failures
through state ownership. In the following analysis, we pursue the same issue by examining the
consequences of state ownership of the media.
IV. The Consequences of State Ownership of the Media
In this section, we consider some of the consequences of state ownership of the media for a
number of social indicators, such as freedom of the press, the functioning of political and economic
markets, and social outcomes such as infant mortality and education attainment.
In this analysis, it is important to us to be able – to the extent possible – to link the various
outcomes to the state ownership of the media, rather than other characteristics of the society. We have
shown that poor countries, with interventionist and non-democratic governments exhibit higher state
not vary significantly according to legal origin.

22
ownership of the media. Accordingly, we control for GNP per capita, an index of the involvement of
state owned enterprises (SOEs) in the economy, and the autocracy score in all regressions. Such
controls do not assure us an unambiguous causal interpretation of the relationship between state
ownership of the media and the various outcomes. It is still possible that state ownership of the media
proxies for some unobserved aspect of “badness.” However, if state ownership helps predict bad
outcomes holding constant our extensive controls, it must be closely related to the omitted “badness.”
For example, the omitted characteristic of a country must reflect the state’s interest in controlling the
information flows, or something close to that.
For ease of interpretation, we have coded all the outcome variables, as well as the controls, so
that high is good. Thus a high value of the corruption or infant mortality variable corresponds to low
corruption and low infant mortality, respectively.
Freedom of the Press
Perhaps the clearest way to compare alternative theories of state ownership of the media is by
focusing on freedom of the press. After all, the main implication of the Pigouvian theories is that greater
government ownership should if anything lead to greater press freedom, as media avoid being captured by
individuals with extreme wealth or extreme views.
Table 4 presents the results from the regressions of “objective” measures of media freedom on
state ownership of the media. We measure media freedom by actual cases of harassment of journalists
and media outlets, compiled from Reporters Sans Frontieres (RSF) 1999 reports on journalists jailed and
media outlets closed by governments. Another measure was constructed from the reports by the
Committee to Protect Journalist (CPJ, 1997-1999) on actual numbers of journalists jailed. We also
look at a measure of internet censorship.

23
Table 4 shows a negative impact of government ownership of the media on media freedom,
holding per capita income, interventionism, and autocracy constant, with just under half of the coefficients
being statistically significant. Media tend to be more independent, and journalists arrested and jailed less
frequently, when media are privately owned. A closer look at the data reveals a complex picture.
Journalist harassment is high in Turkey, Kenya, and Nigeria, where the media is predominately privately
owned, perhaps because it substitutes for state control through ownership. But harassment is also high in
some countries with high state ownership of the media, such as Angola, Belarus, Iran and China.
Furthermore, some countries with state media monopolies – such as North Korea and Laos - exhibit a
‘Castro effect’: state control is so powerful that there is no need to further restrict freedom through
journalist harassment.16
Table 4 also establishes that countries with higher state media ownership censor the internet more
heavily, as measured by a dummy that equals to one if the government does not monopolize internet
access and content (as measured by CPJ reports). This association can be interpreted to mean that state
ownership distorts information flows.
Political Markets
We examine the consequences of media ownership for two aspects of political development.
First, we consider the effect of media ownership on civil, political, and human rights of a country’s
citizens. If information flows are essential for the exercise of citizens’ rights, and if government ownership
of the media influences information flows, we should see an association between government ownership
and the rights. Second, information flows may facilitate public oversight of government, and increase the
16 We have also measured freedom of the press using subjective indicators from van Belle (1997) and Freedom House
24
accountability of politicians for bad conduct. In this case, government ownership of the media would
reduce the effectiveness of the government and increase corruption (Sen 1984, 1999, Besley and Burgess
2000, Stapenhurst 2000). In this analysis, we again control for per capita income, government ownership
of SOEs, and autocracy.
The results are reported in Table 5. Government ownership of the press typically has a negative
effect on citizens’ rights, government effectiveness, and corruption. The effect of government ownership
of the press is in many instances statistically significant, that of government ownership of television and
radio generally is not. These results are most naturally consistent with the view government ownership of
the press restricts information flows to the public, diminishing the value of citizens rights and the
effectiveness of government.17
Studies of election coverage illustrate the effect of state ownership of the media on the supply of
political information. In Ukraine, election monitors from the Organization for Security and Cooperation in
Europe recorded significant biases in media coverage related to ownership. Although all major television
stations devoted more time to the incumbent than the opposition candidate, the state owned television
was more unbalanced in coverage and biased in content (despite legal requirements for the state owned
media to provide balanced and neutral coverage). Of its total first round election related coverage, the
state owned UT1 devoted 51% to the incumbent, and 75% of that coverage was positive. Each of the 6
opposition candidates received substantially less coverage (a maximum of 16.7%), and the vast majority
of opposition coverage was negative. The television channel Inter displayed similar prejudice – 48.5% of
coverage was allocated to the incumbent and 73% of that coverage was favorable. Although Inter is
(2000). The effects of state ownership on these measures of freedom were also negative, but in general insignificant. 17 Our results are also unsurprising in a broader historical context. Dictators from Napoleon, to Lenin, to Hitler, to Marcos nationalized the press. The small independent press, with its “xerox and cassette journalism,” helped
25
classified as privately owned, it has strong informal links to the state because one of the three
shareholders is the First Deputy Speaker of Parliament.18 The channel 1+1 is 51% privately and foreign
owned, with a 49% non-voting minority stake held by the State Property Company. 1+1 devoted 34%
of coverage to the incumbent, and 50% of that coverage was positive. Finally, STB, which is privately
owned, was the least biased of the four stations. STB dedicated 23% of their coverage to the incumbent,
with 40% of that coverage recorded as favorable.
Experience in several countries also highlights the importance of media ownership in pressuring for
better governance. In Mexico, privatization of broadcasting led to a dramatic increase in the coverage of
government corruption scandals (Simon, 1998). Introduction of a new privately owned media in Ghana
led to greater coverage of government activities as well as more criticism of government. In Kenya,
privatized press exposed a public corruption case while government-owned press defended the accused
government officials.
Our results are generally much stronger for the press than for television. For the latter, the effects
of government ownership are generally insignificant. One reason might be that private press, which is
more common, provides a check on state television, ensuring freer flows of information than would occur
if both were in state hands. The data confirm that the outcomes are worse when the state owns both
newspapers and television than when it owns only one of them.
Economic System
The supply of information by the media can also improve the performance of the economic
overthrow the Marcos regime in 1986 (Maslog 2000). 18 The shareholdings are approximately equally distributed - 33%; 33% and 34% - between three individuals, with the Deputy Speaker holding one of the 33% stakes.

26
system, in two ways. The first is derivative of the improvements in political markets. When citizens are
better informed, they may – through political action -- become more effective in limiting the ability of the
government to hurt them economically, by for example confiscating property or over-regulating
businesses. Economic governance indicators, such as the security of property rights from confiscation
and intervention and the quality of regulation should therefore be higher in countries where media function
more effectively. The second way in which media can contribute to economic performance is by
supplying information that improves markets. One area where this channel is clear is financial markets,
which are especially information-sensitive. A better information flow to these markets can facilitate better
pricing of securities, reveal the abuse of power by corporate insiders, and thereby encourage financial
development.19 In this spirit, we examine the relationship between patterns of media ownership and
financial market indicators.
In Table 6, we find that higher state ownership of the media is associated with weaker security of
property, as measured by Freedom House security of property rights index and the ICRG measure of
confiscation risk. Countries with higher state ownership of the media also exhibit lower quality of
regulation, as measured by the World Bank. The results are statistically stronger for the press than for
television and radio.
We consider two indicators of financial development. The first is the number of companies listed
on the national stock market, a measure introduced by La Porta et al. (1997). The results show that
countries with higher state ownership of newspapers have fewer firms per capita listed on their national
markets. The second indicator is a measure of banking development from Beck, Demirguc-Kunt, and
Levine (1999). Countries with higher state ownership of the newspapers have less developed banking
19 At a conference in Neemrana, India, in 2000, Luigi Zingales has made this particular argument.
27
systems. These results are suggestive of the possibility that state control of information flow might be
detrimental to the development of markets.
The results for both the security of property and measures of financial market development again
suggest that government ownership of the media hurts. Taken together with our earlier evidence on
freedom of the press and political competition, this evidence is broadly supportive of the view that
governments own the media – especially the press -- not to improve the performance of economic and
political systems, but to improve their own chances to stay in power.
Social Outcomes
Lenin asked a fundamental question: whom is the free press for? Our analysis has focused on
political and economic freedom, but a Pigouvian could presumably argue that the true benefits of state
ownership of the press accrue to the disadvantaged members of society. Freed from the influence of the
capitalist owners, state-controlled media can serve the social needs to the poor and disadvantaged, and
thereby improve social outcomes. A skeptic would argue, in contrast, that the government would use its
ownership of the media to muzzle the press, and to prevent the disadvantaged groups from having a
mechanism for voicing their grievances. Government ownership should then be associated with inferior
social outcomes.
The contrasting predictions of the two views can be evaluated empirically. Table 7 reports the
relationships between state ownership of the media and education and health indicators, holding constant
per capita income, government ownership of firms, and autocracy. In countries with higher state
ownership of the media, we observe inferior school attainment, enrollment and pupil to teacher ratios.
Health outcomes, such as life expectancy, infant mortality and malnutrition are also worse in countries

28
where the government owns more media outlets. In addition, measures of access to sanitation and
responsiveness of the health system are significantly lower in countries with more state-owned media.
Media ownership structures that are associated with better economic and political variables are also
beneficial for social outcomes – in fact the results for social outcomes are generally stronger and hold for
television as well as the press. These findings undermine Lenin’s objections to the effectiveness of
private media.
Earlier studies reached a similar conclusion. Schramm (1964) argued that media plays a crucial
role in national development. Thomas et al. (1991) found that maternal access to the media has a strong
and positive effect on child health in Brazil. Sen (1984, 1999) argued that the lack of democracy,
freedom of information, and an independent press contributed to almost 30 million deaths during China’s
Great Leap Forward between 1958 – 1961. He contrasted this with India, which has not experienced a
major famine since independence, and has stronger democratic processes and press freedom: “The
Government (of India) cannot afford to fail to take prompt action when large scale starvation threatens.
Newspapers play an important part in this, in making the facts known and forcing the challenge to be
faced.” Besley and Burgess (2000) test Sen’s proposition empirically. Using data across Indian states,
they demonstrate that higher newspaper circulation increases government responsiveness to natural
shocks. Stromberg (2000) finds strong support for this hypothesis as well. Rather than focus on media
penetration, our study points to a critical deterrent to the ability of the media to serve these social goals --
government ownership.
Robustness
We checked the robustness of our results in a number of ways. Although we do not present
29
these findings, we briefly summarize them. Our results are robust to alternative methods of controlling for
the level of development, to inclusion of measures of media penetration (higher penetration rates of media
indicate more information flows to citizens), and to exclusion of particular regions and small countries.
The results also hold when we divide the sample into rich and poor countries (using median per capita
income) and re-run the regressions for each sub-sample. Furthermore, alternative definitions of dependent
variables yield similar conclusions.
We have also examined the hypothesis that government ownership of the media has a more
adverse effect on outcomes in autocratic regimes, where other checks on the government are absent. To
test this hypothesis, we included interaction terms of autocracy and media ownership in the regressions.
The results confirm this hypothesis for economic and political development.
V. Ownership or Monopoly?
The results of the previous sections raise an important question: are the adverse effects of
state ownership of the media driven solely by the instances of monopoly (or near-monopoly)?
Alternatively, is more state ownership always worse, even at lower market shares? At the time of the
creation of the BBC, the advocates of state ownership insisted on monopoly. In recent years, a softer
argument prevailed, particularly in Western Europe, according to which some state ownership –
particularly of television – is sufficient to provide the public with exposure to particular content that might
be unavailable through private media. Since there are no countries in our sample with private monopolies
of either newspapers or television, the monopoly question pertains solely to state ownership.
To address this argument, we divide our sample of countries into groups (of non-equal sizes), by
the degree of state control of newspaper circulation as well as that of the television audience. Thus, we
30
create dummies for state control of newspaper circulation being between 0 and 25%, 25% and 50%,
50% and 75%, and above 75%. We create corresponding dummies for state control of television
audiences. We refer to the countries with state control exceeding 75% as having state monopolies in the
relevant market. We then rerun the regressions of Tables 4-7 with the dummies (for newspapers and
television separately) rather than with the linear specification of the effects of state ownership of the
media. The omitted dummy is always that corresponding to the second quartile (i.e., state control
between 25% and 50%). We want to know how the various outcomes compare across quartiles.
The results for media freedom, political, and economic markets do not indicate that the adverse
consequences of state ownership on the various outcomes are driven solely by state monopolies. In
general, no clear pattern emerges from the data, as both third and fourth quartile state ownership often
has large negative effects. However, most coefficients on quartile ownership dummies are statistically
insignificant. For brevity, we do not present these results.
The results are clearer for social outcomes, as Table 8 shows. Typically (though not always), for
both newspapers and television, the coefficients on the first quartile dummy are positive, while those on
the third and fourth quartile dummies are negative. This evidence suggests that social outcomes
deteriorate over the whole range of increases in government ownership of the media. The more
competition in the media, the better are the outcomes. If the adverse outcomes were driven solely by
monopoly, we would have seen, in contrast, zero coefficients on the first and third quartile dummies. This
said, we also note that – especially in the case of television, the largest and most statistically significant
adverse effects on social outcomes appear in the cases of state monopolies.
VI. Conclusion
31
In this paper, we have examined ownership patterns of newspapers and television (and to a lesser
extent radio) in 97 countries around the world. We have found that media firms nearly universally have
ownership structures with large controlling shareholders, and that these shareholders are either families or
governments. This evidence is broadly consistent with the ideas developed by Demsetz (1989) and
Demsetz and Lehn (1985) that there is large amenity potential (control benefits) associated with owning
media – be it political influence or fame.
We then asked whether different patterns of media ownership are associated with different
economic, political, and social outcomes. We found that countries with more prevalent state ownership
of the media have less free press, fewer political rights for citizens, inferior governance, less developed
markets, and strikingly inferior outcomes in the areas of education and health. The adverse effects of
government ownership on political and economic freedom are stronger for newspapers than for television.
Government media monopolies are associated with particularly poor outcomes, especially when we
focus on social outcomes, but we also saw some evidence that various outcomes deteriorate more
generally as state ownership increases. Finally, there is no detectable evidence of any benefits of higher
state ownership of the media. Although none of this evidence can be unambiguously interpreted as
causal, it obtains with extensive controls for the level of economic development, state ownership in the
economy, and the degree of autocracy.
At some broad level, these results will not surprise many readers, since intellectuals since Milton
in the 17th century have advocated free press and independent media. Nonetheless, we believe this
analysis makes two contributions. At the theoretical level, it lends support for Coase’s (1974) analysis of
the media industry. The theoretical arguments in favor of government ownership of the media from the
conventional perspective on industrial organization are very strong. Yet the data reject these Pigouvian

32
arguments, and reveal no benefits of state ownership. In this regard, the paper adds to the growing
literature pointing the severe limitations of the welfarist approach to the analysis of state participation in the
economy. More often than not, market failures pale by comparison with government failures.
The paper also presents a range of evidence on the adverse consequences of state ownership of
the media, holding constant key country characteristics. Government ownership of the media is
detrimental to economic, political, and – most strikingly -- social outcomes. The latter finding is
particularly important in light of a commonly made argument justifying state ownership in a variety of
sectors, including the media, by the appeal to the social needs of the disadvantaged. If correct, our
findings thoroughly debunk this argument. The evidence shows, to the contrary, that increasing private
ownership of the media – through privatization or the encouragement of entry – can advance a variety of
political and economic goals, and especially the social needs of the poor.
33
References
Barro, Robert and Jong-Wha Lee, 1996, “International Measures of Schooling Years and Schooling Quality," American Economic Review, 86, 2: 218-223.
Bebchuk, Lucian, 1999, “A Rent Protection Theory of Corporate Ownership and Control,” NBER Working
Paper no W7203. Beck, Thorsten, Asli Demirguc-Kunt, and Ross Levine, 1999, “A New Database on Financial Development
and Structure,” Policy Research Working paper 2146, World Bank, Washington DC. Besley, Timothy, and Robin Burgess, 2000, “The Political Economy of Government Responsiveness: Theory
and Evidence from India,” Working Paper, Department of Economics, London School of Economics, November.
Committee to Protect Journalists, 2000, "Attacks on the Press in 1999: A Worldwide Survey by the
Committee to Protect Journalists," published online. Central Intelligence Agency, 2000, CIA World Factbook, published online. Coase, Ronald H., 1950, British Broadcasting, A Study in Monopoly, Harvard University Press,
Cambridge, Massachusetts. Coase, Ronald H., 1959, “The Federal Communications Commission,” The Journal of Law and Economics,
2, 5: 1-40. Coase, Ronald H., 1974, “The Market for Goods and the Market for Ideas,” American Economic Review,
64, 2: 384-91. Demsetz, Harold, 1989, “The Amenity Potential of Newspapers and the Reporting of Presidential
Campaigns,” in Demsetz, H., Efficiency, Competition and Policy, Basil Blackwell, London. Demsetz, Harold, and Kenneth Lehn, 1985, “The Structure of Corporate Ownership: Causes and
Consequences,” The Journal of Political Economy, 93, 6: 1155-1177. European Institute of the Media, 2000, Media in the CIS, Duesseldorf, Germany. Fraser Institute, 2000, Economic Freedom of the World, Vancouver, B.C., Canada. Freedom House, 2000, Freedom in the World: Annual Survey of Freedom Country Ratings 1999/2000,
published online. Freedom House, 2000, The Annual Survey of Press Freedom 2000, Freedom House, New York, NY.

34
Grossman, Sanford J., and Oliver Hart, 1988, “One Share-One Vote and the Market for Corporate Control,” Journal of Financial Economics, 20, 1-2: 175-202.
Henisz, Witold, 2000, "The Institutional Environment for Economic Growth", Economic and Politics 12, 1: 1-
31. Humana, Charles, 1992, World Human Rights Guide, Oxford University Press, Oxford, England. Kaufmann, Daniel, Aart Kraay, and Pablo Zoido-Lobaton, 1999, “Governance Matters,” Policy Research
Working paper 2196, World Bank, Washington DC. La Porta Rafael, Florencio Lopez-de-Silanes, Andrei Shleifer, and Robert Vishny, 1997, “Legal
Determinants of External Finance,” Journal of Finance, 52, 3: 1131-1150. La Porta Rafael, Florencio Lopez-de-Silanes, Andrei Shleifer, and Robert Vishny, 1998, “Law and
Finance,” Journal of Political Economy, 106, 6: 1113-1150. La Porta, Rafael, Florencio Lopez-de-Silanes, Andrei Shleifer, and Robert Vishny, 1999, “The Quality of
Government,” Journal of Law, Economics, and Organization, 15, 3: 222-279. La Porta Rafael, Florencio Lopez-de-Silanes, and Andrei Shleifer, 1999, “Corporate Ownership Around the
World,” Journal of Finance, 54, 2: 471-517. Lenin, Vladimir I., 1925, “On Freedom of the Press,” Labour Monthly, 7, 2:35-37 (first published in 1917). Lewis, Arthur W., 1955, The Theory of Economic Growth, Harper Torchbook, New York, New York. Maslog, C., 2000, “Philippines,” in Gunaratne, S. (ed.) Handbook of the Media in Asia, Sage Publications,
Thousand Oaks, California. Motta, M., and M. Polo, 1997, “TV Regulation: Concentration and Public Policies in the
Broadcasting Industry,” Economic Policy, 25, 0: 293-327. Myrdal, Gunnar, 1953, The Political Element in the Development of Economic Theory, Routledge and
Kegan, London. Polity IV Project, 2000, Polity IV Dataset: Political Regime Characteristics and Transitions, 1800-1999,
Center for International Development and Conflict Management, University of Maryland, College Park, Maryland, published online.
Political Risk Services, 2000, International Country Risk Guide, East Syracuse, NY: Political Risk Services,
Institutional Reform and Informational Sector. Reporters Sans Frontieres, 2000, Annual Report 2000, published online.

35
Schramm, Wilbur, 1964, Mass Media and National Development, Stanford University Press, Stanford,
California. Sen, Amartya, 1984, Poverty and Famines, Oxford University Press, Oxford Sen, Amartya, 1999, Development as Freedom, Alfred A. Knopf Inc, New York. Simon, Joel, 1998, “Hot on the Money Trail,” Columbia Journalism Review, 37, 1: 13-22. Simons, Henry, 1948, Economic Policy of a Free Society, University of Chicago Press, Chicago. Spence, Michael, and Bruce Owen, 1977, “Television Programming, Monopolistic Competition and
Welfare,” Quarterly Journal of Economics, 91, 1: 103-126. Stapenhurst, Richard, 2000, “The Media’s Role in Curbing Corruption,” Departmental Working Paper,
World Bank Institute, The World Bank, Washington DC. Stigler, George, 1961, “The Economics of Information,” Journal of Political Economy 69, 213-225. Stiglitz, Joseph E., 2000, “The Contributions of the Economics of Information to Twentieth Century
Economics,” Quarterly Journal of Economics, 115, 4: 1441-1478. Stromberg, David, 2000, “Radio’s Impact on Public Spending,” Working Paper, Institute for International
Economic Studies, Stockholm University, Stockholm, Sweden, mimeo. Thomas, Duncan, John Strauss, and Maria-Helena Henriques, 1991, “How Does Mother’s Education Affect
Child Height?,” Journal of Human Resources, 26, 2: 183-211. UNDP, 2000, Human Development Report 2000, UNDP: New York, NY. UNESCO Institute for Statistics, 1999, Annual Statistical Yearbook, UNESCO: Paris, France. Van Belle, Douglas A., 1997, “Press Freedom and the Democratic Peace,” Journal of Peace Research, 34,
4: 405-414. Washington Post, 2000, “Our Reverse Revolution: Under Yeltsin, We Oligarchs helped Stop Russia from
Reverting to Its Old, Repressive Ways,” October 26, p. A27. World Association of Newspapers, 2000, World Press Trends 2000, Zenith Media, Paris, France. World Bank, 2000, Database of Enterprise Indicators on Transition Economies, Europe and Central Asia
Region, Washington DC.
36
World Bank, 2000, World Development Indicators 2000, World Bank: Washington, DC. World Health Organization, 2000, World Health Report 2000, WHO: Geneva, Switzerland. Zenith Media, 2000, Americas Market and Mediafact, London, the United Kingdom. Zenith Media, 2000, Asia Pacific Market and Mediafact, London, the United Kingdom. Zenith Media, 2000, Central and Eastern European Market and Mediafact, London, the United Kingdom. Zenith Media, 2000, Middle East and Africa Market and Mediafact, London, the United Kingdom. Zenith Media, 2000, Western European Market and Mediafact, London, the United Kingdom.

Table 1: Description of the Variables
Variable name Description and source
State ownership, press (by count)
The percentage state-owned newspapers out of the five largest daily newspapers (by circulation), 1999.
State ownership, press (by share)
The market share of state-owned newspapers out of the aggregate market share of the five largest daily newspapers (by circulation), 1999.
State ownership, TV (by count)
The percentage state-owned TV stations out of the five largest TV stations (by viewership), 1999.
State ownership, TV (by share)
The market share of state-owned TV stations out of the aggregate market share of the five largest TV stations (by viewership), 1999.
GNP per capita GNP per capita, 1999, in thousand US$. Source: World Development Indicators 2000.
SOE Index An index from zero to ten based on the number, composition, and share of output supplied by State-owned Enterprises (SOEs) and government investment as a share of total investment. Countries with more SOEs and larger government investment received lower ratings. When there were few SOEs, and those are mainly in utility sectors, and government investment was less than 15 percent of total investment, countries were given a rating of 10. When there were few SOEs other than those involved in industries where economies of scale reduce the effectiveness of competition, e.g., power generation, and government investment was between 15 and 20 percent of the total, countries received a rating of 8. When there were, again, few SOEs other than those involved in utility industries and government investment was between 20 and 25 percent of the total, countries were rated at 7. When SOEs were dominant in utility sectors and government investment was 25 to 30 percent of the total, countries were assigned a rating of 6. When a substantial number of SOEs operated in many sectors, including manufacturing, and government investment was between 30 and 40 percent of the total, countries received a rating of 4. When a substantial number of SOEs operated in many sectors, and government investment was between 40 and 50 percent of the total, countries were rated at 2. A zero rating was assigned to countries where over 50 percent of the economy's output was produced by SOEs and government investment exceeded 50 percent of the total. Source: Fraser Institute (2000) for all countries except Armenia, Azerbaijan, Belarus, Ethiopia, Moldova, and Turkmenistan. Data for these 6 countries was constructed by the authors based on the World Bank's Enterprise Database (2000).
Autocracy Index of authoritarian regimes, 1999. Based on an eleven point autocracy scale that is constructed additively from the codings of five component variables: competitiveness of executive recruitment, openness of executive recruitment, constraints on chief executive, regulation of participation, and competitiveness of political participation. Values were recaled from 0 to 1 with 0 being high in autocracy and 1 being low in autocracy. Source: Polity IV Project 2000.
Journalists Jailed (RSF) The number of journalists held in police custody for any length of time in 1999, rescaled from 0 to 1, with higher values indicating less opression. Source: Reporters Sans Frontieres, 2000.
Media Outlets Closed The number of media outlets closed in 1999, rescaled from 0 to 1, with higher values indicating less opression. Source: Reporters Sans Frontieres, 2000.
Journalists Jailed (CPJ) The number of journalists held in police custody for any length of time per year, average over 1997-1999, rescaled from 0 to 1, with higher values indicating less opression. Source: The Committee to Protect Journalists, 2000.
Internet Freedom 0 if the state has a monopoly on internet service provision 1999, 1 otherwise. Source: The Committee to Protect Journalists, 2000.
Political rights Index of political rights. Higher ratings indicate countries that come closer to the "ideals suggested by the checklist questions of: (1) free and fair elections; (2) those elected rule; (3) there are competitive parties or other competitive political groupings; (4) the opposition has an important role and power; (5) the entities have self-determination or an extremely high degree of autonomy". Rescaled from 0 to 1, with higher values indicating better political rights. Source: Freedom in the World 2000, Freedom House.
Civil liberties Index of civil rights. Higher ratings indicate countries that enjoy "the freedoms to develop views, institutions, and personal autonomy apart from the state". The basic components of the index are: (1) freedom of expression and belief; (2) association and organizational rights; (3) rule of law and human rights; (4) personal autonomy and economic rights. Rescaled from 0 to 1, with higher values indicating better civil liberties. Source: Freedom in the World 2000, Freedom House.
CONTROLS
MEDIA OWNERSHIP
MEDIA FREEDOM
POLITICAL MARKETS
37
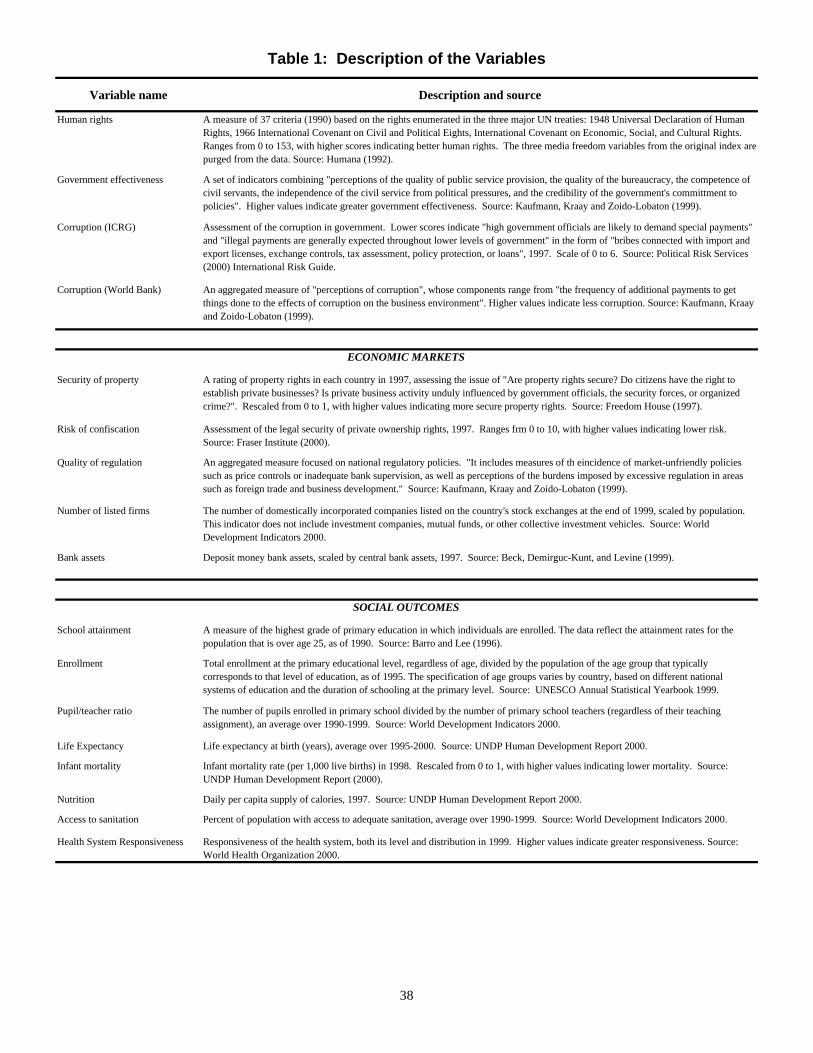
Table 1: Description of the Variables
Variable name Description and source
MEDIA OWNERSHIPHuman rights A measure of 37 criteria (1990) based on the rights enumerated in the three major UN treaties: 1948 Universal Declaration of Human Rights, 1966 International Covenant on Civil and Political Eights, International Covenant on Economic, Social, and Cultural Rights. Ranges from 0 to 153, with higher scores indicating better human rights. The three media freedom variables from the original index are purged from the data. Source: Humana (1992).
Government effectiveness A set of indicators combining "perceptions of the quality of public service provision, the quality of the bureaucracy, the competence of civil servants, the independence of the civil service from political pressures, and the credibility of the government's committment to policies". Higher values indicate greater government effectiveness. Source: Kaufmann, Kraay and Zoido-Lobaton (1999).
Corruption (ICRG) Assessment of the corruption in government. Lower scores indicate "high government officials are likely to demand special payments" and "illegal payments are generally expected throughout lower levels of government" in the form of "bribes connected with import and export licenses, exchange controls, tax assessment, policy protection, or loans", 1997. Scale of 0 to 6. Source: Political Risk Services (2000) International Risk Guide.
Corruption (World Bank) An aggregated measure of "perceptions of corruption", whose components range from "the frequency of additional payments to get things done to the effects of corruption on the business environment". Higher values indicate less corruption. Source: Kaufmann, Kraay and Zoido-Lobaton (1999).
Security of property A rating of property rights in each country in 1997, assessing the issue of "Are property rights secure? Do citizens have the right to establish private businesses? Is private business activity unduly influenced by government officials, the security forces, or organized crime?". Rescaled from 0 to 1, with higher values indicating more secure property rights. Source: Freedom House (1997).
Risk of confiscation Assessment of the legal security of private ownership rights, 1997. Ranges frm 0 to 10, with higher values indicating lower risk. Source: Fraser Institute (2000).
Quality of regulation An aggregated measure focused on national regulatory policies. "It includes measures of th eincidence of market-unfriendly policies such as price controls or inadequate bank supervision, as well as perceptions of the burdens imposed by excessive regulation in areas such as foreign trade and business development." Source: Kaufmann, Kraay and Zoido-Lobaton (1999).
Number of listed firms The number of domestically incorporated companies listed on the country's stock exchanges at the end of 1999, scaled by population. This indicator does not include investment companies, mutual funds, or other collective investment vehicles. Source: World Development Indicators 2000.
Bank assets Deposit money bank assets, scaled by central bank assets, 1997. Source: Beck, Demirguc-Kunt, and Levine (1999).
School attainment A measure of the highest grade of primary education in which individuals are enrolled. The data reflect the attainment rates for the population that is over age 25, as of 1990. Source: Barro and Lee (1996).
Enrollment Total enrollment at the primary educational level, regardless of age, divided by the population of the age group that typically corresponds to that level of education, as of 1995. The specification of age groups varies by country, based on different national systems of education and the duration of schooling at the primary level. Source: UNESCO Annual Statistical Yearbook 1999.
Pupil/teacher ratio The number of pupils enrolled in primary school divided by the number of primary school teachers (regardless of their teaching assignment), an average over 1990-1999. Source: World Development Indicators 2000.
Life Expectancy Life expectancy at birth (years), average over 1995-2000. Source: UNDP Human Development Report 2000.
Infant mortality Infant mortality rate (per 1,000 live births) in 1998. Rescaled from 0 to 1, with higher values indicating lower mortality. Source: UNDP Human Development Report (2000).
Nutrition Daily per capita supply of calories, 1997. Source: UNDP Human Development Report 2000.
Access to sanitation Percent of population with access to adequate sanitation, average over 1990-1999. Source: World Development Indicators 2000.
Health System Responsiveness Responsiveness of the health system, both its level and distribution in 1999. Higher values indicate greater responsiveness. Source: World Health Organization 2000.
ECONOMIC MARKETS
SOCIAL OUTCOMES
38
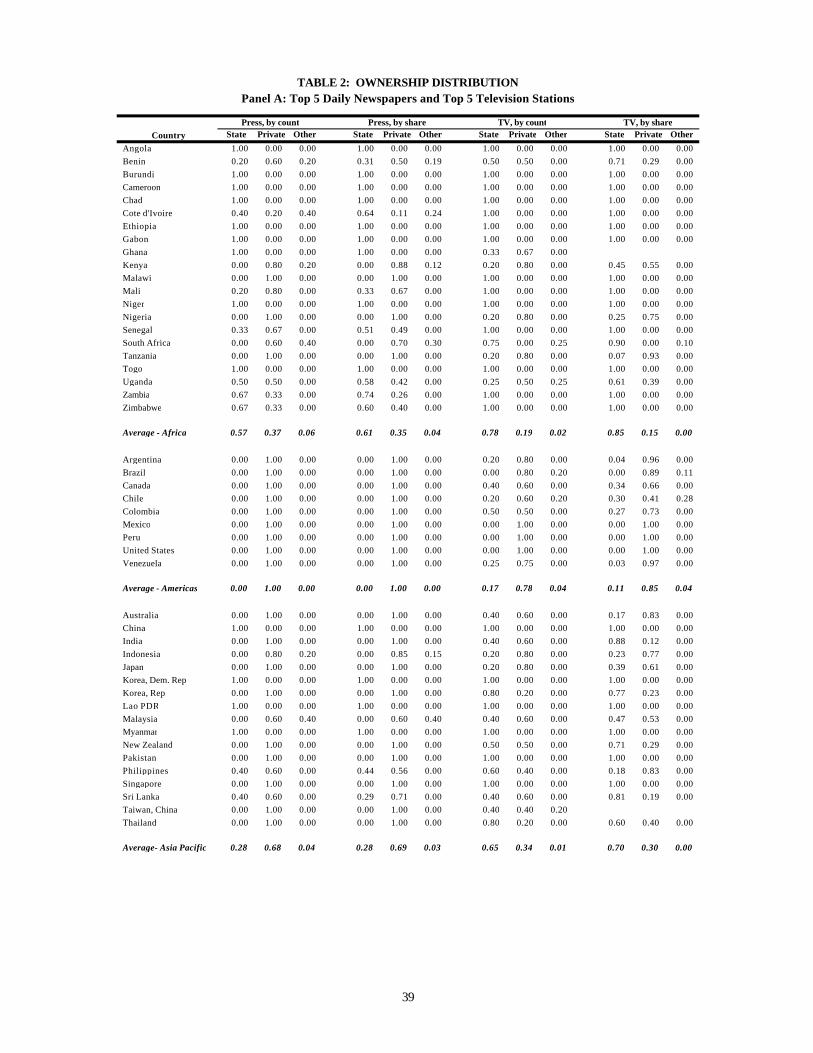
State Private Other State Private Other State Private Other State Private Other
Angola 1.00 0.00 0.00 1.00 0.00 0.00 1.00 0.00 0.00 1.00 0.00 0.00Benin 0.20 0.60 0.20 0.31 0.50 0.19 0.50 0.50 0.00 0.71 0.29 0.00Burundi 1.00 0.00 0.00 1.00 0.00 0.00 1.00 0.00 0.00 1.00 0.00 0.00Cameroon 1.00 0.00 0.00 1.00 0.00 0.00 1.00 0.00 0.00 1.00 0.00 0.00Chad 1.00 0.00 0.00 1.00 0.00 0.00 1.00 0.00 0.00 1.00 0.00 0.00Cote d'Ivoire 0.40 0.20 0.40 0.64 0.11 0.24 1.00 0.00 0.00 1.00 0.00 0.00Ethiopia 1.00 0.00 0.00 1.00 0.00 0.00 1.00 0.00 0.00 1.00 0.00 0.00Gabon 1.00 0.00 0.00 1.00 0.00 0.00 1.00 0.00 0.00 1.00 0.00 0.00Ghana 1.00 0.00 0.00 1.00 0.00 0.00 0.33 0.67 0.00Kenya 0.00 0.80 0.20 0.00 0.88 0.12 0.20 0.80 0.00 0.45 0.55 0.00Malawi 0.00 1.00 0.00 0.00 1.00 0.00 1.00 0.00 0.00 1.00 0.00 0.00Mali 0.20 0.80 0.00 0.33 0.67 0.00 1.00 0.00 0.00 1.00 0.00 0.00Niger 1.00 0.00 0.00 1.00 0.00 0.00 1.00 0.00 0.00 1.00 0.00 0.00Nigeria 0.00 1.00 0.00 0.00 1.00 0.00 0.20 0.80 0.00 0.25 0.75 0.00Senegal 0.33 0.67 0.00 0.51 0.49 0.00 1.00 0.00 0.00 1.00 0.00 0.00South Africa 0.00 0.60 0.40 0.00 0.70 0.30 0.75 0.00 0.25 0.90 0.00 0.10Tanzania 0.00 1.00 0.00 0.00 1.00 0.00 0.20 0.80 0.00 0.07 0.93 0.00Togo 1.00 0.00 0.00 1.00 0.00 0.00 1.00 0.00 0.00 1.00 0.00 0.00Uganda 0.50 0.50 0.00 0.58 0.42 0.00 0.25 0.50 0.25 0.61 0.39 0.00Zambia 0.67 0.33 0.00 0.74 0.26 0.00 1.00 0.00 0.00 1.00 0.00 0.00Zimbabwe 0.67 0.33 0.00 0.60 0.40 0.00 1.00 0.00 0.00 1.00 0.00 0.00
Average - Africa 0.57 0.37 0.06 0.61 0.35 0.04 0.78 0.19 0.02 0.85 0.15 0.00
Argentina 0.00 1.00 0.00 0.00 1.00 0.00 0.20 0.80 0.00 0.04 0.96 0.00Brazil 0.00 1.00 0.00 0.00 1.00 0.00 0.00 0.80 0.20 0.00 0.89 0.11Canada 0.00 1.00 0.00 0.00 1.00 0.00 0.40 0.60 0.00 0.34 0.66 0.00Chile 0.00 1.00 0.00 0.00 1.00 0.00 0.20 0.60 0.20 0.30 0.41 0.28Colombia 0.00 1.00 0.00 0.00 1.00 0.00 0.50 0.50 0.00 0.27 0.73 0.00Mexico 0.00 1.00 0.00 0.00 1.00 0.00 0.00 1.00 0.00 0.00 1.00 0.00Peru 0.00 1.00 0.00 0.00 1.00 0.00 0.00 1.00 0.00 0.00 1.00 0.00United States 0.00 1.00 0.00 0.00 1.00 0.00 0.00 1.00 0.00 0.00 1.00 0.00Venezuela 0.00 1.00 0.00 0.00 1.00 0.00 0.25 0.75 0.00 0.03 0.97 0.00
Average - Americas 0.00 1.00 0.00 0.00 1.00 0.00 0.17 0.78 0.04 0.11 0.85 0.04
Australia 0.00 1.00 0.00 0.00 1.00 0.00 0.40 0.60 0.00 0.17 0.83 0.00China 1.00 0.00 0.00 1.00 0.00 0.00 1.00 0.00 0.00 1.00 0.00 0.00India 0.00 1.00 0.00 0.00 1.00 0.00 0.40 0.60 0.00 0.88 0.12 0.00Indonesia 0.00 0.80 0.20 0.00 0.85 0.15 0.20 0.80 0.00 0.23 0.77 0.00Japan 0.00 1.00 0.00 0.00 1.00 0.00 0.20 0.80 0.00 0.39 0.61 0.00Korea, Dem. Rep. 1.00 0.00 0.00 1.00 0.00 0.00 1.00 0.00 0.00 1.00 0.00 0.00Korea, Rep. 0.00 1.00 0.00 0.00 1.00 0.00 0.80 0.20 0.00 0.77 0.23 0.00Lao PDR 1.00 0.00 0.00 1.00 0.00 0.00 1.00 0.00 0.00 1.00 0.00 0.00Malaysia 0.00 0.60 0.40 0.00 0.60 0.40 0.40 0.60 0.00 0.47 0.53 0.00Myanmar 1.00 0.00 0.00 1.00 0.00 0.00 1.00 0.00 0.00 1.00 0.00 0.00New Zealand 0.00 1.00 0.00 0.00 1.00 0.00 0.50 0.50 0.00 0.71 0.29 0.00Pakistan 0.00 1.00 0.00 0.00 1.00 0.00 1.00 0.00 0.00 1.00 0.00 0.00Philippines 0.40 0.60 0.00 0.44 0.56 0.00 0.60 0.40 0.00 0.18 0.83 0.00Singapore 0.00 1.00 0.00 0.00 1.00 0.00 1.00 0.00 0.00 1.00 0.00 0.00Sri Lanka 0.40 0.60 0.00 0.29 0.71 0.00 0.40 0.60 0.00 0.81 0.19 0.00Taiwan, China 0.00 1.00 0.00 0.00 1.00 0.00 0.40 0.40 0.20Thailand 0.00 1.00 0.00 0.00 1.00 0.00 0.80 0.20 0.00 0.60 0.40 0.00
Average- Asia Pacific 0.28 0.68 0.04 0.28 0.69 0.03 0.65 0.34 0.01 0.70 0.30 0.00
TABLE 2: OWNERSHIP DISTRIBUTIONPanel A: Top 5 Daily Newspapers and Top 5 Television Stations
CountryPress, by count Press, by share TV, by count TV, by share
39

State Private Other State Private Other State Private Other State Private Other
Algeria 0.40 0.60 0.00 0.57 0.43 0.00 1.00 0.00 0.00 1.00 0.00 0.00Bahrain 0.00 1.00 0.00 0.00 1.00 0.00 1.00 0.00 0.00 1.00 0.00 0.00Egypt 0.80 0.00 0.20 0.94 0.00 0.06 1.00 0.00 0.00 1.00 0.00 0.00Iran, Islamic Rep. 1.00 0.00 0.00 1.00 0.00 0.00 1.00 0.00 0.00 1.00 0.00 0.00Israel 0.00 1.00 0.00 0.00 1.00 0.00 0.25 0.75 0.00 0.36 0.64 0.00Jordan 0.60 0.40 0.00 0.83 0.17 0.00 1.00 0.00 0.00 1.00 0.00 0.00Kuwait 0.00 1.00 0.00 0.00 1.00 0.00 1.00 0.00 0.00 1.00 0.00 0.00Morocco 0.40 0.00 0.60 0.41 0.00 0.59 1.00 0.00 0.00 1.00 0.00 0.00Saudi Arabia 0.40 0.60 0.00 1.00 0.00 0.00 1.00 0.00 0.00Syrian Arab Republic 1.00 0.00 0.00 1.00 0.00 0.00 1.00 0.00 0.00 1.00 0.00 0.00Tunisia 0.20 0.40 0.40 0.23 0.50 0.27 1.00 0.00 0.00 1.00 0.00 0.00
Average - Middle East North Africa (MENA) 0.44 0.45 0.11 0.50 0.41 0.09 0.93 0.07 0.00 0.94 0.06 0.00
Armenia 0.20 0.40 0.40 0.27 0.45 0.27 0.20 0.80 0.00 0.53 0.47 0.00Azerbaijan 0.20 0.80 0.00 0.10 0.90 0.00 0.20 0.80 0.00 0.31 0.69 0.00Belarus 1.00 0.00 0.00 1.00 0.00 0.00 1.00 0.00 0.00 1.00 0.00 0.00Bulgaria 0.00 1.00 0.00 0.00 1.00 0.00 0.50 0.50 0.00 0.75 0.25 0.00Croatia 0.50 0.25 0.25 0.29 0.33 0.38 0.75 0.25 0.00 0.97 0.03 0.00Cyprus 0.00 0.80 0.20 0.00 0.89 0.11 0.40 0.60 0.00 0.23 0.77 0.00Czech Republic 0.00 1.00 0.00 0.00 1.00 0.00 0.50 0.50 0.00 0.34 0.66 0.00Estonia 0.00 1.00 0.00 0.00 1.00 0.00 0.25 0.75 0.00 0.29 0.71 0.00Georgia 0.20 0.80 0.00 0.06 0.94 0.00 0.40 0.60 0.00 0.66 0.34 0.00Hungary 0.00 1.00 0.00 0.00 1.00 0.00 0.40 0.60 0.00 0.20 0.80 0.00Kazakhstan 1.00 0.00 0.00 1.00 0.00 0.00 1.00 0.00 0.00 1.00 0.00 0.00Kyrgyz Republic 0.50 0.25 0.25 0.35 0.35 0.30 0.33 0.67 0.00 0.69 0.31 0.00Lithuania 0.00 1.00 0.00 0.00 1.00 0.00 0.20 0.80 0.00 0.23 0.77 0.00Moldova 0.20 0.80 0.00 0.12 0.88 0.00 0.20 0.80 0.00 0.44 0.56 0.00Poland 0.00 1.00 0.00 0.00 1.00 0.00 0.40 0.60 0.00 0.57 0.43 0.00Romania 0.00 1.00 0.00 0.00 1.00 0.00 0.40 0.60 0.00 0.37 0.63 0.00Russian Federation 0.20 0.80 0.00 0.15 0.85 0.00 0.80 0.20 0.00 0.96 0.04 0.00Slovak Republic 0.00 1.00 0.00 0.00 1.00 0.00 0.40 0.60 0.00 0.35 0.65 0.00Slovenia 0.00 1.00 0.00 0.00 1.00 0.00 0.40 0.40 0.20 0.54 0.45 0.01Turkey 0.00 1.00 0.00 0.00 1.00 0.00 0.00 1.00 0.00 0.00 1.00 0.00Turkmenistan 1.00 0.00 0.00 1.00 0.00 0.00 1.00 0.00 0.00 1.00 0.00 0.00Ukraine 0.40 0.40 0.20 0.15 0.77 0.07 0.40 0.60 0.00 0.14 0.86 0.00Uzbekistan 1.00 0.00 0.00 1.00 0.00 0.00 0.80 0.20 0.00 0.73 0.27 0.00
Average - Central/East. Europe and Transition 0.28 0.67 0.06 0.24 0.71 0.05 0.48 0.52 0.01 0.53 0.46 0.00
Austria 0.00 0.80 0.20 0.00 0.86 0.14 0.40 0.60 0.00 0.78 0.22 0.00Belgium 0.00 1.00 0.00 0.00 1.00 0.00 0.40 0.60 0.00 0.41 0.59 0.00Denmark 0.00 0.40 0.60 0.00 0.37 0.63 0.60 0.40 0.00 0.80 0.20 0.00Finland 0.00 1.00 0.00 0.00 1.00 0.00 0.50 0.50 0.00 0.48 0.52 0.00France 0.00 1.00 0.00 0.00 1.00 0.00 0.40 0.60 0.00 0.43 0.57 0.00Germany 0.00 1.00 0.00 0.00 1.00 0.00 0.60 0.40 0.00 0.61 0.39 0.00Greece 0.00 0.60 0.40 0.00 0.68 0.32 0.20 0.80 0.00 0.08 0.92 0.00Ireland 0.00 0.80 0.20 0.00 0.79 0.21 0.60 0.40 0.00 0.68 0.32 0.00Italy 0.00 0.80 0.20 0.00 0.83 0.17 0.60 0.40 0.00 0.61 0.39 0.00Netherlands 0.00 1.00 0.00 0.00 1.00 0.00 0.60 0.40 0.00 0.57 0.43 0.00Norway 0.00 1.00 0.00 0.00 1.00 0.00 0.40 0.60 0.00 0.47 0.53 0.00Portugal 0.00 1.00 0.00 0.00 1.00 0.00 0.40 0.60 0.00 0.38 0.62 0.00Spain 0.00 1.00 0.00 0.00 1.00 0.00 0.40 0.60 0.00 0.43 0.57 0.00Sweden 0.00 1.00 0.00 0.00 1.00 0.00 0.40 0.60 0.00 0.51 0.49 0.00Switzerland 0.00 1.00 0.00 0.00 1.00 0.00 0.60 0.40 0.00 0.89 0.11 0.00United Kingdom 0.00 1.00 0.00 0.00 1.00 0.00 0.60 0.40 0.00 0.60 0.40 0.00
Average - West. Europe 0.00 0.90 0.10 0.00 0.91 0.09 0.48 0.52 0.00 0.55 0.45 0.00Average - total sample 0.29 0.65 0.06 0.29 0.66 0.05 0.60 0.39 0.01 0.64 0.36 0.01
CountryPress, by count Press, by share TV, by count TV, by share
TABLE 2: OWNERSHIP DISTRIBUTION (CONT'D)Panel A:Top 5 Daily Newspapers and Top 5 Television Stations
TABLE 2: OWNERSHIP DISTRIBUTION (CONT'D)
40

Africa vs. Americas 3.950 a 4.348 a 4.941 a 7.362 a
Africa vs. Asia Pacific 2.053 b 2.383 b 1.228 1.581
Africa vs. MENA 0.870 0.766 -1.323 -0.960
Africa vs. CEE/Transition 2.351 b 3.016 a 3.296 a 3.470 a
Africa vs. West. Europe 5.302 a 5.836 a 3.417 a 3.660 a
Americas vs. Asia Pacific -1.949 c -1.922 c -4.090 a -5.342 a
Americas vs. MENA -3.450 a -3.592 a -7.965 a ##### a
Americas vs. CEE/Transition -2.306 b -2.019 b -2.760 a -3.929 a
Americas vs. West. Europe 0.000 0.000 -4.782 a -5.829 a
Asia Pacific vs. MENA -0.969 -1.290 -2.577 b -2.354 b
Asia Pacific vs. CEE/Transition -0.036 0.222 1.889 c 1.632
Asia Pacific vs. West. Europe 2.621 a 2.585 a 2.077 b 1.659 c
MENA vs. CEE/Transition 1.095 1.709 c 4.675 a 4.001 a
MENA vs. West. Europe 4.666 a 4.857 a 6.706 a 5.230 a
CEE/Transition vs. West. Europe 3.093 a 2.708 a -0.078 -0.126
a=Significant at 1% level; b=Significant at 5% level; c=Significant at 10% level.
TV, by count TV, by share
TABLE 2: OWNERSHIP DISTRIBUTION (CONT'D) Panel B: Test of State Ownership Means by Region : t-statistics
Region Press, by count Press, by share
41
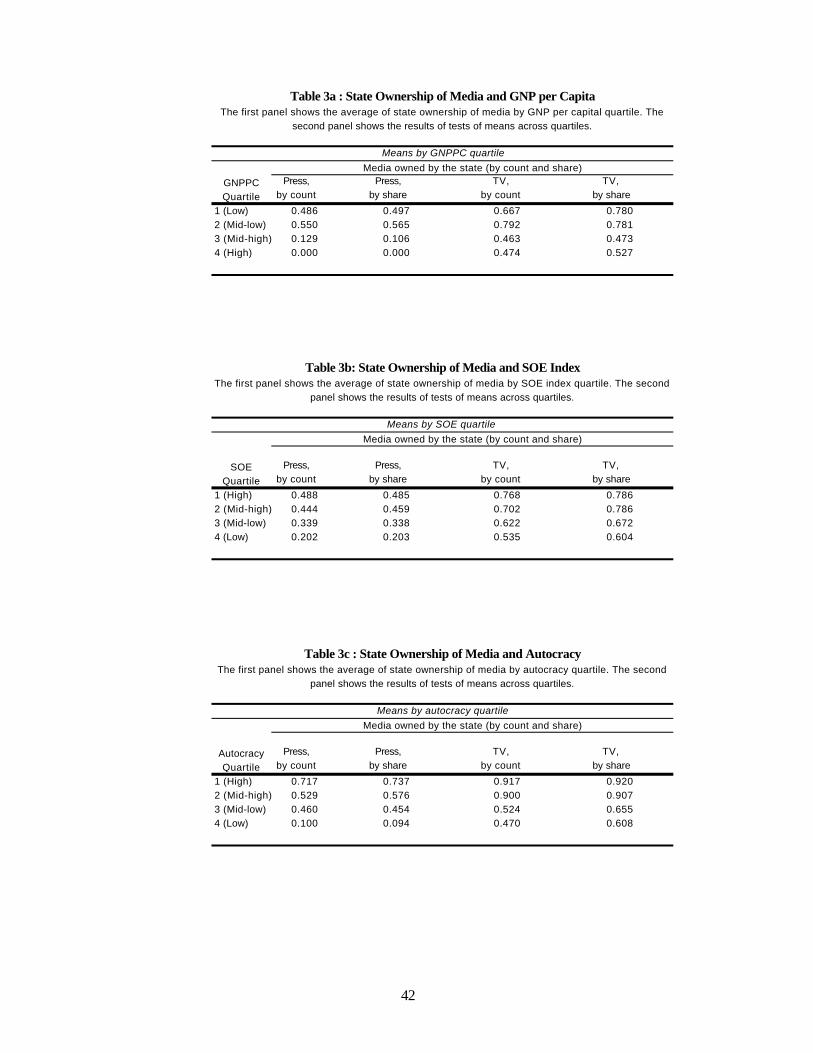
Press,by count
Press,by share
TV, by count
TV, by share
1 (Low) 0.486 0.497 0.667 0.7802 (Mid-low) 0.550 0.565 0.792 0.7813 (Mid-high) 0.129 0.106 0.463 0.4734 (High) 0.000 0.000 0.474 0.527
Press,by count
Press,by share
TV, by count
TV, by share
1 (High) 0.488 0.485 0.768 0.7862 (Mid-high) 0.444 0.459 0.702 0.7863 (Mid-low) 0.339 0.338 0.622 0.6724 (Low) 0.202 0.203 0.535 0.604
Press,by count
Press,by share
TV, by count
TV, by share
1 (High) 0.717 0.737 0.917 0.9202 (Mid-high) 0.529 0.576 0.900 0.9073 (Mid-low) 0.460 0.454 0.524 0.6554 (Low) 0.100 0.094 0.470 0.608
SOE Quartile
Autocracy Quartile
The first panel shows the average of state ownership of media by autocracy quartile. The second panel shows the results of tests of means across quartiles.
Means by autocracy quartileMedia owned by the state (by count and share)
Media owned by the state (by count and share)
Table 3c : State Ownership of Media and Autocracy
Means by SOE quartile
Table 3a : State Ownership of Media and GNP per CapitaThe first panel shows the average of state ownership of media by GNP per capital quartile. The
second panel shows the results of tests of means across quartiles.
Means by GNPPC quartileMedia owned by the state (by count and share)
GNPPC Quartile
Table 3b: State Ownership of Media and SOE IndexThe first panel shows the average of state ownership of media by SOE index quartile. The second
panel shows the results of tests of means across quartiles.
42

VariableGNP per
capitaSOE
indexAutocracy Constant R2 N
State ownership -0.0084 a -0.0185 c -0.8345 a 1.0948 a 0.557 97press (by share) (0.0027) (0.0112) (0.1462) (0.1075)
State ownership 0.0043 -0.0356 a -0.5652 a 1.1879 a 0.378 97TV (by share) (0.0035) (0.0133) (0.0908) (0.0572)
State ownership -0.0037 -0.0538 a -0.3171 a 1.2035 a 0.265 97radio (0.0061) (0.0185) (0.1037) (0.0593)
a=Significant at 1% level; b=Significant at 5% level; c=Significant at 10% level.
Press,by count
Press,by share
TV, by count
TV, by share
1 (Low) 0.348 0.348 0.565 0.6362 (Mid-low) 0.417 0.458 0.667 0.6673 (Mid-high) 0.083 0.087 0.250 0.3334 (High) 0.000 0.000 0.080 0.200
Quartile1st vs. 2nd -0.476 -0.760 -0.704 -0.2111st vs. 3rd 2.290 b 2.211 b 2.274 b 2.109 b
1st vs. 4th 3.575 a 3.575 a 4.161 a 3.321 a
2nd vs. 3rd 2.828 a 3.060 a 3.122 a 2.398 b
2nd vs. 4th 4.139 a 4.505 a 5.255 a 3.665 a
3rd vs. 4th 1.477 1.511 1.620 1.047a=Significant at 1% level; b=Significant at 5% level; c=Significant at 10% level.
Table 3d: Determinants of State Ownership of the Media
GNPPC Quartile
state monopolies (by count and share)
Test of means (t-statistics)
Table 3e : State Monopolies in the Media and GNP per CapitaThe first panel shows the average of state monopolies of media by GNP per capital quartile. The
second panel shows the results of tests of means across quartiles.
Means by GNPPC quartile
43
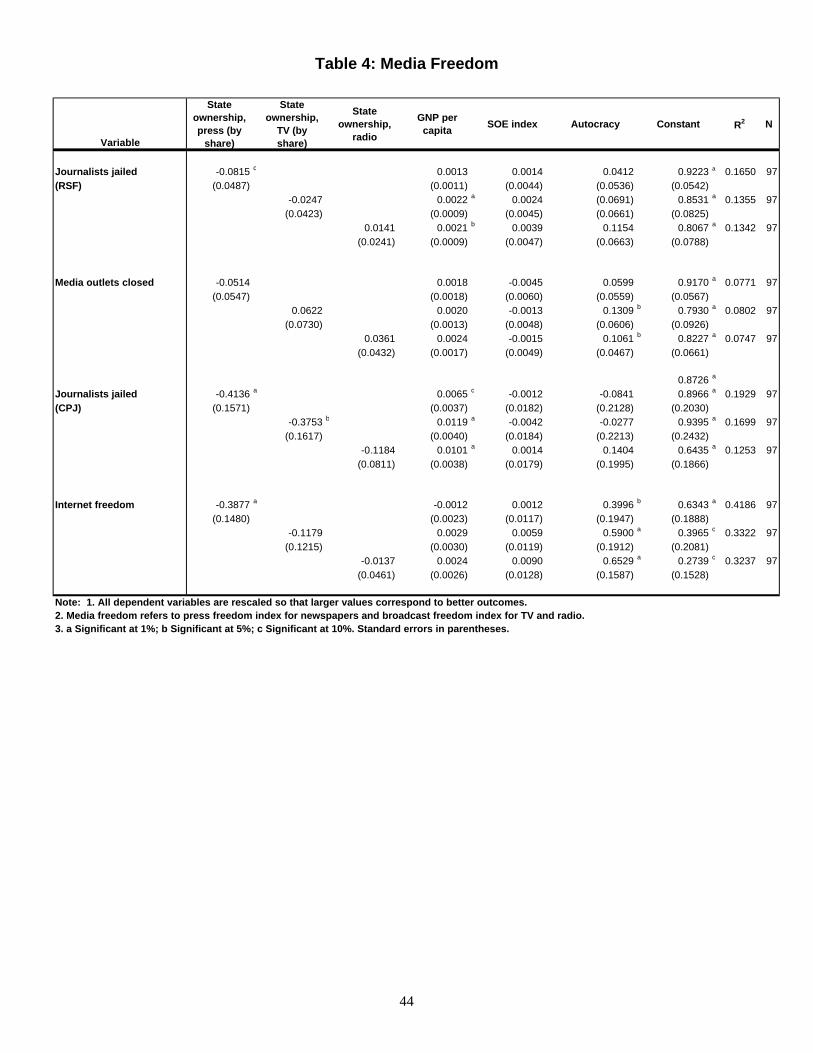
Table 4: Media Freedom
Variable
State ownership, press (by
share)
State ownership,
TV (by share)
State ownership,
radio
GNP per capita
SOE index Autocracy Constant R2 N
Journalists jailed -0.0815 c 0.0013 0.0014 0.0412 0.9223 a 0.1650 97(RSF) (0.0487) (0.0011) (0.0044) (0.0536) (0.0542)
-0.0247 0.0022 a 0.0024 (0.0691) 0.8531 a 0.1355 97(0.0423) (0.0009) (0.0045) (0.0661) (0.0825)
0.0141 0.0021 b 0.0039 0.1154 0.8067 a 0.1342 97(0.0241) (0.0009) (0.0047) (0.0663) (0.0788)
Media outlets closed -0.0514 0.0018 -0.0045 0.0599 0.9170 a 0.0771 97(0.0547) (0.0018) (0.0060) (0.0559) (0.0567)
0.0622 0.0020 -0.0013 0.1309 b 0.7930 a 0.0802 97(0.0730) (0.0013) (0.0048) (0.0606) (0.0926)
0.0361 0.0024 -0.0015 0.1061 b 0.8227 a 0.0747 97(0.0432) (0.0017) (0.0049) (0.0467) (0.0661)
0.8726 a
Journalists jailed -0.4136 a 0.0065 c -0.0012 -0.0841 0.8966 a 0.1929 97(CPJ) (0.1571) (0.0037) (0.0182) (0.2128) (0.2030)
-0.3753 b 0.0119 a -0.0042 -0.0277 0.9395 a 0.1699 97(0.1617) (0.0040) (0.0184) (0.2213) (0.2432)
-0.1184 0.0101 a 0.0014 0.1404 0.6435 a 0.1253 97(0.0811) (0.0038) (0.0179) (0.1995) (0.1866)
Internet freedom -0.3877 a -0.0012 0.0012 0.3996 b 0.6343 a 0.4186 97(0.1480) (0.0023) (0.0117) (0.1947) (0.1888)
-0.1179 0.0029 0.0059 0.5900 a 0.3965 c 0.3322 97(0.1215) (0.0030) (0.0119) (0.1912) (0.2081)
-0.0137 0.0024 0.0090 0.6529 a 0.2739 c 0.3237 97(0.0461) (0.0026) (0.0128) (0.1587) (0.1528)
Note: 1. All dependent variables are rescaled so that larger values correspond to better outcomes. 2. Media freedom refers to press freedom index for newspapers and broadcast freedom index for TV and radio. 3. a Significant at 1%; b Significant at 5%; c Significant at 10%. Standard errors in parentheses.
44

Table 5: Political Markets
Variable
State ownership, press (by
share)
State ownership, TV
(by share)
State ownership,
radioGNP per capita SOE index Autocracy Constant R2 N
Political rights -0.1872 a 0.0107 a -0.0011 0.7772 a -0.0511 0.8112 97(0.0613) (0.0019) (0.0071) (0.0780) (0.0779)
-0.1278 c 0.0130 a -0.0011 0.8275 a -0.0816 0.8132 97(0.0682) (0.0019) (0.0079) (0.0692) (0.0852)
-0.0021 0.0122 a 0.0031 0.9090 a -0.2336 a 0.8074 97(0.0414) (0.0020) (0.0076) (0.0658) (0.0632)
Civil liberties -0.1531 a 0.0105 a -0.0002 0.5334 a 0.1145 c 0.7507 97(0.0532) (0.0017) (0.0063) (0.0748) (0.0703)
-0.0804 0.0122 a 0.0006 0.5886 a 0.0608 0.7529 97(0.0659) (0.0017) (0.0071) (0.0685) (0.0875)
0.0093 0.0118 a 0.0038 0.6441 a -0.0479 0.7497 97(0.0394) (0.0018) (0.0069) (0.0597) (0.0590)
Human rights -4.1669 0.9762 a 0.2787 36.4060 a 28.8489 a 0.6134 72(7.9535) (0.1647) (0.7703) (9.7790) (9.1453)
-2.0386 1.0178 a 0.2849 37.9172 a 27.4799 a 0.6125 72(7.0686) (0.1686) (0.7577) (9.6671) (10.1323)
-1.4090 0.9978 a 0.2624 39.0152 a 26.6388 a 0.6132 72(3.9745) (0.1613) (0.7423) (8.3422) (7.5964)
Government -0.2848 0.0605 a 0.0507 b 0.3403 -0.7101 a 0.7229 95effectiveness (0.1886) (0.0058) (0.0220) (0.2273) (0.2382)
0.0744 0.0628 a 0.0584 a 0.5732 a -1.0690 a 0.7217 95(0.1772) (0.0062) (0.0225) (0.2122) (0.2512)
-0.0569 0.0630 a 0.0530 b 0.5062 a -0.9091 a 0.7217 95(0.1306) (0.0060) (0.0226) (0.2010) (0.2307)
Corruption (ICRG) -0.6819 c 0.0661 a -0.0289 0.8072 c 2.5209 a 0.4863 79(0.4174) (0.0114) (0.0450) (0.4833) (0.4524)
0.0193 0.0728 a -0.0174 1.2313 b 1.8852 a 0.4863 79(0.4455) (0.0123) (0.0457) (0.5496) (0.6688)
-0.1614 0.0710 a -0.0260 1.1980 a 2.1004 a 0.4919 79(0.2732) (0.0116) (0.0461) (0.4499) (0.4997)
Corruption -0.3152 c 0.0697 a 0.0372 0.2906 -0.6908 a 0.7609 95(World Bank) (0.1684) (0.0070) (0.0256) (0.1963) (0.2086)
0.0452 0.0725 a 0.0445 c 0.5262 a -1.0439 a 0.7605 95(0.1867) (0.0073) (0.0266) (0.1820) (0.2472)
-0.0239 0.0722 a 0.0422 c 0.5018 a -0.9646 a 0.7607 95(0.1370) (0.0070) (0.0259) (0.1627) (0.2077)
Note: 1. All dependent variables are rescaled so that larger values correspond to better outcomes. 2. a Significant at 1%; b Significant at 5%; c Significant at 10%. Standard errors in parentheses.
45

Table 6: Economic Markets
Variable
State ownership, press (by
share)
State ownership,
TV (by share)
State ownership,
radio
GNP per capita
SOE index Autocracy Constant R2 N
Security of property -0.2415 a 0.0114 a 0.0295 a -0.1035 0.5720 a 0.5892 91(0.0676) (0.0019) (0.0080) (0.1106) (0.1070)
-0.0088 0.0135 a 0.0342 a 0.0429 0.3611 a 0.5893 91(0.0611) (0.0018) (0.0081) (0.1230) (0.1236)
0.0405 0.0135 a 0.0369 a 0.0656 0.2987 a 0.5920 91(0.0418) (0.0018) (0.0090) (0.1107) (0.1091)
Risk of confiscation -2.8428 a 0.0650 a 0.1105 -1.5156 9.2214 a 0.3112 81(0.6998) (0.0222) (0.1010) (1.1106) (0.9643)
-2.1013 b 0.1007 a 0.0975 -1.2372 9.3301 a 0.3084 81(1.0370) (0.0272) (0.1144) (1.4425) (1.6183)
-1.1320 b 0.0870 a 0.0942 -0.1278 8.0464 a 0.2859 81(0.4878) (0.0243) (0.1159) (1.2474) (1.2283)
Quality of regulation -0.5496 a 0.0204 a 0.0627 a 0.5395 b -0.5032 b 0.6046 97(0.1748) (0.0046) (0.0178) (0.2427) (0.2412)
-0.1458 0.0261 a 0.0701 a 0.8219 a -0.8656 a 0.6062 97(0.1593) (0.0048) (0.0197) (0.2643) (0.2834)
-0.0682 0.0253 a 0.0712 a 0.8803 a -0.9535 a 0.6044 97(0.1002) (0.0047) (0.0207) (0.2361) (0.2448)
Number of listed firms -0.0273 a 0.0010 a -0.0032 0.0062 0.0273 a 0.1234 97(0.0108) (0.0003) (0.0025) (0.0130) (0.0110)
-0.0151 0.0013 a -0.0031 0.0156 0.0187 0.1319 97(0.0118) (0.0003) (0.0026) (0.0137) (0.0124)
0.0070 0.0013 a -0.0023 0.0275 -0.0081 0.1245 97(0.0070) (0.0003) (0.0022) (0.0191) (0.0101)
Bank assets -0.2147 b 0.0033 -0.0049 0.3033 c 0.5409 a 0.2265 92(0.1018) (0.0028) (0.0131) (0.1821) (0.1666)
-0.1504 0.0059 b -0.0046 0.3410 b 0.5243 a 0.2191 92(0.1011) (0.0026) (0.0143) (0.1580) (0.1725)
-0.1985 a 0.0047 c -0.0110 0.3552 b 0.5936 a 0.2547 92(0.0723) (0.0028) (0.0151) (0.1596) (0.1654)
Note: 1. All dependent variables are rescaled so that larger values correspond to better outcomes. 2. a Significant at 1%; b Significant at 5%; c Significant at 10%. Standard errors in parentheses.
46
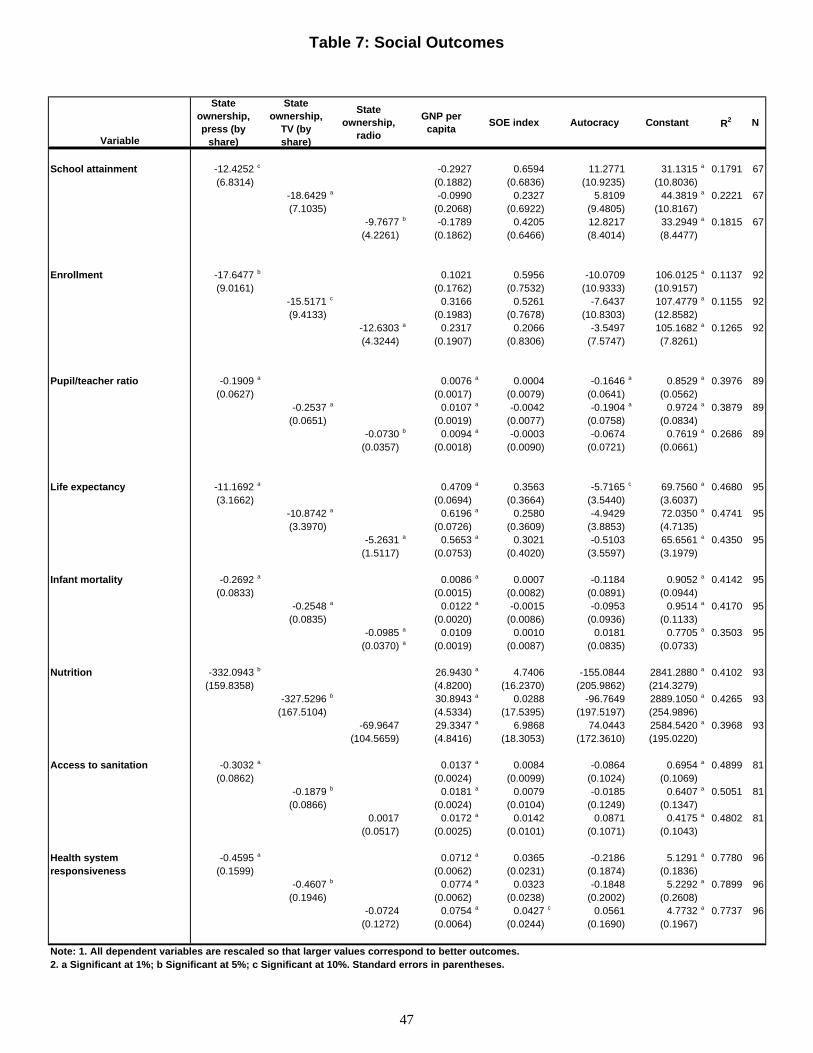
Table 7: Social Outcomes
Variable
State ownership, press (by
share)
State ownership,
TV (by share)
State ownership,
radio
GNP per capita
SOE index Autocracy Constant R2 N
School attainment -12.4252 c -0.2927 0.6594 11.2771 31.1315 a 0.1791 67(6.8314) (0.1882) (0.6836) (10.9235) (10.8036)
-18.6429 a -0.0990 0.2327 5.8109 44.3819 a 0.2221 67(7.1035) (0.2068) (0.6922) (9.4805) (10.8167)
-9.7677 b -0.1789 0.4205 12.8217 33.2949 a 0.1815 67(4.2261) (0.1862) (0.6466) (8.4014) (8.4477)
Enrollment -17.6477 b 0.1021 0.5956 -10.0709 106.0125 a 0.1137 92(9.0161) (0.1762) (0.7532) (10.9333) (10.9157)
-15.5171 c 0.3166 0.5261 -7.6437 107.4779 a 0.1155 92(9.4133) (0.1983) (0.7678) (10.8303) (12.8582)
-12.6303 a 0.2317 0.2066 -3.5497 105.1682 a 0.1265 92(4.3244) (0.1907) (0.8306) (7.5747) (7.8261)
Pupil/teacher ratio -0.1909 a 0.0076 a 0.0004 -0.1646 a 0.8529 a 0.3976 89(0.0627) (0.0017) (0.0079) (0.0641) (0.0562)
-0.2537 a 0.0107 a -0.0042 -0.1904 a 0.9724 a 0.3879 89(0.0651) (0.0019) (0.0077) (0.0758) (0.0834)
-0.0730 b 0.0094 a -0.0003 -0.0674 0.7619 a 0.2686 89(0.0357) (0.0018) (0.0090) (0.0721) (0.0661)
Life expectancy -11.1692 a 0.4709 a 0.3563 -5.7165 c 69.7560 a 0.4680 95(3.1662) (0.0694) (0.3664) (3.5440) (3.6037)
-10.8742 a 0.6196 a 0.2580 -4.9429 72.0350 a 0.4741 95(3.3970) (0.0726) (0.3609) (3.8853) (4.7135)
-5.2631 a 0.5653 a 0.3021 -0.5103 65.6561 a 0.4350 95(1.5117) (0.0753) (0.4020) (3.5597) (3.1979)
Infant mortality -0.2692 a 0.0086 a 0.0007 -0.1184 0.9052 a 0.4142 95(0.0833) (0.0015) (0.0082) (0.0891) (0.0944)
-0.2548 a 0.0122 a -0.0015 -0.0953 0.9514 a 0.4170 95(0.0835) (0.0020) (0.0086) (0.0936) (0.1133)
-0.0985 a 0.0109 0.0010 0.0181 0.7705 a 0.3503 95(0.0370) a (0.0019) (0.0087) (0.0835) (0.0733)
Nutrition -332.0943 b 26.9430 a 4.7406 -155.0844 2841.2880 a 0.4102 93(159.8358) (4.8200) (16.2370) (205.9862) (214.3279)
-327.5296 b 30.8943 a 0.0288 -96.7649 2889.1050 a 0.4265 93(167.5104) (4.5334) (17.5395) (197.5197) (254.9896)
-69.9647 29.3347 a 6.9868 74.0443 2584.5420 a 0.3968 93(104.5659) (4.8416) (18.3053) (172.3610) (195.0220)
Access to sanitation -0.3032 a 0.0137 a 0.0084 -0.0864 0.6954 a 0.4899 81(0.0862) (0.0024) (0.0099) (0.1024) (0.1069)
-0.1879 b 0.0181 a 0.0079 -0.0185 0.6407 a 0.5051 81(0.0866) (0.0024) (0.0104) (0.1249) (0.1347)
0.0017 0.0172 a 0.0142 0.0871 0.4175 a 0.4802 81(0.0517) (0.0025) (0.0101) (0.1071) (0.1043)
Health system -0.4595 a 0.0712 a 0.0365 -0.2186 5.1291 a 0.7780 96responsiveness (0.1599) (0.0062) (0.0231) (0.1874) (0.1836)
-0.4607 b 0.0774 a 0.0323 -0.1848 5.2292 a 0.7899 96(0.1946) (0.0062) (0.0238) (0.2002) (0.2608)
-0.0724 0.0754 a 0.0427 c 0.0561 4.7732 a 0.7737 96(0.1272) (0.0064) (0.0244) (0.1690) (0.1967)
Note: 1. All dependent variables are rescaled so that larger values correspond to better outcomes. 2. a Significant at 1%; b Significant at 5%; c Significant at 10%. Standard errors in parentheses.
47

Table 8: Social Outcomes (ownership quartiles)
Variable Q1 Q3 Q4 Q1 Q3 Q4 GNP per capita SOE index Autocracy Constant R2 NSchool attainment 16.2055 16.5124 3.3544 -0.3526 c 0.8317 14.3843 12.2900 0.2237 67
(10.4101) (12.0328) (11.9074) (0.1908) (0.7237) (10.5532) (14.6843)2.7149 -2.8935 -12.5599 a -0.1292 0.2724 6.4016 37.9469 a 0.2291 67
(6.9479) (6.2498) (5.1926) (0.2301) (0.8235) (8.9221) (8.5661)
Enrollment 16.3807 c 0.2426 -0.9339 0.0181 0.6958 -10.2035 91.1163 a 0.1733 92(8.8846) (11.4329) (10.3342) (0.1599) (0.7435) (10.4217) (10.0248)
2.8707 -6.0414 -7.2821 0.3126 0.7150 -4.4184 98.2317 a 0.1022 92(4.6627) (3.7764) (6.2149) (0.2052) (0.8234) (10.6505) (9.4730)
Pupil/teacher ratio 0.0814 -0.1382 -0.0942 0.0073 a 0.0003 -0.1678 a 0.7803 a 0.3567 89(0.0747) (0.0880) (0.0785) (0.0015) (0.0077) (0.0623) (0.0603)
0.0010 0.0146 -0.1853 a 0.0104 a -0.0037 -0.1900 a 0.8933 a 0.4208 89(0.0331) (0.0362) (0.0457) (0.0018) (0.0074) (0.0789) (0.0660)
Life expectancy 1.1319 -17.5172 a -8.2684 a 0.4691 a 0.3125 -5.6406 c 68.7890 a 0.5695 95(2.7574) (4.7371) (3.1368) (0.0674) (0.3537) (3.1145) (2.7733)
-1.1521 -2.0159 -8.0319 a 0.5813 a 0.3675 -4.3074 68.6441 a 0.4727 95(2.2781) (2.4027) (2.3842) (0.0749) (0.3818) (3.9400) (3.7316)
Infant mortality 0.0963 -0.1374 -0.1526 0.0086 a 0.0008 -0.1118 0.8021 a 0.4495 95(0.0863) (0.0931) (0.0954) (0.0015) (0.0082) (0.0873) (0.0878)
-0.0233 -0.0410 -0.1831 a 0.0113 a 0.0011 -0.0785 0.8664 a 0.4119 95(0.0500) (0.0426) (0.0564) (0.0020) (0.0090) (0.0962) (0.0872)
Nutrition 347.1896 a -116.7366 50.5126 24.8996 a 6.5256 -158.7225 2534.9590 a 0.4620 93(116.2601) (156.3776) (150.7429) (4.9142) (16.3139) (210.0136) (193.2870)
126.7518 -53.2697 -161.6041 31.3928 a -0.2207 -67.9467 2714.6080 a 0.4270 93(132.5104) (115.5565) (122.2571) (4.6147) (18.0633) (190.3904) (206.7376)
Access to sanitation 0.1655 b 0.0188 -0.1205 0.0137 a 0.0092 -0.0739 0.5143 a 0.5699 81(0.0852) (0.0915) (0.0907) (0.0026) (0.0102) (0.1071) (0.0968)
810.0243 0.0068 -0.1028 0.0175 a 0.0097 0.0043 0.5441 a 0.5000
(0.0702) (0.0844) (0.0700) (0.0026) (0.0109) (0.1324) (0.1221)Health system 0.3280 c -0.1181 -0.0899 0.0700 a 0.0383 -0.2032 4.8062 a 0.7962 96responsiveness (0.2029) (0.2617) (0.2037) (0.0063) (0.0238) (0.1853) (0.1896)
-0.0260 -0.1447 -0.3603 a 0.0761 a 0.0360 -0.1737 5.1136 a 0.7919 96(0.1416) (0.1626) (0.1346) (0.0064) (0.0234) (0.1870) (0.1990)
Note: 1. All dependent variables are rescaled so that larger values correspond to better outcomes. 2.: a Significant at 1%; b Significant at 5%; c Significant at 10%. Standard errors are in parentheses.QI = state ownership of 0-25%; Q3 = state ownership of 50-75%; Q4 = state ownership of 75-100%
State Ownership, Press ( by share) State Ownership, TV ( by share)
48
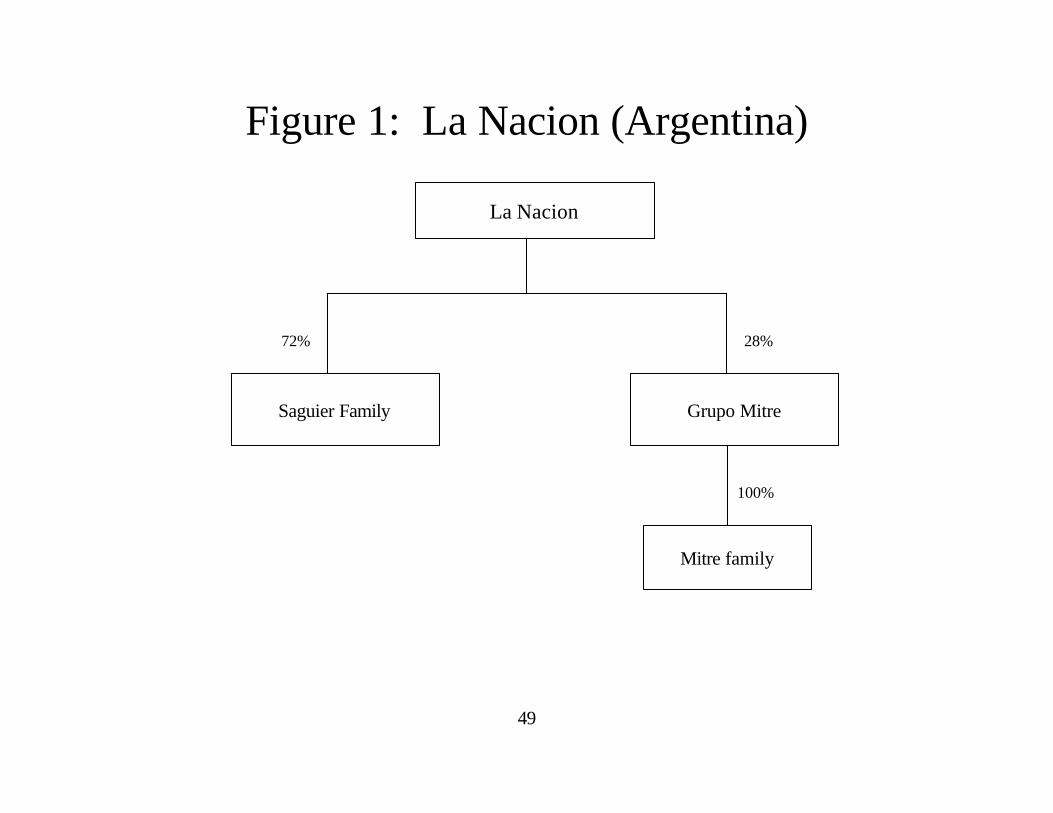
49
Figure 1: La Nacion (Argentina)
La Nacion
Saguier Family
72%
Grupo Mitre
100%
28%
Mitre family

50
Figure 2: TVN (Norway)TV Norge (TVN)
TV Norge AS.
Scandinavian Broad Casting System (SBS)
100%
United Pan-Europe Communications SV (UPC) Netherlands
9.8%23.3%
50.7%
TV 2 AS
49.3%
Mr. Harry Evans Sloan
United Global Com, Inc. Microsoft Corp.
Schneider familyShareholders agreement:on equal terms Gene Schneider Mark Schneiderthe Schneider Family TrustCurtis RochelleAlbert CarolloLiberty Media Corp. (AT&T)
Schibsted Egmont Foundation(Denmark)
A-Pressen ASA
Mr. Tinius Nagell-Erichsen
FagbevegelsensInvesteringsselskap AS Sanoma WSOY AS
Land Organisasjonen (LO)main trade union in Norway Mr. Aatos Erkko Seppala
family
8%51%
21.9% (18+2.3+1.6) 69.2%
33.2%33.2%33.3%
26.11%29.05% 27.48%
29.44%86% 20.4%
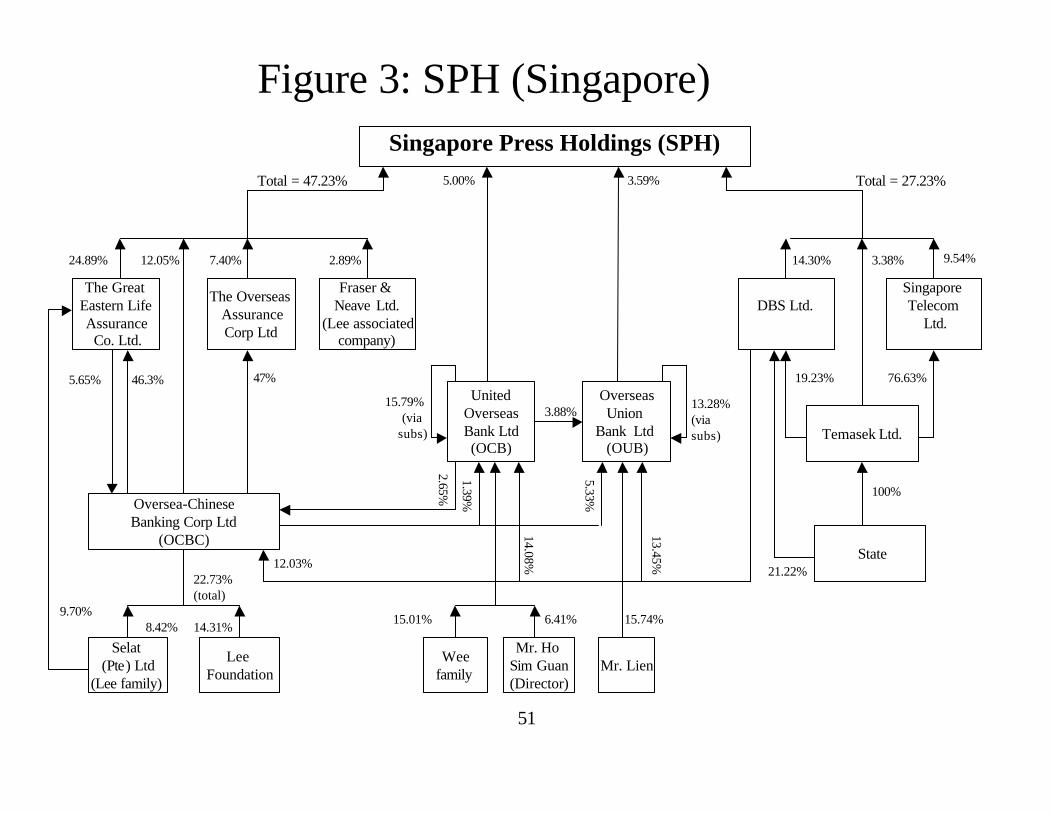
51
Singapore Press Holdings (SPH)
Fraser & Neave Ltd.
(Lee associatedcompany)
The Overseas AssuranceCorp Ltd
Oversea-ChineseBanking Corp Ltd
(OCBC)
The Great Eastern LifeAssurance
Co. Ltd.
UnitedOverseasBank Ltd(OCB)
Mr. LienMr. Ho
Sim Guan(Director)
Weefamily
Temasek Ltd.
State
Lee Foundation
Selat (Pte) Ltd
(Lee family)
2.89%
Total = 47.23%
24.89% 7.40%12.05%
5.65% 46.3% 47%
5.33%
3.88%
15.74%
22.73%(total)
14.31%8.42%15.01% 6.41%
15.79%(via
subs)
13.28%(viasubs)
5.00% 3.59%
21.22%
19.23% 76.63%
Total = 27.23%
100%
14.30% 9.54%
12.03%
Figure 3: SPH (Singapore)
3.38%
9.70%
OverseasUnion
Bank Ltd (OUB)
DBS Ltd.Singapore Telecom
Ltd.
13.45%
14.08%
1.39%
2.65%

52
Figure 4: Newspaper and TV OwnershipTV Ownership, by Count
State%
Families%
Widely Held%
Employees%
Other%
TV Ownership, by Share
State%
Families%
Widely Held%
Employees%
Other%
Press Ownership, by Share
State%
Families%
Widely Held%
Employees%
Other%
Press Ownership, by Count
State%
Families%
Widely Held%
Employees%
Other%