who motivated me to attempt perfection and€¦ · One of my great well wishers once told me that...
218
dedicated to (Late) Prof. M.N. Chatterji who motivated me to attempt perfection and to (Late) Prof. N.S. Saini who motivated me to be practical
Transcript of who motivated me to attempt perfection and€¦ · One of my great well wishers once told me that...

dedicated
to
(Late) Prof. M.N. Chatterji
whomotivated
meto
attemptperfection
and
to
(Late) Prof. N .S . Saini
whomotivated
meto
bepractical

ACKNOWLEDGEMENTS
Ir. C . A . de Bruijn initiated the process of offering me a p lace and fel lowship for pursuing this research. It was ratherunfortunate that I could not rece ive much guidance from him due to his ex treme health condit ions . Whi le I amthankful to him for putting his trust in m e , I hope the present work reaches so m e whe r e near his expectat ions .
I am thankful to the I T C , The Netherlands and the D G I S , T h e Netherlands, for providing necessary institutional andfinancial support for this research. My sincere thanks are due to my e m p l o y e r s , S P A , N e w D e l h i , for providing menecessary permiss ion and leave to comple te the research at the ITC.
At the ITC, I received supervis ion from Prof. Dr. Dirk Bolt , Professor and Head of the Div i s ion of Urban Planningand M a n a g e m e n t . It w a s a lways a rewarding exper ience to discuss with him any part of the work , no matter how-minor or crucial . I was rather lucky to have the consent of Prof. Dr . H . F . L . Ottens, Dean of the Faculty of SpatialS c i e n c e s at the Univers i ty of Utrecht , to be my Promoter. He w a s a lways so readily avai lable for any d iscuss ions ,the traditional gap be tween the candidate and the promoter was bridged soon . His frankness and openness to n e wideas played an important role in shaping this research. Whi le I am specif ical ly thankful to h im, I am also thankfulto the University of Utrecht , T h e Netherlands, for making the promotion poss ib le .
I am very much thankful to Prof. Dr . J . D . G . F . H o w e , Dr . Yous i f Ali Huss in , Prof. Dr . A . M . J . Kreukels , Prof.Dr . IT . H . A . Luning and Prof. Dr . M . L . Vel l inga for go ing through the manuscript and making useful c o m m e n t s .
M a n y learned people in India contributed useful thoughts in the initial and intermediate phases of this research. I specif ical ly a c k n o w l e d g e the contributions made by Prof. Jamal H. Ansari , Mr. S. Arunachalam, Dr. (Mrs . ) AtiyaHabib Kidwai , Dr. Satish K. Kulshrestha and Prof. (Col . ) Prabhakar Misra .
I offer my sincere thanks to the Library of the ITC, without which I could not have comple ted this work . I wasbothering the staff of this library every n o w and then, and I was a lways met with the same smi le , courtesy andpromptness . I also tender my gratefulness to the Library of Instituut Kern, Indologisch Instituut der Rijksuniversiteitat Leiden and the Library of the Universi ty of Utrecht. In India, I made exhaust ive use of the libraries of the S P A ,N e w De lh i ; J N U , N e w De lh i ; ITPI, N e w Delhi ; and the IIRS, Dehradun. I am very thankful to the all theselibraries. I a lso acknowledge the numerous researchers and scholars w h o s e work have been referred to extens ive lyin this research, for they provided the base for this work .
I am thankful to the of f ices of the N C R Planning Board, N e w Delhi ; D D A , N e w Delhi ; State Departments of T & C Pat Haryana, Rajasthan and Uttar Pradesh; Regional Off ice -NCR of the H U D C O , N e w Delhi ; T C P O , N e w De lh i ;N R S A , Hyderabad; Registrar General of India, N e w Delhi ; and the N I C , N e w Delh i , for providing a huge amountof data and information used in this research.
A large number of people spent their valuable time by participating in the discuss ions and site visits during the fieldwork for this research. These discussions and visits were made more fruitful by the participation of M r . R . C .A g g a r w a l , Prof. Jamal H. Ansari , Dr . Sreemay Basu , Mr. Amit Bhargava , Prof. Dr . Dirk Bolt , Mr . B . K . Jain,Prof. Kavas Kapadia, Prof. Dr . H . F . L . Ottens, M r s . Poonam Prakash, M r . R . P . Rastogi , Dr . Shovan K. Saha,Prof. N . D . Sharma, Mr. Baldeo Singh Sokhi , and Dr. (Mrs . ) Parvatham Venkatachalam. I am thankful to them fortheir contribution in the research. Dr . Ashok Kumar and his "lunch group' kept my morals high during the fieldwork.
Yet another large number of people s h o w e d extraordinary kindness by sparing their time and efforts. I could a lwaysfall upon them in case any data was required to be sent to the Netherlands or there was a cross reference w a s to bec h e c k e d . T h e s e kind hearted friends have w o n me for ever . T h e y include M r s . Sheeba Al i , M r . J .B . Kshirsagar,M r . Sunil K. M e h r a , M r . Rajendra Pandita, D r . Shovan K. Saha , Mr. Vinod Sakle , M s . M. Zarina Singh and Mr.S. Surendra. An equal ly large number of people went beyond their normal official duties and extended help bydiscuss ing s o m e compl icated issues involved and helping so lve some of the technical problems . Included in them areM r . M i r z a M . A . Ba ig , D r . S .P . Bansa l , Mr. J . N . Barman, M r . F . H . M . van den B o s c h , D r s . Petra E . Bu d d e , M r .S.K. Jena, D r . S . P . S . Khushwaha, D r s . R .A . Knippers , M s . Shilpam Pandey , Dr. Christine Pohl and Mr. G.Reinink.

I am very grateful to the staff of the Div i s ion of Urban Planning and M a n a g e m e n t at the ITC, w h o contributed tothe research by making useful c o m m e n t s at various s tages . I am particularly thankful to Drs . Victor F . L . Po l l e \ forvery critical d iscuss ions on fractal analys is , urban density coeff ic ients and image interpretation.
Whi le I am at the pleasing job of thanking, I would like to tender my a p o l o g i e s to my neighbour in the of f ice . Mr.R. Ackermann had to bear Indian music at odd hours. I h o p e , he does not start missing the music now.
The Netherlands is a very love ly country with friendly people . At ITC, I had the support of the staff of the Deptt .of L A R U S , student affairs, restaurant and the security and environment . I w a s made at h o m e by the extraordinarypeop le like M r s . Aurora H e g h e s , M r s . W i l m a Grootenboer and Mrs . Nita Juppenlatz; and the Best Western DishHotels b . v .
One of my great well w i shers once told me that pursuing research is a long and lone struggle . In this long s truggle ,fortunately, I was not a lone . Not only we shared the same office for more than three years , and a couple ofparagraphs in our respect ive theses , we also shared a lot of tensions , pressures , emot ions , moments of depress ionsand j o y , ideas and v i e w points . Credit for some of the very f ine arguments in this work g o e s to this f inest friend ofm i n e , M s . Sahar A l - A m i r .
My son , Lakshit , is too y o u n g (he w a s only two, w h e n I left him) to understand w h y his father w a s not with himfor last three years . I hope he forgives me w h e n he does understand.
To my w i f e , I can not say sorry for what she missed. N o r I can say 'thank y o u ' for what she sacrif iced. What I wishto say i s , 'Usha , I l ove you more! ' .
My parents have played a great role in mould ing my life. I s imply can not pay back the care , affection and bless ingsthat they a lways have for m e . I am thankful to God, for having blessed me with such except ional parents, family,teachers , friends and we l l -wishers .
MahavirJune 2 1 , 1996

LIST OF ABBREVIATIONS AND ACRONYMS
CBA Continuously Built-up AreaCCD Charge Couple DeviceCCT Computer Compatible TapeCFI Composite Functionality IndexCI Connectivity IndexCSR Complete Spatial RandomnessDDA Delhi Development Authority, New Delhi, IndiaDEM Digital Elevation ModelDMA Delhi Metropolitan Area, IndiaEurostat Statistical Office for European CommunityFAR Floor Area RatioFCC False Colour CompositeFSI Floor Space IndexGISs Geographic Information SystemsGPS Global Positioning SystemGSD Ground Sample DistanceHRV High Resolution VisibleHUDA Haryana Urban Development Authority, IndiaHUDCO Housing and Urban Development Corporation, New DelhiIDSMT Integrated Development of Small and Medium TownsIIRS Indian Institute of Remote Sensing, Dehradun, IndiaILWIS Integrated Land and Water Information SystemIRS Indian Remote Sensing SatelliteISRO Indian Space Research Organisation, Bangalore, IndiaITC International Institute for Aerospace Survey and Earth Sciences,
Enschede, The NetherlandsITPI Institute of Town Planners, India, New DelhiJNU Jawaharlal Nehru University, New DelhiLISS Linear Image Scanning SystemMCD Municipal Corporation of Delhi, IndiaMS Multi-SpectralMSS Multi-Spectral ScannerNCR National Capital Region of Delhi, IndiaNCT National Capital Territory of Delhi, IndiaNCU National Commission on Urbanisation, Government of IndiaNDC National Data Centre of the NRSANDMC New Delhi Municipal Committee, IndiaNGOs Non-Governmental OrganisationsNIC National Informatics Centre, New DelhiNNRMS National Natural Resource Management System, IndiaNOIDA New Okhla Industrial Development Area, IndiaNRSA National Remote Sensing Agency, Hyderabad, India

PAC Polarised Activity CentrePAN PanchromaticPCA Principal Component AnalysisPI Proximity IndexPRL Physical Research Laboratory, Ahemadabad, IndiaRNN Reflexive Nearest NeighbourSAC Space Application Centre, Ahemadabad, IndiaSPA School of Planning and Architecture, New Delhi, IndiaSPOT Systeme Pour VObservation de la TerreSWIR Short Wave Infra-RedT&CP Town and Country PlanningTCPO Town and Country Planning Organisation, Government of India, New
DelhiTM Thematic MapperTRL Terrain Research Laboratory, Ministry of Defence, Government of
IndiaUN United NationsUNCHS United Nations Centre for Human Settlements (Habitat), Nairobi,
KenyaUNCRD United Nations Centre for Regional Development, Nagoya, JapanU.P. Uttar PradeshUPS Uninterrupted Power SupplyURIS Urban and Regional Planning Information SystemWIFS Wide Field Sensor

Het Modelleren van Nederzettingspatronen voorGrootstedelijke Gebieden: Ondersteuning door Aardobservatie
Het analyseren van nederzettingspatronen is nuttig bij de besluitvorming over de locatie vannieuwe investeringen en over de mogelijkheden om diensten en faciliteiten op nieuwe wijzente groeperen. Het gaat daarbij om het vermogen van menselijke nederzettingen om regionaleontwikkeling te bevorderen. De nederzettingspatronen rond metropolen worden steedsbelangrijker vanwege de snelheid waarmee stedelijke nederzettingen zowel in aantal als inomvang groeien. Bovendien is in ontwikkelingslanden een nieuwe categorie ontstaan: groteen toenemende aantallen spontaan tot ontwikkeling gekomen menselijke nederzettingen aande randen van stedelijke gebieden.
De 'natuurlijke' ontwikkeling van bovenvermelde processen leidt tot ondoelmatige en weinigdoeltreffende nederzettingspatronen. Teneinde de als gevolg van inefficientie ontstane sociale,economische en milieukosten te verminderen zijn beheersmaatregelen geintroduceerd om dezeproblemen het hoofd te bieden. In deze studie is een poging gedaan een model te ontwikkelenvoor het beschrijven van het nederzettingspatroon en voor het verkennen van alternatievengericht op het beheersen van de toekomstige ontwikkeling van dat patroon.
Als stedelijke groei onderzocht wordt is e^n van de eerste vragen die beantwoord moetworden hoe de veranderende begrenzing van nederzettingen vastgesteld moet worden. Voordit doel is een breed toepasbare benadering van het begrip 'aaneengesloten bebouwdoppcrvlak' ('Continuously Built-up Area', CBA) ontworpen. Deze maakt het mogelijknederzettingen te identificeren op verschillende niveaus van generalisatie. In deze benaderingworden de in de werkelijkheid verschuivende begrenzingen van het stedelijk gebied gebruikten niet gemeentelijke, administratieve of politieke grenzen. Eerstgenoemde zijn zichtbaar opsatellietbeelden, kunnen worden vastgelegd en voortdurend geactualiseerd, waardoor 'realtime' informatie voor besluitvorming beschikbaar komt. De kracht van de methode, het CBAconcept toegepast op aardobservatie-gegevens, is dat het aangepast kan worden aan elkgeneralisatieniveau dat overeenkomt met de schalen waarop cartografische presentarie enbesluitvorming plaatsvinden.
Er bestaan methoden om ruimtelijke patronen vast te leggen en te herkennen, maar die zijnniet omvattend genoeg. De beschikbare methoden (zoals ruimtelijke autocorrelatie) wordenin het algemeen gebruikt voor puntpatronen, die het beste deels visueel en deels handmatiggeanalyseerd kunnen worden. Ook technieken voor clusteranalyse bleken niet geschikt voorhet identificeren van ruimtelijke clusters.
Er is een aantal theorieen en modellen ontwikkeld om menselijke nederzettingspatronen tebeschrijven en te verklaren. Een belangrijke conclusie die uit een overzicht van dezemodellen kan worden getrokken is dat zij alle behulpzaam kunnen zijn bij het analyseren vanbestaande patronen. De meeste kunnen, op beperkte wijze, ook nederzettingspatronenvoorspellen. Maar weinige zijn geschikt om veranderingen in nederzettingspatronen te

plannen. Bovendien beschouwen de meest gebruikte modeller! nederzettingen als puntlocatiesals het gaat om de analyse van ruimtelijke spreiding. De omvang van de nederzetting, nietin termen van bevolking maar van grondbeslag of vorm, wordt zelden in de beschouwingbetrokken.
Een andere conclusie is dat de meeste kwantitatieve modellen van nederzettingspatronen inbelangrijke mate uitgaan van aannamen zoals isotrope vlakten en rationed economischgedrag. De geometrisch en statistisch georienteerde modellen staan ver af van benaderingendie de nadruk leggen op stedelijke besluitvorming ('urban manegerialism'), politieke cultuuren planningstijl.
Er moeten derhalve flexibele methoden ontwikkeld worden, niet alleen vanuit conceptueeloogpunt (CBA), maar ook ten aanzien van hun toepasbaarheid voor het modelleren vanregionale nederzettingspatronen. Er zijn geen goed bruikbare technieken beschikbaar om een'formele' ruimtelijke patroonanalyse uit te voeren. De te ontwikkelen methoden moeten deelsgebaseerd worden op visuele en manuele analyse.
Methoden die gebaseerd zijn op traditionele concepten vereisen betrouwbare, complexeruimtelijke en thematische gegevens over een groot aantal aspecten, gegevens die bovendienactueel beschikbaar moeten zijn. De mate van detail die vereist wordt voor informatie overveel functies verandert vaak en is, met name in ontwikkelingslanden, moeilijk regelmatig teactualiseren. De modellen verliezen hun waarde als er verouderde gegevens gebruikt worden.Bovendien is het voor veel stedelijke en regionale systemen belangrijk om een totaalinzichtte verwerven. Maar de informatie die over het algemeen beschikbaar is of beschikbaargemaakt kan worden, is meestal gerelateerd aan individuele beslissingen.
Door de mogelijkheid synoptische overzichten te bieden van grote gebieden, kunncnaardobservatiegegevens (satellietbeelden) een nuttiger basis vormen dan aardbeelden met eenhoger oplossend vermogen. Beeldgegevens met een ruimtelijke resolutie van 72,5 meterblijken adequaat voor het doel (modelleren van nederzettingspatronen) en geven eensamenvattend overzicht van het hele studiegebied. Vergeleken met een resolutie van 10meter, maakt vooral de relatief lage resolutie de anders moeilijke taak om voor dewerkelijkheid het 'bebouwings' beeldpunt te bepalen uit een mix van 64 pixelsgemakkelijker.
Het stadsgewest van de hoofdstad Delhi ('National Capital Region', NCR) is uitgegrocid toteen ingewikkeld administratief en planningsysteem. Nog complexer is de planning van hetregionale nederzettingenpatroon gegeven het feit dat nederzettingen aanwezig zijn van tussende vijfhonderd en negen miljoen inwoners. De planningsdienst beschikt niet over methodenen gereedschappen om het nederzettingspatroon in een gebied met de omvang van de NCRgoed te begrijpen. Het beschikt ook niet over de methoden en technieken om de ontwikkelingvan het nederzettingspatroon te bewaken met een periodiciteit die past bij snel groeiendemenselijke nederzettingen. Het CBA concept, ondersteund door gereedschappen alsaardobservatie en geografische informatiesystemen, maakt het voor planologen,administratieve medewerkers en beslissers mogelijk om meer inzicht in dezc complexiteit teverkrijgen op een wijze die objectief en consistent door technici kan worden uitgevoerd.

Gebaseerd op dit 'nieuwe' inzicht in nederzettingen is een model ontwikkeld omnederzettingspatronen te beschrijven en er voorspellingen over te doen en aanbevelingen voorte geven. Door een flexibele benadering bij het definieren van menselijke nederzettingen enhet gebruik van satellietbeeldcn, kan het model gemakkelijk toegepast worden in situaties metweinig gegevens en met niet goed ontwikkelde werkwijzen voor het plannen vannederzettingspatronen zoals het geval is in ontwikkelingslanden. Het biedt een explicietemogelijkheid om het begrip 'local' in de context van het 74e amendement van de Grondwetvan India beter te definieren en te begrijpen. Dit amendement is gericht op het versterken vande rol van lokale stedelijke lichamen om lokale sociale en economische ontwikkeling testimuleren en om het milieu te verbeteren.
Verwacht kan worden dat het gebruik van de modellen tot twee algemene voordelen zalleiden: een toegenomen aandacht voor de noodzaak om administratieve en planningsgrenzente laten samenvallen en een toegenomen inzicht in de noodzaak om fysieke grenzen entelgebieden van de volkstelling te laten samenvallen. De territoriale eenheden kunnendaardoor geintegreerd worden en als een standaard meetsysteem worden opgenomen in dewetgeving. Hierdoor kan de werkelijkheid in plaats van een administratieve abstractiedaarvan de basis gaan vormen voor de planning en het beheer van menselijke nederzettingen.

ABSTRACT
Analysis of settlement patterns is useful in making decisions about the location of newinvestments, and about the potential for clustering services and facilities in new ways toincrease the capacity of human settlements to stimulate development in their areas. Settlementpatterns in and around metropolitan regions become all the more important when consideringthe pace with which the urban settlements are increasing, both in number and size. Inaddition, in developing countries, there is a new category: increasingly large numbers ofspontaneous human settlements are coming into existence on the urban fringes.
Left to 'natural' processes, these phenomena produce inefficient as well as ineffectivesettlement patterns. To reduce the social, economic and environmental cost of inefficiency,management is introduced to address problems arising from the processes. An attempt hasbeen made by this research to suggest a model for describing the settlement pattern, and forexploring alternatives for the management of the future development of that pattern.
In considering urban growth, one of the first questions to be resolved is how to identify thechanging extent of the settlements. In response, a transferable approach of the 'ContinuouslyBuilt-up Area' (CBA) is devised, which allows identification of settlements at different levelsof generalization. In this approach, the reality of the moving urban edge rather thanmunicipal, administrative or political boundaries is seen (e.g., through satellite images),recorded and continuously updated so as to provide real time information to support decision-making. The strength of the tool (i.e., the concept of CBA, applied to remotely sensed data)is that it may be calibrated to any level of generalisation, corresponding to different scalesof mapped information and decision-making.
No sufficiently comprehensive methods exist for defining and recognising spatial patterns.The methods available (e.g., the spatial autocorrelation) are generally for point patterns,which are best analyzed partly visually and partly manually. Cluster analysis techniques arealso not suitable for spatial clusters.
A number of theories and models have been put forward to describe and understand humansettlement patterns. One important conclusion that can be drawn from a review of thesemodels is that they all help in analysing the existing patterns. Most of them help, in a limitedway, in predicting settlement patterns and, rarely, in planning settlement pattern changes.Moreover, the prevalent models consider settlements as point locations when analysing theirspatial distribution. The size of the settlement, not in terms of the population it holds but interms of the area it covers on ground, or its shape, is hardly ever considered.
Another conclusion drawn is that most quantitative models of settlement patterns rely heavilyon assumptions such as isotropic planes and rational economic behaviour. The geometricallyand statistically guided models do not really work in the light of 'urban managerialism',political climate and planning behaviour.
Thus, methods will have to be developed which are flexible not only in the conceptualcontext (e.g., CBA) but also in their application to model settlement pattern in a region.Satisfactory techniques are not available for performing a 'formal' spatial pattern analysisexercise. The methods developed have to be based on a partial visual/ manual analysis.

Methods based on traditional concepts require accurate, sophisticated and timely availabilityof data, both spatial and attribute, on a variety of subjects. The level of detail required forinformation on many functions changes frequently and is difficult to update on a regularbasis, more so in developing countries. Models lose their sophistication when outdated dataare fed into them. Further, in many urban and regional systems it is important to ascertainthe overall situation. But the information we usually have, or are likely to have, relates, byand large, to individual decisions.
With the capability of providing synoptic views over large areas, remotely sensed data (e.g.,satellite images) can be a useful base for carrying out macro-analyses of settlement patterns,at frequent intervals. It not only provides information more efficiently than field surveys; italso offers a new perception and a new understanding of human settlements.
An interesting finding is that working at the metropolitan regional scale, images with lowspatial resolution are actually more useful than images with higher resolution. The remotelysensed data with spatial resolution of 72.5m is found appropriate for the purpose of this task(e.g., modelling settlement patterns), providing a synoptic view of the entire region understudy. Specifically, its comparatively low resolution performs the otherwise difficult task ofdetermining the 'built-up' pixel out of a mix of 64 pixels (of 10m resolution compared to±80m) in reality.
The National Capital Region (NCR) of Delhi, India, has evolved into a complex planning andadministrative system. More complex is the planning for settlement pattern for the region,with human settlements in population sizes ranging from less than 500 persons to over 9 million people. The planning board does not have the methods and tools to comprehendsettlement pattern over an area of the vastness of NCR. It also does not have the methodsand tools to monitor settlement patterns at intervals appropriate to rapidly growing humansettlements. The concept of CBA, supported with tools such as remote sensing and GISs,enables planners, administrators and decision makers to gain better understanding of thiscomplexity, in a way that can be impartially, and with consistency, executed by technicians.
A model has been developed for describing, and making predictions and recommendationsfor settlement patterns based on the new understanding of settlements. Through a flexibleapproach in defining human settlements, and the use of images from satellites, the model iseasily applied in 'data-poor' situations and with not well established practices of settlementpattern planning, as is the case in many developing countries. It literally provides a tool forbetter defining and comprehending the term 'local', in the context of the 74th Amendmentto the Constitution of India, designed to strengthen the role of urban local bodies inpromoting local social and economic development, and in improving the environment.
Use of the models may be expected to lead to two general advantages, i.e., increasedawareness of the need for coincidence between physical and administrative boundaries, andincreased awareness of the need for coincidence between physical boundaries and the surveyplan for the census. It, then, becomes capable of being integrated as a system of standardmeasurement into the legislation. As a result, reality rather than administrative abstractioncan become the basis for planning and management of human settlements.
LIST OF CONTENTS
AcknowledgementsList of Abbreviations and AcronymsAbstract in NederlandsAbstract in EnglishList of TablesList of IllustrationsList of Appendices
1 INTRODUCTION
1.1 Relevance 1 1.2 Background 2 1.3 Objectives 3 1.4 Scope and Limitations 3 1.5 Organisation of the Book 4
2 SETTLEMENTS, PATTERNS AND SETTLEMENT PATTERNS:CONCEPTS AND DEFINITIONS
2.1 (Human) Settlements 5 2.1.1 Conurbation and Urban Sprawl 6 2.1.2 Urban Agglomeration 7 2.1.3 Counterurbanization 9 2.1.4 City Region 9 2.1.5 Urban Realm 102.1.6 Spatial Diffusion 122.1.7 Spatial Consciousness 122.1.8 Edge City 122.1.9 Territorial Arrangements 132.1.10 Settlement Classification 132.1.11 The Third Dimension 142.1.12 The Time Dimension 162.1.13 Continuously Built-up Area 172.2 Patterns 192.3 Pattern Recognition 192.3.1 Cluster Analysis 212.3.2 Point Pattern Analysis 252.3.3 Spatial Autocorrelation 252.3.4 Autocorrelation in Space and Time 26

2.42.4.12.4.22.4.32.4.42.52.6
3
3.13.1.13.1.23.23.2.13.2.23.2.33.2.43.2.4.13.2.4.23.2.4.33.2.53.2.63.2.73.2.83.33.43.4.13.4.23.4.33.5
4
4.14.24.34.3.14.3.24.3.34.44.4.14.4.24.4.34.4.4
ILWIS 26Measures of Arrangement 27Measures of Dispersion 27Typical Pattern Curves 28Spatial Autocorrelation 29Settlement Patterns 29Conclusions 31
MODELS FOR ANALYZING SETTLEMENT PATTERNS: A REVIEW
Introduction to Models 33Types of Models 34Models and Model Building in Planning 35Models for Analyzing Settlement Patterns 36Gravity Model and the Rank Size Rule 38Central Place Theory 39Growth Pole Concept 42Service Centre Hierarchy 43Scalogram Method 45Sociogram Method 45Bisection Method 45Composite Functionality Index 46Spatial Model for Spatio-Economic Development 50Topodynamic Model 51Inter-Settlement Distances 53Distortion in Settlement Systems 53Beyond Models 54Shapes and Sizes of Urban Settlements 55Fractal Analysis 56Individual Decisions - Overall Effects 56Conclusions 57
MODELLING SETTLEMENT PATTERNS:INPUTS FROM R E M O T E SENSING
Conventional Sources of Data 59Remote Sensing 60Aerial Photography 61Aerial Photography for Urban Planning 61Constraints and Limitations 62The Policy of Restriction 62Satellite Imagery 63Information Extraction 64Classification and Interpretation 65Digital Image Processing 65Cost Effectiveness 66

4.5 Satellite Remote Sensing for Spatial Planning 674.5.1 Population Estimation 674.5.2 Change Detection 674.5.3 Settlement Patterns 684.5.4 Constraints and Limitations 694.6 Status of Remote Sensing in India 704.7 Data Used for this Research 734.7.1 Image Processing 744.7.2 Image Interpretation 754.7.3 Field Check 774.8 Conclusions 77
5 MODELLING SETTLEMENT PATTERNS : ROLE OF GEOGRAPHIC INFORMATION SYSTEMS
5.1 Geographic Information Systems 795.1.1 U s e r s o f a G I S 815.1.2 Information Types 815.1.3 Geo-data Sources 825.2 Analytical Planning Methods, Models, Processes and GISs 825.2.1 Types and Functions of GISs 835.3 Choosing a GIS 845.3.1 Data Structures 845.3.2 With or Without Image Processing 855.3.3 ILWIS 865.4 Integrating GISs and Remote Sensing 865.5 Dynamic GISs 905.6 Status of GISs in India 915.6.1 Availability of GISs 915.6.2 Personnel 915.6.3 Working Environment 925.6.4 Organizational Issues 925.6.5 Efforts of the TCPO 935.7 Other Application Possibilities and Constraints 945.8 Conclusions 94
6 NATIONAL CAPITAL REGION (NCR) OF DELHI, INDIA:AN INTRODUCTION TO THE REGION AND IT's PLANNING
6.1 Delhi - the Historic Walled City 976.2 (New) Delhi - the National Capital 986.3 Delhi - the State 1006.4 National Capital Region 1016.5 The First Plan 1036.5.1 Development Strategy 1046.5.2 A Non-Starter 104

6.66.6 16.6 :6.6 36.76.7 16.7 26.7 36.7 46.7 56.86.8 16.8 26.8 36.8 46.8 56.8 66.8 76.8 86.8 96.8 106.8 116.8 126.96.9 16.9 :6.9 36.106.11
7
7.17.27.2.17.2.1.17.2.1.27.37.3.17.3.27.3.2.17.3.2.27.3.2.37.3.2.4
The Second Plan 106Policies and Strategies 106Policy Zones 107Sectoral Policies 109Development Dynamics 109Population 109Literacy 110Employment 111Industry 111Traffic and Transportation 111Town Profile 112Bahadurgarh 112Bhiwadi-Dharuhera-Rewari Complex 112Bulandshahr 113Faridabad 113Khurja 113Meerut 114Naraura 114Palwal 114Panipat 114Rohtak 115Sikandrabad 115Sonipat 115Planning Process 115Interim Development Plan 116Regional Plan 2001 116Use of Remote Sensing and GISs 116A Scenario for the Planning of Settlement Pattern in the Region 117Conclusions 118
M O D E L S FOR U N D E R S T A N D I N G , MONITORING ANDDESCRIBING; AND FOR PREDICTING AND RECOMMENDINGSETTLEMENT PATTERNS
Explanation of Terms 120A Model for Understanding, Monitoring and Describing 121Application of the Model on the NCR of Delhi 122Point Patterns 122Area Patterns 124A Model for Predicting and Recommending 127Application of the Model on the NCR of Delhi 129A Scenario for 2001 131Assemblage Settlements 131Couple Settlements 133Functional Couple Settlements 133Insular Settlements 134

7.4 Outcome of the Models 1357.4.1 Advantages 1357.4.2 Limitations 1377.5 Appraisal of the Models with respect to the Regional Plan 2001 1387.6 Further Work 140
Appendices 151References 173Index 189
LIST OF TABLES
6.1 Population Distribution of the NCR of Delhi, 1991 MB6.2 Planned versus Real Urban Population in the NCR of Delhi, 1981 105
7.1 Population and Growth Rate of Towns in the NCT of Delhi, 1991 1417.2 Population, Growth Rate and Functional Classification of
Towns in the NCR of Delhi, 1991 1427.3 Transport Demand Forecast Between City Pairs, NCR of Delhi, 2001 1457.4 Population and Rate of Growth of Corridor Towns in the NCR of
Delhi, 1991 1467.5a List of Villages (in 1991) Identified as Potential Towns (in 2001) 14/7.5b List of Additional Villages (in 1991) Identified as Potential Towns
(in 2001) 149

LIST OF ILLUSTRATIONS
Fig. 2.1 The Urban Realm 11Fig. 2.2 One Person per Cubic Mile! 16Fig. 2.3 Example of Prototype Classification for Two Features 20Fig. 2.4 Clusters of Point Patterns in Two Dimensions 23
Fig. 3.1 Christaller's Mixed Marketing and Administrative Model 41Fig. 3.2 Loschian Concept of City Rich and City Poor Sectors 41Fig. 3.3 A Typical Institutional Scalogram 47Fig. 3.4 A Typical Institutional Sociogram 48Fig. 3.5 Bisection Method for Identifying Service Centre Hierarchy 49Fig. 3.6 Spatial Model for Spatio-Economic Development of Metro-Regions 52
Fig. 4.1 A Typical Aerial Photograph 62Fig. 4.2 Flow Diagram for Image Processing and Interpretation
of IRS Data for the Purpose of Identifying andDelineating the Continuously Built-up Areas 76
Fig. 4.3 SPOT Image of Delhi (Part), 1987 78Fig. 4.4 False Colour Composite of the City of Alwar, 1993 78Fig. 4.5 False Colour Composite of Delhi, 1994 78Fig. 4.6 False Colour Composite of Delhi, 1994 78Fig. 4.7 False Colour Composite of the NCR (Part), 1994 78
Fig. 6.1 Shahjahanabad, Delhi, India 99Fig. 6.2 Shahjahanabad - New Delhi, India 99Fig. 6.3 National Capital Region of Delhi, India 102Fig. 6.4 Policy Zones of the NCR of Delhi 108Fig. 6.5 Counter Magnets to the NCR of Delhi 108
Fig. 7.1 A Model for Understanding, Monitoring and Describing 123Fig. 7.2 Rules for Potential Assemblages, Couples and Functional Couples 125Fig. 7.3 A Model for Predicting and Recommending 128
Map 7.1 Census Towns in the NCT of Delhi and in the DMA, 1991-2001 150Man 7.2 rm<;ii<: Towns in the NCR of Delhi, 1961 91 150Map 7.3 Census Towns and Major Transportation Corridors
in the NCR of Delhi, 1991 150Map 7.4 Settlement Pattern in the NCR of Delhi, 1991 150Map 7.5 Predicted Settlement Pattern of the NCR of Delhi, 2001 150Map 7.6 Recommended Settlement Pattern of the NCR of Delhi, 2001 150

LIST OF APPENDICES
I. Integrated Land and Water Information System (ILWIS) Capabilities 151
II. Pattern Curves for Fundamental Pattern Types 153
III. Operational Definition and Delineation of CBA in the NCR of Delhi 154
IV. List of Satellite Data Products Used in the Research 158
V. Comparative Features of Some of the GIS Packages
Developed and Produced in India 160
VI. Sectoral Policies Proposed in the Regional Plan 2001 161
VII. Population, Growth Rate and Functional Classificationof Towns in the NCR of Delhi, 1991 164
VIII. Population and Growth Rate of Towns in the NCT of Delhi, 1991 167
IX. Table Showing Point Neighbour Analysis for the Existing,Simulated CSR and Simulated Regular Point Locations of(Census) Towns in the NCR of Delhi, 1991 168
X. Survey of India Topo-Sheets Used in the Research 169
XI. Extracts from the Constitution(Seventy-fourth Amendment) Act, 1992
170

1
INTRODUCTION
1.1 RELEVANCE
Man, by nature, lives in groups, or communities. The most widespread community unit was,and as yet is, the village. With social evolution and increasing contact between people livingin different communities, the possibility arises of one community serving others by makinggoods and/or providing services in exchange for other goods and other services, or theirequivalent worth in terms of money. In the process of specialisation, one community or partof a community concentrates on producing goods and/or services for others. As increasingspecialization requires access to increasingly large markets, networks of these connectedactivities then trigger the formation of nodes, or towns, of which some then grow to becomecities. Consequently, a hierarchy of human settlements develops, consisting of hamlets,villages, towns, cities and, relatively recently the metro and megalopoleis. These largehuman settlements then serve as economic, political, and cultural centres, provide marketsand administrative and educational specialists, and are characterised by extreme diversity inoccupation and heterogeneity in population (Cowrin, 1977).
The settlement patterns that thus emerge are influenced by socio-economic, physical andnetwork factors. To recognize these helps to analyse the relation between differentconstituents of the patterns, both existing and likely to result due to a process of interventionthrough planning. The analysis can assist planners and policy makers in understanding howthe pattern of settlement and the level of development within the region are related. It canhelp them determine the degree of access that people in different parts of the region have togoods and services (e.g., facilities, infrastructure and organisations); and to judge where thisaccess is inadequate. Moreover, the analysis can be useful in making decisions about thelocation of new investments, and about the potential for clustering services and facilities innew ways to increase the capacity of human settlements to stimulate development in theirareas (Rondinelli, 1985).
Settlement patterns in and around metropolitan regions become all the more important whenconsidering the pace with which the urban settlements are increasing, both in number andsize. So much so that for the first time in history, this decade is expected to witness morepeople living in urban areas than in the countryside. In addition, in developing countries,there is a new category: increasingly large numbers of spontaneous human settlements arecoming into existence in the urban fringes.
1
Left to 'natural' processes, these phenomena produce inefficient as well as ineffectivesettlement patterns. To reduce the social, economic and environmental cost of inefficiency,management is introduced to address problems arising from the processes. The problems arecomplex and immense and no single approach to management will suffice. Among the manyinnovative approaches which are under development are 'Urbwatch' and 'Urbserve',proposed by the International Institute for Aerospace Survey and Earth Sciences (ITC), theNetherlands (ITC, 1993). Whereas the key message in Urbserve is to think and act locally,the key message in Urbwatch is to think and act globally. At the regional level, Urbwatchenvisages a programme for monitoring and reporting on changes in settlement patternsutilising data obtained through remote sensing from satellites (Bolt, 1993). With an aim tocontribute in line with the Urbwatch approach, an attempt has been made by this researchto suggest a model for understanding, monitoring and describing the settlement pattern of a metropolitan region, and for exploring alternatives for the management of the futuredevelopment of that pattern.
1.2 BACKGROUND
A number of theories and models have been put forth to describe and understand humansettlement patterns. Methods generally adopted by geographers, demographers and plannersfor analyzing settlement patterns can be grouped as based upon morphological classifications,population size classifications and functional classifications. Most of these methods have beendeveloped, tested and applied in varying situations and complexities, mostly in the developedpart of the world. They have also been adapted to meet area specific and other conditions.However, most of these methods assume and dwell upon the availability of a large amountof information both on socio-economic and physical factors. It is understood that the type ofinformation suggested to be used by a method is mainly guided by the type of informationthat was readily available at the time the method was propagated. Many information typesthat were not considered by these methods (or were thought to be difficult to collect) wouldbe more readily collected today. Application of remote sensing technology opens up a wealthof information related to physical factors directly and many others indirectly. The existingmethods of settlement patterns analysis might be enriched by making use of this additionalinformation. Moreover, this additional information is available at shorter and shorterintervals, thereby enabling the researcher to understand settlement patterns of a givensituation on a time basis, to point out the changes, and hence to consider possible futurepatterns. Availability of PC-based Geographic Information System (GIS) packages also makesit more convenient, now, to understand and simulate the settlement patterns under variousconstraint situations, and to evolve alternative scenarios concerning future changes.
Besides depending heavily on the availability of a large variety of data at a detailed level,most of the existing methods of understanding settlement patterns rarely extend themselvestowards predicting or recommending a pattern. Many of the sophisticated models beingdeveloped have an added disadvantage. They are far too complicated to be easily understoodand comprehended by an average planner working in the regional or local planning authorityin a developing country. As a result they remain 'book' models, rarely reach the 'drawingboard' and never reach to the ground.
2
1.3 OBJECTIVES
Within the outlined framework of relevance and background, this research aims at exploringthe extent to which existing models of settlement patterns analysis can be modified andupdated to take into account the non-availability of data from traditional sources, and themore ready availability of data through remote sensing, with the following objectives:
1.3.1 To investigate, by means other than remote sensing techniques, theapplicability of existing theories and models of settlement patterns analysis inthe present day context and to identify the information gaps, if any, withspecific reference to developing countries;
1.3.2 using remote sensing techniques, to explore and assess the possibility ofmodifying these theories and models so as to update them, and to fill in thegaps, if any;
1.3.3 to evolve a model, prototype in the context of urbanization in India, whichcould later be developed to become a generic model relevant to developingcountries, for understanding, monitoring and describing settlement patterns inmetropolitan regions, dependant primarily on remotely sensed data; and
1.3.4 to evolve a model, as in 1.3.3 above, for predicting settlement patterns inmetropolitan regions and recommending management steps that might beundertaken to assist or modify the course of emergence of predicted patterns,dependant primarily on remotely sensed data.
1.4 SCOPE AND LIMITATIONS
The scope and limitations of the research are:
1.4.1 The scope is limited to selected theories and models of settlement patternanalysis concerned with metropolitan regions;
1.4.2 the scope does not seek to challenge or question the validity of the selectedtheories and models but attempts to modify them to accommodate new kindsof data and human settlement types (i.e., remotely sensed data andspontaneous human settlements);
1.4.3 social and economic (e.g., technical, political, administrative andorganisational) as well as physical linkages between human settlements playvery important roles in shaping the settlement pattern in a region. However,the models being developed in this research are general models which do notspecifically deal with any of these linkages except, to a limited extent, withphysical linkages; and
1.4.4 application of the models developed in this research is limited to the NationalCapital Region (NCR) of Delhi, India.

1.5 ORGANISATION OF THE BOOK
Following this first and introductory chapter, the book is divided into six further chapters.Whereas all the illustrations and tables have been put along with the text relevant to them,all the appendices and references have been placed at the end of the book.
Chapter Two undertakes a critical review of the prevalent concepts and definitions of the twokey words used in the research, i.e., (human) 'settlements' and 'settlement patterns'. Thechapter identifies the limitations attached to conventional definitions and how these limitationsfurther limit their application towards building a model. A few non-conventional as well asdictionary meanings have also been looked into. Following the same format, a critical reviewof most models used for analyzing settlement patterns is made in Chapter Three. While anattempt is made in this chapter to identify the limitations attached to these models, somefactors beyond the scope of these models, yet important in shaping settlement patterns, arealso studied. The findings of these two chapters are used in proposing new definitions andthe models in Chapter Seven.
Chapters Four and Five are devoted to appraising the techniques of Remote Sensing andGeographic Information Systems (GISs) respectively. Both techniques are discussed for a general understanding of their application usefulness and their limitations in the field ofspatial planning, and more specifically their usefulness and limitations in modelling settlementpatterns. As the models developed are intended to be applied in a developing country (i.e.,India), a description of the status of the two techniques in India is also presented.
A detailed overview of the growth of Delhi from a walled city of 5 sq. km to the NationalCapital Region is made in Chapter Six. Besides tracing the history of growth anddevelopment, important planning interventions made from time to time are also summarized.The chapter concludes with a description of the region, the policy framework for its planneddevelopment, and a scenario in which models for understanding, monitoring and describing,and for predicting and recommending settlement patterns, are developed.
Chapter Seven, last in the book, draws from the preceding chapters. Based on the findingsof Chapters Two and Three, it provides the definitions and concepts finally adopted andoperationalized to form the basis of model building. It draws from Chapters Four and Fivein delineating various human settlements, and developing and applying the models in theNational Capital Region of Delhi. The chapter then assesses the models in terms of theiradvantages and limitations. The chapter concludes with an appraisal of the models withrespect to the regional plan, and with suggestions for further research.
4 r

2
SETTLEMENTS, PATTERNS AND SETTLEMENTPATTERNSCONCEPTS AND DEFINITIONS
Human beings easily associate themselves with human settlements. Yet, they differ in theirperception of human settlements depending upon their experiences - the settlements that theyhave lived in or are living or have seen or heard of. When and how does a human settlementtransform from a village to a town or a city; what separates two settlements physically; whatto expect from a big settlement that the smaller settlement can not provide? Perception ofhuman settlements vary not only among the residents in general but also among professionalsdealing with various aspects of human settlements. This variation in perception, subsequently,leads to variation in perceiving and interpreting settlement patterns.
This chapter makes a critical review of the prevalent concepts and definitions of the keywords (human) 'settlements' and 'settlement patterns'. It identifies the limitations attachedto conventional definitions and how these limitations further limit their application towardsmodelling settlement patterns. Further, the chapter reviews some of the non-conventionalapproaches to define the key words.
A major consideration in making survey of literature on the subject was that of relevance.Those parts of the literature, that have an interface with existing planning practices in Indiawere selected. The parts which did not have an interface with the existing situation in Indiawere dropped. The selected parts of the literature represent the perception of these key wordsby an average citizen (i.e., through dictionary meaning), by an administrator (i.e., throughformal definition) and by a spatial planner (i.e., through concepts found in planningliterature).
The chapter concludes with a selection of concepts and definitions that were found useful indeveloping the models, in Chapter Seven.
2.1 (Human) SETTLEMENTS
The word (human) 'settlement' means different to various individuals, professionals andphysical planners. It may encompass different levels and scales of space, time and functions.It is an 'establishment of people in a new region; a newly colonised region; a smallcommunity' (Morris, 1976).
5

It has also been described as 'the act of peopling or colonizing a new country or of plantinga colony; an assemblage of persons settled in a locality: hence a small village or collectionof huts and houses' (Stamp and Clark, 1979). Global Report on Human Settlements(UNCHS, 1986) describes it as 'an assemblage of persons settled in a locality'. The term isused by geographers to cover all groups of human habitations (Stamp, 1966) ranging fromeven single dwellings (Stamp and Clark, 1979) to the largest city (Mayhew and Penny,1992).
In spite of these general descriptions, an urgent need for good and generally accepteddefinition of human settlements has always been felt. Sub-consciously, human settlementswere viewed as a fundamental expression of 'man-man' and 'man-land' relationships (Gamer,1968). The expression 'human settlements' has also often been referred to by terms as'cities', 'urbanisation', 'housing' and 'cities and towns'. All of these terms are not fullyadequate to define 'human settlements'. Moreover, the legal and administrative identificationsof human settlements are distorted by their historical and constitutional evolution (Haggett,1972).
The United Nations Conference on Human Settlements (Habitat), held in Vancouver in 1976,by its very name gave global recognition to the holistic concept of 'human settlements'(Leman, 1987). The Conference gave a first comprehensive description of the concept ofhuman settlements: 'The fabric of human settlements consists of physical elements andservices to which these elements provide the material support' (UNCHS, 1976). While thisdescription provided an insight to a human settlement, it was not defined enough to be ableto demarcate one.
Keeble (1969) also noted the difficulty in answering the question, 'What is a town?'.'Something bigger than a village; something smaller than a conurbation; something which,except for ribbon and sporadic development, is separated from neighbouring settlements byagricultural land', was the best answer that he could provide. Alas! This agricultural land,performing the separating function, is diminishing very fast, making the question moredifficult to answer. There are indeed no agreed definitions to separate a city from the largemetropolis or the smaller town (Goodall, 1987).
2.1.1 Conurbation and Urban Sprawl
Conurbation has also been used to mean a continuous built-up area formed by the coalescingof once-separate settlements into a continuous built-up area, initially through ribbondevelopment. The term has now largely been replaced, notably by Metropolitan Area andMetropolitan Labour Area (Johnston, 1981). A group of towns forming a continuous built-uparea has also been referred to as 'conurbation' (Mayhew and Penny, 1992). It is differentthan urban sprawl, which is used to express the phenomenal spread of urban growth outwardsfrom the town (Ratcliffe, 1981, p.40); housing, shops, and work-shops forming an oftenhaphazard spread of buildings at the edge of the city (Mayhew and Penny, 1992).
Governmental jurisdictions have traditionally been territorially based and bounded (Webber,1964). The Census of India classifies human settlements into a hamlet, village, town, andurban agglomeration. Other concepts of a urban village, city and metropolitan city are though
6
non-official, yet widely accepted among planners and other professionals. Census of Indiafurther classifies the rural settlements into 7 size classes of less than 200, between 200 to499, 500 to 999, 1,000 to 1,999, 2,000 to 4,999, 5,000 to 9,999, and 10,000 and morepersons; and urban settlements (towns1) into 6 size classes of below 5,000, between 5,000to 9,999, 10,000 to 19,999, 20,000 to 49,999, 50,000 to 99,999, and 100,000 and morepersons. All class-I towns (population size of 100,000 or more persons) are generally knownas cities. All towns or urban agglomerations of population size of one million or morepersons are generally known as metropolitan cities; 5 million or more being known asmegacities. The static definition (as applied from census year to census year, i.e., beginningof each decade) adopted by Census of India also brings a large number of settlements fromone category to another overnight. There is no concern for the physical extent of thesettlement and nor for the fact that in large urban settlements physical extent is alsoincreasing very rapidly. The static definition also does not cover the scope of a number ofinformal human settlements both within, on the periphery, and outside the urban settlements.These rigid definitions not only pose challenges for planning-researchers, they pose not-easy-to-solve problems for the municipal and city administrators. Computation of the growth ofpopulation in cities on the basis of population size of urban centres identified as cities in therespective censuses, has often raised false alarms (Kundu, 1982).
2.1.2 Urban Agglomeration
An urban agglomeration is identified by the Census2, yet continues to be looked after by a
As per the definition adopted by the Census of India, towns are p laces with a municipal corporat ion, a municipal area commit tee , a town commit tee , a notified area commit tee or a cantonment board; also allp laces having 5 , 0 0 0 or more inhabitants, a densi ty of not less than 3 9 0 [subsequent ly raised to 4 0 0(Meshram and Bansal , 1993)] persons per sq. k m , pronounced urban characteristics and at least three-fourthof its adult ma le population e m p l o y e d in pursuits other than agriculture (Clark, 1982) . A few p laces notposses s ing all these characteristics but thought to be predominantly urban are also so des ignated. A towncan be dec lass i f ied , h o w e v e r , either because of a change in definition or because its total population ornumber of urban workers decl ined (Mil l s and Becker , 1986) .
Mos t censuses identify urban areas that extend beyond the boundaries of local government jurisdict ions .As urban p laces g r o w , the urban population may spill over local government boundaries and into what w a sformerly a rural area. Alternatively , two or more towns may grow together , so that they b e c o m e o n e urbanplace . 'Metropol i tan area' is the name most c o m m o n l y applied to such p laces .
T h e 1961 Indian census introduced the notion of a town group. T h e subsequent cen s u s e s have e m p l o y e dthe term 'urban agg lomerat ion ' . An urban agg lomerat ion consists of one or more towns or cit ies and theadjoining urban outgrowths (Mil l s and Becker , 1986) . S o m e small urban places do also get termed as urbanagglomerat ions under this notion.
Formal ly , an urban agglomerat ion constitutes (Census of India, 1981):
i. a city or town within a cont inuous outgrowth, the outgrowth be ing outside the statutory l imits butfall ing within the boundaries of the adjoining vi l lage or v i l lages; or
ii. t w o or more adjoining towns with their outgrowth as in (i) a b o v e ; oriii. a city and one or more adjoining towns with their outgrowths all of which form a cont inuous
spread.
(continued...)
7
Gerritsen
Typewritten Text
1
Gerritsen
Typewritten Text
Gerritsen
Typewritten Text
Gerritsen
Typewritten Text
Gerritsen
Typewritten Text
2
Gerritsen
Typewritten Text
Gerritsen
Typewritten Text
_______________________________________________________________

number of municipalities, as is the case in Bombay, India. The Master Plan for Delhi (DDA,1990) suggests that the Delhi Metropolitan Area, including the Union Territory of Delhi (nowredesignated as National Capital Territory of Delhi), should be considered as one 'urbanagglomeration' for the purpose of planning3. Even administrative boundaries can not, andhave not remained static. The compilers of the United Nations Demographic Yearbook arguethat the boundaries that mark off towns, cities and municipalities for local governmentpurposes vary from place to place and constitute an extremely poor basis for urban definition(Clark, 1982). Examples are in plenty where these boundaries have been realigned toaccommodate (largely) political and (partially) socio-economic-administrative interests. Afterall, we do have overbounded or underbounded cities (Goodall, 1987). It is not uncommonfor some new statutory towns seeking denotification so as to remain eligible for benefits dueto rural areas, including exemption from payment of municipal taxes (Krishan, 1993). Afterthe 74th Amendment to the Constitution of India, in 1992, and subsequent enactment of theMunicipalities Act, 1992, a recognition has been accorded for the first time to the areas intransition from rural to urban in the form of Nagar Panchayat, a body similar to municipalcorporations (Government of India, 1993; Meshram and Ban sal, 1993). In addition to hisown theoretical studies, Christaller suggested that geographers could contribute to theresolution of administrative problems related to urban integration and dominance (Preston,1992). His fourth principle of central place organisation and a mixed marketing-administrative model could form the basis towards removing rigid and static nature of theknown definitions of human settlements.
Even though Keeble (1969) identified human settlements as the National Capital, theprovincial capitals, local capitals, fully-fledged towns, urban villages or major rural centres,villages or minor rural centres, hamlets, and isolated farmhouses and agricultural worker'scottages, he also pointed out that many places possess characteristics intermediate betweentwo of the grades, and in the last resort it is the function that they perform rather than theirpopulations and visual characteristics which determine their position on the scale. The sizeand complexity of the modern human settlements means that for most purposes, plannershave little choice but to rely upon secondary sources of data and so census authorities playan important role in shaping our views of human settlement structures. Recent technicaladvances in computing systems, technique of geo-coding and GISs and remote sensing havemade it possible for researchers to develop their own aggregation of human settlements from
2(...continued)T h e dictionary (Morris , 1976) meaning o f ' a g g l o m e r a t i o n ' is a confused or jumbled mass of things clusteredtogether. It is the concentrat ion of activit ies , usually industries, in the same locat ion . It may also apply toconcentrat ions of urban sett lements ( M a y h e w and Penny , 1992) . It is the associat ion of product ive act ivit iesin c lo se proximity to one another, as in a major special ized industrial reg ion or in a large town or city.Agg lomera t ion typical ly g i v e s r ise to external e c o n o m i e s associated with the co l l ec t ive use of theinfrastructure of transportation, communica t ion facilities and other serv ices . Agg lomerat ion a l so facilitatesthe rapid circulation of capital , commodi t i e s and labour (Johnston, 1981) . 'Agg lomerat ion ' should not beconfused with ' cong lomerat ion ' , which is referred to a number of industries producing a number ofunrelated products ( M a y h e w and Penny , 1992) . The emphas i s here is on the heterogenei ty aspect of theobjects forming the conglomerat ion (Morr is , 1976) .
3 S e e Chapter Six for a detailed description of the concepts of the Union Territory of De lh i , the Delhi
Metropol i tan Area and the National Capital Territory of De lh i .
8
Gerritsen
Typewritten Text
_______________________________________________________________
Gerritsen
Typewritten Text
Gerritsen
Typewritten Text
2
Gerritsen
Typewritten Text
Gerritsen
Typewritten Text
3

census data. In the United Kingdom, 1971 census data was released on a grid square basis.Grid squares are easy to map, and as all grids contain the same area of land, all counts areautomatically density measures, and absolute numbers can be mapped directly. Theavailability of geocoded data enables researchers to move away completely from arbitraryadministrative definitions of (types of) human settlements and to build up pictures of theurban landscape using a wide variety of indices (Clark, 1982).
2.1.3 Counter-urbanization
There also have been a few non-conventional conceptual approaches to analyse urbanisationprocesses and urban settlements. A recent field of inquiry deals with the concept ofcounterurbanization - a process of population deconcentration where large metropolitan areaslose population by net migration to non-metropolitan areas (Johnston, 1981). This may occurspontaneously as cities become expensive, polluted, and congested or may be encouraged bygovernments (Mayhew and Penny, 1992). It is deemed to be the prevailing tendency whenthe distribution of population is shifting from larger to smaller places, where 'places' aredefined in terms of relatively self-contained areas comprising an urban centre and itscommuting and servicing catchment. Counterurbanization does not require the abandonmentof all types of urban settlements in favour of the villages and isolated dwellings traditionallyassociated with the countryside, nor does it necessitate a return to rural life-styles in thesense of giving up the trapping of a modern materialistic society. It does, however, requirethe faster growth of those smaller places that are not linked to major cities by significantcommuting ties or other frequent journeys than those that are, and therefore specificallyexcludes the long-established processes of suburbanization and metropolitan expansion(Champion, 1989). Though this working definition is not always easy to implement,particulary in heavily urbanized multi-nodal regions, its intent is clear, namely that traditionalsuburbanization and local metropolitan decentralization are not considered to be aspects ofcounterurbanization (Champion, 1989). In the case of the National Capital Region of Delhi,though many activities have been encouraged to be deconcentrated, the net result is far from•counterurbanization'.
2.1.4 City Region
The concept of the 'city region' is used to describe those vast areas of continuous or nearlycontinuous development too large to be considered as a single city, however big, because oftheir physical extent and because they contain within them the whole range of activities andfacilities found within a normal region (Keeble, 1969). The terms 'urban field' and 'urbanregion' are generally preferred, used to define the territory functionally linked with a town,or to mean the hinterland or trade area (Stamp and Clark, 1979); that area surrounding a citywhich is influenced by it. Its boundary can not be demarcated by a single line. In the caseof very large cities, the urban field is often considered to be global (Batty and Longley,1994). The concept of 'plug-in-city' (Goodall, 1987) is good working understanding of urbanfield. The field falls into three zones: a core area composed of the built-up area of the town,an outer area which uses the town for high-order goods and services, and a fringe area whichuses the urban area rarely and then only for very high-order goods and services (Mayhewand Penny, 1992). Smailes (1953) draws a distinction between the two, in the sense that
9

'urban region' refers to relatively homogenous land-use areas within cities, and not to theregion for which the city serves as the focus. Essential nature of such an area is that at itscore is a very large central area which exerts a dominant effect over a large number ofsmaller human settlements which are little separated from it or from each other. An urbanregion is rather similar to a conurbation but can be distinguished from it because'conurbation' is taken as referring to a more limited area than comprises an 'urban region'.It is, by its nature, very difficult to define in any decisive way the boundary of an 'urbanregion' (Keeble, 1969). Generally, in practical terms, it is based more on spatially distincthousing, labour and services markets.
Lynch (1960) perceived a metropolitan region as a functional unit of environment andstressed that this functional unit should be identified and structured by its inhabitants. Forthe imageability of such a unit, it should have enough surface area so that all minor elementscan have some reasonably close relation to it.
2.1.5 Urban Realm
Webber (1964) introduced the concept of 'nonplace urban realm', referring to the'communities of interest-communities' sharing a common market or service area,interdependent and interactive with each other in some degree; and at their respective levelsof specialization, each heterogenous group of interest-communities making up a complex butorganized system of activities and intercourse. An urban region reflects a unitary idea - atany given instant in time, its spatial extent is essentially fixed. An urban realm, in contrast,is neither an urban settlement nor a territory. Webber further identified a hierarchy of realmsoperating at the world, nation, subnation, sub-subnation, metropolitan and local levels. Theparticipants in each realm are constantly shifting but there are very large numbers of peoplewho devote large proportions of their time to roles associated with local realms.
Contrary to the vertical divisions of territory that accord with place conceptions of region,he viewed the functional processes within the total national urban space as horizontallystratified (Figure 2.1).
Thus, the most specialized people communicate across the entire nation and beyond. At lesserlevels of specialization, people interact over shorter distances but the extent varies fromperson to person and, for any given person, from moment to moment. Thus, the urbansettlement is far from being a unitary place. Its composition and its spatial dimensions arerelative to the observations of participants in different realms at different instants in time.Each problem defines its own community for solution, and each interests-group defines itsown community for satisfaction (Webber, 1964). Creation of a European EconomicCommunity is clearly an example of an effort to selectively break the barriers of unitary,land-based governmental boundaries. Resulting from developments in telematics, these ideaswere recently reintroduced under names like 'global village'.
10

Fig. 2.1 The Urban Realm(after Webber)Source: Webber, 1964, p. 119
"Geographic space extends horizontally and level of special izat ion vertically in the drawing. Thebars then represent the realms which extend in overlapping patterns across the continent, those atthe highest levels being spatially most extens ive . Individuals participate in first o n e then anotherrealm, as they play first one role, then another. The spatial patterns of realms are thus indistinctand unstable . ' (Webber, 1964, p . 119) .
LI

2.1.6 Spatial Diffusion
Processes of spatial diffusion also occur at many geographic scales. At the micro scale, ideasand innovations spread through social communication networks linking individuals to oneanother. When considered at a regional level, different network of communication may comeinto play, probably closely aligned to the pattern of linkages between the central places.Finally, at the national or even at international level, macro flows of information, warpedand shaped by great metropolitan fields, diplomatic relationships, political considerations andso on, guide the course and intensity of diffusion processes (Abler et al., 1972).
2.1.7 Spatial Consciousness
Harvey (1973) identified 'spatial consciousness' or the 'geographical imagination' whichenables an individual to recognize the role of space and place in his own biography, to relatethe spaces he sees around him and to recognize how transactions between individuals andbetween organizations are affected by the space that separates them. Contrasting it with the'sociological imagination', he argued, "The trouble is that the use of one sometimes conflictswith the use of the other. Any successful strategy must appreciate that spatial form and socialprocess are different ways of thinking about the same thing. We must therefore harmonizeour thinking about them or else continue to create contradictory strategies for dealing withcity problems." (Harvey, 1973, pp.26-27). In the same work, Harvey records three basiccategories of spatial experience identified by Cassirer (1944, as quoted by Harvey, 1973).The first, organic space, the kind of experience which appears to be genetically transmittedand hence, biologically determined. The second, perceptual space, involves the neurologicalsynthesis of all kinds of sense experience - optical, tactual, acoustic and kinesthetic. Thethird kind of spatial experience is abstract, called symbolic space, where the space isexperienced vicariously through the interpretation of symbolic representation which have nospatial dimension. The three levels of spatial experience are not independent of each other.We need, for example, to find some way of representing events as they occur on theperceptual or organic level by some abstract symbolic system which forms a geometry.Conversely, we may regard it as finding some interpretation at the organic or perceptual levelfor ideas developed at the abstract level.
2.1.8 Edge City
In the same context, it is also important to mention here the concept of 'edge city'. Garreau(1991) used the expression 'edge' to represent the vigorous world of pioneers andimmigrants, rising far from the old downtown, where little save villages or farmland lay onlythree decades before; and the expression 'cities' to represent all the functions a city ever has,albeit in a spread-out form that few have come to recognize for what it is. By any functionalstandard, each edge city identified by Garreau (1991) was larger than their correspondingdowntown. In providing a functional definition of the edge city, Garreau (1991) includedsuch aspects as leasable office space, leasable retail space, jobs outnumbering bed rooms, andperception by population as one place. However, he does identify the problems in definingthese places. One problem is that of history, which the edge city has none. The second is thatthey rarely have a mayor or a city council, and just about never match boundaries on a map.
12

"After all is said and done, /w-the citizen-is really the city. The city is going where he goes."(Frank Lloyd Wright, as quoted by Garreau, 1991, p. 11). Perhaps 'edge city' representstaking the functions of the city (the machine) and bringing them out to the physical edge ofthe landscape (the frontier).
2.1.9 Territorial Arrangements
"What is happening to our cities? We all feel the problems, we see them, smell them, hearthem, we are sensitive to them, but we have not really defined what they are." (Doxiadis,1976, p . l ) . The first significant contribution in defining human settlements was made byDoxiadis in the year 1976, in his book entitled, 'Action for Human Settlements'. Accordingto this definition, "Human Settlements are the territorial arrangements made by Anthroposfor himself." (Doxiadis, 1976, as quoted by Leman, 1987, p.243). The immense benefit ofthis definition was that, in what until then was an amorphous, dimensionless and concept-lessarea, a line was suddenly drawn - a 'water mark' appeared -denoting the current level ofunderstanding of a given phenomenon which, only from that point on, could be effectivelyconsidered by a number of persons. It offered the first opportunity for testing and evaluatingthe 'inclusions' and 'exclusions' brought about in the course of developing the definition(Leman, 1987).
2.1.10 Settlement Classification
Haggett et al. (1977) provided a human settlement classification as depicted below.
N O D E S
Sett lements (morphologica l classif ication)Urban Sett lements Rural Sett lements
IrregularRegular
Clusters (population-size classif ication)( e . g . , Metropol i s , c i ty , town, v i l lage , hamlet)
Places (functional classif ication)( e . g . . Central p laces , non-central places)
It was around the same time that Dansereau (1978) attempted to define and classify humansettlements based on an ecologically coloured or textured matrix. He viewed humansettlements as alternative patterns of sharing and exploiting resources, and of inserting thehuman presence into widely different environmental matrices. Rationale for such a definitionwas based on the recognition and mutual inter-relationship of:
a. the ecological characteristics of the supporting landscape and its yields and stressesas a resource basis;
b. the way-of-life of the human population estimated in terms of the array of processesemployed towards resource tapping and cycling; and
13

c. the resulting man-to-environment and man-to-man strategies that involve innertensions and inter-ecosystem exchanges.
Dansereau (1978) further provided a repertory of human settlements classifying them intofour panels of Wild, Rural, Industrial, and Urban settlements. These were divided into 21types of human settlements as follows.
WILD RURAL INDUSTRIAL URBAN
NomadicTranshumantGathererHunter/ FishermanHunter/ Farmer
Pastor/ RangerPlanterFarmerMonocul tureHorticultureNon-ProducerMin ing
H e a v y IndustrialCraftsmanEngineer ingManufacturingServ i ce
Vi l lageT o w nCityMetropo l i s
The upper end of the urban settlements could be further extended to Megalopolis andEcumenopolis* - the world city put forth by Doxiadis. One interesting feature of Dansereau'sapproach was that a village, town, city and metropolis had not been distinguished on thebasis of their size and density as those in themselves could not be major criteria. Fitness tolandscape and to regional systems had been viewed as more useful. The followingdescriptions for distinguishing a village and a town did not, for instance, use any referenceto population size:
"The village has one or more streets, residences that are not too densely clustered,usually an exchange centre (communications and trade), and much adjacent ruralland." (Dansereau, 1978, p. 181); and
"The town is a larger settlement, comprising many streets, having sidewalks, rowupon row of shops, many public buildings and services (including intramural publictransport)." (Dansereau, 1978, p. 181).
An important lesson drawn from this scheme to classify the cells of land-occupation on anecological basis and subsequent classification of human settlements is the ease with which thevarious criteria can be picked up from remotely sensed data.
2.1.11 The Third Dimension
The approaches to define human settlements, as described earlier, have been generallycriticised because of their limited concern based on two dimensions. The third dimension ofvertical space is often neglected even though people are distributed in a three dimensionalspace (Stewart and Warntz, 1958). This neglect is clearly expressed in the manner in whichphysical planners use the word 'density'. It may be seen as strange that spatial 'density' has
Ecumenopolis is "The c o m i n g city that wi l l , together with the corresponding open land which isindispensable for m a n , cover the entire earth as a cont inuous network of urbanized areas forming a universal sett lement." (Dox iad i s , 1 9 6 6 - 6 7 , V o l . 2 , p . 4 0 5 ) .
14
Gerritsen
Typewritten Text
Gerritsen
Typewritten Text
______________________________________________________________
Gerritsen
Typewritten Text
Gerritsen
Typewritten Text
4

up till now been predominantly expressed by the planning community as 'population per unitarea', whereas the expression in scientific terms could have been as 'population per unitvolume (or space)'. Conceptually, density, in relation to planning, means "... the number ofobjects - houses, rooms, persons, etc. - per unit of space." (Keeble, 1969, p. 143, emphasisadded). However, in practice, the three dimensional space was reduced to two dimensionalarea. Today, for planning purposes, it is the ratio between the population of a given area andthe area (Caminos and Goethert, 1978). It may be argued that compared to the arealdimensions the vertical space a human settlement occupies is negligible. However, if thethickness of a sheet of metal is even less than a millimetre, its density is still expressed as'mass per unit volume'. Was the author of a recent advertisement (Figure 2.2) ignorant whenproviding the caption, "One person per cubic mile.'' (TIME, 1996)? The message hiddenbehind the caption was the inclusion of a 'vertical space'.
Neglect of the third dimension, in spatial planning, may have originated in the old times,when most of the buildings in a human settlement had only one floor - the ground floor. Thethird dimension may have been taken as unit (say, 1 floor). Using the third dimension asunity will not change the figures of density of a human settlement as generally expressed. Butit will, and it should certainly, effect its units causing a change from 'population per unitarea' to 'population per unit volume (or space)'. Moreover, the assumption of the third unitbeing unity itself can be challenged in the present day context when residential buildings arecommonly not confined to the ground floor and have multi-stories.
The term 'density', as being used today, is often no more than a measure of concentrationof population per unit area. This expression is only partially useful while planning forinfrastructure in the human settlements. For example, the measure of density does not serveany useful purpose for planning for storm water drainage in urban areas (Mahavir and Sokhi,1982). But does it serve a purpose when comparing inter-settlement characteristics? Is it safeto assume that two cities having same density of population are equally congested? Does theirrespective population reside on small plots of land or in high rise apartment buildings?
Some expressions of 'density' have been developed by physical planners in the form of theFloor Area Ratio (FAR) and the Floor Space Index (FSI). But these are instruments forcontrolling the building activity (Keeble, 1969) and not effective tools for measurement.'Accommodation density' (e.g., persons per dwelling unit) has been used as a measure, yetthe expression is not able to specify whether or not all the accommodation is available on theground floor.
Although further discussion on the limitations5 attached to the current usage of the term'density' at various levels of spatial planning (e.g., the neighbourhood, zonal, city) is beyondthe scope of this research, it should be noted that where, in the balance of this book, the termis used, it has a spatial rather than just a geographic meaning.
S e e a l so Tobler ( 1 9 6 9 ) ; Nordbeck (1971) ; Dutton ( 1 9 7 3 ) ; U n w i n ( 1 9 8 1 ) ; Bolt ( 1 9 8 3 ) ; and Batty andLong ley (1994 ) for more arguments illustrating the limitations to the current usage of the term 'density ofpopulation".
15
Gerritsen
Typewritten Text
Gerritsen
Typewritten Text
________________________________________________________________
Gerritsen
Typewritten Text
Gerritsen
Typewritten Text
5

2.1.12 The Time Dimension
Leman (1987) discussed yet another dimension, that of time. Human settlements are not staticbut dynamic. Towns and cities are inherently difficult to define because they are membersof a continuum of nucleated human settlements that grade into one another. Basic distinctionscan be drawn between hamlets and towns, villages and cities, and yet differences are not sosharp between adjacent members of the continuum. As one goes down the scale from thelargest urban agglomeration to the smallest farmstead, it is extremely difficult to identifydividing lines and terminology that are universally acceptable (Clark, 1982 and Keeble,1969). Human settlements are not changing from census to census, from one election toanother election, or from one municipal survey to another. They are in fact changing everyday - moving from one static category to another static category, thus always being dynamic.There' have been attempts to define the city by man's capacity to move within the frameworkof a certain territory, within a framework of certain time range and always within the spaceof a single day (Doxiadis, 1966-67). This itself signifies the fact that for individual residentsthe settlement is changing each day. For the Detroit Urban Area, Doxiadis (1966-67, Vol.2,p.4) writes, "Where the actual...area ends is difficult to determine. This is a dynamicallygrowing city in which the boundaries of people, daily movements, economic and other forcesare constantly expanding.". Kulshrestha (1980) considered human settlements (urban or rural)as the articulating point of human habitation and activity location. Bolt (1983) dealt with theelement of dynamism by 'open ended' urban communities. They are 'platforms' for theconstruction of 'unlimited' floor-space, with 'unlimited' population potential. Thus, theconcept is dynamic in three ways. Firstly in the open ended development of each community.Secondly in the open ended number of urban communities in each constellation of urbancommunities. Thirdly in the open ended number of constellations. The 'platforms', however,are limited in size (to human scale dimensions).
EKISTIC grid index6 for the scale of human settlement(s) continues to be based uponpopulation size (only). However, population size (alone) as indicator of urban status is usedin only 33 out of the 133 countries and sovereign territories from which data are assembledby the United Nations. The different population minima employed, ranging from 200 to10,000, raises questions concerning the utility of a size measure alone (UN, 1977, as quotedby Clark, 1982).
t Anthropos
R o o mHouseHousegroup
Small Ne ighbourhoodNeighbourhoodSmall Pol i sPol isSmall Metropo l i sMetropo l i sSmall M e g a l o p o l i sM e g a l o p o l i sSmall Eptropolis Eperopolis
Ecumenopolis
I:5
4 0250
1 ,5001 0 , 0 0 07 5 , 0 0 0
5 0 0 , 0 0 04 mil l ion
25 mil l ion150 mil l ion
1,000 mi l l ion7 , 5 0 0 mil l ion
5 0 , 0 0 0 mil l ion
16
Gerritsen
Typewritten Text
Gerritsen
Typewritten Text
_______________________________________________________________
Gerritsen
Typewritten Text
Gerritsen
Typewritten Text
6

MS
J
There's little that is
more relaxing than
a quiet beach.
In coastal Portugal,
the opportunities to
relax are better than
almost anywhere.
With almost
a thousand miles
of golden sands
on offer that's an
awful lot of Atlantic
coast per person.
For bathers, it's a lot
of Atlantic, too.
From the Algarve
to the Costa Verde
in the north and from
Madeira to the
Azores you 11 find
no end of sun, sea,
sand and peace and
quiet.
Something, we feel,
worth shouting about.
Algarve
The thrill of discovery. Portugal j £ c
2.2 One Person per Cubic Mile!Source: TIME, February 19. 1996
Gerritsen
Typewritten Text
Gerritsen
Typewritten Text
Gerritsen
Typewritten Text
Gerritsen
Typewritten Text
Gerritsen
Typewritten Text
Gerritsen
Typewritten Text
Gerritsen
Typewritten Text
Gerritsen
Typewritten Text
Gerritsen
Typewritten Text
Gerritsen
Typewritten Text
Fig.
One wonders how an entity so organic in nature can be identified by an explanation of staticnature! Human settlements are expanding not only spatially (both horizontally and vertically)but also in the form of communication. Distances between human settlements are reducingnot only physically on the ground but also in the form of travel time (the jet age) andcommunication time (the Internet age). Transactions can take place throughout the workingday in each of the principal international stock exchanges (i.e., New York, London andTokyo), by passing on deals from one exchange to other. Their global status emanates fromtheir strategic position within different time zones (Daniels, 1991). All form of documentscan be telefaxed to any part of the world in a matter of seconds. The Ecwnenopolitan thinking of Doxiadis was based on similar observations. Introducing the concept of space oftime, Leman (1987, p.247) put forth the definition as, "Human Settlements arespatial/operational arrangements made by humans within certain scales in order to supportlife and to pursue their aspirations, goals and target.".
2.1.13 Continuously Built-up Area
As Leman (1987) pointed out, even the term 'definition', might be somewhat misleading inthe context of human settlements. It implies a definitive, final statement of what humansettlements are: yet, humans are just beginning to learn and to understand what thephenomenon is all about. Abandoned human settlements (e.g., Fatehpur Sikri in India);floating human settlements (e.g., klongs in Bangkok, Thailand); space settlements andsatellites are perhaps not covered by any of the mentioned definitions. For the traditionalnomad the human settlement has no permanent substance. For rural migratory people ortribes, human settlements may be duplicated following seasonal patterns of migration orperiodic wage labour migration to and from urban settlements (Haywood, 1985). Anestimated7 10 million people are travelling on Indian railways at any given point of time.Simply going by the numbers, this would suffice to make a dozen or so large cities. "Youcould imagine a cruise ship concept being developed into a floating city that could be towedsouth for the winter...Taisei Corporation in Japan had already developed a floating resortconcept, called Floating Station Jonathan, an underground dwelling, called Alice City, anda high-rise city that would take 30 years to build and house 700,000 people, called X-Seed4000...and the Takenaka Corporation had unveiled Sky City 1000, a 1000 metre tall structurethat would have 35,000 inhabitants and 100,000 workers." (The Daily Telegraph, September22, 1995, London, p. 15). In principle, these ideas are simply a follow up of the visualisationof Frank Lloyd Wright of a structure a mile high. Can all these be considered as 'humansettlements'?
The cultural distinctions that once differentiated the urban from the rural are fading anyway.In a study for a prediction of the total population of a city, entire contiguous urban areaswere included rather than trying to delimit administrative borders (Henderson, 1979). Theconcept of 'Continuously Built-up Area' (Perovic, 1987) seems to be the most appropriateworking definition having the advantages of physical characteristics, spatial extent anddynamism - not dependant on the time gap between census years. The term 'urbanagglomeration' (though of limited application to very large urban areas), used by Census of
Estimated by the author.
17
Gerritsen
Typewritten Text
Gerritsen
Typewritten Text
Gerritsen
Typewritten Text
Gerritsen
Typewritten Text
_______________________________________________________________
Gerritsen
Typewritten Text
Gerritsen
Typewritten Text
7

India is a positive step in this direction. The Continuously Built-up Area (in the urbancontext) encompasses suburban settlements, industrial complexes and airports, etc. if theyare easily accessible by public transport (Perovic, 1987). The concept of Continuously Built-up Area (CBA) provides a method that is useful in interpreting remotely sensed images ofcities, as discussed in Chapter Four of this book.
A difficulty here lies in the question of what is meant by 'continuous' (Haggett, 1972). Whathappens when the various criteria do not all give the same answer? Keeble (1969, p.62)illustrated this problem with a classic example, "...the impression of huge, continuous, fullybuilt-up areas is to some extent a misleading one. Anyone inefficient at packing a suitcasewill have noticed how much more a really good packer can get into the same cubic capacitythan he can. This is a very valid comparison; the results secured by the skilful packer arevery similar to those to be expected from the skilful Town Planner given a similar chance.".
In the Swedish context, Nordbeck (1971) described the urban area as one with at least 200inhabitants. Any point belonging to such an area was situated within a distance of 100 metersfrom at least one populated dwelling house. He divided built-up areas into three groups,compact, mean and spacious built-up areas, for his studies on urban allometric growth.
A similar concept of 'urban morphological zone' was adopted by the Eurostat (The StatisticalOffice of the European Community) in its recent project entitled, 'Remote Sensing and UrbanStatistics' (Barnsley, 1993). This concept relates to the physical extent of the built-up areamodified by criteria based on the minimum size and the spatial continuity of urban areas. Inthe European context, this requires spatial aggregation of those areas of urban land useidentified in the satellite-sensor image that are separated by less than 50m on the ground;removal from further analysis of those areas smaller than 20 hectares after aggregation; andaggregation of the remaining 'urban' areas that are separated by less than 200m.
Poll6 (1988) used the concept of CBA in his case study with SPOT images of Bandung,Indonesia, though he faced the problem of deciding on the inclusion or exclusion of smallpockets of urban landuse from the CBA. Such a decision requires elaborate rules on theminimum curtilage (smallest area to delineate), agglomeration based on distance and size of'islands' of new urban land, generalization and idealization. In any case, the urban settlement- the town, the city, the metropolitan area - is a physically separate unit that is visuallyidentifiable from the air (Webber, 1964).
Rapid urban change requires constant monitoring, which is possible through remote sensing(see Chapter Four). The concept of CBA is useful and conveniently applied on remotelysensed data. It has fewer disadvantages than others for the purposes of this research. Thisand similar concepts not only allow for the element of spatial dynamism, they also enrich thetemporal dynamism from 10 years (census years) to, theoretically, about 20 days (temporalresolution of satellite images). Moreover employing an all-inclusive definition and datasource, i.e., satellite images, minimizes the possibility of excluding smallest and isolatedhuman settlements by a traditional census survey*. The concept has been further elaboratedwith the rules of operationalization as detailed out in Chapter Seven.
An underenumerat ion of 2 .8 per cent w a s reported at the 1981 census of India off icial ly (Krishan, 1993) .
18
Gerritsen
Typewritten Text
Gerritsen
Typewritten Text
_______________________________________________________________
Gerritsen
Typewritten Text
Gerritsen
Typewritten Text
8
2.2 PATTERNS
The Oxford Guide to the English Usage (Guild Publishing, 1985, London) defines patternas 'regular manner in which things occur'. It is a 'representative sample'; 'specimen'(Morris, 1976). A pattern is the description of an object. It is a detectable organization ofspatial units (Johnston, 1981).
In the language of digital image processing, pattern is the regular repetition of tonalvariations on an image or photograph, (Sabins, 1987); or a regular repetition of values ortones in an image (Curran, 1985). This is a familiar idea in the literature about architecture,textile, garment and packaging design, music, which all hint of repetitiveness. Althoughregularity is implied by most definitions of pattern, it is also possible to speak of randompatterns.
The literary world offers a further understanding of pattern. The contrast between therepetitiveness and randomness of patterns has been brought out by Amy Lowell (1916, p.75-76) in her poem, entitled, 'Patterns'. While she frequently used 'patterned garden paths', shedid also use I too am a rare Pattern." and ".. , In a pattern called a war. Christ! Whatare patterns for?".
In spatial sciences, pattern refers to a 'regular arrangement of objects', which may beexplained in terms of structures, processes and systems. It refers to the manner in which a phenomenon is arranged in time and space (Nangia, 1976). It is a characteristic of spatialarrangement which describes the spacing of a set of objects with respect to each other. In thecontext of geography, it is the geometrical expression of location theory (Haggett et al., 1977).
Others hold that pattern is that characteristics of a spatial arrangement that is given by thespacing of individuals in relation to one another. In this view, it can be contrasted with theproperty of dispersion, which is the spacing of objects in relation to an enclosing shape, andcan be contrasted to density, which is the property of dispersal relative to an area but isindefinite of the area shape or the dispersion of the objects within it (Unwin, 1981).
2.3 PATTERN RECOGNITION
'Pattern recognition' is regarded as a basic attribute of human beings as well as other livingorganisms. We are performing acts of recognition every instant of our lives. We recognizethe objects around us, and we move and act in relation to them. We can spot a friend in a crowd and recognize what he says; we can recognize the voice of a known individual; wecan read handwriting and analyze fingerprints; we can distinguish smiles from gestures ofanger. A human being is a very sophisticated information system, partly because he possessesan advanced pattern recognition capability (Tou and Gonzalez, 1974).
According to the nature of the patterns to be recognized, we may divide our acts ofrecognition into two major types: the recognition of concrete items and the recognition ofabstract items. We recognize characters, pictures, music, and the objects around us. Thismay be referred to as sensory recognition, which includes visual and aural pattern
19

recognition. This recognition process involves the identification and classification of spatialand temporal patterns. On the other hand, we can recognize an old argument, or a solutionto a problem, with our eyes and ears closed. This process involves the recognition of abstractitems and can be termed conceptual recognition, in contrast to visual or aural patternrecognition. Examples of spatial patterns are characters, fingerprints, weather maps, physicalobjects, and pictures. Temporal patterns include speech, waveforms, electrocardiograms,target signatures, and time series. In precise language, pattern recognition can be defined asthe categorization of input data into identifiable classes via the extraction of significantfeatures or attributes of the data from a background of irrelevant detail (Tou and Gonzalez.
Commercial pattern recognition systems are available for optical character recognition,speech recognition, speaker identification, fingerprint recognition, and automated cytology(Jain and Dubes, 1988).
In the field of image processing, classification of geographical features can be considered as(spectral) pattern recognition. Pattern (spectral) recognition systems are designed to classifyan input pattern - an image or portion of an image - into one of several categories. The primejustification for this is that classification is often carried out on the basis of how far apart theindividuals are in a 'property space', and that classification is the partitioning of this intodiscrete 'areas' or slices of space. A (spectral) pattern recognition classifier is designed bymeasuring features of representative image whose correct classification is known. Thisfeature set, called prototype data, is then mapped in pattern space.
Figure 2.3 contains an example in which two features, for example average luminance andtexture, are measured for each block. Hopefully, the prototype features will tend to clusterinto groups according to desired classes. If this does occur, then decision boundaries areestablished to separate features of unknown data into proper classes.
1974).
CLASS 1
• CLASS 2
•
UNEARIDENTIFICATION30UNDARY
X 2
Fig. 2.3 Example of Prototype Classification for Two Features(after Pratt)Source: Pratt, 1978, p.569
20

In its early days of development, (spectral) pattern recognition was viewed by many as a solution to almost all image analysis problems. This optimism was subsequently temperedby two limitations of the (spectral) pattern recognition approach. First, the inherentdimensionality of image is enormous, and in many cases the number of potentialclassifications is quite large. As a result the processing required by a (spectral) patternrecognizer is often prohibitive. A more fundamental limitation is that an image descriptionby classification may not be appropriate. Although there are many applications in whichclassical (spectral) pattern recognition fails in an image analysis environment, the conceptshould not be dismissed entirely. There may be many sub-tasks that can be performed wellby (spectral) pattern recognition (Pratt, 1978).
(Spectral) pattern recognition is a computer oriented methodology for extracting informationbased on 'salient patterns' in remotely sensed data. (Spectral) pattern recognition techniquesconvert raw satellite digital data into meaningful information useful for quantitative analysisof remote sensing data. (Spectral) pattern recognition techniques have been used for computeraided demarcation of land uses in an urban area (Subudhi et al.\ 1989). It is subsumed inpattern recognition not only the descriptive pattern in space but also the classification ofgeographical individuals into groups. In general data driven classification techniques use twotypes of information about the content of an image: spectral and spatial. Spatial informationhas been utilized much less frequently in a segmentation of satellite images (Michalak, 1993).
No satisfactory measures exist for the quantitative description of land use patterns. Patternanalysis carried out by eye on maps, aerial photographs or some other graphical image is theway most land use models that have been derived from remote sensing have beenunderpinned in the past. The value of a computer-based approach to pattern recognition hasbeen advocated because of its speed, objectivity (i.e., the ability to repeat same process withthe same procedures and data and to get the same answer), flexibility and because it producesquantitative results (Rhind and Hudson, 1980). The computer has a major role in storing,retrieving, summarizing and grouping data : at present, analysis of patterns in space isprobably still best done by human means (Rhind and Hudson, 1980).
The techniques of pattern recognition and clustering are not widely used in the field ofsettlement pattern analysis. It may perhaps be possible to exploit the (spectral) patternrecognition technique(s) and the (spectral) clustering technique presently employed in thedigital image processing/ GISs; for recognising, classifying and analyzing (spatial) settlementpatterns based on satellite images, assuming that the concepts behind the spectral analysis andspatial analysis are similar. Two important facets of this are the decision making processconsisting of human interpretation based on the knowledge and experience of theprofessionals working with the system; and information processing based on hardware andalgorithms. However, experience indicates that the potential of fully automated patternrecognition has sometimes been overestimated (Voute, 1982).
2.3.1 Cluster Analysis
Another technique used parallel to pattern recognition is 'clustering'. Clustering techniqueswere first developed in biology and zoology to group similar animals and plants to constructtaxonomies. The need to organize vast amounts of data into 'meaningful' groups, clusters,
21

categories, partitions, or classes in several scientific disciplines has made clustering a valuable tool in data analysis. A variety of entities or objects have been clustered, includingmental diseases, land use patterns, rock samples, fingerprints, training methods, stars,consumers, prose, and images. In several of these applications it is not extremely importantto identify the exact number of clusters or the correct membership of each pattern into a cluster. Often it is enough to group the objects in a reliable and parsimonious manner so thatthe underlying physical, biological, or evolutionary process(es) can be understood or learned.This does not mean that clustering can automatically be applied to data without humanintervention. The choice of features or measurements, similarity measure, and groupingtechniques requires familiarity with the subject area in which data arise. Most important, theclusters are best interpreted by an expert in the subject area. Naive users of clustering canoften generate incorrect interpretation or description of data (Jain and Dubes, 1988).
The objective of cluster analysis is simply to find a convenient and valid organization of thedata, not to establish rules for separating future data into categories. A cluster is comprisedof a number of similar objects collected or grouped together. Some of the definitions of a cluster are:
i. a cluster is a set of entities which are alike, and entities from different clusters arenot alike;
ii. a cluster is an aggregation of points in the test space such that the distance betweenany two points in the cluster is less than the distance between any point in the clusterand any point not in it; and
iii. clusters may be described as connected regions of a multi-dimensional spacecontaining a relatively high density of points, separated from other such regions bya region containing a relatively low density of points.
The last two definitions assume that the objects to be clustered are represented as points inthe measurement space. We recognize a cluster when we see it in the plane, although it isnot clear how do we do it. While it is easy to give a functional definition of a cluster, it isvery difficult to give an operational definition. This is due to the fact that objects can begrouped into clusters with different purposes in mind. Data can reveal clusters of differingshapes and sizes. To compound the problem further, cluster membership can change overtime, as is the case with star clusters. Figure 2.4 illustrates some of these concepts for two-dimensional point clusters. At the global or higher level of similarity, we perceive fourclusters in these data but at the local level or a lower similarity threshold, we perceivetwelve9 clusters. Looking at the data at multiple scales may actually help in analyzing itsstructure (Jain and Dubes, 1988).
Clustering techniques offer several advantages over a manual grouping process. First, a clustering programme can apply a specified objective criterion consistently to form thegroups. Human beings are excellent cluster seekers in two and often in three dimensions butdifferent individuals do not always identify the same clusters in data. Thus it is quite
Jain and Dubes ( 1 9 8 8 ) identified nine clusters at the local l eve l .
Gerritsen
Typewritten Text
Gerritsen
Typewritten Text
________________________________________________________________
Gerritsen
Typewritten Text
Gerritsen
Typewritten Text
Gerritsen
Typewritten Text
9

common for different human subjects to form different groups in the same data, especiallywhen the groups are not well separated. Second, a clustering algorithm can form the groupsin a fraction of time required by a manual grouping, particulary if a long list of descriptorsor features is associated with each object. A clustering algorithm relieves a scientist or dataanalyst of the treacherous job of looking at a pattern matrix or a similarity matrix to detectclusters. A data analyst's time is better spent in analyzing or interpreting the results providedby a clustering algorithm (Jain and Dubes, 1988).
I?
0°
ooo
0°§Oo
•i
<Po°po o,
oo o o - O
Cc
co
I-
o o oo 9 i o o o o c o o o o
Oo o o 0 o 0 0
o o o 12
»o oo
Fig. 2.4 Clusters of Point Patterns in Two Dimensions(after Jain and Dubes)Source: Jain and Dubes, 1988, p.2
Cluster analysis is one component of exploratory data analysis, which means sifting throughdata to make sense out of measurements by whatever means are available. The informationgained about a set of data from a cluster analysis should prod one's creativity, suggest newexperiments, and provide fresh insight into the subject matter. The modem digital computersmake all this possible (Jain and Dubes, 1988). Yet, the main disadvantage of 'clusteranalysis' is that it is not very specific towards 'spatial' clustering.
The main philosophical difference between 'pattern recognition' and 'cluster analysis' is therole of pattern class labels. These labels are crucial to the formation of decision rules inpattern recognition but are only used to verify the results of cluster analysis. In other words,pattern recognition requires extrinsic information, while cluster analysis uses only the datathemselves (Jain and Dubes, 1988).
The recognition of different patterns of geographic variation is a necessary first step towardan analysis of the causes that lead to the establishment of the patterns. In data from diversedisciplines the patterns may be due to various forces: the internal dynamics of the system(i.e., interactions produced by the localities upon each other), external constraints due topeculiarities of the geographic area, and historical factors. Given a function describing a pattern over an area, this function can be used to predict the values of a variable at a locationthat has not yet been sampled. The ability to make successful predictions of this nature hasobvious benefits in applied research. Such predictions are also necessary elements of proofin any system attempting to explain the causes of the patterns. The various techniques allassume the existence of a 'pattern' whether this be one of fairly uniform change or a patchydistribution of differing homogenous subsets. But a fundamental question to be answered firstis whether there is any pattern at all to the distribution of the statistic over the area. If thereare insufficient grounds for considering the observed spatial variation a significant departurefrom a random distribution of the statistics over the area, it would not seem worthwhile toanalyse the data further.
In one study, (Royaltey et al., 1975), tests were developed of whether observed patterns ofgeographic variation can be considered significant departures from the null hypothesis ofrandom variation over an area. Localities are vertices in a graph whose edges are connectionsbased on criteria of geographic contiguity and other criteria meaningful to any givenscientific discipline. Ranked variables are assigned to each locality. Distributions of absolutedifferences in rank along edges between vertices yield various statistics of edge length thatare compared with expectations developed. Several typical (spatial) patterns such as cline,depression, or a crazy quilt are generated and their behaviour characterized by this method.Computational and graphical methods allocate observed patterns to one of several types. Itis a generalized method not dependent on sample size, type of character, or underlyingstatistical distribution and should be applicable to a wide range of data requiring only thatvariables for different localities can be ranked. The method is also not dependent upon theparticular scheme for connecting localities. Any scientifically defensible way of drawing theseconnections is suitable as a basis upon which to compute expectations. The question ofresolution of pattern structure depends ultimately on a general agreement on the number oftypes of distinct geographic variation patterns that exist and need to be recognized.
Patchiness of distribution is an important characteristic of a pattern in various disciplines.Several homogeneous but differing areas would respond similarly to intrusions, yet as the
24
number of homogeneous patches increases, their size will decrease proportionally to theentire area, and the pattern will assume the appearance of random variation. A possibledrawback of this method is the ranking procedure employed. Since statistics for all localitiesmust be ranked, trends may be imposed upon statistically nonsignificant, homogeneoussubsets. Moreover, the form in which the study has been presented does not illustrate theapplication of such an analysis.
2.3.2 Point Pattern Analysis
Maps are spatial representations of information, and when that information can becharacterized by a location on a map it becomes a spatial pattern. Although the real worldobjects themselves are not points, such a representation is possible because the physical sizesof the objects are very small relative to both the distances between them and the extent ofthe area in which they occur. Information gained from the analysis of point patterns mayenable one to acquire initial insights into the phenomenon.
In general three distinct approaches seem to have been taken to characterize point patterns,one based on density considerations, another on distance measures and a third on inter-pointdistance and direction (Unwin, 1981). In the context of random pattern, it is the processwhich contains the random element, not the distribution. In no sense is it asserted that spatialpatterns are ultimately chance affairs. In the real world, each point symbol on the map, beit a factory or an oak tree, has a good behavioral or environmental reason for its location.In aggregate these many individual histories and circumstances may best be described byregarding location processes as stochastic. In the real world events at one place and time areonly seldom independent of events at another, so that as a general rule we expect pointpatterns to display spatial dependence.
2.3.3 Spatial Autocorrelation
When data are mapped, the map contains not only information about the values of variablesbut also information about how those values are arranged in space. Spatial interaction, whichis the movement of goods, people, or information over space, means that events orcircumstances at one place can effect conditions at other places if the places interact. Spatialautocorrelation exists whenever a variable exhibits a regular pattern over space in which itsvalues at a set of locations depend on values of the same variable at other locations. A singleevent may effect several locations if the event involves an extended region. Interdependenceamong places lends pattern and structure to geographic data and autocorrelation statistics canbe used to investigate hypotheses about how data for a particular variable are organized inspace.
"...the often-quoted first law of geography that 'everything is related to everything else, butnear things are more related than distant things'...is simply a statement that spatialautocorrelation exists." (Unwin, 1981, p. 134). Spatial autocorrelation may be positive ornegative.
25

A clear, simple, and concise definition of spatial autocorrelation can not be found in mostof the literature on the subject. It is inherently geographical. But its meaning is contextual,and multifaceted. It can be defined as (Griffith, 1992):
i. self-correlation attributable to the geographical ordering of data;ii. a descriptor of the nature and degree of certain types of map pattern;iii. an index of the information content latent in geo-referenced data, especially that
information overlooked by classical statistical estimators when applied to spatial dataseries;
iv. a diagnostic tool for spatial model mis-specification;v. a surrogate for unobserved geographic variables;vi. a nuisance in applying conventional statistical methodology to spatial data series;vii. an indicator of the appropriateness of, and possibly an artifact of, areal unit
demarcation;viii. a spatial process mechanism; andix. a spatial spillover effect.
2.3.4 Autocorrelation in Space and Time
Spatial patterns can change and develop over time. Many spatial patterns are the result ofspatial-temporal processes in which spatial patterns change in some systematic way and thepattern at any time is related to earlier patterns. Spatial-temporal processes are processes thattransform a map for an earlier time into the map for a later time and statistical models canbe used to investigate hypotheses about these processes (Odland, 1988).
There is no one single optimal technique for all applications and the selection of a particularprocedure is influenced by both practical and statistical concerns. Formal comparative studiesare few. Some techniques are better than others in detecting clustering, whereas others arebetter in detecting regularity. In general, techniques that measure the dispersioncharacteristics of a point pattern appear better than those that measure its arrangementproperties. However, when used in association with dispersion techniques, arrangementtechniques can provide confirmation of results and sometimes also provide additional insightinto the pattern (Boots and Getis, 1988).
Patterns which visually seem to be interpretable in the same way often turn out to have a spatial autocorrelation structure that is not significandy different from random, so thatstatistically there is no objective basis for the subsequent theorizing. There are firm groundsfor suggesting that all spatial analysis should start with a test for spatial autocorrelation,simply in order to prevent this tendency to infer and interpret pattern where none exits(Unwin, 1981).
2.4 ILVVIS
A software, named the Integrated Land and Water Information System (ILWIS), version 1.4(ITC, 1993; see Appendix I), provides for pattern analysis and spatial correlation analysisfor a point data set. While the pattern analysis performs pattern analysis on a point file, the
26

spatial correlation calculates the spatial correlation for a point data set, i.e., the degree towhich values at a certain set of locations depend on values of the same variable at otherlocations (TTC, 1993).
Point pattern analysis is a technique that is used to obtain information about the arrangementof point data in space, i.e., to be able to make a statement about the occurrence of certainpatterns. Three fundamental patterns exist. In a situation of complete spatial randomness(CSR), no correlation exists between locations of points. In a clustered pattern, subgroupsof points tend to be significantly closer to each other than to other subgroups of points. Ina regular pattern, distances between adjacent points tend to be further apart than from CSR.If point items tend to attract each other, and there is environmental homogeneity, one cancall the pattern grouped. On the other hand, if individual point items tend to repel each other,and points are more spread out than in CSR, one may call the pattern regular.
There are two basically different techniques: the location of points can be studied withrespect to 'each other' (measures of arrangement), or with reference to the 'area' (measuresof dispersion).
2.4.1 Measures of Arrangement
Measures of arrangement are techniques that examine characteristics of the locations of pointsrelative to other points in the pattern.
The output of the pattern analysis lists a table in which measured frequencies of occurrencesof reflexive nearest neighbours (RNN) are compared with expected frequencies ofoccurrences in a situation of CSR. The CSR is simulated for the same area and the samenumber of points. Two points are considered first order RNN if they are each other's nearestneighbour. This definition can be extended to higher orders; second order RNNs are pointsfat are each other's second-nearest neighbours, etc. The frequencies are calculated for RNNsof first to sixth order.
More higher order values in excess of CSR expectations indicate measure of regularity inarrangement of points, whereas lower empirical values imply elements of grouping in thepattern. If more (first order) RNNs occur than is expected in CSR, it can be concluded thatisolated and relatively uniformly arranged couples exist.
2.4.2 Measures of Dispersion
Measures of dispersion are techniques that examine characteristics of the locations of pointswith respect to the area. The pattern is analyzed by calculating distances between individualpoints, and comparing these with the distances that would be found in a CSR.
The output of the pattern analysis lists a table in which the mean distance between RNNs aretested against the expected distances in a (simulated) CSR.
27
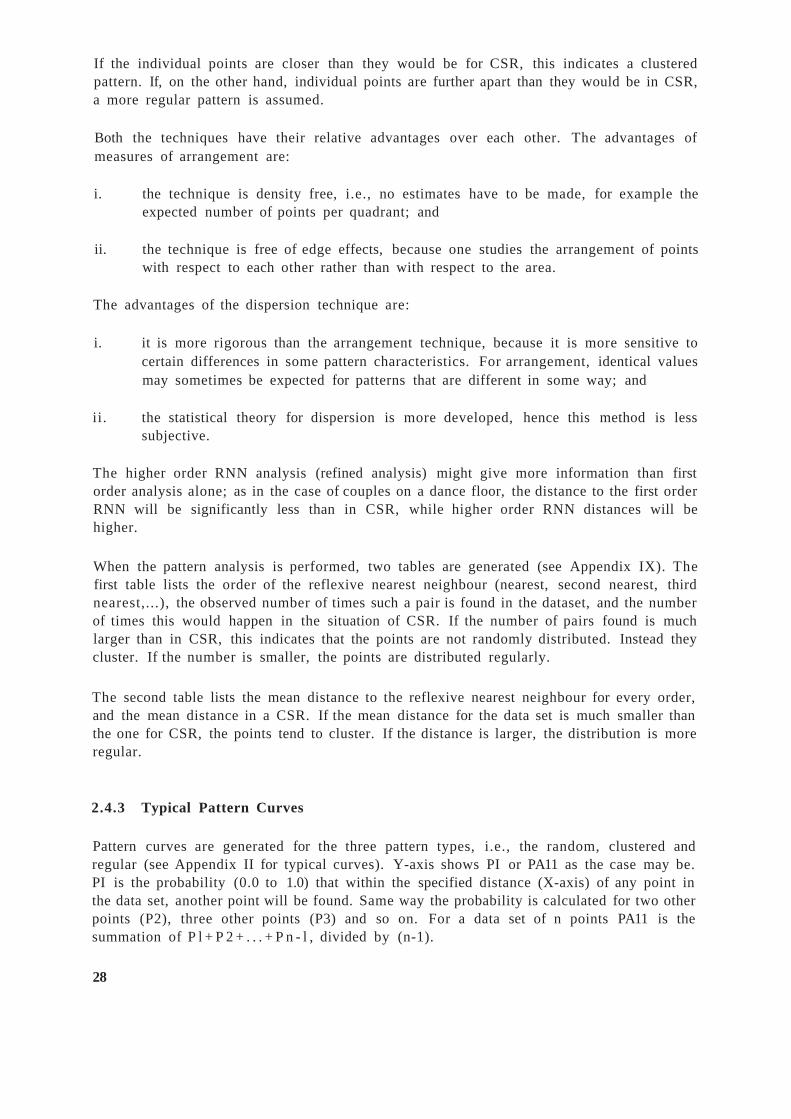
If the individual points are closer than they would be for CSR, this indicates a clusteredpattern. If, on the other hand, individual points are further apart than they would be in CSR,a more regular pattern is assumed.
Both the techniques have their relative advantages over each other. The advantages ofmeasures of arrangement are:
i. the technique is density free, i.e., no estimates have to be made, for example theexpected number of points per quadrant; and
ii. the technique is free of edge effects, because one studies the arrangement of pointswith respect to each other rather than with respect to the area.
The advantages of the dispersion technique are:
i. it is more rigorous than the arrangement technique, because it is more sensitive tocertain differences in some pattern characteristics. For arrangement, identical valuesmay sometimes be expected for patterns that are different in some way; and
ii. the statistical theory for dispersion is more developed, hence this method is lesssubjective.
The higher order RNN analysis (refined analysis) might give more information than firstorder analysis alone; as in the case of couples on a dance floor, the distance to the first orderRNN will be significantly less than in CSR, while higher order RNN distances will behigher.
When the pattern analysis is performed, two tables are generated (see Appendix IX). Thefirst table lists the order of the reflexive nearest neighbour (nearest, second nearest, thirdnearest,...), the observed number of times such a pair is found in the dataset, and the numberof times this would happen in the situation of CSR. If the number of pairs found is muchlarger than in CSR, this indicates that the points are not randomly distributed. Instead theycluster. If the number is smaller, the points are distributed regularly.
The second table lists the mean distance to the reflexive nearest neighbour for every order,and the mean distance in a CSR. If the mean distance for the data set is much smaller thanthe one for CSR, the points tend to cluster. If the distance is larger, the distribution is moreregular.
2.4.3 Typical Pattern Curves
Pattern curves are generated for the three pattern types, i.e., the random, clustered andregular (see Appendix II for typical curves). Y-axis shows PI or PA11 as the case may be.PI is the probability (0.0 to 1.0) that within the specified distance (X-axis) of any point inthe data set, another point will be found. Same way the probability is calculated for two otherpoints (P2), three other points (P3) and so on. For a data set of n points PA11 is thesummation of P l + P 2 + . . . + P n - l , divided by (n-1).
28
2.4.4 Spatial Autocorrelation
Also provided for in ILWIS is 'spatial autocorrelation'. It measures dependence amongnearby values in a spatial distribution. Variables may be correlated because they are affectedby similar processes, or phenomena, that extend over a large region. Spatial correlationexists whenever a variable exhibits regular pattern over space in which values at a certain setof locations depend on values of the same variable at other locations.
For example, if the concentration of a certain pollutant is very high at a certain location, itwill most likely also be high in the direct surroundings. In other words, the concentration isautocorrelated at small distances. At larger distances, it is less likely that the concentrationwill be equally high. The correlation will probably be lower, and the variance higher. Theuser is encouraged to compare his or her dataset with a dataset consisting of the same pointlocations, with a set of attribute values, approximately in the same range as the measuredvariable but created at random. If the graphs are very much the same for the measured dataand the random data, no autocorrelation exists between the datapoints.
Results of some of these techniques, applied on the NCR of Delhi, India, have beenpresented in Chapter Seven.
2.5 SETTLEMENT PATTERNS
Since human settlements are spatially separated one from another, linkages between them areessential, and one framework for study is to view them as nodes or focal points in a transportnetwork. If the location of cities, towns, and villages are marked on a map, the overallsettlement pattern can be seen (Haggett1 0, 1972). Earlier, Keeble (1969) conceived thepattern as primitive distribution of human settlements, which has, in areas of densepopulation, been overlaid and distorted by a series of subsequent events. The spatialdistribution of centres of different grades tends to form a pattern the regularity of which isproportional to the simplicity and uniformity of the land area concerned.
Patterns may exist in their physical form or abstract form. In the physical form they may beobserved in the spatial distribution of human settlements. In their abstract form, patterns arederived and deduced from the interpolation of data, its cartographic representation andanalysis (Nangia, 1976). Settlement pattern is the distribution of population clusters ofvarying sizes (Johnston, 1981), or simply the nature of the distribution of human settlements(Mayhew and Penny, 1992). However, Goodall (1987) mentioned of spatial distribution.
With a particular reference to developing countries, these patterns are being transformedrapidly by:
i. growing population in the younger-age cohorts, which might well constitute a potential for future economic growth but which today creates an increasing surplus
In discuss ing the basic arrangement of nodal c lusters , it is conven ient to use as a substitute their
morphologica l express ion , the 'sett lement pattern' (Hagget t , 1965; Hagget t et al., 1977) .
29
Gerritsen
Typewritten Text
Gerritsen
Typewritten Text
_______________________________________________________________
Gerritsen
Typewritten Text
Gerritsen
Typewritten Text
10
of dependent, unemployed, and underemployed population, often migrating in searchof economic opportunity;
ii. intensive rural-urban migration, often in sequential steps to the local centre, to theregional capital, and eventually to the primate city;
iii. a consequent urbanization which in many cases is not a result of eitherindustrialization or economic development, as was the case in more industrializedcountries. The result is a growth in urban population, without an equivalent increasein urban productivity, and an increasing polarization between urban and rural areas;
iv. nevertheless, a relative increase in industrialization has taken place. Generally thisgrowth is due to intentional government economic incentives, or it is dependent on,controlled by, and subservient to, the demands of external capitalist or socialisteconomies. Each situation has its characteristic influences on the developing humansettlement system; and
v. in most countries, an increasing amount of government control and regulationemphasizing economic growth and industrial development but in some cases alsospecifically oriented toward the planning of urban settlements.
The very recency and dynamism of the changes outlined here mean that their present andpotential impact upon the human settlement system of both developed and developingcountries are not adequately documented nor well understood. Certainly we are far fromdeveloping satisfactory theories for explaining their complex impacts (Bourne et al., 1984).However, highly generalised theories of settlement patterns abound. The theory hasdeveloped over the last 150 years or so, mainly from the theoretical foundations laid downthrough the work concerned with understanding the forces affecting land use and location ofhuman settlements, and their efforts to define the principles that generate these forces(Haywood, 1985). Such classical writings on the evolution of spatial patterns werecharacterised by an informal presentation. They were generalized theories or metaphorsapplied to very complex situations. Pregnant as such metaphors are, with concepts, ideas,and generalizations, there comes a time when the form in which such metaphors are castseems to hinder objective judgement. The wish to be objective and scientific is somehowfrustrated. Such studies demonstrated two things. Firstly that the simple schemes of spatialevolution put forward earlier in the century were far too crude and highly generalized to fitthe real world. Reality was far more complicated than that. Second, that the actual form ofpresentation of their theories often lacked clarity (Harvey, 1968).
Settlement theory embodies the concept of a landscape filled with nesting human settlements,forming a hierarchy of dependency relationships, with each human settlement having its ownproductive hinterland and the whole being delicately maintained in a state of equilibrium bya network of interconnecting links. The neatness of this concept is based on a number ofassumptions which are open to question when viewed from a developing country. The firstassumption is that change is the product of outside factors and that the natural state of anygiven settlement pattern is equilibrium. In reality, human settlements are in a continuous stateof change, and growth may not only affect the settlement pattern overall but may change thevalue of steps within the hierarchical structure to such an extent that a permanent situation
30

of imbalances occur. The belief that the suppliers and consumers of services will alwaysarrive at an economic equilibrium ignores the very important influence of cultural, politicaland social factors on decision making. Like the definition of the human 'settlement' itself,settlement theories are too static in their approach; they can also be criticised for being toocompartmentalised (Haywood, 1985).
History also plays a part in city-size distributions. It appears very likely, especially inunderdeveloped countries, that external influences may have distorted the 'natural' rank-sizerelationships by inducing more-than-allometric growth for certain cities. These cities may beworld cities or regional capitals, or the seats of colonial governments, or in entrepotsituations to large, otherwise inaccessible hinterlands, or near to important mineral or otherresources in world demand (Chadwick, 1987).
A further limitation is that settlement theory does not indicate either the process of evolution,which resulted in the particular settlement pattern, nor how specific situations may changein future. This emphasis on descriptive rather than prescriptive settlement theories is a particular limitation now that communications technology is tending to reduce the spatialcomponent of urbanisation and replace it with a concept of urban life based on access toservices. Only if a logical framework could be developed, would the testing, verification andmodification of hypotheses regarding the evolution of settlement systems be possible. Themost suitable way to develop such a logical framework is to develop some model constructof reality which expresses the notions contained in the theory (Harvey, 1968).
2.6 CONCLUSIONS
Rapid urban change requires constant monitoring, which is possible through remote sensing(see Chapter Four). It is proposed to use the concept of the CBA for the purpose of pursuinga tool, i.e., remote sensing. The concept of the CBA is useful and conveniently applied toremotely sensed data. It has fewer disadvantages than others for the purposes of thisresearch. This and similar concepts not only allow for the element of spatial dynamism, theyalso enrich the temporal dynamism. Moreover, employing an all-inclusive definition and datasource minimizes the possibility of excluding small and isolated human settlements by a traditional census survey. The concept has been further elaborated with the rules ofoperationalization as detailed out in Chapter Seven and Appendix III. The strength of the tool(i.e, the concept of CBA, applied to remotely sensed data) is that it might be calibrated toany level of generalisation (e.g., from 10m to 5km distance).
Not sufficiently comprehensive methods exist for defining and recognising spatial patterns.Cluster analysis techniques are also not suitable for spatial clusters. The methods available(e.g., the spatial autocorrelation) are generally for point patterns, which are best analyzedpartly visually and partly manually. A comprehensive discussion on how these methods havebeen incorporated into various models available for settlement patterns is carried out in thefollowing chapter.
31

3
MODELS FOR ANALYZING SETTLEMENT PATTERNSA REVIEW
A number of theories and models have been put forth to describe and understand humansettlement patterns. However, as discussed in Chapter Two, the limitations attached to theconventional definitions of the terms 'settlement' and 'settlement pattern' further limit theirapplication towards modelling settlement patterns. Moreover, as in the case of these terms,the popularly used theories and models of analysing settlement patterns also have limitations,specially with reference to their applicability in developing countries. An attempt has beenmade in this chapter to investigate the applicability and adaptability of existing theories andmodels of settlement patterns analysis in the present day context, with specific reference todeveloping countries. While an attempt has been made to identify the limitations attached tothese models, some factors beyond the scope of models, yet important in influencing thesettlement patterns, have also been looked into. As was noted in Chapter Two, the majorconsideration in selecting the pieces of literature discussed here was that these have aninterface with the existing spatial planning practices in India.
It was concluded in Chapter Two that the concept of CBA is useful and conveniently appliedon remotely sensed data. Those elements of the theories and models being discussed in thischapter which support the concept of CBA, have been given special consideration forincorporation in the models that will be developed in Chapter Seven.
3.1 INTRODUCTION TO MODELS
The idea of using models in science is by no means new. There is a sense in which almostanything can be used as a model for almost anything else. But as in the use of analogies ormetaphors, so models, to have predictive value, must bear some measure of similarity to thestructure or process being modelled. Most used model types in spatial sciences may beregarded as the formal presentation of a theory using the tools of language, logic, set theory,and/or mathematics. Use of these tools allows to identify and eliminate inconsistencies withinthe theory. It also allows to use the powerful tool of algebraic analysis to make deductivestatements as regards a particular system, and in some cases, to develop objective statisticaltests of the relationship between the model being used and the real world. To make a modeloperational, therefore, one has to develop some simple system of model building. The term'model' is conventionally employed in a number of different ways. It is used as a nounimplying a representation, as an adjective implying a degree of perfection, or as a verbimplying to demonstrate or to show what something is like. In fact models possess all of
3?
these properties. Models are highly subjective approximations and abstractions in that theydo not include all associated observations or measurements. Only the relevant properties ofthe real world are represented. But as such they are valuable in obscuring incidental detailand in allowing fundamental aspects of reality to appear. This selective attitude depends uponthe intentions of the model maker. Models have varying degrees of probability and a limitedrange of conditions over which they apply. All models are constantly in need ofimprovements as new information or new vistas of reality (e.g., information available fromsatellite images) appear, and the more successfully the model was originally structured, themore likely it seems that such improvement must involve the construction of a differentmodel. A successful model also contains suggestions for its own extension and generalization(Haggett and Chorley, 1968). A model of a situation is a simplified representation of a realworld situation based on our understanding. It is systematic method, based on logical ormathematical relationships, for describing, simulating, and forecasting real life processes(Doxiadis, 1967).
3.1.1 Types of Models
The term 'model' has been used in such a wide variety of contexts that it is difficult to defineeven a broad type(s) of usages without ambiguity. One can classify models in various ways,into at least those which model structure, those which model function and those that modelboth. There are models which are obviously physical (e.g., an architectural building model)and those which are obviously conceptual (e.g., mathematical and statistical models forsimulation), and so on (George, 1968). Though models can be conceptual, physical, ornumerical, the process of abstraction is intended to reduce the complexity of the real worldto a manageable level. Conceptual models diagram the relationships between thosecomponents of reality that impact the spatial system under study (Bennett et al., 1993). Withthe physical model, the physical characteristics of reality are represented by the same oranalogous characteristics in the model. Physical models can be divided into two categories.Ionic models represent the relevant properties of the real thing by those propertiesthemselves, with only a transformation in scale. They are generally difficult to use forrepresenting dynamic situations. In analogue models one property is used to representanother, and hence the necessity of a legend. In the conceptual models, the relevantcharacteristics are represented by concepts (language or symbols). This type of model canalso be divided into two classes. Verbal models describe the reality in logical terms usingspoken words. These models are of limited help in predicting or precisely specifying the stateof a system. Symbolic models represent and express the properties of the real world systemsymbolically (Reif, 1973).
One division is between descriptive and the normative; the former concerned with somestylistic description of reality and the latter with what might be expected to occur undercertain stated conditions. Descriptive models can be dominantly static, concentrating onequilibrium structural features, or dynamic, concentrating on processes and functions throughtime. Where the time element is particularly stressed historical models result. Descriptivemodels may be concerned with the organisation of empirical information, and may be termeddata, classificatory (taxonomic), or experimental design models. Normative models ofteninvolve the use of a more familiar situation as a model for a less familiar one, either in a time (historical) or a spatial sense, and have a strongly predictive/ prescriptive connotation.
34

Models can also be classed according to the material from which they are made, into, firstly,hardware, physical or experimental constructions, and, secondly, into theoretical, symbolic,conceptual or mental models. The former can either be ionic, wherein the relevant propertiesof the real world are represented by the same properties with only a change in scale, oranalogue (simulation) models, having real-world properties represented by differentproperties. The latter are concerned with symbolic or formal assertations of a verbal ormathematical kind in logical terms. Mathematical models can be further classed accordingto the degree of probability associated with their prediction into deterministic and stochastic.
Another view of models concentrates upon them as systems which can be defined on thebasis of the relative interest of the model builder in the input/ output variables, as distinctfrom the internal status variables. In order of decreasing interest in the status variables, manymodels can be viewed as synthetic systems, partial systems and black boxes. The scale onwhich models are valuable and the standpoint from which they are constructed allow furtherdistinctions, notably into internalized models which give a very parochial view of reality, andparadigms which are broadly significant models of value to a wide community of scholars(Haggett and Chorley, 1968). Self-evaluating models are not very common in the field ofplanning, though they do exist.
3.1.2 Models and Model Building in Planning
The choice of type of model depends upon the object of the planning exercise (Hall, 1992).It helps to have a check list of questions to help in the design of a model for spatial planningpurposes. These are (Wilson, 1974):
What is the purpose behind the particular model building exercise? What should berepresented as quantified variables within the model? Which of these variables are under thecontrol (at least partially) of the planner? How aggregated a view can be taken, both for thesectoral aggregation and spatial aggregation? How should the concept of time be treated?How far ahead are we trying to look and can comparative static equilibrium techniques beused? What theories are we trying to represent in the model? What techniques are availablefor building the model? What relevant data are available? What methods can be used for thecalibration and testing of the model?
The purpose could relate to a major exercise or something much more partial. The effortdevoted to the model building exercise should be related to the importance of the purpose inhand. The choice of variables will be dependant on the availability of data and on the typeof computer hardware and software available. It is often preferable to develop a fullydynamic model but very much difficult in terms of techniques and data requirements. Manydisciplines contribute to theory building in urban and regional studies and model buildershould be capable of utilizing this literature when appropriate. The use of remotely senseddata and computerised GISs has facilitated the obtaining, processing, storage and retrievalof information. As Forrester (1969, as quoted by Reif, 1973) comments, conventional formsof data-gathering will seldom produce new insights into the details of system structure.Calibration involves estimating any parameters of the model in such a way as to get the bestfit between model prediction and the data representing the real world; testing involvesdeciding whether such fits are good ones (Wilson, 1974).
35
In the development of an urban and regional model system, three kinds of works may beidentified (Wilson, 1974). The first is the empirical development for the study area of exitingmodels which had been tested elsewhere. Second work involves the empirical developmentof known but untested models. The third is the work on new theoretical problems leading tonew models. These three obviously feed back on each other.
It is important to maintain a balance in an overall programme between these kinds of work.Hence, predictions of any new models can always be compared to those of existing models,and it also minimises risk for the whole programme, because if an element of theoreticalwork fails, there is always the existing work to fall back on (Wilson, 1977).
Like all models, spatial models are low-variety representations of high variety situations:variety is destroyed in the modelling process but can be re-invoked by retracing the path viamodels of sub-systematic aspects of the larger system which has been followed in thecrystallisation of overall system modelling. In order to reduce the complexity of the systemunder study and consequently reduce the model to a manageable size, the researcher has tosimplify the real world situation. The simplification can be obtained by omitting relevantvariables, by changing the nature of variables, by changing the relationship between variablesand by modifying constraints (Reif, 1973).
Once a simple model of one sector of reality has been constructed, one can, then, linktogether several such individual models into a model system. One may, for example, collecttogether the outputs of several models and treat these inputs to another model, identifyfeedback loops throughout the system, and so on. Given the complexity of real worldphenomena, it would be meaningless to expect one simple model to have great explanatorypower. Ultimately one must aim for a complex model system to represent an even morecomplex reality (Harvey, 1968).
However, the approach of fully integrated modelling has gradually been abandoned and a much more elastic/ partial approach is advocated (Lee, 1973). One of the main dangers ofcomputer modelling is that unskilled users may uncritically accept the results and assume thatcomplex models perform adequately. Even experts may accept simulated results withoutadequate validation. The mechanistic use of simulation models by non-specialists is a potential danger to rational decision making. Many models of environmental processes arecomplex and may require data at levels of spatial and temporal resolution that are too costlyto collect (Burrough, 1993).
Models themselves, of course, do not generate the solutions. The inventiveness of thedesigner and the policy maker is a crucial component of model-based planning. The 'best'plan can only be chosen if it is one of the alternatives which had been investigated. But atthe very least model outputs will supply much information which is relevant to planningdecisions (Wilson, 1977).
3.2 MODELS FOR ANALYZING SETTLEMENT PATTERNS
At first glance a modem system of settlements, consisting of a set of settlements varying insize and economic functions and interconnected by a range of commodity, population and
36

information flows, presents a confusing picture to the analyst. Some settlements are majorcentres of political and corporate power, others are dynamic and prospective metropolises.Some others are stagnating manufacturing cities in declining industrial regions. Despite thisfunctional complexity, researchers have developed a general theoretical understanding of thedistribution of settlements as service, manufacturing and management centres. Whenintegrated and combined in an historical context these identify and account for a high levelof locational and organisational order in the settlement system (Clark, 1982). Although themain contributions to the analysis of urban location and hierarchies of function do notprovide all-inclusive, ready formulas for general application, they do offer powerfultheoretical as well as empirical foundations for local analyses to be undertaken in developingcountries (Stanford Research Institute et ai, 1968).
Virtually all models of settlement patterns have one thing in common; they assume a measurable degree of order in their spatial and functional properties. This seems to befounded on the following parameters which form the basis of, or are implied in, most models(Garner, 1968):
i. The spatial distribution of human activity reflects an ordered adjustment to the factorof distance;
ii. locational decisions are taken, in general, so as to minimise the frictional effects ofdistance;
iii. all locations are endowed with a degree of accessibility but some locations are moreaccessible than others;
iv. there is a tendency for human activities to agglomerate to take advantage of scaleeconomies;
v. the organisation of human activity is essentially hierarchical in character; and
vi. human occupance is focal in character.
A simple classification for the models of settlement patterns can be applied: uniform,random, competitive and contagious. If one is studying change(s) over a relatively small areathe effects of physical and human change may frequently be regarded as being uniform overthe study area. If one is considering population growth within a country, one might find thaithe population growth is distributed randomly over the study area. Certain kinds of eventscompete for space and one may employ a relevant spatial theory to describe how such eventsare likely to be distributed over space. The occurrence of a particular event as the result ofa time process may increase the probability of a similar event occurring close by, orcontagious, in space. This simple classification is only relative to the size of the study area.Events which may be contiguous on a world-wide scale may be treated as random orcompetitive within a very small area and vice versa. Bearing in mind this problem of scale,the above classification may still prove useful in formulating a model system (Harvey, 1968).A fundamental consideration, when examining the relevance of models of settlement patternsto the problems of developing countries, is the fact that most of the theoretical work has beengenerated by research in the developed world. The work which has been undertaken in the
37
developing world is generally small in extent and poorly disseminated. As a result theoriesand resulting models in general circulation have been based on a series of preconditions andassumptions that clearly do not match the conditions of most developing countries. Inparticular, assumptions concerning stability, constant growth, and the implication thatdecisions will always be arrived at in a logical manner, are not always relevant (Haywood,1985).
With the inclusion of some of the models generated in the developing countries, some ofpopularly known models of analysing and measuring (Hagget, 1972) settlement patterns havebeen reviewed below, in order to gain an insight and to learn from their capabilities andlimitations.
3.2.1 Gravity Model and the Rank Size Rule
'Gravity model' and the 'rank size rule' are the two basic models which help inunderstanding the relationship of one settlement to other and between city population and itsrank order in a set of cities, respectively. These models are based primarily on the distanceof one settlement to other and population size of the settlements.
However, in reality, distance is a relative measure. Not only may the nature of the distancefunction change over time but it may also vary a great deal from place to place. Distancecould be replaced by travel time or cost or effort. Travel time is of special significance, asthe amount of time in a day is both fixed and equally distributed over all persons. This is notthe case with other factors (e.g., travel cost or effort). It, thus, becomes a vital constant ina sea of variables. In today's context, with increasing dependency on modern means ofcommunications and information transfer, distance (or travel time, cost, effort) alone seemsto be a limited determinant. Flow of data and information plays and will continue to play a larger role than the flow of goods and capital (Blakely, 1991).
Similarly, the rank size rule is a special case of the allometric growth formula (Nordbeck,1971). The rule may be regarded as an empirical finding rather than a theoretical or logicalnecessity (Haggett et al., 1977). It is a statistical regularity which appears when largenumbers of cases are considered. It must be emphasized that the method is suggestive, notdefinitive (Harris, 1970).
Contrasting patterns in rank-size relationships may be in part explained by the fact that theresident population size of various cities is determined by a number of parameters, includingthe availability of urban(isable) land and the increasing demand, and therefore, the value ofthe urban land (Haggett, 1972). As opposed to the assumption behind the urban growthindices generally made, one can postulate that the dynamics of development in the towns/cities operate not only through the population but also through their area base. It is importantthat our consciousness of urban growth takes due cognizance of the space problem - theproblem of congestion on urban land (Kundu, 1982).
It will, perhaps, be interesting to know the results when the population sizes in the rank sizeformulae is replaced by (or added to) the 'continuously built-up', municipal, urbanised,residential and commercial areas that different settlements under examination have.
38

Moreover, if the understanding of the distribution and scenario building is area based,satellite images will help performing analytical exercises not every decade (repeat cycle ofthe census) but as often as once a month, if desired.
Moreover, both the models are non-spatial in nature and are generally not used for analysingsettlement patterns. An important kind of information not contained in both the models is thegeographical distribution of settlements. This kind of information is presented by a map, forwhich there is no substitute (Erickson and Young, 1992).
3.2.2 Central Place Theory
City size distribution theory, or the theory of the urban hierarchy, is non-spatial in nature.There is also a spatial hierarchy, an arrangement of cities and settlements in spatialrelationship to one another, and there is no necessary symmetry between the two aspects ofurban hierarchy. It is the intention of central place theory to attempt an explanation of bothaspects of hierarchic structure of settlement patterns (Chadwick, 1987).
In 1933, Walter Christaller proposed that, given an isotropic landscape (one which isphysically uniform and has an even distribution of resources, population, wealth and thelike), settlements would be evenly distributed in order to render most efficient the supplyingof goods and services by people living in central settlements (central places) to people livingin surrounding communities. The central places and surrounding consumer communities arelinked by flows of money and goods which result from the demand of consumers being metby the supply of producers in the central places. In a market situation of perfect competition,prices reflect the balance between demand and supply. However, an economic environmentof perfect competition is unlikely to prevail in the real world. As the population grows, themarket areas of central places touch and eventually overlap to produce hexagonal (the mostefficient11 arrangement) units. The network of central places is known as a K-valuenetwork. The K-value is determined by the number of communities of low-order placesserved by a central place or a higher-order place, in addition to its own population. The K = 3network is geared to efficient marketing; the K = 4 network is the most economicalarrangement for traffic flow; and the K = 7 network is economically most efficient to run forthe purpose of administration.
Higher K-value systems can be derived from these basic networks to give K-values as 9, 12,13, 16, 19, 21 , 27 and so on. Christaller argued that, once established, the K-system remainsfixed. Even though the high-order centres contain all the functions of the smaller centres, thisproduces a very marked hierarchy of functions and regular distribution of centres of the sameorder (Meyer and Huggett, 1981). In 1941, Christaller also put forward what was known as'Mixed Marketing and Administrative Model'. He believed that the hierarchical structure andboundaries of planning, economic, and administrative regions at the national, regional and
H o w e v e r , as Isard (1956) put in the Location and Space E c o n o m y : A General Theory RelatinE to IndustrialLocat ion , Market Areas . Landuses . Trades and Urban Structure ( M . I . T . Press , C a m b r i d g e , p . 2 7 4 ) , theh e x a g o n " . . . loses its s ignif icance as a spatial form once the inevitable agg lomerat ion f or c e s . . . are a l lowedto operate ." .
39
Gerritsen
Typewritten Text
Gerritsen
Typewritten Text
_______________________________________________________________
Gerritsen
Typewritten Text
Gerritsen
Typewritten Text
11

local levels should be as similar as possible, that the overall framework should consist ofurban-centred regions, and that the allocation of public goods should play a crucial role inhierarchical definition and integration.
He demonstrated his mixed principle by a three step model that utilized all the three pureprinciples. He started with a marketing landscape (step 1). Next, he combined hisadministrative and marketing models in a manner in which urban development in the centreof the triangles formed by the second order centres was suppressed. This could be achievedby regional planning measures. The result was a marketing-principle based central placesystem that met the undivided complementary area requirement of his administrative principle(step 2). He then suggested a traffic network that reinforced the theoretical settlement systemarrived at in step 2, one that ensured that the areas with suppressed development in thetriangle centres were not crossed by long-distance transportation routes (Figure 3.1; Preston,1992).
However, polarized development and diffusion of development impulses and innovations indeveloping countries, where the transportation and communication system is generally veryweak, will be clearer if considered within a spatial system having a hierarchical distributionof settlements classified on the basis of the functional specialisation of activities andpopulation size (Kulshrestha, 1980).
An important modification to Christaller's scheme was made by August Losch in 1939, whoused all K networks together and varied their sizes. This resulted in an irregular distributionof centres of the same order. Losch oriented all these nets about a common centre to find theposition in which the largest number of locations coincide and the distances between centresare minimal. This results in a pattern of sectors around a city - the 'city rich' and 'city poor'sectors (Figure 3.2).
However, the economic landscape described by the Loschian Model contains high-ordercentres which do not necessarily possess all the services in low-order centres. Also, the citiescome in all sizes. Losch's model was criticised by Bouge (1949, as quoted by Meyer andHuggett, 1981) and Isard (1956, as quoted by Meyer and Huggett, 1981) for failing to takeaccount of variations in population density. The economic landscape produced whenvariations in population density are considered presents a set of irregular-sized polygons,each containing the same number of people, smaller ones being found nearer city centres(Meyer and Huggett, 1981). Another problem of the Christaller and Losch models ofsettlement pattern is that they are essentially static (Haggett et al., 1977).
Nevertheless, the simplified, abstract system of Christaller and Losch do help to explain theeconomic logic behind the size, spacing and number of settlements. A hierarchy ofsettlements can be developed where a higher order settlement will have high-order services.Both the higher order settlements and services will be found at just a few locations. Givena hierarchy of settlements, it is reasonable to suppose that the average spacing betweencentres of each order will become greater with increasing order of settlement. Present dayservice centres may have had their origin in the temporal and mobile arrangements, providedby itinerant tradesmen or pedlars and periodic markets or fairs.
40

Step 1 The MarketingPrinciple
Step 2 The Marketing andAdministrativePrinciples Combined
Step 3 TransportationModelReinforcing theMixed Hierarchy
Fig. 3.1 Christaller's Mixed Marketing and Administrative Model(after Preston)Source: Preston, 1992. p.532
Fig. 3.2 Loschian Concept of City Rich and City Poor Sectors(after Meyer and Huggett)Source: Meyer and Huggett, 1981, p. 19

Indeed, in many countries, this is still the case and weekly or twice-weekly markets are stillto be found, not only for supply of perishable goods but for non-perishable goods too.However, with reference to metropolitan regions, the metropolis serves itself. Althoughretaining its central place functions for a wider area, the number of interactions and theirdensity renders the simplicity of central place theory somewhat inadequate. Moreover, it isthe quality, i.e., the variety and level, of services available in a given area which defines thedegree of centrality of the place serving it, whilst the quantity of services is generally onlya function of the number of people served (Chadwick, 1987). The techniques of institutionalscalogram and sociogram (Roy and Paul, 1977), discussed later in this chapter, areinteresting development of this concept.
3.2.3 Growth Pole Concept
Growth poles are centres or focii in abstract economic space "...from which the centrifugalforces emanate and to which centripetal forces are attracted." (Perroux, 1950, p.95).
The concept envisages that the development does not appear everywhere and all at once. Itappears in points or growth poles with variable intensities; it spreads along diverse channelsand has varying terminal effects for whole of the economy (Perroux, 1955). In other words,"...through concentrating investment capacity in a centre expansionary momentum can begenerated in the economy of its region." (Mabogunje, 1971, p.3). This is extensively usedas a planning strategy.
The growth poles according to the basic concept, generate two effects - the 'spread' and the'back-wash' or the 'trickle down' and 'polarisation' respectively. Market forces lead to theclustering of increasing returns activities in certain areas of the economy. Regardless of theinitial locational advantage, this build-up becomes self-sustaining because of increasinginternal and external economies at these centres of agglomeration. The limited advantagesof backward regions, such as cheap labour, are insufficient to offset these agglomerationadvantages. The main influence on the rate of growth of lagging regions is the inducedeffects of growth in the prosperous areas. These are the 'centrifugal' and 'centripetal' forceswhich emanate from and are attracted to the growth pole respectively. The former includemarkets for the typically primary products of the lagging regions and diffusion of innovation.Normally, however, these are outweighed by backwash effects - particularly by creating a disequilibrium in the flows of labour, capital, goods and services from poor to rich regions(Richardson, 1973).
Among several theories of regional development, Growth Pole Concept provides an efficienttool if applied deliberately. However, ".., it is full of confusion covering its nomenclature,definition, spatial aspects, nature, basic characteristics, type of activity concentration,regional impact and temporal aspects." (Kulshrestha, 1980, p. 167). Its application in practicewith or without modification to cover a wider scope with special reference to spatialincidence of development further adds to the confusion.
42
3.2.4 Service Centre Hierarchy
The concept of 'service centre hierarchy' (Roy and Patil, 1977) draws from various theorieson the formation and spatial growth of economic development poles, size, location,distribution and clustering of economic activities, the geographical incidence and spread ofeconomic growth, discussed earlier. The concept is based on following assumptions:
i. people are distributed in various size settlements in space;
ii. they have bio-physical as well as socio-economic needs;
iii. they utilize physical and human resources, i.e., goods and services to satisfy theirneeds;
iv. they form settlements in space in the form of homesteads, hamlets, villages, townsor cities and continue to stay together as long as resources are adequate enough tomeet their need;
v. they utilize resources for basic needs which are limited or wants which are unlimited;and
vi. they migrate to other places in a continuous search of goods and services that are not(or can not be) available in their own settlements.
In the process of this continuous search, central places emerge to provide essentialgoods and services to people within their spatial reach. As the range of goods andservices on the one hand and the threshold of population and their resources on theother hand increases, service centres at different levels in the hierarchy becomemanifest. The lower level service centres provide certain basic goods and services thatare limited in number and kind by the limited population and resources within thedaily travel distance or radius of the centre. The next higher level service centresprovide goods and services that are provided by the lower level service centres plussome other goods and services which require a larger 'threshold' of population andresources within the larger radius of centre. When people and resources aredistributed in space in a uniform manner, the service centres develop in a progressivemanner in time ideally to form a pattern of hexagons within hexagons. Planning forservice centres, therefore, is a deliberate attempt to impose or superimpose this idealpattern on the historically developed and geographically constrained pattern of servicecentres.
Isard (1956; as quoted by Chadwick, 1987), classified location factors as belonging to three,possibly overlapping groups. The first group included transport costs and certain transfercosts which tend to vary regularly with distance from given reference points. The secondgroup of factors included the several costs associated with labour, power, water, taxes,insurance, interest (as payment for the services of capital), climate, topography, social andpolitical milieu. The costs of these factors may be seen as varying independently of bothdistance and direction. The third group comprised those factors giving rise to agglomerationand deglomeration economies. In the former economies might be included those of scale,
43

localization and urbanization; in the latter diseconomies, those within a firm going beyondits natural scale of operating rises in rents and service costs associated with congestion, andfood supply costs as urban size makes adverse location changes in contributory agriculturalareas. Losch's homogeneous hexagonal system of nets of market areas oriented toward thecommon centre (the metropolis) was graphically interpreted by Isard with six centre-orientedsectors which concentrate production, thus reducing the costs of distance to the centralmarket (Stanford Research Institute et al., 1968).
Berry (1961) put forth a set of relationships to explain central place systems: the trade areaserved by a central city is a function of the density of the population in the trade area andthe population of the central city; and the population of the central city is a function of thenumber of central functions performed by that city. Two kinds of city size distributions arerecognized. First, rank size or lognormal distribution in which urban centres are of regulargraduated sizes, and second, primate distribution in which there are one or more dominantcentres and a deficiency of intermediate size centres. There is a scale from primate tolognormal distributions which is somehow tied to the number and complexity of forcesaffecting the urban structure of countries, such that when few strong forces obtain primacyresults, and when many forces act in many ways with none predominant a lognormal city sizedistribution is found (Berry, 1961).
However, the resulting conglomerate structure from the theoretical strands in growth-poleanalysis still leaves many points unanswered. "The meaning of a growth pole or a growthcentre is still debatable. Does it mean a functional pole or a geographical pole or a combination of the two? The structure outline appears neat but the details are very fuzzy.What are the elements or the combination of elements which go to make a growth pole? Canthe same type and size of growth pole or growth centre be successfully planned anddeveloped in all situations? Is there a dynamic model of growth pole applicable to allsituations? Do we really have dependable empirical data from the developed and developingcountries passing through different stages of economic development to support the currentconcept of growth pole and related hypotheses? The answers to the these questions arelargely negative." (Misra, 1970; as quoted by Richardson, 1973, pp.85-86).
Moreover, "Nodal models attempt to describe the macrostructure of human populations asit is arranged in sets of settlements. ...our understanding of human settlements - even in thebroad terms of size and spacing - is still superficial and incomplete." (Haggett et al., 1977,p. 138).
There are many methods of identifying service centres and service areas using variouscriteria. Methods based on distance criterion alone ignore the distribution of people and theirresources in space. Methods based on the population criterion alone ignore distance andresource factors. Methods based on infrastructural criterion alone tend to emphasize theirrational nature of the past and consequently may inhibit the ideal nature of futuredevelopment. Methods based on the criterion of movements alone manifest the factors ofspace preferences or alternatives and opportunities available in the past. Therefore use ofmore than one method based on multiple criteria is considered more reliable than the use ofany single method based on a single criterion.
44

Roy and Paul (1977), recommended three methods (a) a scalogram method based on thenumber and types of infrastructural facilities; (b) a sociogram method based on preferencesof people for different service centres; and (c) a bisectional method of dividing space basedon purely geometric logic of allocating areas to lower level service centres from higher levelones on maps. They suggested to adopt most rational solution using all three methods, andto adjust the results to the existing revenue and/or administrative boundaries of spatial units.These and some of the following methods are particulary suited to developing countries,where they have been developed and applied.
3.2.4.1 Scalogram Method
The scalogram method ranks the settlements or places, in terms of importance, on the onehand and the institutions or infrastructural facilities on the other. Firstly, the settlements arearrayed in descending order of population size and the total number and types of facilities12
located in each settlement are noted. Secondly, the facilities are arranged in descending orderin terms of total number and types of facilities located in all settlements. And thirdly, theinstitutional hierarchy of settlements is demarcated by a bold line running diagonally so asto divide the services and facilities into ubiquitous and non-ubiquitous. A typical scalogramhas been illustrated in Figure 3.3 (see also Saini and Sinha, 1985).
3.2.4.2 Sociogram Method
The sociogram method shows graphically the pattern of interaction or interdependence by themovement of people between settlements for selected facilities. This pattern can be preparedon maps on the basis of the preference for service centres, indicated by arrows showingwhich settlements go where for what. Superimposed layers are prepared to see thecorrespondence between various service centres and service areas and to identify the spatialgaps suggesting the possibility of locating new service centres. Summing up the number ofarrow destinations on each layer for each service centre and then summing the figures of allthree layers generates a fourth layer illustrating the relative importance by size of totaldestination score. Each arrow can be weighed by settlement population to give a moresophisticated destination score. A typical sociogram has been illustrated in Figure 3.4.
3.2.4.3 Bisection Method
The bisection method is designed to identify on a map, the high level, middle level or lowerlevel service centres, by geometrically dividing space on the basis of some knowledge of theranking of service centres, following the principles of spatial efficiency using a series in
There is no rigid list of faci l i t ies . It can be different from area to area depending upon the level ofsett lements be ing scanned and the emphas is on a group of facil it ies. T h e list used by Roy and Paul ( 1 9 7 7 )in the illustration includes hospital , arts c o l l e g e , medical c o l l e g e , eng ineer ing c o l l e g e , po ly techn ic , typingc o l l e g e , h igher secondary schoo l , junior schoo l , primary schoo l , s tadium, c i n e m a , drama Hal l , publicl ibrary, bank, agriculture credit soc ie ty , d ispensary, T . B . c l in ic , health centre , s c i ence c o l l e g e , c o m m e r c ec o l l e g e , maternity and child wel fare centre , family planning c l inic and nursing h o m e .
45
Gerritsen
Typewritten Text
Gerritsen
Typewritten Text
_______________________________________________________________
Gerritsen
Typewritten Text
Gerritsen
Typewritten Text
12

graphic progression. It is based on the assumption that the lower level service centres areexpected to develop in the middle of higher level service centres. In other words, if one ortwo of the most important centres of the specific area and in the neighbouring area areknown, it is possible logically to expect lower level service centres around the bisection line.Bisection method for identifying service centre hierarchy is illustrated in Figure 3.5.
Although the three methods suggested by Roy and Patil (1977) can be applied to any regionin principle, it should be noted that the methods were developed specifically for 'block1 3
level planning'. Their adaptation for metropolitan regional planning will require an upgradingof the list of facilities as more and more facilities will tend to become 'ubiquitous' at thetown level.
3.2.5 Composite Functionality Index
Developing further on the methods suggested by Roy and Patil (1977), a project fordemonstrating and implementing an information system for regional planning (SAC-TCPO,1992) for the district of Bharatpur in India used a Composite Functionality Index (CFI),based on the number of services that a settlement has. The CFI is based upon four otherindices (see footnote 4). In general, each index is based upon a Functional Weightage (FW) derived for each function under consideration. FW = N I Fi, where Ft is the number ofsettlements where the function is available and N is the total number of settlements understudy.
About 40 different functions1 4 were considered under various sub heads.
Having worked out the weightage for each function, the facility indices are calculated basedon the number of each type of facility available in a settlement multiplied by the assignedweightage. The four facility indices are then added to get a Composite Functionality Indexfor each settlement. However, like in the case of institutional scalogram, the decisions arenon-spatial in nature. Also, the level of details required for information on many functionsis changing frequendy and difficult to update on a regular basis.
A 'block' , in Indian context , is an administrative unit b e l o w the sub-district l eve l . It usually compr i se s of
a number of v i l lages and may or may not include a town.
4 E d u c a t i o n a l faci l i t ies: primary schoo l , middle school , high schoo l , pre-university c o l l e g e , c o l l e g e , adult
l iteracy centre , training schoo l , others .
M e d i c a l faci l i t ies: hospital , maternity and child welfare centre , health centre , primary health centre ,primary health sub-centre , dispensary, family planning centre , T . B . centre, registered private practitioner,nursing h o m e , subsidised medical practitioner, communi ty heath worker , others .
T r a n s p o r t a n d c o m m u n i c a t i o n faci l i t ies: post off ice , telegraph off ice , post and telegraph of f ice , te lephoneconnec t ions , bus stands, railway station, kulcha (fair weather) road, pucca (all weather) road.
G e n e r a l faci l i t ies: tai lors, artisans, blacksmith, mechan ic , market , who lesa le market, fair price shop(government control led shops providing essential food-grains , e tc . at subsidised pr ices ) , bank, petrol station,cooperat ive soc ie ty , street lamp.
46
Gerritsen
Typewritten Text
Gerritsen
Typewritten Text
_______________________________________________________________
Gerritsen
Typewritten Text
Gerritsen
Typewritten Text
13
Gerritsen
Typewritten Text
Gerritsen
Typewritten Text
14
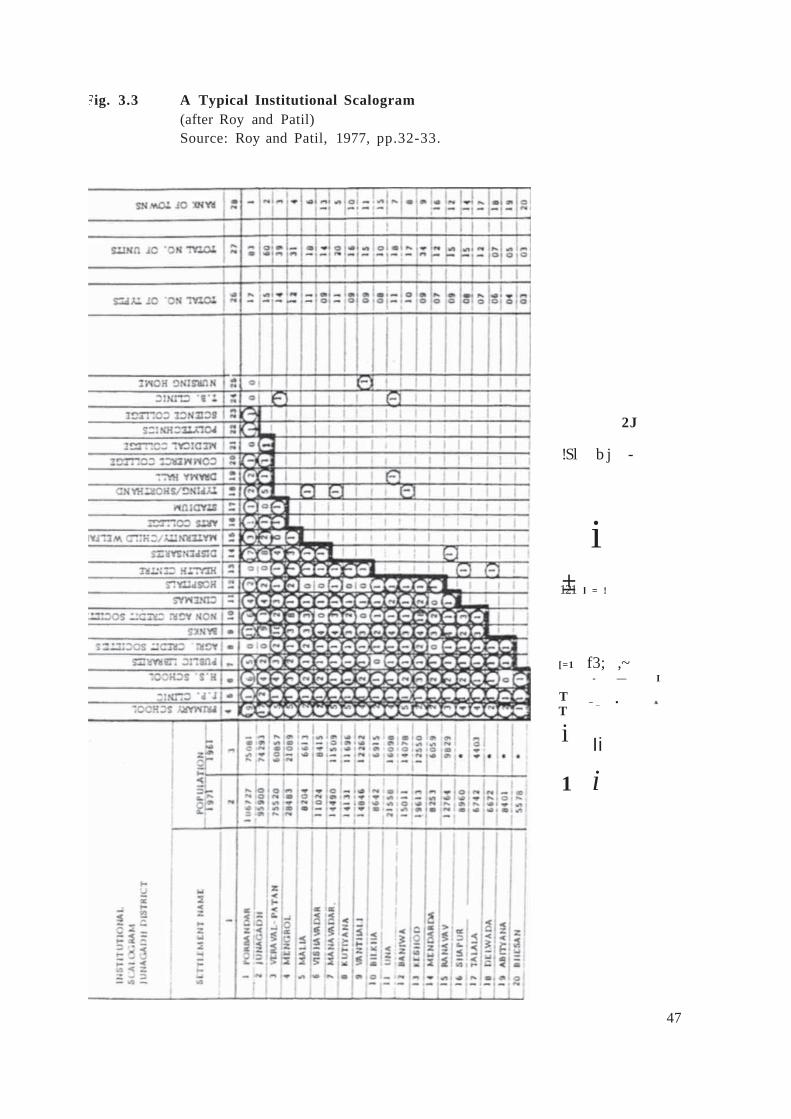
Fig. 3.3 A Typical Institutional Scalogram(after Roy and Patil)Source: Roy and Patil, 1977, pp.32-33.
2J
!Sl b j -
i±121 l = !
[=1 f3; ,~
TT
i
1
- — I
— _ • a
Ii
i
47

Fig. 3.4 A Typical Institutional Sociogram(after Roy and Patil)Source: Roy and Patil, 1977, pp.28-29.
REFERENCESDISTRICT 3OUN0ARY a • • • • LOCATIOH WITH Pqpy
SLOCK 90UNOAPY LESS THAU 2000 O
VILLAGE BOUNDARY 2001- «000
STATE HIGHWAY iSOVE 40CO
ro*« H H , G H s c*0 0 1- «
JNINMABITEDVILLAGE
WCVE.MENT FOB
K i D O L E SCHOOL
HIGH SCHOOL
48
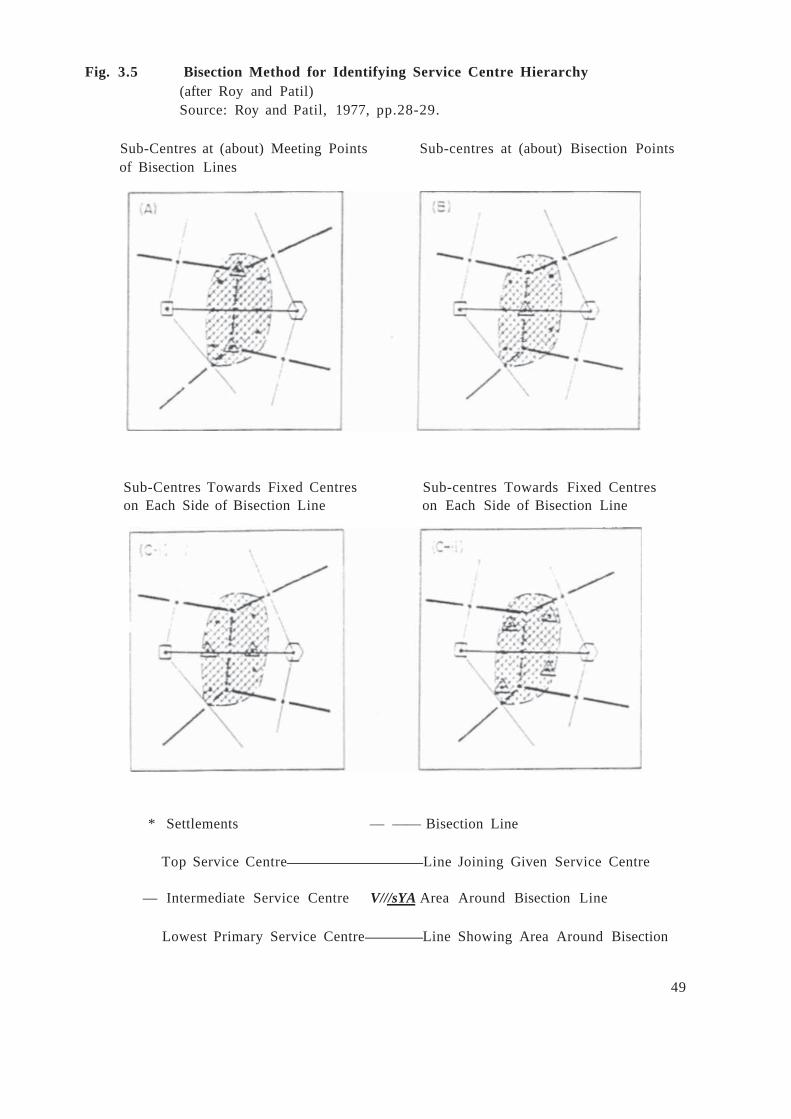
Fig. 3.5 Bisection Method for Identifying Service Centre Hierarchy(after Roy and Patil)Source: Roy and Patil, 1977, pp.28-29.
Sub-Centres at (about) Meeting Points Sub-centres at (about) Bisection Pointsof Bisection Lines
Sub-Centres Towards Fixed Centres Sub-centres Towards Fixed Centreson Each Side of Bisection Line on Each Side of Bisection Line
* Settlements — —— Bisection Line
Top Service Centre Line Joining Given Service Centre
— Intermediate Service Centre V///sYA Area Around Bisection Line
Lowest Primary Service Centre Line Showing Area Around Bisection
49

3.2.6 Spatial Model for Spatio-Economic Development
Being inspired by the models relating to location of activities, centrality of places anddiffusion of innovations, Kulshrestha (1980, 1991) developed a 'spatial model' for spatio-economic development of polarised regions (Figure 3.6). The model uses a square latticeinstead of a conventional hexagonal. Interestingly, Losch, already in 1954, suggested that thesquare lattice might be adopted where new areas of settlements are being planned as squaresare only moderately less efficient than hexagons and form a very useful substitute (Haggettetal., 1977).
A metro-region, where all settlements depend upon and interact with the metropolis morethan any other city of the same size, is a perfect example of polarised region and hence thespatial model is applicable to these regions. The model incorporates the following hierarchyof settlements.
No. of P l a c e s
Dominant Polarised Activity Centre 1 (metropol i s ;population 1 mi l l ion and more)
Polarised Activity Centre ( P A Q 8 ( large c i ty/ medium town;population 2 0 , 0 0 0 to 1 mil l ion)
Rural Polarised Act ivi ty Centre 64(small t o w n / large v i l lage;population 5 , 0 0 0 to 2 0 , 0 0 0 )
Rural Sett lements (v i l lages; 6 4 8population less than 5 , 0 0 0 persons)
The model follows a geometric progression for assigning the number of settlements as shownbelow.
Basic Spatial Uni t 9 Sub-periphery 8 1 ( 9 x 9 )Metro -reg ion 7 2 9 ( 9 x 9 x 9 )
For identification of the 'basic spatial unit' of the PAC, several alternative arrangements ofthe field of influence around a PAC are attempted, by changing the orientation and the sizeof the field. The model highlights the following (Kulshrestha, 1980):
a. smaller settlements are closely spaced and the distance between two similar orderneighbouring settlements increases with the increase in their regional hierarchy;
b. towns and cities have two zones of influence, namely the immediate influence areaand wider influence area;
50

c. the rural settlements do not rigidly follow the 'hierarchical dependency rule', i.e., a lower order settlement depends more on the immediate higher order settlements;
d. the spatial spread of an urban area obviously at higher order of hierarchy is largerthan those on a lower one; and
e. the model suggests the distribution of the number of settlements at different hierarchyin the polarised region, which follows a geometric progression with 9 settlements inthe basic spatial unit. But the actual number of settlements may be less due to themerger of rural settlements in urban texture.
Due to physical, administrative, historical or political constraints, the spatial pattern may notbe as symmetrical as suggested in the model. Yet, the model ensures one town for a groupof 8-10 villages, located at a distance of less than 11.3 km. It also ensures a balanced spreadof various order of settlements in the region. Depending upon its hierarchy and functionwithin the system of settlements in the metro-region, the local conditions and the policy ofdevelopment, a variety of economic, socio-cultural, administrative and political activitiespolarise at a settlement. Moreover a continuous change in the hierarchy of settlements addsdynamism to the model whereas there is no rigidity in the size and function of a PAC.
The spatial model designed by Kulshrestha (1980) can serve as an effective tool for spatialdistribution of settlements in a hierarchical order in a metro-region, assignment of functionalspecialisation and nature of activity polarisation.
3.2.7 Topodynamic Model
There is yet another topodynamic model given by Tellier (1992). The model is based on theconcept of successive location decisions that are a function of what already exists, that is, ofthe existing spatial distribution of activities. Following ten indices play an important role inthe topodynamic approach.
1. The parameter of the 'rank size rule' corresponding to the distribution obtained fromthe ranking of centres of activity concentration.
2. The ratio between the size of the second-rank centre and the size of the first-rankcentre.
3. The distance between the centre of gravity location at time / and the correspondinglocation at time (/ + / ) .
4. The angle of gravity centre shifting - this angle is measured from north to the east.
5. The distance between the gravity centre and the geometric centre of the consideredspace.
51

Fig. 3.6 Spatial Model for Spatio-Fxonomic Development of Metro-Regions(after Kulshrestha)Source: Kulshrestha, 1991, p.6.
S S I M A R Y/ I L L A G c UNIT
.r.t.::.r:.-.1 .-.-.r.
3ASIC SPATIALUNIT (R-PAC! *. = 9
T>.e sue-PERIPHERY ipac:K = 25 fCR SSiC SP»7UL
sERiPHERY iNO CORE .D-PAC; K = 9 POP SUB-PERIPHERIES (RURAL
S E T T L E M E N T S N O T S H O W N IBoundoriai
:NOEX Car.^ r ' O B U YS u O - P « r i D n « r fRurci-SuO ?«rio««ry
Ruroi ar«o
- 3 u f 3 l S « l t l « m « n T j
0- PAC
52
6. A deconcentration index related to the geometric centre. This index takes on valuesbetween 0 and 1; more the activities that are on average located far from thegeometric centre, the closer is the value of this index to 1.
7. A concentration index taking on values between 0 and 1; the value 1 corresponds tothe case where all activities are concentrated in a single location.
8. A scattering index varying between 0 and 1, value 1 corresponding to the case whereall activities are grouped together in only two locations separated by the maximumdistance possible in the studied space.
9. An index reflecting the distribution of activities (or population) between large,medium, and small activity centres.
10. A dispersal index, where increase in index indicates an increase in the relativedispersal of activities in the considered space.
As the model includes no growth rates, it is not really 'temporal'; it is, rather, dynamic inthe sense that it simulates the evolution of urban population distributions when the total urbanpopulation increases and/or is reallocated in space. The order of successive decisions doesmatter but the period of time spent between any two successive decisions is neglected. Infact, the timing of the predicted evolution is a matter of exogenous interpretation.
The model was applied to the situation of Cameroon. The results obtained indicated that theranking of cities tended to stabilize in the long run. A similar observation, though obtainedthrough different analysis, was made by Das (1993) for three regional level primate cities ofIndia.
3.2.8 Inter-Settlement Distances
An analysis of inter-settlement distances also helps to achieve a better understanding of thehierarchical system of settlements (Nangia, 1976). In a well developed and functionally-integrated hierarchy of settlements the number of settlements increases and inter-settlementdistances tend to decline regularly from the higher to the lower levels of hierarchy. It maybe observed, however, that in a dynamic system of settlements the inter-settlement distanceswithin the same size range do not remain constant. Moreover, any significant diversionwould mean distortion in the systems of settlements.
3.3 DISTORTION IN SETTLEMENT SYSTEMS
A settlement system is deemed to be distorted if (i) the distribution is marked by a significantclustering of large-sized settlements in pockets or corridors of development, (ii) suchsettlements are disproportionately more numerous, and (iii) the inter-settlement distance rangeof such settlements is much less when compared to the settlements in the lower size range.These are symptomatic of weaknesses in the linkages among the middle and lower orders ofthe urban settlements implying thereby a breakdown of the information system. Therefore,
53

they cease to function as effective links in the chain of settlement systems and tend to becomeineffective centres of urban activities (Alam, 1984). In the Indian context, a number offactors have tended to disrupt and distort the evolution of settlement system. These factorscould include the economic structure of the country, the break in the historical continuity ofits evolving settlement system due to political factors, wide inter-regional disparity in levelsof development, the inadequacy of linkages between urban centres and their surrounding ruralareas and consequent malfunctioning of the supply and distribution system, the dysfunctionaldevelopment of urban settlements, the haphazard development of services in the urban andrural settlements, and misconceived development strategies and policies of the private andpublic sectors.
3.4 BEYOND MODELS
Most quantitative models of settlement patterns have been developed within the 'spatialanalysis' tradition in urban geography. This approach relies heavily on assumptions likeisotropic planes and rational economic behaviour.
In a 'urban managerialist' thesis (Pahl, 1970; as quoted by Paris, 1982), the town plannerwould be the master-allocator of the scarcest urban resources. However, it would be unwiseto expect that local government bureaucracies, of which the town planner is a part, wouldoperate very differently from other types of bureaucracies (Pahl, 1982). Use and misuse ofrules, the internal struggles, the confusions, decisions and non-decisions are all usefulaccounts of the workings of large-scale organizations and, in particular, of their relationshipswith those outside the organization. Similarly, the relationship between planning and 'politicalclimate' (Chapin, 1965) is a crucial one. An effective decision process almost alwaysinvolves both experts and politicians (or policy-makers) simultaneously in closeinterdependency. Failure to achieve a synthesis between the two will mean that the plans arenot carried out or that policies adopted, being exclusively political, will be inadequate orinappropriate (Friedmann, 1973). Forms of planning are often historical precipitates ofUtopian and ideological thought. Indian planning, for example, still reflects the influence ofthe social philosophy of Mahatma Gandhi. Recent amendments in the Constitution of India(Government of India, 1993), strengthening the local bodies at the village and municipallevel, for example, have their roots in the Panchayati Raj philosophy of Gandhi. Thecomplexity of most development problems is such that a full, integrated policy package willbe required: one which tackles economic, social, political, ideological and cultural issues,and which may have both spatial and aspatial aspects to it. The often limited role ofsettlement planning in these packages must be recognized (Dewar et al., 1986).
Besides the influence of a planning behaviour described above, quantitative models ofsettlement patterns require accurate, sophisticated and timely availability of data on a varietyof subjects. While a large variety of data can be made available through a regular census,some other require extensive field surveys. Specially in the Indian context, the census dataitself, though very accurate and detailed, is not available timely. On the quality side, thecensus, in India, is conducted on a 100 per cent sample basis, preceded by exhaustive pilot
54

surveys and the outcome is available in a convenient, ready to use digital format1 5. Thetemporal resolution of the census is 10 years. It usually takes 4-5 years before the detailedtables on various aspects covered in the census are made available. Thus, a village becomingeligible to be notified as a town in 1982 (one year after the previous census) will have to waitfor an estimated 13-14 years before details of this town could be made available. This makesa very accurate data very old, and thus very inaccurate. Similarly, there are no elaboratesupporting maps to clearly indicate the spatial extent of the various units and sub-units ofinformation collection. Maps available from other sources (e.g., Survey of India) have thesame problem. They are excellent maps for their accuracy (at the time the area is surveyed)but the updating seems to be neglected. For example, the latest authentic topographic maps,that this author could gain access to, were based on surveys carried out in late 1960's. A number of models discussed in the preceding pages will loose their sophistication if theseoutdated data were fed into them.
3.4.1 Shapes and Size of Urban Settlements
Besides the other criticism associated with them, the models discussed earlier invariablyconsider settiements as point locations when analysing their spatial distribution. Size of thesettlement not in terms of the population it holds but in terms of the area it covers on ground,or its shape, is hardly ever considered. Although some attempt to define the idea of shapeseems necessary, in practice most attempts to do this have been less than satisfactory (Unwin,1981). It is apparent that a great many visually quite different shapes could give the samenumerical indices. Reliability and the usefulness of these indices will depend largely on theobjective of the measuring the shape. Scholars in other disciplines of learning (e.g., in thefield of biology) have also found it necessary to devise adequate means of describing shapes(Thompson, 1952).
Since the English language has a limited 'shape' vocabulary it is necessary to developquantitative means of describing the shapes of urban settlements. It is more necessary withthe advancements in computers and automatization in image processing and interpretation.Shape is already an important parameter in unsupervised classification on satellite images.Some of the commonly used shape indices are elongation ratio, form ratio, circularity ratio,compactness ratio, ellipticity index and radial shape index (Haggett et ai, 1977). However,their application in urban planning is generally limited to work on morphological evolutions,or finding shape efficiency, of administrative areas. These have rarely been used for intersettlement comparisons or for predicting the shape and size of urban settlements. A recentstudy (Rao, 1995) used three basic shapes, i.e., circle, square and rectangle for estimatingbuilt up areas of urban settlements.
T h e Census of India started disseminating census data on floppy disks , for the census conducted in 1991 .T h e floppy disks are easi ly avai lable for sale from authorized government agenc ie s . M o r e o v e r , the data canbe reached through various networking facilities provided by the National Informatics Centre (NIC) of thePlanning C o m m i s s i o n , Government o f India.
55
Gerritsen
Typewritten Text
Gerritsen
Typewritten Text
______________________________________________________________
Gerritsen
Typewritten Text
Gerritsen
Typewritten Text
15

3.4.2 Fractal Analysis
Another promising field where shape indices may prove very useful is 'fractal analysis',through which it may be possible not only to predict the shape, size and therefore area ofurban settlements but also the pattern that they make in their regional setting. First attemptsto give the study of shapes and sizes a scientific base were made by Mandelbrot (1983),which subsequently developed into a full field of fractal geometry. A fractal, as defined byhim, is a pattern made of parts similar to the whole in some way. Phenomena displayingapparent self-similarity are abundant in the real world. In addition to self-similarity, anotherimportant characteristics of fractal phenomena is scaling. Length of a coastline as estimatedby a map increases logarithmically with increase in the map scale. In the limit, the length ofa coastline is infinite, "...boundaries can not be regarded as absolute; they are artefacts orcompromises, and their statistics (length, breadth) are a complex function of the variation ofthe property being mapped and of the scale and mapping method." (Burrough, 1993a, p. 128).
Fractal geometry provides an appropriate means of measuring many types of irregular formthat had previously resisted scientific classification (Whitehand, 1992). In the context ofclassifying a satellite image, each region (polygon) is described in terms of locational,spectral and spatial characteristics (e.g., size and perimeter). This helps in labelling a polygon as belonging to a particular land use class based on shape and size related factors.In general it is used to (de Cola, 1989):
i. improve the spatial analysis, spectral analysis, spectral classification, and functionallabelling of remotely sensed data;
ii. address the task of making inferences about spatial processes from spatial pattern; and
iii. link remote sensing with GISs through regions with fractal perimeters imaged at a specific scale.
Its application in the field of urban and regional planning was with considerable uncertaintyabout the processes in operation, until the recently published works by Batty and Longley(1994). As they put it, extending fractal geometry to system of cities is comparativelystraight forward. But a thorough analysis is yet to be attempted, which must therefore behigh on any research agenda. Strangely, though they began this work by examining visualperceptions of urban form, they do not make much use of remotely sensed images, exceptfor a remark in the passing, "...and we could complement this display of data with that takenfrom remotely sensed imagery... But our concern here is with measurement and simulationwhich requires a somewhat more abstracted picture of urban development..." (Batty andLongley, 1994, p.235, emphasis added).
3.4.3 Individual Decisions - Overall Effects
There are millions upon millions of individual choices and not a single choice of a combination of all locations, i.e., no person, body or authority who can make an overall,comprehensive choice. In many urban and regional systems it is important to ascertain an
56

overall situation. But the information we usually have, or likely to have, relates, by andlarge, to individual decisions (Chadwick, 1987).
With very high capabilities of providing synoptic views over large areas, satellite images canbe useful base for carrying such macro-analyses of settlement patterns. It not only providesa great deal of information more efficiently than field surveys; it also offers a perception ofhuman settlements that is truly new. It literally provides humankind with a new point ofview, and therefore a new understanding of its habitat (Bolt, 1993). In perceptual terms,travelling by air, similarly, is an opportunity to see a metropolitan area almost at a glance(Lynch, 1960).
Using satellite remote sensing data, for example, is quite useful to establish the inherentrelationships between urban and rural hinterlands of the city. Urban/ non-urban or built-up/non-built-up boundary separation can be accurately delineated compared to conventionalsurvey, where identifying and mapping is a difficult task (Subudhi et al.7, 1989).
3.5 CONCLUSIONS
Techniques of pattern recognition and clustering are not widely used in the field of settlementpattern analysis. One reason may be that, often, the same procedures are developed indifferent disciplines but are so fragmented and departmentalized that cross fertilization isseverely hindered (Jain and Dubes, 1988; McHarg, 1995). Research, undertaken jointly bya digital image analyst (specialist in spectral pattern recognition and spectral clusteringtechniques) and a spatial planner (specialist in analysing settlement patterns) may be fruitful.
The gravity model and the rank size rule are primarily based on the inter-settlement distancesand the population size. However, in reality, distance is a relative measure. The distancecould be replaced by travel time, cost or effort. Moreover, in the present day context ofinformation super highways, physical distance seems to be a limited determinant. Similarly,one can postulate that the dynamics of development in the towns/ cities operate not onlythrough the population but also through their area base. It will be interesting to know theresults when the population size is replaced by (or added to) the CBA that differentsettlements under examination have. Moreover, if understanding of the distribution andscenario building is area based, satellite images will help to perform analytical exercisesmore often than at present. The gravity model and the rank size rule are essentially non-spatial in nature, and are generally not used for analysing settlement patterns.
A hierarchy of settlements can be developed using the central place theory and the spatialmodel for spatio-economic development. However, with reference to metropolitan regions,although retaining its (metropolis's) central functions for a wider area, the number ofinteractions and their density renders these models inadequate. Though the spatio-economicmodel uses a square lattice instead of a hexagonal one as in the case of central place theory,both are essentially geometrically oriented. Both assume a flat, uniform area and take theexisting pattern and order in the settlements not sufficiently into consideration.
The growth pole concept offers an extensively used planning strategy. It provides an efficienttool when applied conscientiously. At the same time, there remain some ambiguities
57

concerning its spatial aspects, basic characteristics, regional impact and temporal aspects. Theconcept of service centre hierarchies draws from various other theories. It is moresystematically applied, yet it is too much dependent on data on a number of facilities, as inthe case of the Composite Functionality Index.
One important conclusion that can be drawn from a review of the above mentioned modelsis that they all help in analysing the existing patterns. Most of them help, in a limited way,in predicting settlement patterns and, rarely, in planning settlement pattern changes.Moreover, the prevalent models consider setUements as point locations when analysing theirspatial distribution. The size of the seUlement, not in terms of the population it holds but interms of the area it covers on ground, or its shape, is hardly ever considered. Although someattempt to define the idea of shape seems necessary, in practice most attempts to do this havebeen less than satisfactory. 'Fractal analysis' brings some hopes, however, the concept is stillvery new and its usefulness in modelling settlement patterns is premature.
Another conclusion drawn is that most quantitative models of settlement patterns rely heavilyon assumptions like isotropic planes and rational economic behaviour. The geometrically andstatistically guided models do not really work in the light of 'urban managerialism', politicalclimate and planning behaviour. A system of service centres, for example, may provideaccess to a range of services but it will not necessarily spark economic development, sinceother factors outside the realm of settiement planning per se may prevent this.
Thus, methods will have to be developed which are flexible not only in the conceptualcontext (e.g., CBA) but also in their application to model settlement pattern in a region.Satisfactory techniques are not available for performing a 'formal' spatial pattern analysisexercise. The methods developed have to be based on a partial visual/ manual analysis.Similarly, since the techniques of spatial autocorrelation and point pattern analysis areessentially 'point' location based, their application into an area (e.g., the CBA) basedapproach is not possible in a strict sense. Existing settlement patterns that have emerged asresult of the history of social, economic and political forces, and of technological advance,have to be respected.
Methods based on traditional concepts require accurate, sophisticated and timely availabilityof data, both spatial and attribute, on a variety of subjects. The level of detail required forinformation on many functions changes frequently and is difficult to update on a regularbasis, more so in developing countries. Models loose their sophistication when outdated dataare fed into them. Further, in many urban and regional systems it is important to ascertainthe overall situation. But the information we usually have, or are likely to have, relates, byand large, to individual decisions.
With the capability of providing synoptic views over large areas, remotely sensed data (e.g.,satellite images) can be a useful base for carrying macro-analyses of settlement patterns, atfrequent intervals. It not only provides information more efficiently than field surveys; it alsooffers a new perception and a new understanding of human settlements. Some of the aspectsinvolved, and limitations in using such data, are discussed in the following chapter.
58
4
the urban settlement - the town, the city, the metropolitan area - is a physically separateunit that is visually identifiable from the air." (Webber, 1964, p.81). It was concluded in theprevious chapters that the concept of CBA has fewer disadvantages than others for thepurposes of this research. This and similar concepts not only allow for the element of spatialdynamism, they also enrich the temporal dynamism. It is useful and conveniently applied onremotely sensed data. With very high capabilities of providing synoptic views over largeareas, remotely sensed data (e.g., satellite images) can be useful base for carrying macro-analyses of settlement patterns, on frequent intervals. It not only provides a great deal ofinformation more efficiently than field surveys, it also offers a perception of humansettlements as painted by Isard as back as in 1956.
"Imagine our observer in space pilots his platform to a position fairly close to the earth'ssurface, and yet not so close that he fails to see the forest for the trees...In approaching theearth's surface, he might have already been forcefully struck by the spatial densityconfigurations formed by the loci of population and by the physical structures and facilitiesconstructed by man. Upon retreating into space, he might curiously regard these broaddensity configurations a second time, and perceive certain unchanging characteristics." (Isard,1956, p. 18). Today, images provided by remote sensing satellites provide an opportunity toobserve what was dreamed by Isard in the 1950's, as often as every 16, 26 or 22 days (i.e.,the repeat cycle) respectively through Landsat 4 and 5, SPOT and IRS satellites.
This chapter appraises the technology of remote sensing for a general understanding, itsapplication usefulness and limitations in the field of spatial planning, specifically towardsmodelling settlement patterns. As the models developed (see Chapter Seven) are intended tobe applied in a developing country (i.e., India) situation, a scenario describing the status ofthe remote sensing technology in India has also been presented. The chapter concludes withthe details of processing and interpretation of the data from the Indian Remote SensingSatellite (IRS) for the NCR, India, case study area for this research.
4.1 CONVENTIONAL SOURCES OF DATA
Data are defined as measurements or observations of facts which, when processed/interpreted/ organized, become information (Shelton and Estes, 1981). Data collection is an
Parts of this chapter have been prepared joinUy with Al -Amir ( 1 9 9 6 ) .
59
MODELLING SETTLEMENT PATTERNSINPUTS FROM REMOTE SENSING
Gerritsen
Typewritten Text
Gerritsen
Typewritten Text
_______________________________________________________________
Gerritsen
Typewritten Text
Gerritsen
Typewritten Text
Gerritsen
Typewritten Text
Gerritsen
Typewritten Text
16
essential part of any spatial planning exercise. Traditionally, data can be obtained fromprimary (e.g., surveys) and/or secondary (e.g., statistical) sources. These sources can be inthe original format or processed.
Conventional primary surveys are carried out by actual physical measurement of variousaspects of a settlement and its surroundings. These include physical surveys with the help ofconventional instruments (e.g., dumpy level and theodolite) supported by other observations(e.g., of building height, material, condition and age); and density, land use, and traffic andtransportation surveys. Physical surveys are supplemented by socio-economic surveys (e.g.,population surveys relating to age, sex and income groups).
It is not always necessary to conduct a primary survey for each planning or planning-relatedexercise. A large amount of useful data can be obtained from secondary sources. Secondarysources include telephone directories, newspapers, time-tables, census data, annual reportsand other published reports, tables and maps. More often, primary data, once published,become a secondary source for other users.
Both primary and secondary sources have disadvantages in their use. Primary surveys areoften time consuming and costly. They require much manpower and are subject to humanerror (e.g., omissions, negligence and bias). Some times, the area to be surveyed may beinaccessible because of strategic or other reasons. Usually, the results of primary surveys aremade available only after a time gap, rendering the data outdated. Temporal resolution ofsuch surveys are either not fixed and/or too low (e.g., 10 years for a census survey, andmore than 10 years for a land use survey in cities of developing countries). Time series aredifficult because census authorities often change boundaries, especially at the lowest level.In developing countries, there is the additional problem of completeness, particularly withreference to informal settlements. Lack of continuity, and the absence of staff conversantwith the data, or even with their location, usually mean that their secondary use is notpractical (de Bruijn, 1991).
Perhaps the most difficult task for a planner is to have a sense of the whole area to whichhis plans will apply. Involved in the day-to-day tasks of a particular project, it is hard forhim to maintain a perspective of a whole town, city or region. To maintain such a perspective would require an enormous investment of time - and quite a prodigious filingsystem.
4.2 REMOTE SENSING
No individual data source such as a census or survey can provide answers to the variety ofproblems addressed by planners. It is this problem that remote sensing is suited to handle.The images produced by remote sensor provide a record of the form of a place; this recordcan be interpreted to provide an inventory of the various functions that occur there; and whenthe records are made at intervals, they provide a history of the evolution of a place. Theplanner who uses remote sensing technology obtains a holistic sense of what his area lookslike, what goes on there, and how it has changed (Bowden, 1979).
60

Remote sensing can be defined as science and art of acquiring information about the materialobjects from measurements made at a distance, without coming into physical contact with thematerials of interest (Lindenlaub, 1976). It is considered the field to subsume all thedisciplines of air photo interpretation, photogrammetry and the use of images from remotesensing satellites (Rhind and Hudson, 1980). Drawing, photography, and remote sensing arenot only the sole substitutes for direct human viewing but they are the only way of picturinga large city. Superior to any maps, modern remote sensing image media are tools forinformative communication amongst planners, with decision makers, and especially with thepublic. It is a way of bridging the gap between the planner's perceptions, information,analyses, intentions and the perceptions of his citizen clients (Westerlund, 1979).
4 .3 AERIAL PHOTOGRAPHY
Aerial photography provides a complete and useful visual simulation of a city. Besides theinformation which it presents, photography can act as a trigger to recall pictures of parts ofthe city. Aerial photography provides a substitute for site visits, which are always desirablebut often impractical. Also, without aerial photographs, the three-dimensional reality may notbe fully appreciated because it may be too difficult and time-consuming to accumulate a reasonably complete mental picture of an entire area by inspection on ground. Photographstaken on the ground are no substitute for aerial photographs, since structures and differencesin terrain restrict what can be seen, as compared with the information revealed in overheadpictures of the area. It is surprising how often this important use of air photo, to 'see' thecity, is forgotten or ignored in urban planning (Branch, 1971).
The value of air photos in the presentation of planning to the public is evident, since theaverage citizen may have difficulty in fully understanding maps and plans, in visualizing thethree-dimensional reality they represent, and in obtaining from them the information theycontain. Sketches and drawings are not as realistic and actual, and they are subject tocriticism in that they exaggerate or otherwise alter the true situation. Stereoscopic viewfurther increases the range and reliability of photo interpretation.
4 .3 .1 Aerial Photographs for Urban Planning
A combination of low altitude, larger-scale vertical photographs with oblique views taken toeach side at the same time makes possible the most complete and reliable interpretation ofland use from aerial photographs for urban planning purposes. In comparative city planningresearch, urban studies, and environmental investigations, oblique photographs are adequatefor many purposes. For example, if taken at high altitudes in clear weather or with filtersreducing obscuration caused by haze, they may show urbanization, the relationship ofcommunities to their metropolitan and regional surroundings, the extent of verticaldevelopment, circulatory patterns, or perhaps indications of air or water pollution. Inessence, they represent the best descriptive, informational basis for many researchinvestigations concerning the physical city. In a surprising number of cases, research can beconducted and conclusions reached from study of the photographs alone. When derived dataand conclusions are superimposed on the photographs or closely associated with them, thereality of the pictures reinforces the reality of the quantitative abstractions. A typical aerial
61

photograph is shown in Figure 4 .1 .
A survey can be made on the ground to check information from aerial photography, or todevelop reliable indicators of conditions not shown directly in overhead pictures. As a basicrule, photo interpretation must be checked with the 'ground truth'. Only in specific cases(e.g., when corroborative data are not available or time is very limited), can photointerpretation without checking the 'ground truth' be acceptable (Wogayehu, 1993). Thegreater the familiarity of the user with the general nature and many components of the urbanscene, the more vivid the mental picture of these features and activities as they appear fromabove, the greater the awareness of indirect indicators of socio-economic information notdirectly shown in aerial photographs. Similarly, detailed interpretation depends on preciseknowledge of the special category of information. Therefore, the more those concerned withcity planning and related municipal activities know about their subject 'on the ground', thegreater the information derived from aerial photography and the easier and more effectiveits use (Branch, 1971).
4.3.2 Constraints and Limitations
A number of important problems remain to be faced by all users of aerial photographs. Oneof these is the restraints imposed by the general scale of photograph. Another problem is theassumption of a constant relationship between form and function. Changes in the form/function relationship may be very significant where some other variable is being inferredfrom land use. It is also obvious that multi-level urban land use data are difficult andfrequently impossible to acquire from aerial photographs. There is a problem related to thequestion of form and function and to characteristics of the survey - the accuracy andconsistency of the results (Rhind and Hudson, 1980). In many countries where the capacityto produce and regularly up-date maps has been found insufficient, and procedures of mapproduction are costly and time consuming, the role of aerial photography is likely toincrease. The increase is also likely to be supported by the increased use of computers (e.g.,for the storage, retrieval and analysis of data). In turn, maintaining the data in up-to-datecondition, through the use of aerial photography, is essential to the efficient use of thecomputer (e.g., in modelling). Moreover, in many (specially developing) countries the useof aerial photography is limited, or even restricted. Therefore, civilian decision makers mustoften use very inappropriate material to generate the type of data which would technicallybe readily obtainable from aerial photography. On the other hand, the civilian bureaucracyoften blames its shortcomings on restriction which may not in fact exist (Thung, 1985).
4.3.3 The Policy of Restriction
In India, for example, aerial photography is governed by the policy of restriction. All theaerial photography is classified as 'secret'. It is laid down that the permission of the Ministryof Defence has to be obtained at the time of flying, after completion of photography, andbefore release of photographs (or maps) to the user. Topographic maps falling underrestricted zones are also not available easily. The steps in filling up the forms to receivephotographs or restricted maps and their cumbersome follow-up have made manyorganisations and individuals give up the technology of aerial photography altogether. As a
62

Fig. 4.1 Vertical Aerial Photograph of the City Centre, EnschedeThe Netherlands; 1972Scale 1:5,000 (here reduced 75%)Courtesy: ITC, Division of Urban Planning and Management
result, orthophotomapping has died its own death and there is hardly any production oforthophotomaps (Misra, 1989, 1993), in spite of the fact that base maps are required forabout 500 important towns on priority1 7. The policy of restriction, and other disadvantagesassociated with the aerial photographs, are encouraging more and more professionals to usesatellite data products, as they are not subject to the same restriction (Mahavir and Galema,1991).
4.4 SATELLITE IMAGERY
Basically, two types of sensor systems are used in the field of remote sensing, photographicand non-photographic. In the photographic systems, wavelengths in the visible and near-infrared portions of spectrum are detected using photographic films. In the non-photographicsystems, the image is created by light sensitive detectors that produce electrical signalsproportional to the brightness of the light energy. A single detector views a strip of terrainby using a rotating mirror to direct its 'field of view' across the landscape below. Thisprocess is known as scanning. An image analysis system is then used to reconstruct anddisplay the signals obtained by the detector as a picture-like image. This reconstructed imageis composed of a large number of picture elements, termed 'pixels', each of which isassigned a colour, or shade of grey, according to the received light energy (Aronoff, 1993).
Remote sensing refers to the measurement from a distance of electro-magnetic radiationemitted by, or reflected from, the earth's surface. Information related to the earth's naturaland human processes, their management and monitoring may be obtained by interpretingspectral, spatial and temporal variations in these measurements. Remote sensing instrumentsmay be mounted on platforms such as aircraft or orbiting satellites. These instruments offeran opportunities for recording information in synoptic, repetitive and timely manner.Recording devices are based on scanners which operate in different modes (e.g., MS of 20mx 20m or PAN of 10m x 10m pixel size in SPOT satellite).
The earth orbiting spacecraft permit regular observation of urban locations around the worldand provide an opportunity to discover if there are comparable trends or patterns of urbangrowth. Satellite surveys taken at five to ten year intervals could show patterns of urbangrowth, such as the rate of urban spread at the periphery, or the tendency of communitiesto grow together or coalesce to form large cities and huge megalopolis (Branch, 1971). It istoo powerful a tool to be ignored in terms of its information potential, its technological spin-offs, and the logic systems implicit in the reasoning process employed to analyze the dataproduced by remote sensor systems (Estes and Holz, 1985).
Remote sensing from a platform high above the earth, such as a satellite, can provideregional views not readily gained by ground observations or observations from loweraltitudes. It can provide repetitive looks - daily, weekly, monthly or yearly - at the same area
India has about 4 , 7 0 0 towns and cit ies as per 1991 census . Of these, 3 1 7 are class I c i t i es , i . e . , populationm o r e than 1 0 0 , 0 0 0 or more . There are 23 metropolitan c i t ies , i . e . , population 1 mi l l ion and above .Formal ly produced base maps and guide maps at scales ranging be tween 1 :10 ,000 and 1 :20 ,000 areavai lable for only about 60 cit ies (Misra, 1993) .
63
Gerritsen
Typewritten Text
Gerritsen
Typewritten Text
________________________________________________________________
Gerritsen
Typewritten Text
Gerritsen
Typewritten Text
17

or target. As remote sensing images generated today are in an electronic format, they canbe processed electronically. This makes possible the use of modern, high speed computersthat can store, quantitatively analyze, and display remotely sensed data (Estes and Holz,1985). Where remote sensing adds to the knowledge of a field related to city planning, thisadvance may be incorporated into the body of knowledge employed in studying and guidingthe development of cities. Thought and imagination will indicate other possibilities of howremote sensing may serve city planning in important new ways at some future time. Whileremote sensing is not capable of producing a complete inventory for all land use studies, itis probably the single most important tool and labour saving device for land use mapping andfunctional class identification (Bowden, 1979). Such mapping is often inexpensive and useful;because of the altitude at which images are taken, the images are almost distortion-free and,in some parts of the world, are often more accurate than the best topographic maps (Rhindand Hudson, 1980; Paulsson, 1992).
4.4.1 Information Extraction
At no time in history has a technology moved and expanded as rapidly as remote sensing,perhaps excepting computer development which gave remote sensing and the resultinggeographic data handling (GIS) the impetus for its rapid growth (Thung, 1985). While remotesensing is sometimes the only source of data, more often it complements and supplementsother data sources and helps create an accurate data base for decision-making (Henderson,1979). Combination of existing data sets such as zoning specifications and newly obtainedremote sensing products often provide a tolerably reliable survey at a reasonable price.Combination with information from sources other than remote sensing occurs for two mainpurposes: i. to corroborate or compliment one type of information with the other, assumingsome common substantive content, and ii. to perform an analytical function that relates twodifferent types of information. Neither type of combination (corroboratory and analytical)necessarily demands that remote sensing derived information be fully integrated with anexisting data base. In any case, existing material which may have been generated earlier bycentral agencies must be made use of; duplication is expensive (Thung, 1985). However,there must be ways of relating the information (Westerlund, 1979).
A noteworthy aspect of the present day use of satellite remote sensing is the fact that imageanalysis and information extraction are carried out using a variety of techniques. These rangefrom simple interpretation methods - similar to those applied in many instances with aerialphotography - to complex automatic, semi-automatic and interactive digital processing,optionally coupled with sophisticated information management sub-systems. Choice ofmethods and techniques depends upon the problems to be solved, scope of work and availableresources, equipment and expertise. The resulting flexibility contributes significantly to theapplicability of the data and the functioning of the sub-systems (Voute, 1982).
Satellite images for land surfaces are acquired by the American Landsat series, the FrenchSPOT (Systeme Pour rObservation de la Terre), the Indian IRS-1 and the Japanese MOSseries. For a long time, images with a low spatial resolution (e.g., 80m of MSS) only couldbe ordered. A considerable improvement of resolution arrived in the market in 1986 with the10m spatial resolution Panchromatic SPOT (Figure 4.3). SPOT images provide a synopticview on areas as big as 60 km x 60 km. On such an image not only a (big) city can be seen
64
but also a large part of its environment in which it might expand. Attempts are being madeto define the building heights using SPOT Panchromatic images (Cheng and Thiel, 1995;Hard and Cheng, 1995). However, while stereoscopy is useful with large scale aerialphotographs, stereo images (which are possible with SPOT) do not make delineation ofsetUements easier (P0II6, 1988; 1993). The future of these remote sensing satellites willprovide continuity of data supply by replication of existing sensors and evolutionalenhancements to current sensor designs with addition of wavebands, or increases in spatialresolution. These advances will give scientists new types of data, and the challenge to usethese data in order to derive anew and meaningful information about the earth's surface(Plummer et al., 1995).
Global proliferation of new high-resolution imagery is only a few years away. Commercialremote sensing satellites, viz. EarlyBird, Quickbird, OrbView and Sis, planned for 1996-97,will have cameras with a Ground Sample Distance (GSD) of 1-5 meters, stereoviewingcapability, and the data from these could be provided in real time on Internet (Gupta, 1995,1994; Plummer et al, 1995; Henderson III, 1995).
4.4.2 Classification and Interpretation
The primary value of remotely sensed data lies in the information which they convey aboutthe environment. Such information is obtained through interpretation, which is partly scienceand partly art (Shelton and Estes, 1981). While sensor technology has improved considerablyover the last two decades, the techniques used to extract the desired information from theresultant images have not always developed accordingly (Barnsley et al., 1993). In thisconnection, the advantages of visual and optical interpretation techniques have to be stressed.They make use of the unique capabilities of the human eye and human mind to recognizefeatures and patterns and to deduce the presence of objects, facts and processes (Voute,1982). The human brain automatically takes into account texture, structure, context,experience, and 'common sense' in the analysis of the reflectance data. In visual/ opticalinterpretation, good use is made of synoptic overviews over very large areas for broadclassifications so as to recognize and identify regionally important features, which mayremain unnoticed in more local and detailed studies. The advantages of stimulating thecreativity of the individual to understand and solve local problems, using both localknowledge and knowledge of the discipline involved, are often underestimated. This is ofimportance, irrespective of whether professional or non-professional utilization is considered(Voute, 1982). Despite advances in automated and machine-assisted interpretation, humaninterpreters will be always essential - identification and validation require human judgement(Shelton and Estes, 1981). For urban applications, in most cases, visual interpretation ofsatellite images is better than computer-based processing (Paulsson, 1992).
4.4.3 Digital Image Processing
Data originate from measurements made by instruments carried on earth orbiting spacecraft,they flow through a reception facility as a set of raw data. The raw data are then processedand geo-coded to perform the required measurements. Several established techniques ofimage enhancement (such as linear contrast stretch, density slicing, edge enhancement,
65

contrast enhancement, and spatial filtering) can be applied for achieving optimum results.
Digital image processing and information extraction techniques offer entirely differentpossibilities through the use of a man-machine interaction based on combining specificcapabilities of the human being, on one hand, and the computer and peripherals, on theother. Advantages are a higher level of information extraction, a potential of combiningdigitally image obtained at different times or with different sensor systems, and integratingthese with digitized data from other sources of information (Voute, 1982). At the simplestlevel, an image understanding system may provide a cue that an image contains a specificobject or perhaps an unexpected object. At the other extreme, the system may generate a very general verbalized description of a scene in the sense that a human viewer would writea paragraph about the contents of a particular picture (Pratt, 1978).
In essence there are two different ways of classifying digital remotely sensed data - i.e.,unsupervised and supervised. In the first, a computer programme carries out (spectral) clusteranalysis in which the individual pixels are grouped on the basis of the similarity of theamount of radiation measured in each waveband. The results tend to be labelled as groupsA,B, etc., i.e., at the analysis stage there is no knowledge of what, if any, (land use) classesthese constitute. The alternative approach is to utilize a priori knowledge, derived from thefacts on the ground, what is known in technical terms as 'ground truth'. Accuracies ofbetween 80% and 85% have been recorded for simple division of pixels on spectral groundsinto urban or rural areas (Rhind and Hudson, 1980).
Three obvious approaches exist to improve the level of success. First, to take into accountnot only the spectral signature but also the texture in each image taken at different seasons(or time coinciding with related events). Most automated classifications are one shot - allclasses are regarded as being distinct. The second improved approach being utilized is to uselayered classifications, i.e., to make decisions within a hierarchical classification framework,since most Oand use) classifications are hierarchical. A complication of this is the need forthe input of thematic information in deciding the layers to be used and how this is to belinked to the remotely sensed data; an advantage is that errors may be restricted to much lesssignificant ones. The third improvement is not within the control of the analyst - it is theimprovement in the spatial resolution of the sensor and hence the reduction in the mixing ofdifferent land uses within each pixel (Rhind and Hudson, 1980).
4.4.4 Cost Effectiveness
Mapping at medium scales based on satellite data is normally less expensive and faster thanconventional mapping using aerial photographs. A comparison must take into account thefactors that cause considerable variation in costs for photo coverage, such as scale, size ofthe area, aircraft operating and staffing costs, field logistics, and climatic restrictions(Paulsson, 1992). In practice, it is remarkably difficult to assess how cost effective satelliteremote sensing has been in comparison with that from aircraft or, indeed, from groundsurvey. In urban situations, the benefits are often even more difficult to assess. For example,counting losses which might occur in the absence of a survey is tricky in the extreme (Rhindand Hudson, 1980).
66

4.5 SATELLITE REMOTE SENSING FOR SPATIAL PLANNING
Images obtained through remote sensing satellites have been used in a variety of applications,including earth resources and population studies. A number of applications have been foundin the area of spatial planning, some of which are discussed in the following paragraphs.
4.5.1 Population Estimation
Estimating population or population density is a complex problem. Estimates of populationcannot be obtained directly from remote sensing images. However, simple models employingvisible physical characteristics can be designed that infer population densities by surrogate.These models use remote sensing images to define an area according to land use types or thenumber of housing units. This is combined with such data as previous population counts,selected census data, and other variables associated with population, and the result is a ratherprecise population estimate. Work in the Sahel area of Africa, and in Brazil, concluded that,except in the largest cities, there was a linear relationship between population and area ofcities as defined on satellite images (Henderson, 1979). In the case of Sokoto city in Nigeria,where a census was not held for decades and field checks could not be conducted due topolitical disturbances, Wogayehu (1993) demonstrated that reasonable estimates of populationand housing densities could be made based on aerial photographs and SPOT images.Accuracy of each method is dependent upon local land use practices and settlement patterns.While most of the methods contain some inaccuracies, they are or can be comparable toresults obtained by standard population estimating techniques. This is particularly true whentime and/or data availability are factors. With perseverance, useful data can be derivedeconomically but limitations must be recognized.
4.5.2 Change Detection
Change detection is fairly straightforward task for photo-interpreters evaluating large-scaleaerial photography; but visual comparison of photos is slow, it is a tiring task, and it issubject to numerous errors of omission. These are some of the reasons why methods are usedthat automatically correlate and compare two sets of image and indicate changes. A changedetection method should be based on a sensor system that: i. has a systematic period betweenoverflights; ii. records image of the same geographic area at the same time of day tominimize diurnal sun angle effects; iii. maintains the same scale and look angle geometry;iv. reduces relief displacement as much as possible; and v. records reflected radiant flux inconsistent and useful spectral regions.
If these conditions are satisfied, then it may be possible to analyze the spatial, spectral andtemporal characteristics of the data to produce land use change statistics (Estes and Holz,1985). Unlike administrative records such as files of plots or building permits, remotesensing surveillance picks up all actual occurrences of urban development within technicaldetection capabilities, whether or not they are officially recorded. The technical challengelies in perfecting methods that replicate earlier classification with such consistency that theresulting information records may be compared for change with confidence that differencesrepresent real change and not 'noise' or variability in the interpretation method (Westerlund,
67

1979).
Digital change detection is a difficult task to perform accurately, using satellite data. Theresults will not be as accurate as those produced by a photo-interpreter analyzing large scaleaerial photography. Nevertheless, because manual change detection is exhaustive, difficultto replicate, that is, different interpreters produce different results, and incurs substantial dataacquisition costs, researchers continue to seek improved digital change detection algorithms.Spatial, spectral and temporal constraints affect digital change detection. Assuming the imagecan be placed in a configuration that allows digital analysis, the selection of an appropriatechange detection algorithm takes no significance. Image differencing or ratioing of spectraldata are practical but may be too simple to identify the variety of change in a scene. Theirutility may be enhanced by incorporating other processed data such as texture in the analysis.Classification comparison methods are useful only if accurate land use classification(s) canbe obtained. Several processing operations, such as low and high pass filtering and principalcomponent analysis (PCA), are also available as potential aids in change detection but thesehave not provided consistent change detection results. Moreover, persons conducting digitalchange detection must be intimately familiar with the environment under study, the qualityof data set, and the characteristics of change detection algorithms (Jensen, 1985).
Updating of a topographical map of the urban fringe areas for planning purposes is quitefeasible. This method of map updating could rapidly develop into a useful tool for planners,especially as the geometry of the SPOT images, for all practical purposes, is as good as thatof a topographical map. This implies that measuring the growth of a settlement, in areameasures, can be done with reasonable accuracy (P0II6, 1992). SPOT images are particularlyuseful for analyzing the growth and size of human settlements. Even a few general land useclasses can be studied with sufficient accuracy for most general planning purposes (Mahavirand Galema, 1991). Moreover, SPOT imagery has a very high revisit capability, any areain the world can be observed every 3 days (Maurel, 1993).
Eurostat (Statistical office of the European Communities) recently launched a pilot projectentitled, 'Remote Sensing and Urban Statistics' to monitor both the extent of urban areas andtheir composition in terms of land use. Largely based on SPOT-HRV data, different stagesof the project will include producing an accurate map of land use within and around theurban area; producing a map delineating the urban morphological zone; and finally producingan 'urban agglomeration map' (Barnsley, 1993).
If remote sensing can provide one set of information that is frequently updated, and in whichchange is identified, this may effect the use, interpretation, or credibility of other informationthat can not be updated as frequently. Change detection may trigger the collection of newinformation of other kinds. An information set created by remote sensing can thus providea standard by which other information is judged for consistency (Westerlund, 1979).
4.5.3 Settlement Patterns
Providing synoptic view over a large area , in a very short time, is probably the mostimportant use of remote sensing in planning (Jensen, 1979; Thung, 1985). Since settlementpatterns are composed largely of visible, spatially arranged inhabitation, more can be learned
68

of them from remote sensing image than any other single source. Images have the potentialfor providing information concerning the contemporary elements and type of settiement. Theyoften reveal the detailed physical condition and areal patterns involved in the process oforiginal setdement and subsequent occupancy (Bowden, 1979). The information that satelliteimages might reasonably be expected to provide about urban areas includes data on theirphysical extent, i.e., their location and perimeter (Barnsley et al., 1993). A study concernedwith the detection at a regional scale of areas where changes have occurred does not requirethe high spatial resolution. The relatively low spatial resolution of 72.5m meets the spatialcharacteristics required for the detection of landuse changes at a regional scale (Charbonneauetal., 1993).
The advantages of satellites as sensing platforms is the frequency and repetitiveness of imageprovided, the consistency of recording and (if automated procedures are used) ofinterpretation, the low cost per unit area which may accrue from many users, and the lackof any problems from other air traffic. If detection of change rather than the provision of a base line-survey is considered, the relative utility of image and aerial photography are, asever, entirely dependent on the detailed needs of the user. Also, all forms of remote sensingare liable to lead to errors where land use based on function is being sought (Rhind andHudson, 1980).
4.5.4 Constraints and Limitations
In general, there is a lack of awareness of the technical possibilities and limitations of remotesensing technology, and its potential benefits. Remote sensing should be seen as a methodfor acquiring data, and not as a tool to solve development problems. The proliferation ofremote sensing centres may become expensive unless it is coordinated so that data gatheringcan be conducted with minimum overlap (Thung, 1985).
Voute (1982) grouped the constraints in applying remote sensing in developing countries intothree categories. These are the system limitations of the satellite missions, which only partlymeet the needs of developing countries, the lack of facilities and manpower, and insufficientpreparedness for remote sensing application and their operational use. Furthermore, the lackof awareness of those in power about the usefulness of remote sensing data gatheringtechniques is coupled with a lack of willingness to accept new technology, due toconsequences as to infrastructural adjustment. This may result in frustration of those whohave mastered the technique and, therefore, have become isolated.
Though used in a variety of applications (e.g., in the fields of natural resource managementand environmental protection) the use of satellite remote sensing in urban planning is not aswidely spread, both in developed and developing countries. Although relatively cheap desk-top and window versions of image processing packages (together with GeographicInformation Systems) are now available, hardware and software are expensive and requireexpertise.
Overcoming the lack of facilities and qualified personnel in developing countries requiresinvestment of considerable resources, in the case of development assistance, by both donorsand recipients. The investment includes the design of appropriate education and training
69

methodologies, and the production of relevant educational material. Reducing the gap in theavailability of facilities between developed and developing countries is not only a matter offunding, equally important is a selection of suitable subsystems and components. Thereshould be a proper assessment of the new technology by the national governments concernedand by national user communities. This, in turn, requires a science and technology policybased on national economic and cultural development policies. Such assessment should bebased on efficiency, cost effectiveness of operations, types and volume of work to beperformed, plans for consolidation or adjustment of infrastructure required for surveying,monitoring and use of information, and economic and social benefits to be derived therefrom(Voute, 1982).
The operationalization of remote sensing involves moving from a study of remote sensingprinciples and technology to an analysis of how remote sensing can be used to solve practicalproblems. The operational use of remote sensing faces obstacles. These include the under-estimation of the complexity and size of the impact that remote sensing has on existinginstitutions, and under-estimation of costs associated with the introduction of this technology,such as daily running costs, system maintenance and staff development (Genderen, 1993).
There is another view on the research and development needs of remote sensing, which isbased on experiences of the remote sensing market. In this view, to develop routineapplications, remote sensing research has limited value if it does not pave the way of real usein any field (e.g., scientific community, operational public benefit, commercial users). "Wemust develop systems, not just methods. End-to-end systems that solves the whole problemat affordable cost, that fits into established structures, and that makes use of availabletechniques and other scientific fields as well... Remote sensing is bridging the gap betweentechnology, science and application, and culture." (Borg, 1995, p. 16).
4.6 STATUS OF (Satellite) REMOTE SENSING IN INDIA
The major focus of the Indian space programme has been on strengthening and acceleratingthe pace of development in the country through significant enhancement of her capabilitiesin communication, broadcasting, weather forecasting, education, disaster warning and optimalmanagement of land and water resources. Indian Remote Sensing Satellite IRS-1A was thefirst operational earth resources satellite in the country, followed by IRS-IB. Both had twopayloads each employing Linear Image Self-Scanning Sensors (LISS), which operate in a push-broom scanning mode using Charge Couple Devices (CCD) linear arrays. LISS-1provides a resolution of 72.5m, whereas LISS-2 provides a resolution of 36.25m. The choiceof the payloads has been made on the basis of application needs of the users. Theoperationalisation of various application projects using remote sensing techniques has beenconceived and enhanced through the successful launch and commissioning of both IRS-1Ain 1988 and IRS-IB in 1991 which are the indigenous, state of art satellites1 8. Both thesatellites operate under four spectral bands, as detailed further (ISRO, 1989, pp.2.6, 6.1):
See ISRO, 1 9 8 9 , for detailed technical specif icat ions of these remote sensing satell ites.
"0
Gerritsen
Typewritten Text
Gerritsen
Typewritten Text
______________________________________________________________
Gerritsen
Typewritten Text
Gerritsen
Typewritten Text
18
Gerritsen
Typewritten Text
Gerritsen
Typewritten Text
Gerritsen
Typewritten Text
70
Gerritsen
Typewritten Text
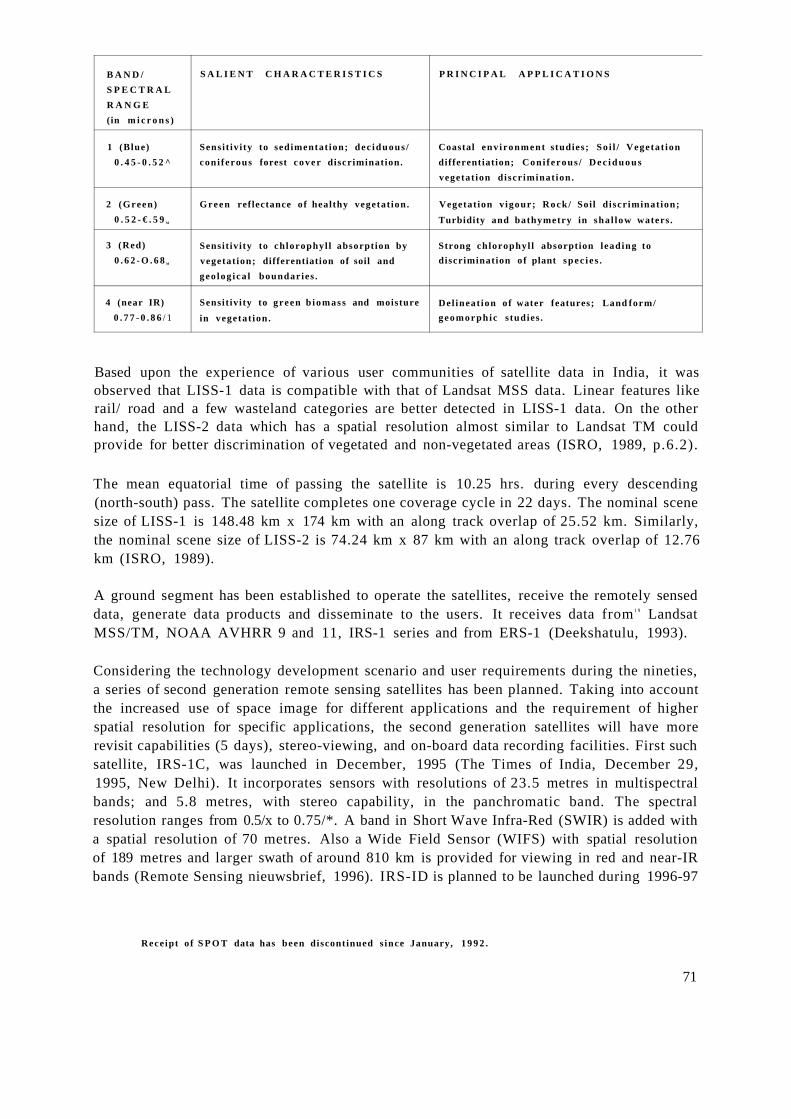
B A N D /S P E C T R A LR A N G E(in m i c r o n s )
S A L I E N T C H A R A C T E R I S T I C S P R I N C I P A L A P P L I C A T I O N S
1 (Blue)0 . 4 5 - 0 . 5 2 ^
Sensit iv i ty to sedimentat ion; dec iduous /coni ferous forest cover discrimination.
Coastal env ironment studies; So i l / Vegetat iondifferentiation; Coni ferous / D e c i d u o u svegetat ion discriminat ion.
2 (Green)0 . 5 2 - € . 5 9 M
Green reflectance of healthy vegetat ion. Vegetat ion v igour; Rock/ Soil discrimination;Turbidity and bathymetry in sha l low waters .
3 (Red)0 . 6 2 - O . 6 8 M
Sensit ivity to chlorophyl l absorption byvegetat ion; differentiation of soil andgeo log ica l boundaries .
Strong chlorophyl l absorption leading todiscrimination of plant spec i e s .
4 (near IR)0 . 7 7 - 0 . 8 6 / 1
Sensit ivity to green b iomass and moisturein vegetat ion.
Del ineat ion of water features; Land form/geomorphic s tudies .
Based upon the experience of various user communities of satellite data in India, it wasobserved that LISS-1 data is compatible with that of Landsat MSS data. Linear features likerail/ road and a few wasteland categories are better detected in LISS-1 data. On the otherhand, the LISS-2 data which has a spatial resolution almost similar to Landsat TM couldprovide for better discrimination of vegetated and non-vegetated areas (ISRO, 1989, p.6.2).
The mean equatorial time of passing the satellite is 10.25 hrs. during every descending(north-south) pass. The satellite completes one coverage cycle in 22 days. The nominal scenesize of LISS-1 is 148.48 km x 174 km with an along track overlap of 25.52 km. Similarly,the nominal scene size of LISS-2 is 74.24 km x 87 km with an along track overlap of 12.76km (ISRO, 1989).
A ground segment has been established to operate the satellites, receive the remotely senseddata, generate data products and disseminate to the users. It receives data from1 9 LandsatMSS/TM, NOAA AVHRR 9 and 11, IRS-1 series and from ERS-1 (Deekshatulu, 1993).
Considering the technology development scenario and user requirements during the nineties,a series of second generation remote sensing satellites has been planned. Taking into accountthe increased use of space image for different applications and the requirement of higherspatial resolution for specific applications, the second generation satellites will have morerevisit capabilities (5 days), stereo-viewing, and on-board data recording facilities. First suchsatellite, IRS-1C, was launched in December, 1995 (The Times of India, December 29,1995, New Delhi). It incorporates sensors with resolutions of 23.5 metres in multispectralbands; and 5.8 metres, with stereo capability, in the panchromatic band. The spectralresolution ranges from 0.5/x to 0.75/*. A band in Short Wave Infra-Red (SWIR) is added witha spatial resolution of 70 metres. Also a Wide Field Sensor (WIFS) with spatial resolutionof 189 metres and larger swath of around 810 km is provided for viewing in red and near-IRbands (Remote Sensing nieuwsbrief, 1996). IRS-ID is planned to be launched during 1996-97
Receipt of S P O T data has been discontinued s ince January, 1 9 9 2 .
71
Gerritsen
Typewritten Text
Gerritsen
Typewritten Text
________________________________________________________________
Gerritsen
Typewritten Text
Gerritsen
Typewritten Text
19

(Kalyanaraman et al, 1995), while four more are planned to be launched, one every year,until end of the century (The Times of India, December 29, 1995, New Delhi). Followingthe deployment of a 5.8 meter resolution sensor, India could possibly develop a higherresolution sensor for follow-on IRS systems (Gupta, 1994).
The Department of Space in the Ministry of Science and Technology, the Indian SpaceResearch Organisation, the Space Application Centre, the National Remote Sensing Agencyand the Indian Institute of Remote Sensing are amongst the various agencies engaged in theresearch, planning, design, data receiving, dissemination and training activities related toremote sensing. Besides these, a number of universities and institutes of higher learning offeracademic programmes leading to the award of a degree of M.Sc. and Ph.D.
Large scale operational demonstrations have been carried out in the selected theme areasunder the programme of Remote Sensing Application Missions. Amongst these themes areCrop Acreage and Production Estimation, Soil Resources and Soil Salinity/ AlkalinityMapping, Agricultural Drought Assessment and Forecasting, Land Use/ Land CoverMapping, Wasteland Mapping, Urban Sprawl Mapping, Ground Water Potential Mapping,Mineral Survey, Geo-environmental Surveys, Underground Coal Fire Mapping, SurfaceWater Mapping and Monitoring of Major Reservoirs and Command Areas, Flood Mappingand Damage Assessment, Snow-Melt Runoff Estimates, Marine Fishery Potential ZoneMapping, Forest Cover Mapping, Integrated Land and Water Resources Mapping,Monitoring and Assessment of Volcanic Eruption, and Forest Fires Monitoring. Thenoteworthy aspect of these projects is that many user departments have accepted the utilityof remote sensing for implementing their management plans (Deekshatulu, 1993). In the fieldof human settlements, a number of significant research studies and other projects have beensuccessfully conducted by the Human Settlements Analysis Group of the Indian Institute ofRemote Sensing2 0 (IIRS).
Unfortunately, not many studies have been reported in the literature, on the application ofIRS data in human settlements planning and monitoring, other than those conducted at theIIRS. A few studies available (e.g., Venugopal et al., 1993; Pathan et al., 1993) generallyrevolve around a mix of using aerial photographs, satellite images including those obtainedfrom foreign agencies and GIS for monitoring of urban areas. Some studies do attemptvarious image enhancement and interpretation techniques but on the whole fail to recommendany generalized procedures which could later be automatized. Moreover, there seems to bea general reluctancy in using IRS data (for example, see Sokhi and Sharma, 1989; Sokhi etal., 1989).
Lack of publicity, both for the availability of data and for reporting the results of studiesconducted based on such data, may be the principal reasons for comparatively low use of IRSdata internationally. Most recent books and papers on the subject do not list IRS as one ofthe satellite data sources. Other than the publication and distribution of the Journal of IndianSociety of Remote Sensing (a non-governmental organisation), and publication of papers inindividual capacity of authors, there is no evident official attempt for the same.
S e e Photonirvaehak; Journal of Indian Soc ie ty o f Remote Sens ing , V o l . 1 7 , N o . 3 (Special Issue on Human
Sett lement Analys i s ) , 1 9 8 9 , Dehradun, for a sample of such studies .
72
Gerritsen
Typewritten Text
Gerritsen
Typewritten Text
Gerritsen
Typewritten Text
Gerritsen
Typewritten Text
_______________________________________________________________
Gerritsen
Typewritten Text
Gerritsen
Typewritten Text
20

Though the IRS data, in principle, is available both to domestic and international userswithout any restriction, there is a general tendency to treat it as 'secret', a culture influencedby a similar official policy in case of aerial photographs. With the appointment of theEOSAT for distribution of IRS data outside India, it is hoped the IRS data will be morewidely used.
4.7 DATA USED FOR THIS RESEARCH
Out of the popularly used satellite images (e.g., those from Landsat, SPOT, IRS), the useof the data from IRS was preferred. This decision was prompted due to following reasons:
1. Ready availability of the data in the desired format and medium;
2. optimum resolution with respect to the objectives of this research. Whereas betterresolution, say 10m of SPOT Pan would have taken huge storing space andprocessing time, at the same time it would have increased the burden of 'aggregating'and generalizing the pixels of individual elements into one representing a CBA (seeChapter Two);
3. much lower costs of procuring the data, compared to other satellites; and
4. opportunity for conducting a pioneering study using IRS data. As stated earlier, notvery many studies have been reported in the field of human settiements using IRSdata, and certainly none at a regional level.
IRS-1A and IRS-IB data was procured from the National Remote Sensing Agency (NRSA),India. The data was obtained for the periods around 1st January, 1991 and 1st January, 1994.These dates were chosen respectively to coincide with the availability of latest census data(i.e., of 1991) and the most recent available images at the time of ordering. These dates alsoavoid large flooded areas during the rains/ very green city surroundings/ and hot-dry landthat can cause a very high reflectance. The exact dates of the data were determined based ontwo factors, i. the nearest date to the target date, on which the satellite passed over the area;and ii. near zero cloud cover in the scene.
The scenes finally selected ranged from those acquired between December 23, 1990 to March20, 1991 (to represent 1st January, 1991); and between December 16, 1993 to January 7,1994 (to represent 1st January, 1994). The scenes were selected so as to cover the entirestudy area at a resolution of 72.5m for both the time periods, i.e., 1991 and 1994. Two sub-scenes, for each time period, were also obtained at a resolution of 36.25m for parts of thestudy area. All the scenes were obtained in CCT, 6250 BPI, BSQ format, Standard dataproducts with polyconic projection and cubic convolution resampling. A completespecification of the products used is provided in Appendix IV.
All the data from CCTs was copied on 60 or 250 Mbytes Cartridge Tapes for use on PCbased ILWTS software package for image processing (ITC, 1993, 1994; Gorte, 1994). Seepara 5.3.3 for the choice of software.
73

4.7.1 Image Processing
The first step in using the data was preparation of False Colour Composites (FCCs) of thevarious scenes and sub-scene. After various trials, it was observed that the combination ofBands 1, 2 and 4, i.e., Blue, Green and near IR respectively, provided the most sharp images(see also Subudhi1 et al., 1989 and ISRO, 1989 for the choice of bands).
Several established techniques of image enhancement were applied for achieving a best visualdelineation of the CBAs. These techniques ranged from linear contrast stretch, densityslicing, edge enhancement and contrast enhancement to spatial filtering. These techniqueswere applied separately on each band of a multispectral image. Besides, Band Ratioing andPrincipal Component Analysis (PCA) were also applied. Ratioing B1/B4 and B2/B4; andPCA of Bands 1, 2 and 4 yielded good results. Standard procedures (e.g., those developedby Hofstee and Budde, 1994, Ex. 9.2) for 'linear stretching' and making FCCs wereadopted. Pixel values with a cumulative frequency between 5% and 95% were used as lowerand upper boundaries respectively. This resulted in a better (sharp) image compared to a usual 1% and 99% choice. Standard Colour Lookup Table was used for assigning colour tovarious pixels. Various filtering techniques were also applied to the images.
In spite of the use of various established techniques of image enhancement, no 'universal'technique(s) could be identified that could be applied uniformly to all the scenes. Differentscenes and sub-scenes required different treatment to obtain the most optimum image. Inmany cases, the simple FCC of linearly stretched bands provided good results. In many othercases the enhancement techniques did not bring fruitful results. This is due to the fact thatnot all the settlement have similar density/ texture/ and the general pattern of growth.Different (areal) size of settlements also required a different treatment. Moreover,surroundings of each settlement played a very important role in identifying, delineating andinterpreting the settlement. The general surroundings in the study area varied from a richfertile agricultural land in the state of Uttar Pradesh to dry, desert like surroundings in thestate of Rajasthan (see Chapter Six for details of the study area). This failure to pin-point a specific technique(s) capable of being applied uniformly to the entire study area lead tofurther limitation, that of non-automatization of the image processing. Each scene had to beprocessed individually and independent of other scenes.
It was also observed that instead of processing the whole scene at a time, breaking the scene(150 km x 150 km approx.) into several sub-scenes (usually 20 with a little overlap to ensurecontinuity), and then applying the various techniques mentioned above gave better results.The images, thus produced, were more sharp and had better contrast. This also facilitatedin comparatively easy distinguishing the settlements from their surroundings. The sameprocess was further extended to enhance the image of settlements. In this case, after havinga settlement identified on the image, a sub-scene covering the 'search area' (i.e., a rectangular area covering roughly three times the diameter of the settlement seen visually inthe first instance) for the settlement was carved out for further processing. This helped inbetter delineation of the 'settlement', i.e., in better operationalization of the concept of CBA.
The final FCCs, thus created, were saved in digital format for further use. Also, the FCCswere printed on an /ipPaintJet printer at a (print) scale of 1:250,000. This scale was chosento match the scale of topo-sheets of the Survey of India, for ease of comparison, updating,
74

identification and delineation of setUements on both the mediums. These hard copy FCCswere joined together to form a mosaic covering the entire study area.
4.7.2 Image Interpretation
Results obtained from digital image processing with supervised landuse classification ofmedium and low spatial resolution data are generally not encouraging for studies related tohuman settlements (P0II6, 1988; Subudhi1 et al., 1989; Paulsson, 1992). The spectralsignature of this theme (pixel) is a combination of the elements of asphalt, concrete, differentroof types, lawns, trees and bare soil (Charbonneau et al., 1993).
The application of the term CBA, on an image is based on mixed spectral signatures ofdistinct ground elements having specific physical properties. Visual image interpretation wascarried out mainly on the hard copy prints. Interpretation was carried for identification ofsettlements satisfying the criteria of CBA (see Appendix III for the operational definition),delimitation of the CBAs, predominant natural features (e.g., forests and rivers) andpredominant linear features (e.g., railway lines, road and canals). It was sometimes easierto interpret the image (visually) on the computer monitor rather than on the print. While itwas possible to broadly differentiate between the densely built and sparsely built areas withina settlement, it was not possible to put a dividing line between the two. Delineation of theCBAs was governed by the operational definition (see Appendix III). It was not possible todetermine the urban/ rural status of the settlement, nor the function of the settlement, basedonly on the image interpretation.
The various steps involved in processing the raw data into image processing andinterpretation have been summarized in Figure 4.2.
FCCs of the images taken in 1994 were compared with the images taken in 1991. While itwas possible to find appreciable changes (in the CBA) in some newly emerging settlements,most of the settlements did not show any significant change. On the contrary, a fewsettlements suggested even a reduction in the CBA, which is unlikely. Moreover, the overallquality of the images for 1991 (i.e., from IRS-1A) was found to be inferior than that of 1994(i.e., from IRS-IB). This could be one of the reasons for poor comparison between the twotime periods.
As mentioned earlier, two sub-scenes, for each time period, were also obtained at a resolution of 36.25m for parts of the study area. The improvement of this resolution inrelation to a resolution of 72.5m provided better images and the delineation of the CBAs, andits change over 1991-94, was significandy better. Use of this resolution data also enabled inprinting the FCCs at a scale of 1:50,000 - the scale next to 1:250,000 of the topo-sheets fromthe Survey of India. However, use of this resolution data was made only for samplesettlements due to constraints of processing time, storage facilities and the cost of obtainingraw data.
75

The Concept of•Continuously B u i l t - u p U N 1
o p e r a t i o n a lD e f i n i t i o n ,
•.-« oniagglomerat ion
c u r t i l a g ewi n i \p widthi d e a l l r e t l o ng e n e r a l i z a t i o n
I d e n t i f i c a t i o nof S a t t l a a i n t i i
De l inea t ion of'Cont inuouslyB u i l t - u p Areas '
Super •-irpoa It*,on ofTopo Sheot on the
for Locat ionI d e n t i f i c a t i o n ofS e t t l e m e n t s / P o t e n t i a lSet t lements
linageP T o c e a a l n g - I
Process ing RawData i n t oFa l se ColourComposites
M a r k i n g o n t h eImage• S e a r c h A r e a s ' f o r" C o n t i n u o u s l yB u i l t - u p A r e a s '
1r r
Image I n t e r p r e t a t i o n -- Ia\ego P r o c e s s i n g - I IImage I n t e r p r e t a t i o n^ e 1
Ia\ego P r o c e s s i n g - I I
Pre l iminary De l inea t ion ofSe t t l ements ) App l i ca t i on of'Continuously B u i l t - u p LmageArea* ' ; Rnhance*ientEx t r ac t i on of Linear ruesPeaturea
11 r
F i e l d Check forE x i s t i n g-ContinuouslyB u i l t - u p Areas ' 1 Proposed LargeScale Developments
Pina l D e l i n e a t i o n ofSe t t l emen t s ;•Continuously B u i l t - u pA r e a s ' ;Ex t rac t ion of LinearPeaturea
^v i a u a l ImageI n t e r p r e t a t i o nof EnhancedFa l se ColourComposite onHon!tor /Hard
F i e l d Check forE x i s t i n g-ContinuouslyB u i l t - u p Areas ' 1 Proposed LargeScale Developments
Pina l D e l i n e a t i o n ofSe t t l emen t s ;•Continuously B u i l t - u pA r e a s ' ;Ex t rac t ion of LinearPeaturea
v i a u a l ImageI n t e r p r e t a t i o nof EnhancedFa l se ColourComposite onHon!tor /Hard
Fig. 4.2
Flow Diagram for Image Processing and Interpretation of IRS Data for the Purposeof Identifying and Delineating the Continuously Built-up Areas
76
A sub-scene of the SPOT 10m Panchromatic image, obtained in 1987, was also available inhard copy format (see Figure 4.3). This sub-scene covered mainly the city of Delhi andsurrounding areas. However, it did not prove very useful except to reconfirm the conclusionsof an earlier study for monitoring the growth of urban settlements (Mahavir and Galema,1991).
Some of the results of final FCCs prepared by various techniques have been illustrated inFigures 4.4-4.7.
4.7.3 Field Check
A field check was conducted to verify the delineation of CBA for a few sample settlements.It was found difficult to validate the delineated CBAs because of the following reasons.
1. Images at a scale of 1:250,000 are too small for orientation in the field. Orientationwith the images at a scale of 1:50,000 was relatively easier, yet difficult to preciselylocate a given landmark on the image because of low (72.5m or 36.25m) resolution.
2. The distinction between the 'built-up' and 'not-built-up' is not so very easy even onthe ground in the absence of large scale updated maps or aerial photographs anddifficulty in comprehension when encountered with individual buildings or otherelements of the landscape (Poll6, 1993).
However, the limitation (1) worked like a solution for overcoming the limitation (2).The image provides an updated synoptic view and an 'pre-aggregated' comprehensionat the pixel level, thereby doing away with the necessity of dealing with individualelements of the built landscape.
3. The areas earmarked for large scale development but not yet developed were notpossible to be interpreted on satellite images. For this, there is no substitute for therespective master plans, regional plans and other official documents.
4.8 CONCLUSIONS
The need for data obtained through remote sensing techniques arises for a variety of reasons,important ones being the inadequacy and untimely availability of conventional sources ofdata. Also, remotely sensed data provides a synoptic view of human settlements, as wasimagined by Isard (1956) and Webber (1964).
The use of aerial remote sensing (photographs) for the purpose of the study area must bediscounted because of the attitude of some agencies involved, and the lack of adequatelytrained manpower required for their day-to-day handling and interpretation. High resolution(10m or better), stereo images obtained from satellites are also not feasible because ofrelatively high cost, huge data storing space and processing time constraints.
77

The remotely sensed data with spatial resolution of 72.5m is appropriate for the purpose ofthis task (e.g., modelling settiement patterns), providing a synoptic view of the entire regionunder study. Specifically, its comparatively low resolution performs the otherwise difficulttask of determining the 'built-up' pixel out of a mix of 64 pixels (of 10m resolutioncompared to ±80m) in reality.
Application of various image processing, enhancement and interpretation techniques revealedthat while the CBA of settiements could be delineated with reasonable accuracy (relative totheir use in the model proposed later, in Chapter Seven), this is not the case for delimitationof urban or rural boundaries. Indication of density (built-up/ non-built-up) patterns, structureand function of large settiements may be possible but useful conclusions are not possible atthis resolution (72.5m) under present technology.
Modelling settlement patterns involves use of data, information, concepts, theories andpolicies from a variety of sources and formats. Remote sensing covers only part of this.Means have to be found, still, to achieve desired objectives. One such mean is the use ofGISs, which is discussed in the following chapter.
78

ig. 4.3 SPOT Image of a part of Delhi, India, 1987PAN, Spatial Resolution 10m; Print Scale 1:50,000 (here reduced 75%)Courtesy: ITC, Division of Urban Planning and Management
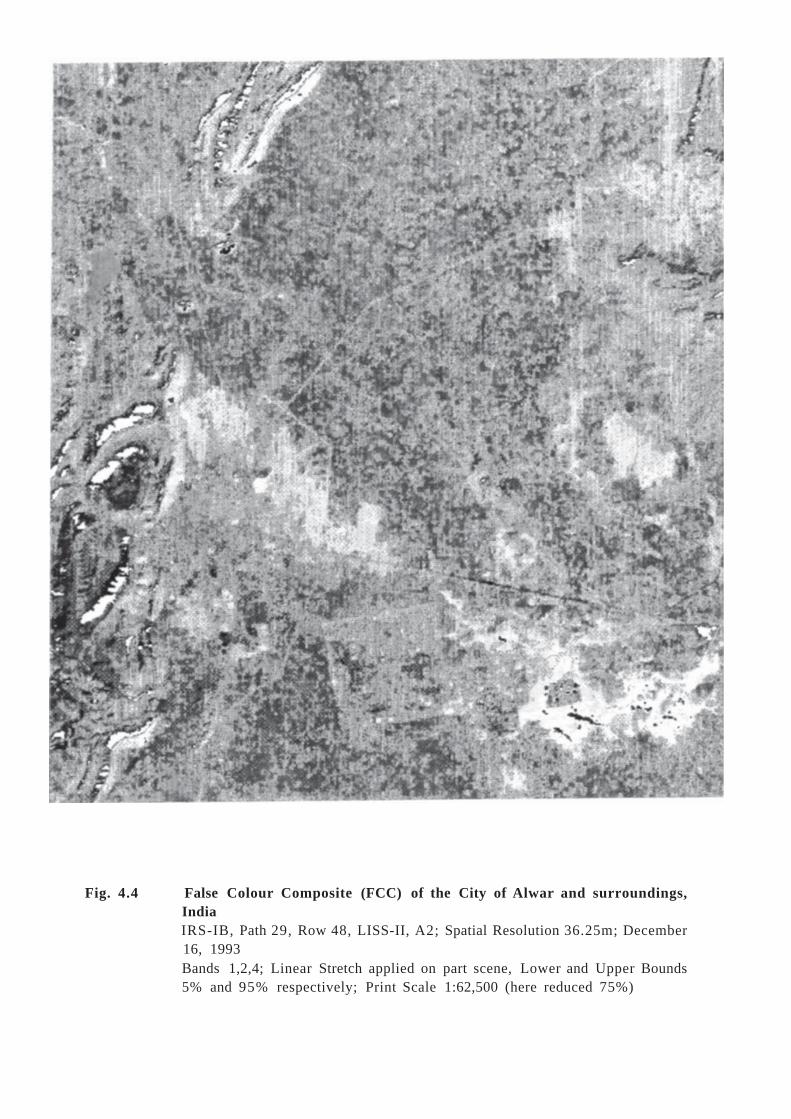
Fig. 4.4 False Colour Composite (FCC) of the City of Alwar and surroundings,IndiaIRS-IB, Path 29, Row 48, LISS-II, A2; Spatial Resolution 36.25m; December16, 1993Bands 1,2,4; Linear Stretch applied on part scene, Lower and Upper Bounds5% and 95% respectively; Print Scale 1:62,500 (here reduced 75%)

ig. 4.5 False Colour Composite (FCC) of the National Capital Territory of Delhiand surroundings, IndiaIRS-1B, Path 29, Row 47, LISS-I; Spatial Resolution 72.5m; January 7, 1994Bands 1,2,4; Linear Stretch applied on part scene, Lower and Upper Bounds5% and 95% respectively; Edge Enhancement Filter applied on part scene;Colorlut rrgggbbb;Print Scale 1:250,000 (here reduced 75%)

Fig. 4.6 False Colour Composite (FCC) of the National Capital Territory of Delhiand surroundings, IndiaIRS-1B, Path 29, Row 47, LISS-I; Spatial Resolution 72.5m; January 7, 1994Bands 1,2,4; Linear Stretch applied on part scene, Lower and Upper Bounds5% and 95% respectively; Standard ColorlutPrint Scale 1:250,000 (here reduced 75%)

Fig. 4.7 False Colour Composite (FCC) of part of the National Capital Region ofDelhi, IndiaIRS-1B, Path 29, Row 47, LISS-I; Spatial Resolution 72.5m; January 7, 1994Bands 1,2,4; Linear Stretch applied on full scene, Lower and Upper Bounds5% and 95% respectively; Standard ColorlutPrint Scale 1:825,000 (here reduced 75%)

5
MODELLING SETTLEMENT PATTERNSROLE OF GEOGRAPHIC INFORMATION SYSTEMS2
It was concluded in Chapter Four that remotely sensed data provides a synoptic view of thehuman settlements, and that remotely sensed data with spatial resolution of 72.5m isappropriate for the purpose of modelling settlement patterns. The concept of CBA, torepresent 'settlements', was found, in Chapter Two, to be useful and conveniently appliedon remotely sensed data.
Data, information, concepts, theories and policies from a variety of sources and formats arerequired for modelling settlement patterns. Means are required to be found to be able tocomplete the chain in a sufficiently (for the purpose) integrated manner so as to achievedesired objectives. Use of GISs, holds promise in this direction. Point Pattern Analysis andSpatial autocorrelation are two of the techniques that were identified, earlier, to be widelyused in modelling settlement patterns. Some of these techniques, now available in GISs for'point' based approach might be developed for an 'area' based approach being pursued in thisresearch. Further, the images obtained through remote sensing satellites are required to beprocessed and enhanced for obtaining useful information from them. Image processing andenhancement techniques also require the use of a GIS or a similar software.
An attempt has been made in this chapter to appraise the technology of GISs for a generalunderstanding, its application usefulness and limitations in the field of spatial planning, andmore specifically its usefulness and limitations towards modelling settlement patterns. As themodels developed is intended to be applied in a developing country (i.e., India) situation, a scenario describing the status of GISs in India has also been presented.
5.1 GEOGRAPHIC INFORMATION SYSTEMS
A system can be defined as a set of components that work together towards the overallobjective of the whole. It is a collection or combination of different elements or sub-systemsworking together towards achieving the same objective. Systems can be simple or complex,with relatively weak or stronger relationships between the elements.
Data are defined as measurements or observations of facts which, when processed,interpreted and organized, become information (Shelton and Estes, 1981). Thus, information
Parts of this chapter have been prepared joint ly with Al -Amir ( 1 9 9 6 ) .
7^
Gerritsen
Typewritten Text
Gerritsen
Typewritten Text
________________________________________________________________
Gerritsen
Typewritten Text
Gerritsen
Typewritten Text
21
Gerritsen
Typewritten Text
Gerritsen
Typewritten Text
79

is processed data, capable of enhancing the knowledge of the person receiving it. In practice,quite often the choice is between a package of information or no information at all (de Man,1989).
Theoretically, "An information system is a system for transmitting and receiving messages.It defines, formally and informally, and often by default, when and where messages are sent,who receives them and what makes them comprehensible." (Farbey, as quoted by Backhouseet al., 1991, p.23). Practically, it is a chain of operations starting from observation andcollection of data, to storage and analysis of data, to the use of derived information fordecision making. As is in the case of information, it is meaningless to try to design aninformation system without reference to the context in which it is going to be used, i.e., whowill use it, how it will be used and what it will be used for. Information systems implyinformation processing and the capacity to manipulate data in ways that are useful to theirusers (Cartwright, 1987). Such information systems can be manual or computer-based.Manual techniques can produce the same information as computer-aided techniques, and thesame general sequence of operations may occur (e.g., data storage and data manipulation)(Shelton and Estes, 1981; McHarg, 1995).
Data collection of world features dates back to the earliest times. These features have spatialand non-spatial descriptors. The most common medium of storing such coordinate-basedgeographical information has traditionally been paper (e.g., a map document). The use ofsuch geographical information by different users normally involves visual inspection of themap document and using simple measurement tools. The information stored on analoguemaps is not easy to be retrieved or updated. The advent of digital computer as a datahandling device also raises the question of its applicability to the storage and manipulationof spatial data.
Initial attempts to apply computer technology for the storing, displaying and retrieval ofspatial data concerned the reduction of data handling problems encountered with spatial data.The improvement of computer systems has made it easier to apply this technology to theproblem of storing, manipulating, and analyzing large amount of spatial data. This allowsdynamic and flexible handling of spatial information. Among the various systems used forthese activities, one is GIS.
"A geographic information system is a system for collecting, inputting, checking, processing,integrating, analyzing, modelling, and reporting information relating to a land surface."(Paulsson, 1992, p.58). It is a key technology for the automated capture, structure,management, analysis and presentation of location-referenced data all over the world (Ottens,1992). It also allows for visualization - the user-controlled display of information helpful toanimate, change perspective views, rotate, zoom in and out of the images on the screen(Fung and Lasserre, 1993). Visualization in itself is a unique contribution of GISs as a meansof understanding the process and arriving at conclusions. De Bruijn (1992) stated that the GISconcept comprises a database with a variety of spatial data, and suitable software to accessthe database and to perform logical, statistical and cartographic operations with the data.
In a nutshell, a GIS is a system to store, retrieve, manipulate, analyze, visualize and presentgeographical data. It is moulded from a blend of dataware, hardware, software, humanwareand orgware. These terms are described as follows.
Si)

1. A GIS database includes data about the position and attributes of geographical featuresthat have been coded as points, lines, polygons, pixels or gridcells (Burrough, 1993).Different data sets can be integrated into a central geographical data base that enablesthe linked manipulation of all the different spatial objects and their attributes.
2. Hardware is the physical component of a GIS (e.g., the computer, plotter, printer anddigitizer). There is a wide range of devices that can be used to fill the hardwarerequirements (Burrough, 1993).
3. Software is the general name of programs and programming language. In general,five basic modules exist in a software package, i.e., data input and verification, datastorage and database management, data output and presentation, and interaction withthe user (Burrough, 1993).
4. Humanware, i.e., the trained and motivated staff responsible for use, operation andmaintenance of GISs. It also requires its users to have awareness and understandingof the various components of the system.
5. Orgware, i.e., the computer technology which has been designed to fit into existingorganizational structure. Computer applications have to take place in the context ofexisting administrative and policy-making procedures. In this way, a better fitbetween the organization needs and the facilities offered by this technology can beachieved (Jong, 1990).
5.1.1 Users of GISs
Users of GISs can be classified in term of its applicability (e.g., business, public information,research, operations, management). Muller (1993) grouped the users according to the specifictasks that they have to perform (i.e., integration of spatial information, integration of expertknowledge and collaboration of a variety of scientific and professional disciplines). Withinthe field of spatial planning, Burrough (1993) identified users in categories according to thetask defined (e.g., a mapping agency), partly defined (e.g., central town and countryplanning organisations), or not defined (e.g., teaching and research institutions).
5.1.2 Information Types
The information or knowledge used in planning is of four different kinds (Harris, 1990).First, general knowledge which needs be collected usually once, updates are not so frequent.It includes standards, laws, rules, costs, knowledge of the behaviour of people, householdsand enterprises under various conditions. Maps are a part of this one-time knowledge. Thesecond type of knowledge is a description of the state of the system, with respect to all theattributes of the city or region which are relevant to judging the progress of plans andpredicting the effects of future changes and needs. The third type of knowledge consists ofthe scenarios about the future environment of planning and of the proposed changes whichwill be made by planned action. A fourth type of knowledge is the implicit structure whichis defined for relations and processes in the region by the planning system itself.
81

GISs must satisfy several criteria, including data reliability, periodicity, portability andflexibility (Michalak, 1993). The design of database requires to be worked out carefully atthe stage of system planning. Urban and regional-planners in particular require to have a good understanding of the principles and techniques of spatial database design. This enablesthem to play a more active role in the development of information systems that fulfil theirneeds more efficientiy (Yeung and Hall, 1989).
Information regarding the current data processing practices is also important (P0II6 andSliuzas, 1987). This and projection of future data requirements, can be obtained by a carefully planned user requirements study. Such an exercise involves visits and interviewsaiming at the collection of the following kinds of information: basic institutional organizationand responsibilities of information users; procedures and equipment used to carry out theresponsibilities; inventory and description of geographical information used or generated bythe users; existing resources and estimation of the potential for the use of the new technologyin the future (Yeung and Hall, 1989).
5.1.3 Geo-data Sources
Different users' requirements derive information from different geo-data sources. Thesesources are speech, texts, lists and tables, existing analogue maps, remotely sensed data(aerial photographs, satellite images) and field surveys. Geo-data sources for GISs includedigitized maps, photographs and satellite images, Global Positioning Systems (GPSs) andrelated tables. Data input covers all aspects of transforming spatial and non-spatial (texturalor feature attributes) information from both printing and digit files into GIS data base. Dataentry into GIS is made through digitizing, satellite images, scanning and the keyboard.
Spatial data bases are made increasingly more available through modem data-capturetechnology, including field computers and, possibly in the near future, digital cameras. Whatis increasingly seen today is an integration of GPSs, remotely sensed images (from aerialphotographs to satellite images) and GISs processing, providing 'seamless' views coveringlarge areas on work stations and PC platforms (Muller, 1993).
GISs have the capabilities of integrating variety of spatial scales and levels of resolutions ofgeo-data from different sources. Besides, GISs have the advantages of easy exchange ofinformation between different actors, as well as the continuous updating of such informationin the GIS environment.
5.2 ANALYTICAL PLANNING METHODS, MODELS, PROCESSES AND GISs
Different analytical planning methods and tools (primarily quantitative) are used by planners.However, they also attempt to devise policies which can influence development, so as tomove in a desired direction. In order to influence the development of the spatial system ina desired direction, major variations in the system can be analyzed and evaluated with thehelp of models (Krueckeberg, 1982). However, incorporation of such models into GISs isa difficult task because these models are mathematical abstractions and do not deal with thespatial dimension in an explicit manner (UNCRD, 1991).
82

It is essentia] to define the domain of interest with respect to planning and the nature of GISs.Batty (1991) raised concern for three sets of objectives: information systems, planningmodels, and the planning process. In fact, the sorts of functions which are required in urbanand spatial policy analysis are usually absent from the archetypal GISs whose functionalityembodying spatial analysis and modelling is weak (Newton et al., 1988, as quoted by Batty,1991). However, many GISs have emerged from areas of concern involving sub-systems ofthe urban and regional system.
Spatial planning activities, at all levels, are based on geo-data acquisition, manipulation andanalysis. The earth's surface data can be accessed, transformed and manipulated interactivelyin GISs, consequently they can provide the basis for studying and analyzing the end resultof planning decisions. Theoretically, by using GISs, planners and decision makers canexplore a range of possible scenarios and obtain an idea of the consequences (What-if?) ofa course of action before mistakes are made in reality. GIS software allows for the analysisof planning problems, model forecasts, monitoring and evaluating the effects of their policies(de Meyere, 1992). GISs have frequently been used in planning for a host of applications(e.g., urban and regional planning, resource inventory, resource management, land capabilityevaluation, inventory of housing, service facilities location and management, infrastructureplanning and Environmental Impact Assessment). More recent applications have been in thefields of fighting fires, assessing damages caused by naturally occurring disasters, identifyinghigh risk areas and the coordinating of reconstruction efforts. A GIS is, for the most part,used as a geographical, operations and legal tool (Muller, 1993).
Planning is a heavily politicized activity and GISs cannot be divorced from the socio-economic-political environment in which it is used for policy formulation, resource allocationand decision making. Yet, it is apparent that GISs are revolutionizing the traditional methodsof handling spatial data in planning. GISs confront well-established, politically favourable,non-automated procedures that are able to obfuscate the decision making process throughinefficiency and lack of documentation. In enforcing rigorous methods of evaluation, GISschallenge existing institutional organization and power structures (Harris and Elmes, 1993).Moreover, in the case of spatial data handling and GISs, the development of analytical andmodelling techniques is lagging behind developments in database design and handling (deMan, 1989).
5.2.1 Types and Functions of GISs
Batty (1993) considered a GIS as a system in which data has some spatial or geographicalreferent, this data being ordered according to this referent, and displayed by software in sucha way that spatial analysis is possible. This distinguishes GIS from computer mappingsoftware and other forms of geo-processing. However, despite the fact that a GIS must havesome functionality relating to analysis, many applications to date have emphasized their usefor elaborate computer mapping, storage, retrieval of spatial data rather than the analyticalpurposes for which they are ultimately intended.
Typical functions of a GIS involve the following operations on spatial data: topologicaloperation which transforms and generalizes two-dimensional spatial data, thus producingmaps at various levels of aggregation; analysis functions (e.g., characterizing neighbourhood,
83

measuring distance, map classification, cartographic modelling); overlay analysis whichcombines maps as layers and enable various visual, statistical and logical operations onresulting coverage; buffering and related spatial subdivision methods which identify areasconforming to various criteria; elementary statistical operations involved in describing,smoothing and developing methods of removing errors and bias in data.
In considering the comments by the various authors, it becomes apparent that there is not yeta well-developed classification of GISs in practice, and it is clear that single systems arebeing used in a fairly blunt manner for many different applications. One single GIS is notlikely to be applicable to all problems in the context of spatial planning. Different problemcontexts may require their own purpose-built (customized) systems. In a sense, this ishappening in the development of computer-based infrastructure in spatial planning, in thatthe most appropriate modules for the task in hand are assembled by planners and users.Consequently, the development of GISs by various vendors is beginning to take focus onmodular units that can be assembled to the requirements of the users.
5.3 CHOOSING A GIS
5.3.1 Data Structures
There are basically two types of data structures for storing spatial information in digitalformat: 'raster' and 'vector'. In the raster, the whole terrain is treated as a matrix of smallgrid squares (tessellation/ field approach), known as pixels. Each pixel is given a value basedon the type, quality or quantity of the information contained in it. The resolution and hencethe quality of the resulting image depend on the size of the pixels used: the smaller the pixel,the higher the resolution but the greater the volumes of data that must be stored.
The alternative to raster is vector, where the terrain is treated as consisting of features (objectapproach). Here a cursor is placed at the beginning, turning points and at the end of each lineallowing the coordinates of each point to be measured and recorded. The map is built up asa series of straight line sections between these coordinated points.
There is yet another storage method, named 'quadtree', which is a special type of raster datastructure. In this method, the data are stored in grid cells of variable size. Within largerhomogeneous area, a large cell size is used whereas towards the edges of the area, the cellsize diminishes to form a more precise picture. An area is therefore covered by considerablyfewer quadtree cells of varying size than is the case in the regular grid storage method. Thespeed with which analyses can be carried out with a quadtree structure is high, whilst theoriginal precision of the data is retained rather well (Scholten and Still well, 1990). However,there is a disadvantage in the sense that overlaying of different themes requires special careas the polygon sizes and shapes, and therefore the structure of quadtree in the differentlayers, will be different.
With both raster and vector data there is need to classify the features so that points, lines orpolygons can be given meaning with respect to typology of the area. The addition of a feature classification is the most expensive part of spatial data capture because, althoughsome development has taken place in automatic feature recognition, much of the required
84

work is still undertaken by human intervention. In consequence, the time and cost involvedin capturing both graphic and alphanumeric data is still high (Dale, 1991).
Both the vector and raster methods of representing the spatial extent of geographical entitiescould be incorporated in the same database. There exist methods for converting vector formatimages to raster and vice-versa, though the latter are much more complex and lesssatisfactory than the former (Burrough, 1993). There could be still a basic difference betweenstructured raster data and unstructured pixel data. Line segment structures (e.g., DIME andTIGER) are also available as a special type of vector data.
The advantages of vector data structures are that greater precision can be maintained, thatthe resulting graphic output can be of high quality, that the volumes of data held are smalland that linear network analysis is more straight forward. With raster data structures thevolumes of data to be held are much higher but conversely, since the scanning process isautomatic, the capture of raster data is much quicker. Raster data structures are relativelyeasy to handle by making the use of the computer, and are particularly useful where areasare to be analyzed by overlaying polygons on the graphic screen.
According to Maurel (1993), the question of choice between raster and vector data structuresmay now have been made irrelevant through technological change. Today, raster and vectorsystems are increasingly compatible, with most major systems capable of handling both. Yet,it is a fact that certain tasks can be done better in the one mode than in the other, eitherbecause the current state of the development of algorithms, because of hardware capabilities,or because of storage requirements. "The two modes should now be seen as complementaryin any GIS, but the accent on a dominantly vector-based approach or a dominantly raster-based approach should depend on the type of GIS application under consideration."(Burrough, 1993a, p. 169).
5.3.2 With or Without Image Processing ?
Remote sensing data usually have been interpreted visually or manually, converted tothematic map form, and then digitized for input into a GIS. Simultaneous to the developmentof GISs, digital image processing packages have also been developed for image restoration,enhancement, quality improvement, and a number of other statistical techniques forinformation extraction. Since most of the information extracted is ultimately used in a geographical context, and related to geographical information, it is logical to have a linkingof image processing with the GIS.
As a general rule, when the majority of geo-data for a GIS is being derived from a satelliteimage, it is easier to work with a system having both the image processing and GIS (in theraster method). However, if the major source of data is from conventional sources, a standard GIS without image processing (in the vector method) may suffice.
It is probably better to acquire a number of specialized modules that do a limited number oftasks well (e.g., vector mapping, raster overlay analysis, interpolation and image analysis)and link them together so that they make use of common data sources, than to attempt to finda single universal system that can do everything (Burrough, 1993). Also, the experience from
85

developing countries with information systems in general highlights the importance of takingan incremental approach to acquiring a system. Even the best designed systems are going tochange over time as the role and priorities of planners change - and as planners gainexperience with the system. It is more feasible to identify a specific need, and for aninformation system to meet that need, rather than to try to choose or design a system to meetall possible needs. The design of the system is important, both to meet identified needs ofusers, and to allow for modification as those needs change (Cartwright, 1987). There is a tendency to prefer a customized GIS for specific jobs instead of depending upon standardGIS.
It was argued in Chapter Two that the concept of the CBA is useful and conveniently appliedon remotely sensed data. It has fewer disadvantages than others for the purposes of thisresearch. It was also concluded in Chapter Four that the remotely sensed data with spatialresolution of 72.5m is appropriate for the purpose of modelling settlement patterns, providinga synoptic view of the entire region under study. Besides the concept of CBA, the use ofremotely sensed data in the form of satellite images, digital image processing, techniques of(spatial) pattern recognition and analysis are some of the essential elements identified earlierfor use in modelling settlement patterns. GISs, with digital image processing capabilities,offer the possibility of delineating the CBAs and performing some other tasks required formodelling (spatial) settlement patterns.
5.3.3 ILWIS
The Integrated Land and Water Information System (ILWIS) was chosen for use in thisresearch for its capabilities to integrate image processing and spatial analysis, tabulardatabases and conventional GIS features. Data acquisition from aerospace images forms anintegral part of the system, enabling effective monitoring. This feature is particularlyimportant in regions in which data are scarce or difficult to gather (ITC, 1993; see AppendixI for a brief introduction to ILWTS). Moreover, the system, developed and produced by theITC, Enschede, was comparatively more accessible, and better input was available for 'on-line' help. Further, it is backed by vast experience of users including students, teachers andresearchers at YTC.
5.4 INTEGRATING GISs AND R E M O T E SENSING
As described in Chapter Four, image resolution represents the ground area in terms of pixels,which are a function of the sensor, scene characteristics and data pre-processing. Dataobtained through satellite images differ from other geographic data in their consistency,positional accuracy, spatial and temporal resolution, and levels of human abstraction orinterpretation. To be able to process such data, GISs require raster capabilities to store andanalyze large volumes of these data with minimum loss of resolution or radiometricprecision. To make use of relevant map data (e.g., polygons, lines and points), GISs requirevector capabilities. Therefore, the integration of GISs with remote sensing requires multipledata structures, and software that supports a range of spatial queries (Davis and Simonett,1991).
86

Though both remote sensing and GISs involve manipulation of spatial data in digital form,remote sensing allows the measurement and examination of variation of surfaceelectromagnetic radiation whereas GISs, in principle, enable the organization and analysisof these measurements and attribute data to improve the mathematical and statisticalmodelling of the patterns and processes on the surface of the earth using either spectraland/or choropleth information (Michalak, 1993).
In practice, the integration of GISs and remote sensing is a product of the users' willingnessto adapt the use of the two technologies to the broadest possible application. The potentialof information systems and remote sensing is exercised when the synergism created by thetwo technologies can be used to provide data and analysis that were never before possible(Shelton and Estes, 1981). A truly applied GIS will require integration and automation of atleast some routine procedures in both approaches. One of the objectives of integration issimplification of the tasks of converting digital images and associated attribute data into a map through user interface and built-in expert rules, as is the case in the expert-systemapproach (Michalak, 1993). Satellite imagery represents a means of decreasing data-acquisition costs and delivery time and improving the frequency of updates. Besides manyother useful features, it offers the possibility of being integrated with GISs. Satellite imagerycan be used in GISs as a visual background, as a cartographic reference for the wholedatabase (especially when basic geographical data are poor or not accurate enough), as a document to update information already available in a GIS, and as a source of newgeographical information such as land uses and road networks (Maurel, 1993).
A fully integrated GIS would contain remote sensing systems designed to provide an efficientand effective flow of data to meet specific information system data requirements. Not onlywould the data in the system be used to develop interpretation and classification of remotesensing data but the resulting interpretation could efficiently flow through the system to someend decision. Conceptually, remote sensing is readily integrated into the structure of a GISas a component of data acquisition, or as a subsystem providing input to the informationsystem (or data processing subsystem). There could be systems which only utilize theproducts of remote sensing and those in which remote sensing operations are designed -integrated - into the entire information system (Shelton and Estes, 1981). At present,technical integration is limited to the provision of a common data exchange, and conversioncapabilities between remote sensing and GIS environments. Operational integration is mostlikely to involve three development steps: data exchange automation, transparent conversionof data structure, and integration of analytical procedures capable of processing data storedin various formats. An expert-system approach would require prior integration of raster-basedremote sensing images, vector-based GIS attribute information and rules of expert data(Michalak, 1993).
Incorporation of GISs in remote sensing also improves classificatory and change detectionaccuracies using the attributes derived from ancillary data sources. A significant limitationof using these approaches emanate from the limited quality of the data itself (Michalak,1993).
In short, remote sensing can provide information on current and changed land use cover fora GIS, and a GIS can provide an essential expert knowledge base to help automate thetechnically demanding aspects of remote sensing change detection analysis (Newkirk and
87
Wang, 1989). GISs data can be used to enhance standard image processing functions likegeometric correction, image classification and masking operations. Remotely sensed imagerycan be used for image-map backdrop and database update (Gugan, 1993). Although remotesensing is an important source of data for planning use (e.g., monitoring and mapping), itneeds to be linked to other data sets. What is needed is the best of both worlds: an integratedGIS that can store, manipulate and display both raster and vector data without losing thebenefits of either format (Hinton, 1994). Many users feel that the full potential of bothtechniques can not be achieved until they are integrated, and some go even further and seethe success of remote sensing firmly linked to its ability to service geographic informationsystems (Curran, 1985).
In considering the comments by Curran (1985) and others, it becomes evident that integrationof remote sensing and GISs would be mutually beneficial to both technologies. However,there are barriers. The terms used by each speciality have reflected some of them. While theremote sensing community speak of 'orbital paths', 'rows and columns', and 'pixels', GISsusers speak of 'map frames', 'data-bases', 'points', 'lines' and 'polygons'. There is anotherreason for the lack of integration between the two technologies. Remote sensing as a methodof data collection is unspecific in terms of what it collects. It records everything to which a sensor responds under given conditions. The result is an abundance of information whichneeds to be sorted out (Shelton and Estes, 1981).
Whereas, in a GIS, data can be fed selectively. Measurement and representation of land usechange, incompatibility of data formats, generalization and accuracy of digital informationare some other difficulties associated with the integration of the two techniques (Michalak,1993).
In spite of these barriers, the two technologies have been converging for the past few years.
Geo-visualization and digital orthophotos are two of the recendy developed concepts inrelation to the integration of GISs and remote sensing. Geo-visualization is a sub-disciplineof visualization associated with cartographic presentation and GISs. Since remote sensing isone of the significant data source into GISs, and the collection and updating of data is thelifeblood of GISs, geo-visualization can be a powerful tool for integration of GISs and remotesensing (Bin and Muller, 1993).
Airborne remote sensing, using high resolution film, provides the most detailed informationin the visible and near infrared wavelengths. It allows the user to prepare and select optimalconditions for data acquisition. After scanning, this data is ready for processing as any othercomparable remote sensing data set. High resolution scanning converts the photographicdocument in a digital raster file for digital orthophoto production. Coupling digitalorthophotodata with GISs offers new perspectives for automatic raster, line and DigitalElevation Model (DEM) information extraction, especially for softcopy purposes. Digitalorthophoto is not just a new GIS layer but a GIS partner. With this coupling, data coherenceis preserved at all stages (Loodts and Steenmans, 1993). Another example of integration ofGISs and (small format) aerial photography can be found in a mapping and analysis system,MASMAP (Bruijn and Ruotsalainen, 1987).
88

Based on successful research developments, SPOT Image announced the launch of the newGeospot product line dedicated to GIS (Maurel, 1993). A Geospot is a precision-processedsatellite image that looks like and can be used as a map and exactly matches a specified mapframe. It is in fact a map on a satellite-image underlay. Labels, place names and otherinformation may be attached. Three main products of the Geospot range launched areSPOTMap 2 2 , SPOTView Basic2 3 and SPOTView Plus2 4 .
The integration of the two technologies is dependent on realization that the potential of eachtechnology can not be achieved until they are integrated (Shelton and Estes, 1981). Thedangers and potentials of integration can be summarized as follows: "At its worst, IGIS(Integrated GIS) is a powerful technology that can be used to answer poorly posed questionsby running misspecified models on improperly extrapolated data to generate output whosevalidity can never be tested. At best, the coupling of satellite measurements with other spatialdata has tremendous potential for describing Earth surfaces, [and] predicting futureconditions..." (Davis et al., 1991, as quoted by Michalak, 1993, p.39, explanation of IGISadded).
Although remote sensing is an important source of data for planning use (e.g., monitoringand mapping), it needs to be linked to other data sets. Other significant developments withregard to the utilization of image in a digital format concern the establishment of GISs, forwhich satellite images with geometrical properties approaching orthophotography can serveas a digitized spatial data base. Satellite images serve a dual purpose in this case. They canconstitute the main geographical reference base by providing grid-like formatted planimetricdata suited for all map scales or substitutes. Further, they can serve as an additional sourceof thematic information (Voute, 1982).
For more than a century, science has been dominated by the concept of the microscope.Scientists have sought more and more detail about everything, and integration has sufferedthrough neglect. Now with the remote sensing and GISs, we have for the first time inhistory, a rudimentary 'macroscope' (Dobson, 1993).
A made-to-order analogica l - image map . It prec ise ly matches a standard map frame (at sca les from 1:25 ,000to 1 :250 ,000) and c o m e s comple te with annotations and auxil iary information for cartographic use . It isespec ia l ly ef fect ive w h e n basic geographical data are poor.
Des igned for easy loading into a GIS, available only in digital form.
Avai lable both in digital or analog form, S P O T V i e w Plus prec ise ly matches standard map frames. The datacan be loaded d i recdy into a GIS without special process ing or enhancement . It is intended primarily forGIS users , g iv ing them direct a c c e s s to SPOT but it can also be used for g iv ing a cartographic referencefor all other geographical information to guarantee the geometr ic coherence of the GIS, updating exist inggeographica l information in the GIS and extracting n e w information d irecdy from the image maps us ingGIS drawing functionalit ies.
Gerritsen
Typewritten Text
Gerritsen
Typewritten Text
Gerritsen
Typewritten Text
Gerritsen
Typewritten Text
_______________________________________________________________
Gerritsen
Typewritten Text
Gerritsen
Typewritten Text
22
Gerritsen
Typewritten Text
Gerritsen
Typewritten Text
23
Gerritsen
Typewritten Text
Gerritsen
Typewritten Text
24

5.5 DYNAMIC GISs
For many years, the focus of using a GIS was on the ability to answer 'what if questionsaccurately. It was a powerful but primarily static model, dynamism was introduced by theuser, manually. However, in many situations, the information stored in a GIS is changingvery quickly and these changes need to be factored into the system without delay. TraditionalGISs remain static, even though most geographical phenomena are dynamic. However,analysing and displaying dynamic events often requires a multi-step process relying on a number of batch processes and lengthy compilations. Another disadvantage of this approachis that the user must use a modular approach instead of just focusing on the final objective.
Dynamic GISs would skip these intermediate steps by processing the operations in a real-timefashion and by displaying the result of the operation automatically. The user would be ableto visualize the result without the necessary interaction between each step. The incorporationof changing factors, such as modified attribute values, would automatically change the resultwithout any user's intervention. It would offer an environment for automatic attributecomputations, based on spatial phenomena, while minimizing the need for user intervention.
As accurate decision making can be achieved only when the result of the analysis is visible,the display and symbolization of data become important factors. In a dynamic GIS, thissymbolization is performed automatically, through the use of expert knowledge. DynamicGISs do not require the user to decide when the data should be symbolized. Instead,symbolization becomes transparent to the user.
A traditional GIS does not explicitly include time as an element in spatial reference, the timedimension is generally omitted. Such omissions would be minimized in Dynamic GISs. Itwill, in principle, still answer 'what-if questions, however providing dynamic user-interaction, incorporating geo-mobility and change processes.
Dynamic GISs could be implemented in a number of ways, and the characteristics describedabove are but some of the features expected to be seen in the next generation of GISs.Dynamic GISs may be expected to behave much like a spreadsheet, in which most operationsand data structures are transparent to the user. As it would be more accessible thantraditional GISs, it would be more suitable to the casual user. The ability to obtain real-timeanalysis and faster answers would make it applicable to the modern needs of the GISs users(Albaredes, 1993). It would open the conventional static abstraction of a map to the virtualrealities possible through video presentations, and the realization of a viable archive forhistoric data (Fung and Lasserre, 1993). Updates could be performed regularly and outdatedinformation treated as a valuable resource, not as a waste product (Langran, 1993).
However, in spite of its promise, it is a new concept and useful applications are yet to beidentified. The latest developments in the areas of Object Oriented GISs, Feature OrientedGISs, Intelligent GISs and Expert Systems are also expected to bring changes in theapplication of GISs.
90
5.6 STATUS OF GISs IN INDIA
5.6.1 Availability of GISs
Software, for most GISs, is written and developed with the likely requirements of potentialusers in mind. However, what lacks in a majority of software that is internationally available,is flexibility in the use of data types - of varying periodicity, reliability and inconsistency,as is especially the case in most developing countries. Added to that, exorbitant costs (partlydue to import duties and involvement of foreign exchange) of the licensed copies make themunaffordable for most of the users in these countries. Yet, despite difficulties, manyorganisations and institutions in developing countries have managed somehow to start usingGISs.
Attempts have been made in India to make available indigenously designed and produced,affordable GIS packages. These range from the Desk Top Mapping package THEMAPS(together with DIGITIZ) to the more sophisticated ISROVISION, combined with its imageprocessing capabilities. However, some of these packages are duplications and overlap effortsbetween various government and semi-govemment departments. An overview of some ofthese packages is provided in Appendix V. Another package, named INGIS, has beendeveloped jointly by the Department of Space and the Department of Mines. This raster-based package has been developed around the VAX 11/780 workstation, with associatedPERICOLOR display monitor (Masthan et al, 1990).
Many large planning agencies (e.g., the Hyderabad Urban Development Authority, theBombay Metropolitan Region Development Authority and the central Town and CountryPlanning Organisation) have GIS packages, and have used them in a variety of applications.More agencies are in the process of acquiring GIS packages.
5.6.2 Personnel
In India, no formal introduction of GISs technology to planning graduates existed 10 yearsago. Only 3 out of 10 schools of planning in the country introduced it as a part of theircourses during the last 6-7 years. These schools now have GIS packages, sometimes as partof remote sensing laboratories.
Efforts have been made to create awareness amongst senior planners by organising seminarsand workshops - a landmark being one organised by the School of Planning and Architecture(SPA), New Delhi in 1985 (Saini, 1987). This workshop, co-sponsored by the ITC, theNetherlands; the Indian Institute of Remote Sensing (IIRS), Dehradun; the Town and CountryPlanning Organisation (TCPO) of the Ministry of Urban Development2 5 of the Governmentof India, and the Institute of Town Planners, India (IIPI), created awareness not onlyamongst the planning community but also amongst political and administrative decisionmakers responsible for the planned development of human settlements in India.
Since renamed as the Ministry of Urban Affairs and E m p l o y m e n t .
91
Gerritsen
Typewritten Text
Gerritsen
Typewritten Text
________________________________________________________________
Gerritsen
Typewritten Text
Gerritsen
Typewritten Text
25

In India, training with GISs for in-service spatial planners has been rather restricted. Aninstitution which has contributed significantiy is the IIRS. This training is a part of a 10months Post Graduate Diploma programme in the Human Settlements Analysis Group of theIIRS. Of late, there have been a number of 'crash training' programmes of 1-3 weeksduration organised by the SPA, theTCPO, the ITPI and the IIRS, either singularly or jointly.Another kind of training is being offered by the producers of various GIS packages - bothto sell their product and as part of sold packages, like the training being provided by theSystems Research Institute, Pune, for their Desk Top Mapping package THEM APS.
Appreciation courses, like the one proposed as part of the Urbwatch and Urbserve projects(YTC, 1993) could be specially useful for policy makers and technical personnel, especiallypersonnel from the local government and non-governmental organisations.
5.6.3 Working Environment
In the present day context, all GISs are using a PC or work station. Difficulties that arise indeveloping countries with GISs have little to do with the choice of hardware, as they oftenoccur at another level (e.g., the lack of reliable power supply). Load shedding or the planned(though at times unannounced) interruption of power pose a threat, not just of interruptingthe work of computers but of losing a large part of the work in progress. In addition, powerfailures can damage computer equipment. Uninterrupted Power Supply (UPS) equipment hasbegun to find its place along side basic computer hardware but it is not yet alwaysdependable.
Compatibility among different kinds of hardware equipment is problem. It is not uncommonto find one item in the chain of hardware equipment not compatible with the rest of thechain. Moreover, software vendors tend to patronize particular makes of hardwareequipment, instead of offering flexibility in the use of hardware options. However, theTHEMAPS package developed in India (see Appendix V), is an example of flexibility. Thisuser friendly package supports various kinds of digitizers, graphic cards, display monitorsand printers/ plotters that are available in the market.
5.6.4 Organisational Issues
Information systems can help to shape public administration. They can alter the roles ofindividual and change institutional responsibilities, they can affect the balance of bureaucraticpower. Accordingly, it is important to look beyond the technical aspects and to try to assessthe organizational implications of improved information flows (Cartwright, 1987). Thechallenge of GISs is not so much technical but more so in the organizational ability to utilizethe potential of GISs through management and planning. One difficulty faced by developingcountries may lie in the disparity in levels of development among national agencies.Sometimes, high technology is available in only a few departments, with no foreseeableintegration at the national level (Muller, 1993). The problem is both intra-organisation andinter-organisation.
92
In the case of the principal mapping organisation of the country, Survey of India, theorganisation introduced the concept of GISs and modern cartographic techniques in theirwork about a decade ago. However, about 80 percent of the organisation, however, is stilluntouched by this introduction (Misra, 1993). One reason is that the data collected fromvarious sources do not adhere to a standard format. The standardisation of data has not yetcrystallized. While the National Data Centre (NDC) of the NRSA has started supplyingremote sensing data (satellite images) on floppy disks, CCTs or cartridge tapes and theCensus of India has started supplying the demographic and socio-economic data on floppydisks, it is not yet possible to obtain mapping data on the same mediums.
5.6.5 Efforts of the TCPO
In the early '80s, the central TCPO of the then Ministry of Urban Development(subsequently renamed as the Ministry of Urban Affairs and Employment) was entrusted withthe responsibility of establishing an information system for human settlements planning inIndia (Kishore and Singh, 1987). Over the years, TCPO has developed, and is now in thefinal stages of development, 'prototype' information systems like the Urban and RegionalDocument Information System (URDIS); the Monitoring Information System (MONIS) forthe national programme of Integrated Development of Small and Medium Towns; theInformation System for the programme of Environmental Improvement of Urban Slums; theOrganization and Manpower Information System (OMIS) and the Land Use InformationSystem (LUIS). All of these form part of overall efforts in developing an Urban and RegionalPlanning Information System (URIS) in India.
The Space Application Centre (SAC), Ahemedabad and the TCPO recently concluded a collaborative pilot project (SAC-TCPO, 1992) on development of a GIS based data for thedistrict of Bharatpur in the province of Rajasthan. The exercise formed a part of the abovementioned Urban and Regional Planning Information System (URIS) and is one of the majornodes of a three-tiered National Natural Resource Management System (NNRMS). Thesetiers are at the strategic, tactical and technical levels. To test the potential efficacy of aninformation system, this exercise was taken up as a case study for development of a GIS andfor use as an automated system for the preparation of the Integrated District DevelopmentPlan for Bharatpur (Dhinwa et al, 1992).
This and other pilot studies reveal various application barriers (e.g., non-standard locationalencoding, non-standard data structuring and temporal resolution, varying classifications anddefinitions and invalidated data). The case of the information system for human settlements,as was initiated by the TCPO, highlights the importance of taking an incremental approachto design, an approach which also reflects the dynamics of the organization (Masser andCampbell, 1989).
A detailed account of other GISs application experiences in the field of spatial planning inIndia is available in Saini (1987) and in Photonirvachak. Journal of the Indian Society forRemote Sensing, Special Issue on Human Settlement Analysis, Vol.17, No.3, September,1989, Dehradun. No more recent comprehensive accounts are available to date.
93
5.7 OTHER APPLICATION POSSIBILITIES AND CONSTRAINTS
An international expert group concluded that GISs technology had great potential forsupporting, and being integrated into, the planning process in the developing world(UNCRD, 1991). GISs have the potential to play a major role in research and planning indeveloping countries. However, it should be recognized that the number of successful andlong-lived GISs applications remains remarkably limited. Despite the diversity of GISsapplications, three main constraints clearly imped the effective development of GISsapplications in developing countries. These constraints are related to finance, data availabilityand accessibility, and human resources and institutional issues (Teeffelen et al., 1991).
Ottens (1992) recommended that, in developing countries, priority should be given toapplications that have proven to be efficient and to entail low risks. He further stated thatcautious system planning, customized systems and implementation strategies andmethodologies are required in adopting an appropriate approach to the application of GISs.Developing countries can benefit from some experiences in the developed world, and fromnew hardware and software capabilities.
The constraints in the use of GISs (expertise and capital) faced by local organizations indeveloping countries make it necessary to take a closer look at the low-end GIS tools. Severalstandard PC based packages can be used in developing countries for prototype purposes inthe early phase of the introduction of larger systems (Meijer and Kuipers, 1992).
As in most of the technological advancements, there is a danger involved in too muchdependency on GISs also. For instance, at ITC, M.Sc. research studies in GISs related fieldsare focused around data manipulation, data structure and data management. There is tendencyto overlook the objectives of using a GIS. It may be useful to remind ourselves that the useof GISs, or any information system, is to derive useful knowledge from it.
"Where is the Life we have lost in living?Where is the wisdom we have lost in knowledge?Where is the knowledge we have lost in information?" (Eliot, 1935).Where is the information we have lost in data!
There is another danger. The use of GISs can actively stimulate the emergence of a data richbut theory poor environment (Openshaw, 1993).
5.8 CONCLUSIONS
GISs have the capabilities of dealing in an integrated manner with a host of data,information, concepts, theories and policies from a variety of sources and formats, so as tobe able to model settlement patterns. Within the possibilities and constraints identified in thechapter, GIS software ILWIS is selected for use in this research for its ability to handleimage processing, and because it has standard functions of a typical GIS both in vector andraster format.
94

However, a number of functions can still not be performed in a GIS and have to beperformed outside the GIS - or make use only of the statistical part of the GIS. As anexample, in the field of spatial planning, image interpretation can not yet be fully automatedand made part of a GIS.
Incorporation of various government policies and programs in a GIS is complex. It is not yetclear whether the strategy should be to incorporate GIS in a model, to incorporate a modeln a customized GIS, or to build a hierarchy of GISs using various models as buttresses andfilters between their use in real world planning processes (Batty, 1993).
The models for understanding, monitoring and describing; and for predicting andrecommending settlement patterns, as proposed later in this book, will be developed outsidehe GIS. However, GIS will be used, as a tool, in dealing with various parts of the models.
An effective account of the policies and programs of governmental agencies, which form anessential element of any model dealing with settlement patterns, can not be given unless theircontext is comprehended. The following chapter describes this context. It details the NCR,ndia, which provides the geographical basis for the development of the models referred to
above.
95
6NATIONAL CAPITAL REGION (NCR) OF DELHI, INDIAAN INTRODUCTION TO THE REGION AND IT's PLANNING
Delhi, the focus of the socio-economic and political life of India, a symbol of ancient valuesand present aspirations, is assuming increasing importance among the great cities of theworld. It has a distinct personality embedded in it, in the history of centuries (DDA, 1991).In its parts it has throbbing lanes of Shahjahanabad - the capital of Emperor Shahjahan, andthe grand vistas of New Delhi - the capital of British India, designed by Sir Edwin Lutyens.
Delhi's beginning can be traced back to the fierce war fought nearly 3,500 years ago,between estranged cousins, the Kauravas and Pandavas, for the city of Indraprastha, asrelated in the epic, the Mahabharaia (Goyel, 1993). Several other cities have been built andhoused from time to time at the present site of Delhi. Built not layer upon layer butcontiguously, these total up to seven, major cities. Some landmarks of these cities are stillvisible in the form of Old Fort, Qutab Minar, Siri Fort, Tughlaqabad, Kotla Ferozeshah andShahjahanabad, popularly known as Purani Dilli (Old Delhi).
6.1 DELHI - THE HISTORIC WALLED CITY
The city of Shahjahanabad was built in 1638 A.D. by Shahjahan who, incidentally, also builtthe world famous Taj Mahal. It is now a parallel and thriving city, with the magnificent JamaMasjid, the bustling markets of Chandni Chowk and the impressive Lai Quila, or Red Fort.This magnificent city was built with wide streets and paths. Apart from the main streets, theroads were narrow and labyrinthine. A wall having a circumference of about six kilometreswas built around it, which served both as a protection and city boundary (Figure 6.1). Thescale and speed of this endeavour were such that estimates of the population ofShahjahanabad by the year 1659 ranged from 150,000 to 500,000 (Noe, 1993). Yet, it hada human scale, and was well adapted to movement by foot and face-to-face social interaction(Nath, 1993). The city thrived until 1739 A.D. when Nadir Shah, the Emperor of Persia,wrecked the empire of then weak emperor, massacred thousands of local inhabitants andcarried away large amounts of gold, jewels and skilled craftsmen. SubsequenUy, Delhi setinto a rapid decline, Delhi territory was placed by the British (East India Company) underthe charge of a Resident and Chief Commissioner of Delhi, and the last Moghul ruler,Bahadur Shah Zafar, was exiled to Burma when the power was transferred from the EastIndia Company to the British Crown. The walled city was officially designated as a slum inthe first Master Plan of Delhi (Datta and Jha, 1984, as quoted by Noe, 1993; Nath, 1993),and subsequently declared as 'special area', together with Karol Bagh (DDA, 1990). Today,Shahjahanabad can be viewed as a city within a city (Saha, 1992). It now functions as a highly specialized component of the immense metropolis (Noe, 1993) and the region.
97

6.2 NEW DELHI - THE NATIONAL CAPITAL
For a major part of British rule, Calcutta, not Delhi, was the capital of India. At the historicDelhi durbar in 1911, King George V announced the decision of transferring the capital fromCalcutta to Delhi (Nath, 1993). Following this announcement a secretariat, now known asOld Secretariat, was built. It was also announced that an entirely new city would be built toserve as the capital of British India. A committee of architects, headed by Sir EdwinLutyens, was appointed to select a site and to plan the new capital. A site south ofShahjahanabad was chosen for the capital city, which was subsequently named as the ImperialCapital or New Delhi. This city was dominated by wide vistas, enormous buildings and largegardens. The Rashtrapati Bhawan with its Moghul Gardens, the India Gate, the North andSouth Blocks, Parliament House, Connaught Place, North and the South Avenues, Jan Pathand the Raj Path are some of the landmarks from this city. Connaught Place became NewDelhi's commercial centre, almost as busy as Shahjahanabad's Chandni Chowk. New Delhirailway station also possessed a counterpart in Old Delhi. The old and the new cities wereplaced side by side as two separate systems. The links between them were decidedly of anabstract nature (Figures 4.3 and 6.2). Between the old and New Delhi were created therailway station and a stretch of grassland (now known as Ramlila Maidan) - a clear line ofdemarcation between Indian and English (Nilsson, 1973).
New Delhi continued to grow through the war and soon turned into the nerve centre ofIndia's political life. When British rule ended with India's independence in 1947, New Delhicontinued to serve as the capital of the Republic of India. A general understanding of presentday use of the name 'Delhi' includes Shahjahanabad, the Imperial Capital, post-independencedevelopments and rural Delhi.
The crux of Delhi's post-independence growth lies in its rapid urbanisation and its ability tooffer wide opportunities for large scale employment through specialisation and increasedproductivity in manufacturing and supporting services (DDA, 1990). Till 1941, Delhi wasessentially an administrative centre with a population of 0.7 million. Partition of India, in1947, brought an influx of refugees, doubling its population to 1.44 million in 1951 (Nath,1993). Gradually, expansion of industry and trade and commerce began to transform itscharacter from an administrative city to a multi-functional city in 1981, when its populationsize became 5.7 million as against 4.6 million provided for in the Master Plan (DDA, 1990).Moreover, Delhi acts as a powerful job magnet at the national level. It draws job aspirantsparticularly from the neighbouring states (provinces). About 150 thousand people weremigrating into Delhi annually between 1971-81. The population of Delhi stood at 9.3 millionin 1991. Included in this is the population living in Delhi Urban Area (8.4 million), Alipur,Bawana, Bijwasan, Pehladpur Banger and Pooth Khurd - each identified as individual censustown within Delhi in 1991, and the rural areas (Map 7.1).
Moreover, various national and international economic forces have led to concentrations ofurbanization in the advantageously placed metropolitan cities, including Delhi2 6
(Gnaneshwar, 1995).
See Nath (1993) for an o v e r v i e w of planning for Delhi and the National Capital Reg ion .
98
Gerritsen
Typewritten Text
Gerritsen
Typewritten Text
_______________________________________________________________
Gerritsen
Typewritten Text
Gerritsen
Typewritten Text
26

Fig. 6.1 ShahjahanabadDelhi, IndiaSource: Breese, 1966, p.57
IndiaSource: Buch, 1987, p.48
99

6.3 DELHI - THE STATE
Until very recently, the administrative set up of Delhi was unique, administered as it wasthrough a multiplicity of authorities. It was governed vertically by the central governmentthrough an administrator designated as Lt. Governor. The implication of this provision wasthat unless otherwise provided by parliament, the President of India functioned as theexecutive head of Delhi and the Lt. Governor as his agent. Under this provision, theconstitutional status of Delhi was that of a Union Territory.
The Union Territory had a Metropolitan Council (of 56 elected and 5 nominated members)which had no legislative powers but was empowered to discuss and make recommendationsin respect of legislative and budget proposals, development schemes and other mattersreferred to it by the Lt. Governor. The Union Territory also had an Executive Council (of4 councillors appointed by the president of the Union) which was meant to deliberate andthus assist the Lt. Governor in the exercise of his functions in all matters except in respectof certain reserved subjects such as law and order, services, police, and land and buildings.The executive council was not directly responsible to the Metropolitan Council.
The office of the Lt. Governor was named as the Delhi Administration. The Union Territoryof Delhi had a number of local bodies also. The Municipal Corporation of Delhi (MCD),New Delhi Municipal Committee (NDMC) and Delhi Cantonment Board were the three keybodies for all municipal services. A number of services were also provided by variousinstitutions/ organisations which were not under the direct control of the Delhi Administration(e.g., the Delhi Development Authority (DDA), Delhi Transport Corporation, Delhi MilkScheme, Mother Dairy, Super Bazar and Delhi Urban Arts Commission). This systemremained in operation for about two and a half decades (Goyel, 1993).
The system, however, found itself always struggling between the two conflictingrequirements of satisfying the democratic aspirations of the citizens to govern themselves inaccordance with the spirit of the Constitution, and the need for sufficient control by thecentral government over the capital city and its administration. Out of the various options theGovernment had, the two prime options were to grant full-fledged statehood to Delhi and thecontinuance of Delhi as a Union territory.
The Government of National Capital Territory of Delhi Act, 1991, became effective onJanuary 2, 1992. As per the provisions of the act, Delhi did not become a state at par withother states of the country but gained a special status among the union territories. Delhi nowhas a 70-member legislative assembly and a seven-member council of ministers withrestricted powers. The Council of Ministers is headed by a Chief Minister who is appointedby the President (Goyel, 1993).
Subject to the provisions of the Constitution, the Legislative Assembly has powers like a statelegislature to make laws for the whole or any part of the National Capital Territory of Delhiwith respect to any of the matters in the State List or the Concurrent List of the Constitutionof India. The Act specifically provides that the Legislative Assembly will have no powersto legislate on matters relating to public order, police and land which all remain under thedirect control of the Central Government.
100

The act stipulates that the Union Territory shall be called the National Capital Territory(NCT) of Delhi2 7.
6.4 NATIONAL CAPITAL REGION
The genesis of the NCR of Delhi can be traced back to the Draft Master Plan of Delhi, 1959.Thereafter, the Master Plan of Delhi, 1962, recommended a larger region comprising ofseveral districts contiguous to Delhi to be planned as a composite unit.
Broadly, this Master Plan for Delhi (DDA, 1962) was a united regional, urban and ruralmaster plan. Seven 'ring towns' at an average distance of about 25 km from Delhi (viz.Loni, Ghaziabad, Faridabad, Ballabgarh, Gurgaon and Narela) were selected for prioritydevelopment within the metropolitan region (Map 7.1). These were called 'first tier ringtowns'. Their role was to absorb a portion of the population expected to join Delhi. TheMaster Plan also delineated 'second tier ring towns'. This zone of moderate influence ofDelhi was called the National Capital Region encompassing about 110 km radius from Delhi(Pandey, 1992). This plan also recommended that a statutory National Capital RegionPlanning Board should be set up for ensuring balanced and harmonised development of theregion.
Taking cognizance of these recommendations, the Government of India set up a high powerboard to co-ordinate the development of the National Capital Region within the frameworkof a comprehensive regional plan to be formulated by the board. The central TCPOfunctioned as the technical secretariat for drawing up a regional plan in collaboration withthe concerned State Governments. It also undertook to delineate the region based on variousindices2 8 under three broad categories, i.e., demographic characteristics of the region; inter-action between Delhi and the surrounding areas; and an efficient framework for urbanisationand the provision of infrastructure (TCPO, 1974). Administrative convenience and contiguitywere also considered while delineating the region.
Today, the NCR covers an area of 30,242 sq. km, lying between 27°18'N and 29°29'Nlatitudes and 76°09'E and 78°29'E longitudes (NCR Planning Board, 1988). The regionsurrounds and includes the NCT of Delhi. It also covers the parts of the states (provinces)of Haryana, Rajasthan and Uttar Pradesh (Figure 6.3 and Table 6.1).
'De lh i ' , in the rest of this dissertation, refers to the National Capital Territory ( N C T ) of De lh i , unless
otherwise specif ied.
These indices were the population growth rate; migration; density of population; e c o n o m i c activity; supplyz o n e s of mi lk , vegetables and fruits; communicat ion; physiography; and passenger traffic by rail and buses( T C P O , 1 9 7 4 , p . 14).
101
Gerritsen
Typewritten Text
Gerritsen
Typewritten Text
_______________________________________________________________
Gerritsen
Typewritten Text
Gerritsen
Typewritten Text
27
Gerritsen
Typewritten Text
Gerritsen
Typewritten Text
28

, UTTAR PRADESH-A-BULAOSkiAHR ANUPSHAHP
\ \
( B A H R O R ' \ MANDAWAR
1 ' 1
.' 'RAMGAI^R-^ A L A V A R J*
r a j a s t h a t n j y
3
NCR B O U N D A R YS T A T E B O U N D A R YDISTRICT B O U N D A R YT E H S I L B O U N D A R Y
3 0 K M
Fig. 6.3
102
National Capital Region of DelhiIndiaSource: NCR Planning Board, 1988

Table 6.1 POPULATION DISTRIBUTION OF THE NCR OF DELHI, 1991
C o n s t i t u e n t A r e a(sq. k m )
P e r c e n t a g e o f P o p u l a t i o no f the N C R (1991)
Dens i ty o fP o p u l a t i o n( p . p . s q . k m )
N C T o f Delhi 1,483 35 ( 9 . 3 mil l ion) 6 , 3 5 1Haryana 1 3 , 4 1 3 25 (6 .6 mil l ion) 4 9 5Raj as than 4 , 4 9 3 6 (1 .6 mil l ion) 352
Uttar Pradesh 10 ,853 34 (8 .9 mil l ion) B07
N C R o f Delhi 3 0 , 2 4 2 100 ( 2 6 . 4 mil l ion) 573
Source : Break-up of population for 1991 from S P A , 1994 , p . 15.Area f r o m N C R Planning Board , 1988 , p . l .
It is the biggest and generally accepted to be the best-defined metro region in India (Ribeiro,1993). The region accommodated a population of more than 26 million people in 1991,spread over about 100 towns and cities and 6,700 villages. The urban component is about52% of the total population. Density of population of the region was close to 873 personsper sq. km., against an all India average of 240 in the year 1991. Of the four constituents,National Capital Territory of Delhi has the highest concentration of about 6,350 persons persq. km., with about 9.3 million people in 1991.
6.5 THE FIRST PLAN
The basic concept of the first plan, prepared under the technical secretariat of the Town andCountry Planning Organisation (TCPO, 1974), was the progressive deconcentration ofpopulation and economic activities that had developed in the Delhi Urban Area during theprevious three decades and their dispersal to the various parts of the National Capital Regionin a manner that would satisfy the demands of the population and the economic activities and,at the same time, achieve a balanced growth in the entire region.
This plan projected that Delhi, as the National Capital, would continue to attract populationand activities (e.g., related to industry, commerce and culture). The plan recognised that itwould not be possible for Delhi to grow interminably, both on account of the limitation inproviding the necessary basic infrastructure as well as the complex physical, socio-economicand political problems that would result from concentration of the large magnitude ofpopulation and its activities. At the same time, it was recognised that not only Delhi but itsentire hinterland should benefit from development. The plan, therefore, provided for a slowrate of growth of Delhi and a simultaneous rapid growth of other urban areas within theregion.
103

6.5.1 Development Strategy
A two-pronged development strategy was envisaged. Firstly, there had to be somedisincentives, which would direct the industrial and commercial activities to seek locationsnear and not within Delhi, both for expansions and for new establishments. Secondly, theregional towns in the NCR were to be made sufficiently attractive for industry, trade,government offices, etc. This development of regional towns was envisaged not as dormitorytowns but as self-contained, liveable urban centres equipped with an acceptable level ofeducational, health and recreational facilities, including good housing at reasonable costs.
The pre-requisites, necessary for the strategy to be put into effect were identified andgrouped under the following heads (Qaiyum, 1982; NCR Planning Board, 1987):
i. development of an adequate physical and economic infrastructure base at the regionallevel so as to make possible the dispersal of economic activities and population to theregion;
ii. the provision of an acceptable level of services, amenities and facilities for growthof activities in various urban centres within the NCR, as quickly as possible so as tomake them receptive to the activities flowing into them from Delhi or from outsidethe region; and
iii. policies and programmes in Delhi territory that will discourage excessive growth andconcentration and also promote shifting of the non-conforming activities from Delhiinto the regional centres.
The Plan favoured a 'radial corridor pattern' and a 'multi-town pattern' on the grounds ofsocial, economic and technological considerations (TCPO, 1974, pp.29-30).
6.5.2 A Non-Starter
Due to various political and administrative reasons, the first plan never obtained statutorystatus, and in the meanwhile Delhi and the region continued to grow with profound changesin the land use, ecology and economy of the areas. There were no legal provisions to bindvarious state governments to abide by the plan, or to enforce various policies of the planconcerned with the private sector. This recommendatory plan remained a non-starter alsobecause of differences in legislation, land policies and taxation and lack of inter-governmentalresponses, with inner-city and ring town lands being favoured locations for employmentgenerating activities, even to the extent where new urban growth emerged in this inner belt(Ribeiro, 1993).
A statutory board could not be constituted due to opposition to it of the state governmentsof Uttar Pradesh and Haryana, which were afraid that it would interfere with their powersof planning and development in their areas included within the region. The governments ofthe two states encouraged and supported the expansion by providing liberal incentives forlocation of industries and other economic activities in them. The incentives and investmentswere concentrated in satellite towns like Ghaziabad, Loni and the New Okhla Industrial
104

Development Area (NOIDA) in Uttar Pradesh; and Faridabad, Rallabgarh and Gurgaon inHaryana, which have been developed as residential-cum-industrial centres (Nath, 1993; Map7.1). As an example, the development of Greater NOIDA has been in gross violation of theobjectives of the NCR (SPA, 1994, p.50). NOIDA too, as per the approved NCR Plan, isto have not more than that of 0.7 million population by the year 2001 and yet, the plan beingprepared for the city is for about twice that population. Something similar is happening withother ring towns too (Ribeiro, 1993). These developments, though they sometimescorrespond to the NCR Plan proposals, were primarily dictated towards the respective citymaster plans (and state level regional plans, where available). Some of these developmentsare also rooted in the centrally sponsored scheme for Integrated Development of Small andMedium Towns (IDSMT), initiated for encouraging planned development of less populatedtowns (Government of India, 1977).
However, the Delhi government took little or no action to slow down new major employmentactivities. In fact, in partnership with several economic ministries, employment generatingand foreign exchange earning activities were encouraged in Delhi (Ribeiro, 1993).
Table 6.2 indicates that the overall urban population of the region, in 1981, was less than theone proposed in the first plan. Similarly, the population of Delhi Urban also did not deviatevery much from the proposal. However, most of other urban centres were far behind theirassigned population figures. The urban population that remained unaccounted for is the onein new towns like NOIDA, which were never planned for in the first plan.
Table 6.2 PLANNED VERSUS REAL URBAN DEVELOPMENT IN THE NCR, 1981
Urban Centre/ Population (million persons) % AchievementUnit Proposed* Reality**
for 1981 in 1981
Delhi Urban 5 . 3 0 5 . 7 2 108%
Faridabad 0 . 3 5 0 . 3 3 9 4 %Alwar 0 . 1 5 0 . 1 4 9 3 %Rohtak 0 . 2 0 0 . 1 6 80%Ghaziabad 0 . 4 0 0 . 2 8 7 0 %Meerut 0 . 8 0 0 .53 6 6 %Panipat 0 . 2 0 0 .13 6 5 %Modinagar 0 . 1 5 0 . 0 8 5 3 %Sonipat 0 . 2 0 0 . 1 0 5 0 %
N C R Urban 9 . 3 0 9 . 1 0 9 8 %
Total N C R 2 1 . 1 0 19 .19 9 1 %
Source : * T C P O , 1974 .
** NCR Planning Board , 1988 .
105

6.6 THE SECOND PLAN
The enactment of the National Capital Region Planning Board Act, 1985; the setting up ofthe National Capital Region Planning Board in 1985; and the consequent preparation andapproval of the Regional Plan 2001 in 1988 (effective as on January 23, 1989) marked thebeginning of a new phase in planned development of the region. The Regional Plan 2001 (infact the 'first statutory' plan for the NCR) suggested policies and measures which would helpin achieving the objective of the planned development of Delhi in its regional context aimingto:
" - relieve the Capital city from additional pressures,- avoid adding new pressures on to the Capital and- remodel the pattern of settlements in the National Capital Region to enable them to play
their assigned role." (NCR Planning Board, 1988, p.ix).
6.6.1 Policies and Strategies
The Regional Plan 2001 contains broad policy framework, strategies and guidelines fordevelopment of the region together with broad land uses at the regional scale. The plan hasprovisions for the preparation of functional (action) plans for various sectors of development.These plans will suggest measures:
i. to contain the population of Delhi through decelerated growth;
ii. to achieve moderate growth of Delhi Metropolitan Area excluding Delhi;
iii. to include growth in the towns/ complexes identified for priority development byenhancing the momentum of economic expansion and technological development and,also adopting effective promotional measures to create employment opportunities toattract the Delhi bound potential migrants and, creating a physically efficient patternand socially desirable environment with effective participation of the (constituent)States, that will sustain dynamic growth in keeping with objectives and goals of theRegional Plan 2001; and
iv. for action to expand and to effect qualitative and quantitative improvement in physicaland social infrastructure in towns identified for priority development.
The plan also envisages the sub-regional plans indicating:
i. reservation of areas for specific land uses which are of regional or sub-regionalimportance;
ii. future urban and major rural settlements indicating their areas, projected population,predominant economic functions, approximate site and locations;
iii. road network connecting sub-regional centres, service centres and basic villages;
106

iv. proposals for the coordination of traffic and transportation, including terminalfacilities;
v. priority areas at sub-regional level for which immediate plans are necessary;
vi. proposals for the supply of drinking water and sanitation and drainage; and
vii. any other matter which is necessary for the development of the sub-regions.
However, the preparation of sub-regional plans by the respective state governments couldstart very late in the planning process. All the sub-regional plans were approved by theirrespective authorities in or after 1994 (see Deptt. of T&CP, Govt, of Haryana, undated;Rajasthan, 1992; Uttar Pradesh, undated; and DDA, 1994). These plans vary in the levelsof detailing corresponding to the planning culture prevalent in each of the departments oftown and country planning of the various states.
The regional plan envisages development of economic activities over a wider area in thetowns/ complexes that are identified for this purpose. These priority towns need to beplanned as self-contained units and action taken for their coordinated and synchroniseddevelopment. In view of greater concentration of population in the capital, the need for flowof migrants to be re-directed to priority towns is greater. This requires well identifiedprojects to gradually increase the migration share to the priority towns by improving theireconomic base. For effectuation of such a programme of projects, the institutional frameworkboth at the State and local levels needs to be strengthened and action taken to improve theresource mobilisation at the local level (NCR Planning Board, 1988).
6.6.2 Policy Zones
The plan divides the region into three policy zones for effective application of the policiesand implementation of proposals with a view to achieve a manageable Delhi and anharmoniously developed region. These policy zones are termed as Delhi Union Territory(since redesignated as National Capital Territory of Delhi); Delhi Metropolitan Area(excluding Delhi); and beyond Delhi Metropolitan Area (Rest of the NCR; Figure 6.4).
National Capital Territory (NCT) of Delhi
Earlier known as Union Territory of Delhi, it covers a total area of about 1,500 sq.km., ofwhich about 40% is urbanised. The urban area is spread over 6 towns, including Delhi UrbanAgglomeration. The rural area comprises over 200 villages.
Delhi Metropolitan Area
Delhi Metropolitan Area (DMA) excluding Delhi, comprises the controlled areas of thecontiguous towns of Ghaziabad including Loni and NOIDA in the province of Uttar Pradesh;and the Faridabad-Ballabgarh Complex, Gurgaon, Bahadurgarh, Kundli and the extension ofDelhi ridge in Haryana. This area also includes about 450 villages. The total area of DMA(excluding Delhi) is about 1,700 sq.km.
107

Fig. 6.4 Policy Zones of the National Capital Region of Delhi(after Nagpaul)Source: Nagpaul, 1988, p.206
Fig. 6.5 Counter-magnets to the National Capital Region of DelhiSource: NCR Planning Board. 1988
108

Rest of the NCR
Rest of the NCR, i.e., beyond the DMA, comprises an area of about 27,000 sq. km. Itcontains 83 towns and some 6,050 villages.
Counter-magnets
Besides above mentioned areas, the NCR Plan has also identified2 9 five 'counter-magnet'towns for development, located outside the NCR (Figure 6.5). These towns viz. Hissar inHaryana, Gwalior in Madhya Pradesh, Patiala in Punjab, Kota in Rajasthan and Bareilly inUttar Pradesh are expected to maintain a certain amount of complementarity in respect tometropolitan functions with Delhi and the region. A range of 250-300 km from the NCRboundary or about 350-400 km from Delhi, representing 6 hours journey time by road, fromDelhi, should enable interaction between chosen counter-magnet and the metropolitan corewithout impairing its development autonomy and functional identity as a regional growthcentre. The plan expects that these towns will act as future interceptors of migratory flow toNCR, and will play the role as regional growth centres in the regions of their setting.
6.6.3 Sectoral Policies
The Regional Plan 2001 envisages detailed sectoral policies regarding the matters ofpopulation, settlement systems, land use, transportation, telecommunication, industriallocation, trade and commerce, office location and improvement of environment. Thesepolicies have been summarized in Appendix VI. These policies are envisaged to create a newdevelopment momentum in the regional urban centres as a result of which their populationis bound to increase manifold in the decades to come. The spread-effects of such massivedevelopment programme are difficult to visualise. A series of studies (e.g., SPA, 1994) havebeen initiated by the NCR Planning Board to review the policies and priorities as part of mid-term assessment.
6.7 DEVELOPMENT DYNAMICS
6.7.1 Population
The first plan for the region projected and proposed a population of 21.1 million in theregion for the year 1981 (TCPO, 1974, p.32, p.68). However, the actual population of theregion, in 1981, was only 19.1 million (NCR Planning Board, 1988, p. 138). The Regional
These counter-magnets were recommended by the consultants to the Regional Plan 2 0 0 1 . H o w e v e r , thecounter-magnets were to be finally identified by the N C R Planning Board in consultation with the concernedstate g o v e r nm e nts (NCR Planning Board, 1988 , p . 124) .
Extens ive use of the Census of India, 1991 and S P A , 1994 has been made whi le compi l ing various f igures
for this part.
109
Gerritsen
Typewritten Text
Gerritsen
Typewritten Text
_______________________________________________________________
Gerritsen
Typewritten Text
Gerritsen
Typewritten Text
29
Gerritsen
Typewritten Text
Gerritsen
Typewritten Text
30
Plan 2001 projected a population of 25.4 million people in the year 1991, which rose to 26.4million (SPA, 1994).
Almost 52 per cent of this population lived in urban areas indicating a high rate ofurbanisation compared to the rest of India (26 per cent) and other urban regions. 35 per centof the total population of the NCR resides in Delhi, whereas 34 per cent resides in UttarPradesh, 25 per cent in Haryana and 6 per cent in Rajasthan. The distribution of populationshowed only a marginal variation between 1981 and 1991. The share of Delhi showed anupward trend by 4 per cent while Uttar Pradesh showed an upward trend of 3 per cent (SPA,1994).
Out of the total population of the region, 73 percent live in the DMA towns including Delhi,15 percent in priority towns and 12 percent in the sub-regional centres and other urbancentres. Within the DMA, Delhi has the highest urban population (85 per cent) followed byFaridabad and Ghaziabad (about 6 per cent each). Amongst the priority towns, Meerut is themost populated urban centre accommodating 43 per cent of the population living in priority-towns, followed by Rohtak, Alwar and Panipat (about 10 per cent each).
The rate of growth of population between 1981-91 was 65 per cent for the DMA towns whileit was 46 per cent for priority towns. Within the DMA, Loni and NOIDA showed highestgrowth rates (256 per cent and 249 per cent) followed by Ghaziabad (93 per cent), Faridabad(87 per cent) and Delhi (61 percent). Amongst the priority towns, Meerut has highest growthrate of population (58 per cent) followed by Rewari (46 per cent), Alwar (44 per cent) andHapur (42 per cent). Bhiwadi registered the highest rate of growth of population (784 percent) between 1981-91. 14 human settlements were classified as urban in 1991, whereas twowere declassified from urban to non-urban. An overview of all the towns in the region isprovided in Appendix VII and Map 7.2.
Apart from the towns, the NCR has more than 6,500 villages. These are predominantlymedium sized with populations between 500 and 2,000 persons, constituting more than 55per cent of the total villages. 20 per cent of the villages have population between 2,000 and5,000 persons. Less than 5 per cent of the villages had population more than 5,000 persons.
Though no detailed studies are available to indicate the level of in-migration to the region asa whole, Delhi takes the major burden including migration from within the region. 57 percent of the total population increase in Delhi, in the decade 1971-81, was due to immigration(NCR Planning Board, 1988, p. 137). The major reason for migration has been theemployment, followed by family movement (NCR Planning Board, 1987, p. 16).
6.7.2 Literacy
52 per cent of the total population of the region is literate. Literacy rate is highest in theNCT of Delhi (62%) followed by Haryana (48%), Uttar Pradesh (40%) and Rajasthan (36%)sub-regions.
110

6.7.3 Employment
The workforce participation rate in the region, in 1991, was 30 per cent, both for the urbanand rural population. 34 percent of the total workforce is engaged in the primary sector.While in the urban areas 68 percent of the workforce is engaged in tertiary sector activities,only 25 percent of the workforce in rural areas in engaged in the same.
Among the sub-regions, participation rate varies from 34 per cent in the NCT of Delhi to 28per cent in Uttar Pradesh. Delhi has a very low (3 per cent) proportion of workers in theprimary sector. Other sub-regions have considerably larger proportions of their workingpopulation engaged in primary sector - Haryana 52 per cent, Uttar Pradesh 54 per cent andRajasthan 68 per cent.
6.7.4 Industry
The region had over 900 large and medium scale industrial units, spread in the sub-regionsof Haryana (38 per cent), Uttar Pradesh (35 per cent), NCT of Delhi (19 per cent) andRajasthan (8 per cent). The region also has over 100,000 small scale industrial units, a largeproportion of them in the urban areas. In the NCT of Delhi, 95 per cent of the small scaleunits were in the urban area. Corresponding figures for Uttar Pradesh, Rajasthan andHaryana sub-regions stood at 85 per cent, 76 per cent and 60 per cent respectively (SPA,1994).
6.7.5 Traffic and Transportation
The National Capital Region of Delhi is served by road-based and rail-based transportationsystems. The only located airport in the region serves as a major port both for internationaland national travel beyond the region. The road network comprises of nine major corridorstogether with seven orbitals providing linkages with the various urban centres within andbeyond the region. Similarly, the rail network comprises of eight corridors with a mix ofbroad and meter gauge railway lines.
Roads and railways carry the gross annual freight traffic to and from Delhi in a proportionof 80:20 (SPA, 1994). Similarly, the total daily passenger movement in the region is in theproportion of 44:32:24 by private vehicles, public vehicles and rails respectively (NCRPlanning Board, 1988).
Delhi has about 22 million motor vehicles. About 390 new vehicles were being registeredevery day during the years 1991-92. These vehicles emit about 872 tonnes of vehicularpollutant daily, contributing more than 60 per cent of the total air pollution levels in Delhi(SPA, 1994).
I l l

6.8 TOWN PROFILE
Towns in the region vary in nature and extent. Other than the city of Delhi, the towns rangefrom a population size of less than 4,000 to close to a million people. They also range fromhistorical towns to new industrial estates in the process of development.
The general level of the environment in these towns is very low. In a study (SPA, 1994)conducted on DMA and priority towns, 10 out of 18 towns were considered to beenvironmentally critical, based upon 28 parameters. 6 out of 18 towns were consideredpartially critical, whereas only 2 towns were considered not critical. Towns identified ascritical werePanipat, Palwal, Gurgaon, Faridabad-Ballabgarh, Bahadurgarh, Meerut, Hapur,Ghaziabad, Bulandshahr and Bhiwadi. Towns identified as partially critical were Rohtak,Rewari, Kundli, Khurja, Loni and Alwar. Dharuhera and NOIDA were identified as notcritical.
A brief profile of some of the towns (arranged alphabetically, compiled from varioussources3 1) is provided in the following sections to have an overview. These towns have beenselected to cover a representation based upon the variety in their population size, functionaland environmental characteristics and location in the region. Some of these towns also servedas case studies during the field work phase of the research.
6.8.1 Bahadurgarh (Haryana)
Designated as a DMA town, this class III town (population 57,235 persons in 1991) lies inthe immediate vicinity of Delhi. The town is generally functioning as a trade and commercecentre. It is known as a centre of local trade in millet, gram, salt and wheat. The majorityof shops are dealing in sanitary, hardware and building materials. It has an extensive areafor industries. The informal commercial sector is proportionately less than other NCR towns.Inner city roads are subject to congestion and traffic delays, due to lack of parking facilities.Domestic and commercial waste is dumped on the roadside, creating unhealthy conditions.Unorganised sewage and waste disposal is a major environmental concern. Water logged lowlying areas are a source of concern.
6.8.2 Bhiwadi-Dharuhera-Rewari Complex (Rajasthan/ Haryana)
This industrial complex comprises of three towns: Bhiwadi from Rajasthan and Dharuheraand Rewari from Haryana (population 15,285; 10,848; and 75,342 persons respectively, in1991). Out of the three, Rewari is comparatively old and is known for glue, copper and brassutensils, handicrafts, hand loom and fibre products. Except for parts of Rewari, thiscomplex, planned primarily for heavy and medium industries, could be termed as a newtown. The towns have industrial and commercial activities along the highways. A distinctbuffer on either side of the highways adds to the vegetative cover of the area. However, thepresence of open spaces is inadequate. Though the parking is generally on the street, traffic
3 1 N C R Planning Board , 1988; Sharma, 1972; and S P A , 1994.
112
Gerritsen
Typewritten Text
Gerritsen
Typewritten Text
________________________________________________________________
Gerritsen
Typewritten Text
Gerritsen
Typewritten Text
31
congestion is, as yet, not as serious a problem as in other towns of the region. Considerableinrormal commercial activity has also established in the area. Low lying pockets ofresidential areas are often water logged. The complex is partially sewered, with partiallyopen drains. Major polluting industries have their own treatment plants, though the capacityis generally less than the discharge they generate.
The paper mills in Dharuhera emit untreated liquid and gaseous wastes, which has damagedagricultural crops as well as trees in the area.
6.8.3 Bulandshahr (Uttar Pradesh)
A class I city, Bulandshahr (population 127,201 persons in 1991) has developed into a centreof trade and commerce mainly because of its connectivity. This has also encouraged ribboncommercial development, particularly on the Bulandshahr-Khurja corridor. The city is servedby water supply drawn form underground sources, while caters for upto 50 per cent of thetotal demand. The city has no sewerage system and septic tank effluent is channelled throughunlined drains. The effluent is ultimately discharged into Kali Nodi, untreated. There isgarbage collection system but the disposal is unorganised.
6.8.4 Faridabad (Haryana)
Contiguous to Delhi, this class I city (population 617,717 persons in 1991) is very wellconnected. Both the southern and western railway lines pass through the city. Agra canal alsopasses near the city making its hinterland very fertile. However, the economic base of thetown is industry, which arose through the advantage of proximity to Delhi. The area is badlyeffected by polluting industries, especially those dealing in electro-plating. It has pools ofeutrophied water, liquid industrial wastes are disposed untreated into open drains, causinga foul smell, and solid wastes are dumped on the road side. Traces of zinc have been foundin the water drawn from borewells.
This linear city has a high concentration of slums and squatter settlements along the railwaytracks, highways and low lying areas. Together with Ballabgarh, the whole city is termed asthe Faridabad-Ballabgarh Complex, which is poised for vast residential expansion over thenext decade.
6.8.5 Khurja (Uttar Pradesh)
A class II town, Khurja (population 80,305 persons in 1991) is known for its potteryproducts. Nearly 20 per cent of its population is engaged in industrial activities. It's morethan 500 pottery industries employ about 13,000 persons. Since these industries depend onthe use of coal-fired furnaces for their production, the level of the particulate matter in theair is very high. As there is no sewerage system for the town, it is dependent on septic tanksand unlined drains for sewage disposal. There is no organised garbage collection and disposalin the town.
113
6.8.6 Meerut (Uttar Pradesh)
Meerut is the most populous (849,799 persons in 1991) class I city in the region, after Delhi.It is an historical city, reference to it are found in the 12th Century. It is a major agriculturalmarket and mills flour and vegetable oil. Based on the current growth rates of population,Meerut is considered to have already become a metropolitan city. It is also the mostdeveloped, with a complex system of networks. Industry, trade and commerce andadministration are the three key functions this city performs. The city has three majorindustrial areas at Partapur, Modipuram and at Daurala. The city has had a master plan fora few decades, which is now under revision to accommodate NCR Plan postulates. Althoughthe old city core is congested, the newly developed areas of the city are well planned. Yetthe level of infrastructure, amenities and urban form presents a very gloomy picture. Thedrainage in the city is generally poor, and the sewage is disposed off untreated. The solidwastes are collected manually on bullock carts, and dumped along trunk roads outside thecity.
6.8.7 Naraura (Uttar Pradesh)
A class V town, Naraura (15,652 persons in 1991) is located on the river Ganga, at thesouth-eastern tip of the region. The town is the location for the Naraura atomic power plant.A new township has been developed to accommodate the employees of the plant. Thistownship has all modern environment and health infrastructure. However, the old town is a typical NCR town. Untreated sewage is directly discharged into the river Ganga, and garbagecollection and disposal are hardly evident.
6.8.8 Palwal (Haryana)
Abutting the boundary of proposed Faridabad Complex, this class II town (population 59,168persons in 1991) is well connected by rail and road. The town started on a higher land, andis now expanding on the lower plain, where it is surrounded by agricultural fields. Trade andcommerce are the main activity of the town, repairs, restaurants, building materials,agriculture implements and tools are prominent. Inner parts of the town have narrow roads,which are congested. The environmental condition of the town is deteriorating owing to theinformal sector, and on-street disposal of waste. Recent extensions of the town are subjectto local flooding. Solid waste is now used as a landfill. The town is partially serviced bysewer lines.
6.8.9 Panipat (Haryana)
A site of historic battles, this class I city (191,212 persons in 1991) is, today, known for itstextile, hand loom and power loom industries. It is also well known for its brass utensils,pottery and cane products. The city is served by the Western Yamuna Canal and is bisectedby the Delhi-Kalka railway line. The city is surrounded by rich agricultural land. Lineardevelopment of the city has lead to major traffic congestion. Although two fly-overs areunder construction, the general condition of roads is very poor. Water logged areas and
114

garbage dumps is a common sight. Both solid and liquid wastes from industries aredischarged into open drains. Extensive garbage dump sites are located very near to residentialareas. The city is partially served by a sewer line. A large and polluted surface drain,running through the middle of the city, discharges into the Yamuna, polluting it dangerously.
6.8.10 Rohtak (Haryana)
Located on the western fringe of the region, this class I city (population 216,096 persons in1991) is well connected both by rail and road. The Western Yamuna Canal also passesthrough the city. The city has well maintained and organised open spaces. It also has a lake,which is developed as a tourist spot, serving as a regional recreation facility. The overallenvironmental condition of the city is fairly good. The sewer system consists of partiallyopen, and partially closed drains. Both solid and liquid wastes are disposed off into openfields outside the city. The city serves as a trading, commercial and educational centre. Thereare a few industries, including the manufacture of muslin used for turbans.
6.8.11 Sikandrabad (Uttar Pradesh)
Sikandrabad is a class II town (60,992 persons in 1991), connecting Bulandshahr and Khurja.Industry, trade and commerce, and primary activities are the main functions of the town. Thetown has a water supply system covering about 65 per cent of the population. Although thereis no sewerage system, the drains are cemented. Untreated sewage is discharged into naturalstreams. While the municipality collects and disposes domestic garbage, industrial waste isdumped along highways, causing hazardous conditions.
6.8.12 Sonipat (Haryana)
This class I city (143,922 persons in 1991) is known for its small and medium industries.The city is surrounded by rich agricultural land, which is now under threat from urbansprawl. Major expansions are along the road to Kharkhoda. The city is partially served bya sewer system. Surface storm water drains also carry effluent from septic tanks. Garbageis dumped on the road side, and is collected once a day. Disposal of the garbage is notorganised and is dumped in open fields. Large scale pollution of land and water from theeffluent of large industries is prevalent. The Haryana Urban Development Authority (HUDA)is developing some new areas.
6.9 PLANNING PROCESS
As is mentioned earlier in the chapter, the first plan for the region was prepared, as far backas in 1974, by the TCPO. However, due to various reasons, no statutory body could be setup to carry out the overall objectives and effectuate the proposals of this plan. The processof preparing a plan with adequate statutory backing started with the setting up of the NationalCapital Region Planning Board, in 1985.
115

For the purpose of preparing a plan for the region, a planning committee was constitutedunder the chairmanship of a Member-Secretary. The planning committee drew membersrepresenting the top administrators and planning professionals working at the centralgovernment and various constituent states of the region. The planning committee was furthersupported by various study groups comprising of experts in the field of demography,settlement pattern, transport, communications, water supply, sewerage, power and industries.
6.9.1 Interim Development Plan
Based upon the extensive studies carried out by various study groups, the Board came upwith an Interim Development Plan 2001 (NCR Planning Board, 1987). This plan, by andlarge, was a policy document. Part I of the plan listed a package of policy measures andproposals in respect of different sectors of development. Part II of the plan dealt in detailwith aspects such as demography, settlement system, economic activities, transport andcommunications, energy, water supply, sewerage and sanitation, land use, the environmentand ecology, and the financial implications of the plan proposals. Whereas it is conventionalto supplement a plan with relevant 'work studies' (e.g., DDA, 1962), reports of the studygroups were not made public in the case of Interim Development Plan 2001. Objections andsuggestions on the interim plan were invited from the members of the public, central andstate governments, local bodies and non-governmental organisations (NGOs).
6.9.2 Regional Plan 2001
After considering the objections and suggestions received, the Regional Plan 2001 wasprepared and approved (NCR Planning Board, 1988). Besides drawing upon the findings ofthe study groups, the Board also consulted professional as well as institutional consultants inrespect of certain specific aspects of the plan. Like in the case of study groups, reports fromthese consultants were also not made public.
Studies on the settlement system for the region were undertaken by the Physical ResearchLaboratory (PRL), Ahmedabad. These studies (PRL, undated), conducted separately for theconstituent states of the NCR, in principle adopted a Composite Functionality Index method(see 3.2.6). Indicators ranging between 30 to 40 in number were used in these studies toarrive at recommending the selection of regional, sub-regional and service centres, and basicvillages. The studies did not look into the growth potential of various settlements underconsideration. No attempt was made to define what made a regional, sub-regional or a service centre. Further, no attempt was made to study in which direction the developmentis to be made in order to restrict migration to Delhi. These are some of the limitationsreported in the studies (e.g., PRL, undated, Uttar Pradesh, pp.27-28).
6.9.3 Use of Remote Sensing and GISs
As is explained in Chapters Four and Five, the use of remote sensing and GISs is rather newin the filed of spatial planning in India. Apparently, no use of either technique was made inpreparing the interim development plan. This plan provides a table showing land utilisation
116

in NCR by constituents: 1981-82 (NCR Planning Board, 1987, pp.42-43). Statistical abstractsof the respective districts and states were used as a basis for preparing this table. The secondplan (NCR Planning Board, 1988), however, made use of Landsat satellite images and aerialphotographs in preparing a land use (1986-87) map for the region (NCR Planning Board,1988, map 3). Services of the Terrain Research Laboratory (TRL) of the Ministry ofDefence, Government of India, were used for this purpose. TRL obtained, processed andanalyzed these images on behalf of the Board. Though there are no image processing and/orGIS facilities available within the Board, it is aware of the usefulness of these techniques inmonitoring the land use and related aspects over the region. The plan recognises the need fordeveloping a scientific system, "Through sequential/periodical aerial photographs/satelliteimageries to evaluate persistent trend of landuse over a period of time and monitorunauthorised developments and to detect growth trend of urban areas..." (NCR PlanningBoard, 1988, p. 119). Findings of this research are directed at contributing to developing sucha system. The Board is in the process of acquiring and establishing a GIS.
6.10 A SCENARIO FOR T H E PLANNING OF SETTLEMENT PATTERN IN THEREGION
The National Commission on Urbanisation (NCU) are of the view that a decadal growth rateof over 30 per cent in any human settiement is beyond the maintenance capacity of localgovernment (Government of India, 1988). However, as revealed by Appendix VII, more than45 towns in the NCR, in the decade 1981-91, experienced a population growth rate higherthan the 'limit' identified by the NCU. Some of the towns experienced growth rates of theorder of 80, 90 and even over 250 per cent. Appendix VII also reveals that most of the largetowns and cities are becoming multi-functional. Administration, business, the distributivetrade, industries, education and culture are amongst their intrinsic functions.
Delhi and its immediate surroundings attract population from all over the country due to a favourable investment climate and due to employment opportunity, both in the formal andinformal sectors. This is partly countered by disadvantages arising from centralised licensingand other functions arising from the role of Delhi as the national capital (Ribeiro, 1993).
The National Capital Region Planning Board Act, 1985 (NCR Act) leans heavily on a partnership for integrated growth of the region between the central, state, and localgovernments and also, hopefully, on private entrepreneurs and citizens in what has alreadyemerged as a complex exercise in trade-offs to determine best locations for statutoryintegrated growth. Many towns in the region do not have a master plan. In others, masterplans were prepared long before the enactment of the NCR Act. The National Capital RegionPlanning Board is only a coordinating and monitoring body. The responsibility of executingthe schemes remains with the participating states (NCR Planning Board, 1987). Urbandevelopment, as per the Constitution of India, is a state (and not a central) subject. With the74th Amendment to the Constitution (Govt, of India, 1993), providing more responsibilitiesand powers to the local government, ensuring that urban development will be within theoverall framework of the NCR Plan will be a complex task. There are already several courtcases pending, involving the private developers, state governments and the centralgovernment.
117
The complexities are such that doubts are raised if there are any implementable solutions ina situation where uncoordinated political interventions persist. There are, already, scenariosfor unified authorities for the NCR for power supply, telecommunications and transport(Ribeiro, 1993). These scenarios may, ultimately, broaden the scope of government of theNCT of Delhi so as to cover the entire region, leading to the formation of a government ofthe National Capital Region of Delhi. However, this is speculative and development alongthese lines may take several decades to materialise.
6.11 CONCLUSIONS
The NCR has evolved into a complex planning and administrative system. Planning for theregion involves coordination among more than half a dozen ministries of the centralgovernment, senior decision makers and administrators of half a dozen state governments(including those of Madhya Pradesh and Punjab), planning professionals from the central andstate governments, and a large number of urban local bodies. More complex is the planningfor settlement pattern for the region, with human settlements in population sizes ranging fromless than 500 persons to over 9 million people. The planning board does not have themethods and tools to comprehend settlement pattern over an area of the vastness of NCR.It also does not have the methods and tools to monitor settlement patterns at intervalsappropriate to rapidly growing human settlements. The concept of CBA, supported with toolssuch as remote sensing and GISs, enables planners, administrators and decision makers ingaining better understanding of this complexity, in a way that can be impartially, and withconsistency, executed by technicians (Mahavir and Al-Amir, 1996). An attempt is made inthe following chapter to develop this concept and the tools in the form of models forunderstanding, monitoring and describing, and for predicting and recommending settlementpatterns in metropolitan regions such as the NCR.
118

7
MODELSFOR UNDERSTANDING, MONITORING AND DESCRIBINGAND FOR PREDICTING AND RECOMMENDINGSETTLEMENT PATTERNS
It was concluded in Chapter Six that the NCR Planning Board does not have adequatemethods and tools to comprehend settlement pattern over an area of the vastness of NCR.The Board also does not have the methods and tools to monitor settlement patterns at aninterval corresponding to rapidly growing human settiements and, therefore, rapidly changingsettlement patterns. With the 74th Amendment Act, an effort is being made to strengthen therole of urban local bodies, without defining 'local'.
The concept of CBA, as described in Chapter Two, was found to be useful and convenientlyapplied on remotely sensed data. It not only allows for inclusion of the elements of spatialdynamism of human settlements, it provides a tool for defining the term 'local', in thecontext of the 74th Amendment Act.
An extensive review of some of the popularly used models for analyzing human settlementpatterns was carried out in Chapter Three. Though all the models discussed there arelandmark developments in their own context, they are usually associated with limitations ofvarious kinds. The concept of 'service centre hierarchy' draws from various other theories.It is more systematically applied, yet it is too much dependent on data on a number offacilities. Moreover, this and other prevalent models invariably consider settlements as pointlocations. They also rely heavily on assumptions like rational economic and planningbehaviour. Thus, other methods will have to be developed which are more flexible andcapable of adjustment, and therefore, partially visual and manual.
An attempt is made in this chapter to evolve models, prototype in the context of urbanisationin India, for understanding, monitoring and describing; and for predicting and recommendingsettlement patterns in metropolitan regions, such as the NCR. The chapter also sets out theadvantages and limitations of the proposed models, and appraises the models with respect tothe plan for the NCR. The chapter goes on to identify areas in which the research might bedeveloped further.
119

7.1 EXPLANATION OF TERMS
In Chapter Two, the term CBA was defined. In this sub-chapter, some other terms used indescribing the model presented in this chapter will be discussed. The terms will be used toexpress the dimensions of volume and time, as well as location and other characteristics ofhuman settlements.
Locations are point locations with X, Y and Z coordinates, as expressed in geography by theterms longitude, latitude and altitude. Accordingly, in referring to the location of humansettlements, reference is made to point locations. Human settlements may be shown on mapsas points. In updating such maps, remote sensing might play a role in identifying new humansettlements, or identifying shifts relevant to human settlements (e.g., a shift of the businessarea) leading to a new location of the point representing the settlement.
Location is a principal characteristic of human settlements. Other characteristics (e.g.,population characteristics) are deemed to be concentrated at the location of humansettlements. Some characteristics allow a degree of visualisation. For example, populationfigures may be represented by proportional circles, or other scalable shapes, centred onlocations. However, such cartographic representations do not represent spatial arrangements.
Arrangements of volumes are spatial arrangements. Where the volumes of human settlementsare to be shown on maps, they are represented by their projections, here named areas. Thepatterns formed by areas and changes in these patterns observed at intervals, permit studyof the behaviour of human settlements.
Here, areas of human settlements are defined by CBA method set out in Chapter Two. Themethod includes a series of operational definitions of the CBA which is related to the scalesof the relevant remote sensing data [e.g., at a scale of 1:250,000, a minimum curtilage of4mm x 4mm (representing one square kilometre) and a minimum width of 2mm (representing500 metres) is used]. The CBA method is demonstrated in Appendix III, in which the CBAsin the NCR of Delhi are delineated.
One behaviour that can be observed in this way is the merging of two or more humansettlements. Where their areas were previously in different locations they will, upon havingbecome one area, be in one location. Therefore, on a map showing point locations, thenumber of points will be reduced. Conversely, it is conceivable that a human settlementdevelops two or more nodes, ultimately leading to spatial segregation and hence more pointlocations.
Once a change in the number of locations has been determined, analyses that were made ofprevious situations should be reapplied, leading to new results, just as changes in othervariables (e.g., population numbers) will lead to new results. The insight gained from thestudy of the behaviour in human settlements can assist planners in undertaking the task ofpredicting future changes in these results (e.g., by projecting trends in changes of CBAs, andhence trends towards new characteristics, including new locations). In addressing this task,the planner is supported by remote sensing, which enables him(her) to delineate CBAs atfrequent intervals, thus providing indication of possible future change (e.g., the forming ofagglomerations of human settlements).
120
Here, the term 'settlement pattern' especially refers to the pattern of human settlement in theNCR of Delhi, India (the region). The region was delineated by the TCPO in 1974 and, afterminor amendments, adopted by the NCR Planning Board in 1988. A detailed description ofthe region is provided in Chapter Six.
In 1991, the Census of India determined that the number of villages and other humansettlements in the region amounted to 6,700. This number has remained more or less constantover a long period of time, except for changes due to settlements that were engulfed by urbangrowth. Excepting these cases, the pattern made by the human settlements in the regionevolved over so many years that it is virtually permanent in terms of the life span ofindividuals of the humankind. The exceptions confirm the apparent rule that changes in thepattern of human settlements in the region are due to changes in their areas.
The rule represents a model. The model permits the observation that changes in areas canbe monitored through remote sensing, thus reducing the need of existing models for a frequent supply of detailed data (e.g., census data). Existing models have the furtherdisadvantage that they, in general, are models for understanding existing patterns, rather thanmodels for making predictions concerning the development of future patterns if nointerventions were made to interfere. Time series studies suggest that such interventions(e.g., natural calamities or human interventions such as the construction of new towns) areso rare in the region that they have little impact on the development of changes in pattern,thus the measurement of changes in area provides a potentially important technique forpredicting future change.
As the CBA method plays a key role in this technique it may be presented as the CBAtechnique, and the model to which the technique is applied as the CBA model. Potentialapplications of this model are further discussed in the following sub-chapter.
7.2 A M O D E L FOR UNDERSTANDING, MONITORING AND DESCRIBINGSETTLEMENT PATTERNS
One of the principal objectives of this research was to evolve a model for understanding,monitoring and describing settlement patterns in metropolitan regions, such as the NCR. Anattempt is been made in this section to detail such a model, which is summarized in Figure7 .1 . Some of the elements of this model are as follows.
The model draws from the concept of CBA to represent 'settlements'. Spatial planning at theregional level is traditionally perceived in terms of territorial units of government. As the useof CBAs is likely to take time to be accepted by decision makers and administrators, anattempt has been made in the model to start the process of adoption by using conventional'point locations' of settlements (e.g., census towns). This is then supported by using theconcept of CBA (as detailed in section 7.2.1.2 and Appendix III). Use of images obtainedthrough remote sensing satellites (such as IRS) is made at this stage, supporting themonitoring aspect of the model. The model also makes use of existing knowledge and toolsavailable for performing 'point' based analysis of settlement patterns. This stage of the modeldwells upon socio-economic data for the settlements, as obtained through the census.Whereas in conventional approaches (e.g., the scalogram method) facilities are assumed to
121
be concentrated at the centre of the settlement, in the proposed model facilities are assumedto be uniformly distributed throughout the CBA. The output from the model forunderstanding, monitoring and describing settlement patterns is then used as an input for themodel for predicting and recommending settlement patterns, detailed later in this chapter.
A number of steps incorporated in the model have been dealt with elsewhere in the book.The model is suggested to be recalibrated when the results of a new census become available,or when a new plan for the region is prepared. The parts of the model that are dependant onremotely sensed data are suggested to be adjusted more frequently.
7.2.1 Application of the Model on the NCR
7.2.1.1 Point Patterns
Techniques for the point pattern analysis and spatial autocorrelation, as provided in ILWIS,were discussed in Chapter Two.
A map on a scale of 1:530,000, showing census towns in the region (NCR Planning Board,1988; additional towns declared in 1991 were added by the author) was digitized and storedin ILWIS in the form of point locations. The national highways, railways, rivers and canalswere digitized in the form of line segments, and the external boundary of the region in theform of a closed polygon. Point locations of the towns were also simulated for regulardistribution in the region and for distribution in CSR.
The region has rich fertile land with rivers and canals and a good network of rails and roads,which influences the distribution of census towns in the east of the river Yamuna. Pointneighbour analysis was performed on three sets of locations. The results are presented inAppendix IX. First order RNNs in existing locations suggest regular distribution in bothtests, for dispersion and arrangement. However, the first order RNNs in the situationssimulated for CSR and regular distribution suggest regular distribution in both tests, whereasthey suggest towards clustering even for the situation simulated for regular distribution in thetest for dispersion. These conflicting outcomes suggest a need for other techniques of testing.
Typical Pattern Curves
Pattern curves were generated for the three pattern types discussed above, i.e., the existing,simulated regular and simulated CSR. When compared to standard curves (Appendix II), theexisting situation seems closer to random distribution.
Spatial Autocorrelation
Four variables, viz. population in 1991, population growth rate 1981-91, % literacy in 1991and % work force in 1991, were tested for autocorrelation in the existing point locations ofthe towns. The process was repeated for the same set of locations but for variables generatedat random. It is interesting to note that graphs for the existing situation and that created fornon-autocorrelation were alike for the variables population growth rate and work force,suggesting non-autocorrelation. The graph showing variance for variable populations showed
122

Besting CensusTowns
'.i-.'-i: • : Definition ofContinuouslyBUIIKO Area
locals on ToooSheets; Obtain x,Y [ _ > ,Cooromaes
DqreiFfewDataofawiite images ofire tegon
FaseCobirCbmpoaeof Sjb-SzenesanaMaprSjOements
UseX,YCoordinates forOnenaoon ofrnage
rnage ftocesarqana Ennancementon ZDomed-inSeres of &stmgTowng PotentialTowra PotentialSjoemenis. sc.
Delineation ofContinuously Built-up Areafor Each Settlementor A39smcage,et
RjlesonMinmumCerclage, Mm tJCP. Idealization.Generalization.Assemoiage. er
Acoyvarous'Fbint'Fotiem Ffecognmonand AnaVss Technques
Apoly various ^rea Pattern Racognrtonana Analysis Tec-nques
Census' otherThematicData
Economic/Political
Devetop EtetBrUnCersBndingoftne ExistingSjtrjement Pattern; Change in Pattern
• ftocesges) Ftecornrnenoea o DeFtepeated ftnoacaity.
Input for MofleH forReacting ana ftecommendmg
The Overall Process FfecommenoeG to DeRepeated Whenever Ftesultsof a NewCensus Made Available, era New Pan s Under Reparation.
Fig. 7.1 A Model for Understanding, Monitoring and DescribingSettlement Patterns
123

a little correlation. Graphs showing both correlation and variance for variable literacysuggested autocorrelation.
In a separate exercise performed by the author, the number of national highways, railways,state highways and the district roads passing through every census town in the region wererecorded. With respective weights of 3, 3, 2 and 1, a connectivity index (CI) was arrived atfor each town. Also, the distance of each town from Delhi (point locations in each case) wasdetermined. A proximity index (PI) was determined for each town as PI=CI/Distance.
Only very weak correlations were found between any of these indices and variouscharacteristics of the towns. For example, the correlation between CI and the populationgrowth rate (1981-91) was only 0.071. The correlation between CI and the work forceparticipation rate was found to be only 0.170, and that between CI and the literacy rate wasfound to be 0.529.
Using equal weights for all the major transportation mediums did not make the correlationsstronger.
Point Neighbours
Using a facility provided by the software ISNAP3 2 , the number of neighbours that eachcensus town has was determined. The number of neighbours ranged from 4 to 9. Variouscombinations of this number with those of the above mentioned indices also did not yield anysignificant correlations.
Visualising the 'point pattern' through ISNAP provides improved pattern recognition,specially in detecting clusters and linear patterns. Testing the location of census towns in theregion through this facility further strengthened the identification of a pattern correspondingto that of transportation corridors in the region (see also para 6 below). It also helped identifya few more clusters than were identified before.
7.2.7.2 Area Patterns
1. Human settlements in the NCR that do not satisfy the CBA operational definition areconsidered only in the dimensions of location and other characteristics, and time.Human settlements that do satisfy the CBA operational definition but stand inisolation, are also considered only in the dimensions of location and othercharacteristics, and time. Interaction among human settlements in these categoriesdepends on the existence of transport and communication facilities.
P e n g , Wanning and Pi louk, Marakot; I S N A P 1.0 (Simplical Network Applicat ion P a c k a g e ) , August , 1 9 9 5 ,ITC, Enschede .
The package w a s deve loped by its authors for its use in their research, and is not avai lable c o m m e r c i a l l y .T h e package is vector based and runs on W i n d o w s .
124
Gerritsen
Typewritten Text
Gerritsen
Typewritten Text
_______________________________________________________________
Gerritsen
Typewritten Text
Gerritsen
Typewritten Text
32


For the purpose of identification, these human settlements have been named as'insular' human settlements.
2. Some human settlements reflect the existence of (or a potential for) corridordevelopment (e.g., due to transportation, proximity and need for a socio-economicinteraction). These human settlements are considered in the dimensions of locationand characteristics, and time, collectively for all the human settlements forming thecorridor development.
For the purpose of identification, these human settlements have been named as'couples' or 'functional couples', as in the rules illustrated in Figure 7.2.
3. The city of Delhi, together with some other (census) towns forms anagglomeration3 3, satisfying the CBA operational definition. Some of these towns arelocated within the National Capital Territory of Delhi.
Some other towns reflect an apparent potential for forming an agglomeration.
These human settlements are considered in the dimensions of location and othercharacteristics, as well as volume and time, collectively for all the human settlementsforming a potential agglomeration.
For the purpose of identification, these human settlements have been named as'assemblage'.
4. The city of Delhi forms an urban agglomeration with 23 other (census) towns. Sixother towns are also located within the National Capital Territory of Delhi (see Table7.1 and Map 7.1).
5. The NCR had 49, 53, 94 and 106 (census) towns respectively in the years 1961,1971, 1981 and 1991 (see Table 7.2 and Map 7.2).
6. These (census) towns form a pattern that corresponds to the pattern of major transportcorridors in the region. Based on Table 7.3 and recommendations of the NCRPlanning Board (1988), nine major corridors were identified in the region. Towns
As per the C e n s u s of India, an 'urban agg lomerat ion ' constitutes (Census of India, 1 9 8 1 , Ser ies 1, India,
Part X - A ( i ) , T o w n Directory , 1988 , N e w De lh i ) :
i. a city or town within a continuous outgrowth, the outgrowth being outside the statutory limits butfalling within the boundaries of the adjoining v i l lage or v i l lages; or
ii. t w o or more adjoining towns with their outgrowth as in (i) above; or
iii . a city and one or more adjoining towns with their outgrowths all of which form a cont inuousspread.
H o w e v e r , the dec is ion of whether the outgrowth is cont inuous or not is not based upon an elaborate set ofrules.
126
Gerritsen
Typewritten Text
Gerritsen
Typewritten Text
______________________________________________________________
Gerritsen
Typewritten Text
Gerritsen
Typewritten Text
33
located directly on these corridors represented a major share in the region both interms of numbers and resident population (see Table 7.4 and Map 7.3). The corridortowns accommodate 81 percent of the total population of the region, excluding Delhi.Including Delhi, the percentage rises to 93 percent. The situation has remained thesame for last three decades.
The corridors towns (excluding Delhi) were growing at a rate of 57% between 1981-9 1 , whereas other towns were growing at a rate of 55% during the same period(Table 7.4).
7. When delineated on the topo-sheets of the Survey of India, scale 1:250,000, coveringthe period 1965-70, only 17 human settlements satisfied the CBA operationaldefinition. These were the (census) towns of Alwar, Bahadurgarh, Bulandshahr,Delhi, Faridabad, Ghaziabad, Gurgaon, Hapur, Khurja, Meerut, Palwal, Panipat,Rewari, Rohtak, Sikandrabad, Sohna and Sonipat. However, there existed 53 (census)towns in the region in 1971 (TCPO, 1974).
The first NCR Plan (TCPO, 1974, p.25) noted a few corridor towns in the region.However, these were only the towns served by major transportation corridors and notthe towns or pair of towns showing corridor/ ribbon development, as revealed by thetopo-sheets.
8. During the period 1971-81, the number of (census) towns in the region rose to 94,adding 41 towns over 1971. Most of these towns were insular human settlements.
However, the following assemblage human settlements were observed on the landusemap (NCR Planning Board, 1988) and satellite images of 1990-91 (see section 4.7.2):
Delhi, Loni, Ghaziabad, NOIDA and Faridabad-Ballabgarh Complex;Meerut and Abdullapur;Muradnagar and O.F.Muradnagar.
A number of (census) towns showed potential for growing into couple humansettlements. These couples included Hapur-Babugarh, Gurgaon-Jharsa, Kundli-Alipur,Hailey Mandi-Pataudi and Tikri-Doghat.
The settlement pattern for the region, in the period 1961-91, is illustrated in Map 7.4.
7.3 A M O D E L FOR PREDICTING AND RECOMMENDING SETTLEMENTPATTERNS
One of the principal objectives of this research is to evolve a model for predicting andrecommending settlement patterns in metropolitan regions, such as the NCR. An attempt ismade in this section to explain the model, shown in Figure 7.3. The elements of this modelare as follows.
127

the Satellite imagesof tneFtegon
FateeCofour- ~ : •-• ' •
Sub Scenes'
CnteraofPopulationDensity,Work ForceFxonomcmporanceFunction,et .
&songCensus Towns
&isang Census Vil&gas
Potential Towns forthe Future Fenoa
Fbtentai' Settlements forme Futi/e Fenod
Locate on TopoSheet; ObBmX,YCoorrjinates
UseXJCoordinates forOnenBtcn of- 3 ) •
locate on Topo-Shees. Oentrfy theSetDemens: ObBm X.Y Coordinates; ObBinrelevant atrtoute daa as for existing towns
DigrBlPawDaBofSatellite rnagesoftheFegon
False Co burComposite of Sub-Scenes and Mapr
mage Fhxessmgand Enhancementon zoomed-inscenes of theex song Towns/Potentai Towns'PotentialSetrJernerrs,et.
Delineation ofContinuously FJuilt-up Areafor Each SettlementorAssemDBge.et.
RjesonMmmimQrtiBge.rviin Wct3ideaiizatcn,Generalization,AssemDbge.et.
Apply vanous' Point 'Pattern Recognitionand Analyse Technques
Apply vanous' Area Pattern Ftecognitonand Analyss Technques
Census'otherThematic
SocaVFxcnomc/Political
Take Policy Decisions RegardingContmuatorv Mcxjification/ Alteration
input fom the Model forUnder, Monitoringand Deserting
• Frocess(es) Ftecommended to beRipeated Periodically
The Overall Process Ftecommended to beFtepeated Whenever Ftesultof a NewCensus Made Avai tec le, or a New Fan s Under Reparation
Generate a Pattern of Continuously FJuilt upArea* Assemoteges/ Couples, et .
Flies for FbtenoalMembers of C3Vs<AssemoBge/ Couples
Pteecr/egate Ftetevant AUtoute DaB; AssignSetrjementHerarchy, Population, Functions,Servces, et .
7.3 A Model for Predicting and Recommending Settlement Patterns
The model is a follow-up of the model for understanding, monitoring and describingsettlement patterns explained in the previous section. One of the important elements of thismodel is that it takes into account existing rural settlements (e.g., villages, as identified bythe census) that have a potential to become urban in the subsequent census (or by the end ofthe plan period). To achieve this, the model uses criteria for a settlement to be declared a census town and growth rates relevant to such criteria. On the other hand, the model usesthe CBA approach to identify and locate on satellite images the potential settlements. Thesteps of the model for understanding, monitoring and describing settlement patterns arefollowed in this model too.
For the purposes of making recommendations, the model uses conventional concepts anddefinitions of settlements (e.g., census towns), so as to facilitate implementation by decisionmakers and administrators. Accordingly, the relevant attribute data pertaining to theconstituent settlements of the CBA is re-aggregated to represent uniform distribution over theentire CBA. A settlement hierarchy based on population, functions and services can then bemade using techniques such as scalogram and the composite functionality index.
As stated earlier in this chapter, the model addresses a situation where human settlements arefixed in their location. Hence, the model treats the regional human settlement pattern asconstant at the regional scale, allowing areas and characteristics of individual settlements tochange. Over time, these changes may cause local variations in the regional pattern.
As a result, there is no distinct division between 'prediction' and 'recommendation' parts ofthe model. Whereas identifying the existing villages having a potential to become censustowns in 2001 (see section 7.3 .1 , step 1) may be named prediction, conceiving suchsettlements as CBAs (e.g., assemblage, couple, insular) may be named recommendation. Animportant aspect of a recommendation is that while it has to draw from planning goals andpolicies that might be specified for the region, it does recognize the local evolution of thesettlement pattern. In the case of the NCR, assignment of populations to various censustowns by the Regional Plan 2001 has been taken into account while recommending theformation of assemblage, couple, and insular settlements.
As in the case of the model for understanding, monitoring and describing, a number of stepsincorporated in this model have not been illustrated in this chapter as they been dealt withelsewhere in the book. As before, the model is suggested to be recalibrated each time theresults of a new census become available, or when a new plan for the region is prepared.However, parts of the model that are dependant on remotely sensed data are suggested to beadjusted more frequently.
7.3.1 Application of the Model on the NCR of Delhi
The proposed sequence of steps for application of the model to the NCR is as follows.
1. As defined by the Census of India, towns are places with a municipal corporation, a municipal area committee, a town committee, a notified area committee or a cantonment board. Also, all places having 5,000 or more inhabitants, a density of notless than 400 persons per sq. km, pronounced urban characteristics and at least three-
129

fourth of its adult working male population employed in pursuits other thanagriculture (Census of India, 1981). In marginal cases the discretion of the Directorof Census is also applied to categorise the area as urban or rural.
To generate a list of existing villages (in 1991) having a potential to become (census)towns in 2001, the following steps3 4 were followed:
i. all villages with a population of 4,000 and more persons were identified. Thisresulted in a count of 656 villages out of a total of 6,677 villages in the region(NCR Planning Board, 1988, p.28);
ii. from these, villages with a population density of 341 persons or more per sq.km were selected. 565 villages passed this test;
iii. next, villages with more than 70 percent of male working population in nonagricultural sector were selected. This gave a list of 73 villages, of which 48are located with in the NCT of Delhi and the rest elsewhere in the region (seeTable 7.5a);
iv. in addition, all existing Tehsil (sub-district) Headquarters are likely to becometowns in the light of the Constitution (Seventy-fourth Amendment) Act, 1992,providing greater powers and responsibility to the local governments (seeAppendix XI);
v. further, some villages were selected because they satisfied the CBA criteriaon the satellite image, even though they did not qualify in the steps i., ii. andiii. above (see Table 7.5b).
Thus, the total number of villages (as existing in 1991) identified as having a potentialto become (census) towns in 2001 comes to 19 excluding the villages located in theNCT.
2. The satellite images of 1990-91 and 1993-94 were examined for:
i. existing 'assemblage' of human settlements;
ii. existing 'couples' or 'functional couples';
Based upon the assumption that all the ex is t ing vi l lages are mov ing towards b e c o m i n g (census) towns in
the year 2 0 0 1 .
The criteria of 4 , 0 0 0 persons (as against 5 , 0 0 0 ) , 341 persons per sq. km (as against 4 0 0 ) and 7 0 % maleworking populat ion (as against 7 5 % ) w e r e chosen here keep ing in mind the rate of growth of ruralpopulation in the region (30% per de c a de ) , and that most of these vi l lages have already met at least o n eof the criteria.
130
Gerritsen
Typewritten Text
Gerritsen
Typewritten Text
______________________________________________________________
Gerritsen
Typewritten Text
Gerritsen
Typewritten Text
34

iii. 'insular' human settlements having a potential to join an already existing'assemblage', to form a new 'assemblage' or 'couple', including the existingvillages with a potential to become (census) towns in 2001; and
iv. existing and potential towns that are likely to stay as 'insular' humansettlements, based on the rate of growth of their CBA.
The potential of remaining 'insular', or becoming 'assemblage' or 'couple', willdepend upon the existence of a strong transportation corridor, distance between theedge(s) of the towns, connectivity and interaction between the towns and theirfunctional3 5 characteristics. However, as revealed by Table 7.2, more and moretowns were multi-functional in 1981 (see Figure 7.2 for the rules of determining thepotential).
7.3.2 A Scenario for 2001
The application of the criteria adopted in the model leads to a scenario for the year 2001. Inthis scenario, there will be 4 'assemblage' human settlements, 11 'couple' human settlements,3 'functional couple' human settlements and 65 'insular' human settlements. These 83 humansettlements (against 191 census towns projected for the year 2001) are as listed in followingsections.
7.3.2. J 'Assemblage' Settlements
i. The NCT of Delhi together with Loni, Dharoti Khurd, Beta Hazipur; WesternGhaziabad3 6; NOIDA; Tilpat, Faridabad Complex; Gurgaon, Dunda Hera, Khandsa;Bahadurgarh, Ladrawan, Sahoti; Kondli and Nahri.
As per the Census of India, nine categories of workers are regrouped into five broad functional c lasses ofi. primary or agriculture, ii. industry, iii. trade and c o m m e r c e , iv. transport and communicat ions , and v.serv ices .
If workers under o n e of the occupat ions form 40 per cent or m o r e of their total number, it is consideredas a mono-funct ional town. If h o w e v e r , such percentage is less than 40 percent , the next predominantoccupat ion is taken into account so that the total of the two may c o m e up to 60 per cent or above and suchtown is cons idered bi-functional . In spite of this, if the total does not c o m e up to 60 per cent , the thirdoccupat ion is taken into account and such a town is treated as multi-functional.
(Source: Census of India, 1981 - A Portrait of Population - Rajasthan; Directorate of Census Operations,
Rajasthan, 1 9 9 1 , p . 6 3 )
T h e total population of Ghaziabad U . A . assumed to be equal ly divided be tween Eastern and Western
Ghaziabad, as divided by the river Hindon.
131
Gerritsen
Typewritten Text
Gerritsen
Typewritten Text
______________________________________________________________
Gerritsen
Typewritten Text
Gerritsen
Typewritten Text
35
Gerritsen
Typewritten Text
Gerritsen
Typewritten Text
36

These human settlements, together, may be included in the Delhi Metropolitan Area,representing a combined projected3 7 population of 15.5 million (in 2001) includingthe population of existing villages identified as having a potential to become (census)towns in 2001. However, keeping the assigned3 8 population for some of the (census)towns listed above, the assigned population for this 'assemblage' is estimated to be14.5 million people in 2001.
ii. Eastern Ghaziabad3 9, Dasna and Dunda Heda, representing a combined projected4 0
population of 0.55 million in 2001. However, keeping the assigned4 1 population ofGhaziabad for the year 2001, the assigned population for this 'assemblage' isestimated to be 0.43 million people in 2001.
iii. Modinagar, Muradnagar, O.F. Muradnagar, Begum Budhana, Kalchhina, Sewalkhas,Patala, Niwadi, Faridnagar, Mohiuddinpur and Ron representing a combinedprojected4 2 population of 0.32 million in 2001. However, keeping the population forsome of these (census) towns, the assigned4 3 population for this 'assemblage' isestimated to be 0.45 million people in 2001.
iv. Dharuhera, Bhiwadi and Sidhrawali, representing a combined assigned (NCRPlanning Board, 1988, p.26) population of 0.19 million people in 2001.
Using rate of growth of population between 1981-91 for exist ing towns; using rate of growth of population
of the N C T of Delhi be tween 1 9 8 1 - 9 1 , i . e . 4 2 . 5 % for other sett lements .
3 8 S e e N C R Planning Board, 1988 , p .26 and p . 139 , for population ass igned to various towns for the year
2 0 0 1 . For rest of the t o w n s , population projected as a b o v e was used as ass igned populat ion.
3 ' The total population of Ghaziabad U . A . assumed to be equal ly divided be tween Eastern and Western
Ghaziabad, as divided by the river Hindon.
4 0 U s i n g rate o f growth o f population between 1981-91 for Ghaziabad U . A . , i . e . 9 3 % ; using the same rate
of growth of population for Dunda Heda .
4 1 See N C R Planning Board, 1 9 8 8 , p . 139 . Population o f Loni subtracted from the ass igned population o f
Ghaziabad + Loni .
4 2 Us ing rate o f growth of population be tween 1981-91 for exist ing towns; us ing rate o f growth of population
of the largest town, i . e . , 2 9 % in this case , for other sett lements .
4 3 S e e Deptt . o f T & C P , U . P . p p . 7 9 - 8 4 .
132
Gerritsen
Typewritten Text
Gerritsen
Typewritten Text
_______________________________________________________________
Gerritsen
Typewritten Text
Gerritsen
Typewritten Text
37
Gerritsen
Typewritten Text
Gerritsen
Typewritten Text
38
Gerritsen
Typewritten Text
Gerritsen
Typewritten Text
39
Gerritsen
Typewritten Text
Gerritsen
Typewritten Text
40
Gerritsen
Typewritten Text
Gerritsen
Typewritten Text
41
Gerritsen
Typewritten Text
Gerritsen
Typewritten Text
42
Gerritsen
Typewritten Text
Gerritsen
Typewritten Text
43
7.3.2.2 'Couple' Settlements
Combined Projected4 4 Population in 2001 ('000 persons)Figures in brackets refer to the assigned4 5 population
V. Alwar - Ramgarh 314 (515)vi. Hapur - Babugarh 213 (500)vii. Surajpur - Kasna4 6 (300)viii. Sonipat - Bahalgarh 199 (200)IX. Baghpat - Agarwal Mandi 48 (113)X. Kithor - Shahjahanpur 44 (75)xi. Khairthal - Kishangarh 42 (40)xii. Hailey Mandi - Pataudi 32 (28)xiii. Tikri - Doghat 29 (41)xiv. Daurala - La war 29 (45)XV. Bahsuma - Hastinapur 29 (36)
7.3.2.3 'Functional Couple' Settlements
Combined Projected4 7 Population in 2001 ('000 persons)Figures shown in brackets refer to assigned population
xvi. Modinagar - Mohiuddinpur/Rori - 1500 (1550)Meerut U.A. 4 8
xvii. Sikandrabad - Bulandshahr - Khurja4 9 336 (800)xviii. Rewari - Dharu Hera/Bhiwadi5 0 165 (300)
U s i n g rate of growth of population be tween 1981-91 for exist ing towns; using rate of growth of population
of the larger town in the pair for other sett lements.
4 5 S e e N C R Planning Board, 1 9 8 8 , p . 2 6 ; Deptt . o f T & C P , Haryana, pp . 7 . 8 - 7 . 9 ; Deptt . o f T & C P , U . P .p p . 7 9 - 8 4 .
4 6 Th i s is a lready be ing deve loped as one urban c o m p l e x for a populat ion of 0 .3 mil l ion in the year 2001 (see
Deptt . o f T o w n and Country Planning, U . P . , p p . 4 8 ) .
4 7 U s i n g rate o f growth o f population be tween 1981-91 for exist ing towns; using rate o f growth o f population
of the larger town in the pair for other sett lements .
4 8 S e e N C R Planning Board, 1 9 8 8 , p . 2 6 , for population ass igned t o Meerut .
4 9 Bulandshahr and Khurja w e r e conce ived as corridor towns in both the first and the second plan for theregion (see T C P O , 1971 and N C R Planning Board, 1988) . This c o m p l e x is be ing des igned for a totalpopulation of 0 . 8 mil l ion in the year 2001 ( see N C R Planning Board , 1988 , pp . 2 6 ) . I t i s proposed to addSikandrabad in this corridor.
5 0 Th i s is a lready be ing deve loped as one c o m p l e x for a target populat ion of 0 .3 mil l ion in the year 2 0 0 1 ( see
N C R Planning Board , 1988 , p p . 2 6 ) . T o w n of Sidhrawali i s expected to jo in this c o m p l e x .
133
Gerritsen
Typewritten Text
Gerritsen
Typewritten Text
________________________________________________________________
Gerritsen
Typewritten Text
Gerritsen
Typewritten Text
44
Gerritsen
Typewritten Text
Gerritsen
Typewritten Text
45
Gerritsen
Typewritten Text
Gerritsen
Typewritten Text
46
Gerritsen
Typewritten Text
Gerritsen
Typewritten Text
47
Gerritsen
Typewritten Text
Gerritsen
Typewritten Text
48
Gerritsen
Typewritten Text
Gerritsen
Typewritten Text
48
Gerritsen
Typewritten Text
Gerritsen
Typewritten Text
50

7.3.2.4 'Insular' Settlements
All other (census) towns and potential (census) towns from tables 7.2, 7.5a and 7.5b, notcovered above. Figures in '000 persons, projected5 1 for the year 2001. Figures shown inbrackets refer to the assigned5 2 population for the year 2001.
S E T T L E M E N T P O P U L A T I O N (2001)
R O H T A K 271 (500)
PANIPAT 2 6 4 (500)
P A L W A L " 4 (300)
B A R A U T 99 (100)
M A W A N A 71 (100)
P1LKHUA 6 6 (150)
S A R D H A N A 6 1 (100)
D A D R I 5 4 (50)
J A H A N G I R A B A D 4 9 (75)K H E K R A 4 9 (50)
G U L A O T H I 47 (50)GO H A N A 40 (50)
S I A N A 3 9 (75)
SHUCARPUR 3 9 (75)H O D A L 3 5 (30)G A R H M U K T E S H W A R 3 5 ( 1 0 0 )D E B A L 3 4 (50)
JHAJJAR 3 ; (32)JEWAR 2 9 (75)
G A N A U R 2 6 (25)A N U P S H A H R 2 5 (100)
S A M A L K H A 2 5 (22)
N A R A U R A 2 5 (75)A T S E N I + B A I T + B I H UNI 2 4B E H R O R 2 2 (25)
T A O R U 2 2 (16)
A U R A N G A B A D 2 0 (25)
T U A R A 1 9 (25)M A H A M 19 (20)
U C H A G A O N + A M A R G A R H -.9
P A H A S U 1 9 (25)C H H A P R A U L I 19 (25)
S E T T L E M E N T P O P U L A T I O N (2001)
P H A L A U D A 1 8 ( 2 5 )S O H N A 18 (20)K A L A N A U R 1 7 ( 1 7 )P A S A U N D A 17S A L A R P U R K H A D A R 17
P A R I K S H I T G A R H 1 6 ( 2 5 )
F E R O Z E P U R JHIRKA 16 (20)BERI 15K H A N P U R 15B A H I N + K O T 14B U G R A S I 14 (18)K A R N A W A L 1 2 ( 2 5 )
R A B U P U R A 12 (20)B " B A H A D U R N A G A R 12 (20)
P U N A H N A 12 (12)K H A R K H O D A 12 (20)C H H A T A R I 11 (12)D A N K A U R 11 (50)B A W A L 10 (20)A M I N A G A R S A R A I 10 (20)J A H A N G I R P U R 10F A R R U K H N A G A R 10 (10)
KHERI S A M P L A 10 (10)D U J A N A 10H A S S A N P U R 10 (10)
H A T H I N 9 (10)N U H 9S H A H A J A H A N P U R 9 ( 2 0 )
B I L A S P U R 8
A S A N K H U R D 8K A K O D 8 (6)P I N A G W A N 7 (8)T A P O O K R A 6
Rate of growth of population between 1981-91 for exist ing towns; and rate of growth of population of the
N C R be tween 1 9 8 1 - 9 1 , i . e . , 3 8 % , for other sett lements used .
See N C R Planning Board, 1 9 8 8 , p . 2 6 ; Deptt . o f T & C P , Haryana, p p . 7 . 8 - 7 . 9 ; Rajasthan, p p . 5 2 - 5 3 ; U . P .
p p . 7 9 - 8 4 .
134
Gerritsen
Typewritten Text
Gerritsen
Typewritten Text
________________________________________________________________
Gerritsen
Typewritten Text
Gerritsen
Typewritten Text
51
Gerritsen
Typewritten Text
Gerritsen
Typewritten Text
52

Settlement pattern for the region, as predicted5 3 (by application of conventional methods)for the year 2001 and as recommended (by application of methods developed in this research)for the same year is illustrated in Maps 7.5 and 7.6 respectively.
It may be noted (Map 7.6) that the river Hindon and vast marshy land separate the'assemblages' (i) and (ii). It should also be noted that Meerut U.A. forms a 'functionalcouple' (xvi) with the 'assemblage' (iii) and the 'couple' (xiv). Similarly, Rewari forms a 'functional couple' (xviii) with the 'assemblage' (iv).
7.4 O U T C O M E OF T H E MODELS
The proposed models provide a basis for political decisions based on social, economic andenvironmental considerations. The models do so not only by providing numbers of scenarioslike the scenario developed in section 7.3.2 but also by focusing the attention of decisionmakers on physical reality rather than administrative (e.g., municipal) boundaries. By doingso, use of the models may be expected to lead to two general advantages:
i. increased awareness of the need for coincidence between physical and administrativeboundaries; and
ii. increased awareness of the need for coincidence between physical boundaries and thesurvey plan for the census.
7.4.1 Advantages
Planning, by nature, is a formal activity influenced by formal instruments (e.g., legislation).This shapes the way the citizens, their political representatives and governments perceivehuman settiements. This perception is evident in the form of 'municipality', 'census town','revenue village', etc. There is evidence that this perception, when translated into planning,does not work as intended. Instead, a reality takes place on the ground. New means are,therefore, required so that the reality can be translated into a formal perception and beincorporated into the legislative structure in a standard format.
That means is available through this model, whereby various agencies can come to the sameformal and standard realisation of the reality. It, then, becomes capable to be integrated asa system of measurement in the legislation. As a result, reality rather than administrativeabstraction can become the basis for planning and management of human settiements.
Specifically, the models have the following advantages.
1. The models do not rely on 'point location' based aggregate data, and therefore on'point patterns', for analyzing settlement patterns. In stead, they take into account
Census v i l lages (in 1991) located in the N C T of De lh i , identified to b e c o m e census towns (in 2 0 0 1 )
exc luded from this illustration.
135
Gerritsen
Typewritten Text
Gerritsen
Typewritten Text
_______________________________________________________________
Gerritsen
Typewritten Text
Gerritsen
Typewritten Text
53
existing or potential 'assemblage' human settlements. This ensures that area isconsidered in analyzing settiement patterns.
2. The models look beyond administrative boundaries, treating human settlements ascommunities.
3. The models provide a framework for understanding, monitoring and describingexisting patterns, and for making predictions and recommendations.
The models take into account not only existing (census) towns but also the villageshaving a potential to become (census) towns within the planning period. This correctsa lacuna hitherto present in plans for the region (e.g., TCPO, 1974). Regional Plan2001 leaves this task for the sub-regional plans (NCR Planning Board, 1988, p. 129).However, the sub-regional plans have not referred to the issue (see DDA, 1994;Deptt. of T&CP, Govt, of Haryana; Deptt. of T&CP, Govt, of Rajasthan, 1992;Deptt. of T&CP, Govt, of U.P.).
4. The models provide for periodic revision and updates corresponding to availabilityof two major sources of data (i.e., the census and satellite images).
5. The models utilize satellite images, which provide a comprehensive rendering ofphysical urban development. This enables the decision makers to take more realisticdecisions.
6. To strengthen the decision making process, the models provide for generatingalternatives. This is achieved by calibrating the operational definition of CBAs todifferent levels of generalisation and by using alternative set of rules for identificationof 'assemblage' and 'coupled' settlements.
7. By adopting the method of identifying 'assemblage' and 'couple' human settlements,the models reduce the number of human 'settlements' to a more manageable number(from 191 projected census towns to 83 human settiements, in the case of the NCR).This removes some of the burden of the central planning agency (i.e., the NCRPlanning Board), whilst it provides flexibility to local government in planning thehuman settiements under their jurisdiction, within the overall framework provided bythe central planning agency. This has two positive implications:
i. improved opportunity for local government to exercise the powers andresponsibilities entrusted upon them by the recent enactment of theConstitution (Seventy-fourth Amendment) Act, 1992 (Government of India,1993); and
ii. improved utilization of resources (e.g., planning and managerial skills) oflocal government.
Thus, the models provides a tool for decision makers, administrators and planners tore-define 'local' according to the spirit of the Constitution (Seventy-fourthAmendment) Act.
136

8. The models make use of IRS-1A and IRS-1B data with spatial resolution of 72.5mand 36.25m, which has been found to be apt for this purpose. It is noted that planningat the human settlement level requires higher spatial resolution (e.g., 5.8m of IRS-1C), and that these should be more accessible to local government.
9. Through a flexible approach in defining the human settlements and use of imagesfrom satellite, the models are readily applied in 'data-poor' situations, as is the casein many developing countries.
7.4.2 Limitations
The models have five limitations, which are discussed below.
1. The models make the assumption that villages tend to become urban. Whereas theassumption is true for many villages in the region, there are cases where villages arenot growing because of emigration. To establish the number of these cases requiresmigration and growth data for each village.
However, the focus of developing these models was on urban and urbanisingsettlements; therefore, some important villages were incorporated even if they did notshow signs of becoming urban in the near future. Although there may be exceptionsto the urbanisation rule, these exceptions were not deemed to significantly affect theoverall validity of the model.
2. As mentioned above, the focus of developing these models was on urban settlements.In principle, the focus can be extended to include rural settlements, due to theavailability of higher resolution data (e.g., from IRS-1C). However, use of theextended models should only be made at the sub-regional level because of the needfor access to ground truth and related data.
3. Functional characteristics of different human settlements and interaction between themplays an important role in understanding the settlement pattern in a region. However,in practical terms, these cannot be deduced from satellite images under present sensortechnology and interpretation techniques. The models, therefore, are limited tomeasuring the physical extent of human settlements, as visible on satellite images.
4. The models should not be seen as a replacement of traditional models drawing uponsocio-economic and other relevant data. The models should be viewed ascomplimentary to existing models, and a means to bridge gaps created by the non-timely availability of census and other data.
5. Application of 'area patterns', though found more useful than 'point patterns' (seesection 7.2.1), is liable to inconsistency, error and bias in the absence of fullautomatization in its present state.
137

7.5 APPRAISAL OF THE MODELS WITH RESPECT TO THE REGIONAL PLAN2001
The regional plan for the NCR became effective on November 3, 1988 (NCR PlanningBoard, 1988). Two developments, significant to the planned development of the region, haveoccurred since. One, conferring the status of a State to Delhi (The Government of NationalCapital Territory of Delhi Act, 19915 4) and two, the enactment of the Constitution (Seventy-fourth Amendment) Act, 1992 (Government of India, 1993). These developments will maketheir own contributions to shaping the development of the region. These contributions are notdiscussed here. Various national policies5 5 have also influenced in shaping the region andwill continue to do so.
Aims, goals, objectives and tasks specified in the regional plan include the following:
1. "The two important goals to be achieved by the Regional Plan are a balanced andharmoniously developed region, leading to dispersal of economic activities andinmigrants to Delhi, thereby leading to a manageable Delhi." (Foreword to theRegional Plan by the Minister of Urban Development, Government of India; p.iv.);
2. "We need,..development policies, programmes and plans aiming to:...remodel thepattern of settiements in the National Capital Region to enable them to play theirassigned role." (p.ix);
3. "The prime objective of the Regional Plan is to contain Delhi's population size withinmanageable limits.., it is necessary to moderate the growth in the areas around it."(p. 10);
4. "A spatially and functionally articulated settlement system has to be evolved withpurposive development of urban areas of the Region beyond DMA to meet theobjective of controlling the growth of Delhi and achieving balanced development ofthe Region." (p.23);
5. "...to integrate them (the regional urban centres) in a well-knit system of settiementswith specific functions to encourage an orderly development of economic activitiesand increase their complementarity." (p.23);
6. "...the development of small urban centres and villages should be integrated inrelation to priority towns5 6 to achieve the objective of balanced development of theRegion. These could be achieved by developing a four tier hierarchical system ofsettlements..." (pp.23-24, footnote added);
5 4 Effective a s o n January 2 , 1992 ( G o y e l , 1 9 9 3 ) .
5 5 S e e Gnaneshwar (1995 ) for a comprehens ive r e v i e w of various urban and urbanisation pol ic ies in India.
Meerut , Hapur, Bulandshahr-Khurja, Palwal , Panipat, Rohtak, Rewari -Dharuhera-Bhiwadi and Alwar ( N C R
Planning Board , 1988 , p . 2 6 ) .
138
Gerritsen
Typewritten Text
Gerritsen
Typewritten Text
_______________________________________________________________
Gerritsen
Typewritten Text
Gerritsen
Typewritten Text
54
Gerritsen
Typewritten Text
Gerritsen
Typewritten Text
Gerritsen
Typewritten Text
55
Gerritsen
Typewritten Text
Gerritsen
Typewritten Text
56
Gerritsen
Typewritten Text
Gerritsen
Typewritten Text
7. "The main issue to be resolved is about dovetailing the planning and development inthe rural areas along with urban areas. The concept of the development of theNCR...has to integrate and harmonize the development of the rural areas also."(p.117); and
8. "future urban and major rural settlements indicating their areas, projected population,predominant economic functions, approximate site and location;" (p. 129).
Concerning the Regional Plan 2001, it is important to understand that the National CapitalRegion is a nodal region. It has been conceived, delineated and planned as a region withDelhi as its node. By virtue of its nature, as a capital region, it will continue to be a nodalregion. Therefore the term 'balanced and harmonious development' should not bemisinterpreted.
The functional classification of the (census) towns based on the 1981 census (see Table 7.2)shows that more and more towns are assuming diverse functions and being labelled as'others'. Therefore, the identification of a system of human settlements with specificfunctions seems to be a rather difficult task. Moreover, the present system of allocatingfunctions to individual towns is not in conformity with the objective of 'integration', whichis discussed below.
Integration of the development of small urban centres and villages in relation to prioritytowns is a recognised objective. However, this objective is defeated by adopting a hierarchical system of settlements, thereby dealing with a service centre as being distinct andseparate from a regional centre. Adopting the concept of CBAs, delineated on the basis ofsatellite images regardless of settlement's urban/ rural character, promotes the desiredintegration.
In this context, an important statement from the regional plan deserves mention here. "In ourdemocratic system, migrants do not feel bound by physical boundaries of the States while ouradministrative, development planning and resource allocation systems operate within thelimits of territorial boundaries. The operation of this system...has acted as an obstacle in theintegrated and balanced development of the Region..." (NCR Planning Board, 1988, p.vii).The proposed models address this obstacle by adopting a real world definition of humansettlements, providing periodic revisions (through satellite images), and by recommendingformation of couple human settlements where this is relevant. By adopting reality-baseddefinitions of human 'settlements', the models take into account informal and fringe areadevelopments, which are generally overlooked by adhering to the administrative boundaries.
Conferring the status of a State to Delhi (The Government of National Capital Territory ofDelhi Act, 1991) and the enactment of the Constitution (Seventy-fourth Amendment) Act,1992 (Government of India, 1993) will not only play a role in shaping the future developmentof the region but also effect its management structure. Although it is beyond the scope of thisresearch to develop management aspects of the proposed models, it is important to quote a statement from the regional plan in this context. "A review of the existing planning andimplementation arrangements shows a varied pattern in the three participating States and theUnion Territory of Delhi (since renamed as the National Capital Territory of Delhi).However, none of the existing arrangements has been found to be fully compatible to fulfil
139

the needs of taking up the balanced and integrated development of the concerned Sub-regionsat the field level, which could encompass both the rural and urban areas." (NCR PlanningBoard, 1988, p. 116).
7.6 FURTHER WORK
In research, the horizon recedes as one advances (Pattison, 1891). On the horizon of thisresearch the following topics for further research have been identified.
1. Identification and/or development of standard techniques of image processing andenhancement that could be applied universally in the region, thereby promotingopportunities for automatization.
2. Automatization of the image interpretation and delineation of 'assemblage' and'couple' human settiements to ensure consistency.
Steps 1 and 2 above will reduce the time input, thereby freeing time for analysis.
3. Automatization of 'point' and 'area' pattern recognition techniques, based upon theproposed delineation, so that the entire process, from satellite raw data to the patternrecognition, can be automated.
Exploitation of the techniques of (spectral) pattern recognition and (spectral)clustering presently used in the digital image processing; for recognizing, classifyingand analyzing spatial settlement patterns might bring useful results.
4. Extension of the models to include other human settiements (i.e., villages) in theregion and, ultimately, other regions.
Steps 1-4 require the adoption of a set of rules, based on case studies. Sample surveysfor establishing ground truth will be required. Automation of the balance of theprocess will enable scenarios to be generated more often, thus providing inputs, ona more frequent basis, for taking planning decisions.
5. Undertaking of research after a modification of existing concepts of density ofpopulation in urban areas, so as to be better prepared to address problems arisingfrom potential increases in urban population densities in the region and beyond.
140

T a b l e 7.1 P O P U L A T I O N A N D G R O W T H R A T E O F T O W N S I N T H E N A T I O N A LC A P I T A L T E R R I T O R Y (NCT) O F D E L H I
S . N A M E O FN O . T O W N
1. D E L H I C I T Y
2 . S U L T A N P U R M A J R A *3 . P A L A M *4 . B H A L S A W A J A H A N G I R P U R *5 . N A S I R P U R *6 . N A N G L O I J A T *7 . G O K A L P U R *8 . B A B A R P U R *9. B I N D A P U R *
10. TIGRI*
11 . D E O L I *12. P A T P A R G A N J (Gharonda N e e m Ka)*13. M O L A R B U N D *14. J A F F A R A B A D *15. M U N D K A *16. P U L P E H L A D P U R *17. D I C H O N K H U R D *18. RAJKORI*19 . S U L T A N P U R *20 . N A N G A L D E W A T *2 1 . G H I T O R N I *2 2 . TAJ P U L *2 3 . A Y A N A G A R *2 4 . R A N G P U R I *
T O T A L D E L H I U R B A N A G G L O M E R A T I O N
2 5 . B A W A N A * *2 6 . A L I P U R * *2 7 . P O O T H K H U R D * *2 8 . K ANJ HA W A L A * * 2 9 . A S O L A * *3 0 . P E H L A D P U R B A N G E R * *
T O T A L N A T I O N A L C A P I T A L T E R R I T O R YO F D E L H I ( U R B A N )
P O P U L A T I O N G R O W T H R A T Ein 1991 1 9 8 1 - 9 1
7 . 6 0 2 , 3 9 4 45
1 1 1 , 5 6 7 999 8 , 9 7 5 1879 5 , 0 6 5 3 58 1 , 3 6 6 2357 6 , 0 6 3 1 0 24 9 , 1 8 6 2284 7 , 4 5 1 1163 6 , 1 4 8 2893 4 , 4 1 6 993 3 , 2 1 4 4732 2 , 9 4 5 2991 9 , 6 2 9 2681 7 , 4 9 2 S1 7 , 3 8 0 ;401 4 , 3 4 3 631 3 , 8 7 0 1701 1 , 7 6 6 1048 ,365 1007 , 6 5 7 - 36 , 2 5 4 335 , 8 8 2 194 , 4 0 5 -73 , 2 5 1 -23
8 , 4 1 9 , 0 8 4 4 9
1 8 , 9 9 9 509 , 2 5 6 378 , 2 9 3 166 , 1 0 0 185 ,061 - 24 , 8 3 2 -3
8 , 4 7 1 , 6 2 5 4 9
* Included in Delhi Urban Agglomerat ion . T h e s e towns exper ienced an average Growth Rate of 118%between 1 9 8 1 - 9 1 .
•* No t included in Delhi Urban Agglomerat ion but located within National Capital Territory of De lh i . Thesetowns exper ienced an average Growth Rate of 2 5 % between 1 9 8 1 - 9 1 .
Source ( s ) :
for population and rate of growth - C e n s u s of India, 1 9 9 1 ;for locat ion - D D A , 1994.
141

T a b l e 7 .2 P O P U L A T I O N , G R O W T H R A T E A N D F U N C T I O N A L C L A S S I F I C A T I O N O F T O W N SI N T H E N A T I O N A L C A P I T A L R E G I O N ( N C R ) O F D E L H I(Arranged in descending order of population in 1991)
N A M E O FT O W N
P O P U L A T I O Nin 1 9 9 1 ®
G R . R T . Q
1981-91F U N C T I O N A L C L A S S I F I C A T I O N -J( B a s e d o n 1 9 7 1 - 8 1 C e n s u s *
D E L H I U . A . * * * * ( 6 1 ) 8 , 4 1 9 , 0 8 4 46 Others
M E E R U T U . A . ( 6 1 ) 8 4 9 , 7 9 9 58 Others , IndustryF A R I D A B A D ( 6 1 ) 6 1 7 , 7 1 7 S6 Industry, OthersG H A Z I A B A D U . A . ( 6 1 ) 5 5 4 , 5 0 6 9 3 OthersR O H T A K ( 6 1 ) 2 1 6 , 0 9 6 29 Others, Trade , C o m m e r c eA L W A R ( 6 1 ) 2 1 0 , 1 4 6 44 OthersP A N I P A T ( 6 1 ) 1 9 1 , 2 1 2 3S Industry, Trade , C o m m e r c e , OthersN O I D A ( 9 1 ) 1 4 6 , 5 1 4 - Industry**H A P U R ( 6 1 ) 1 4 6 , 2 6 2 4 : Trade , C o m m e r c e , Industry, OthersS O N I P A T ( 6 1 ) 1 4 3 , 9 2 2 3 1 Industry, Trade , C o m m e r c e , OthersG U R G A O N ( 6 1 ) 135 ,884 34 OthersB U L A N D S H A H R (61) 127 ,201 22 Others , Trade, C o m m e r c e , IndustryM O D I N A G A R ( 6 1 ) 1 0 1 , 6 6 0 29 Industry, Others
K H U R J A ( 6 1 ) 8 0 , 3 0 5 \9 Industry, Trade , C o m m e r c e , OthersR E W A R I ( 6 1 ) 7 5 , 3 4 2 46 Trade , C o m m e r c e , Others , IndustryB A R A U T ( 6 1 ) 6 7 , 7 0 5 4 6 Trade , C o m m e r c e , Industry, OthersS I K A N D R A B A D ( 6 1 ) 6 0 , 9 9 2 41 Industry, Primary, Trade , C o m m e r c eP A L W A L ( 6 1 ) 5 9 , 1 6 8 2 5 Others , Trade, C o m m e r c e , IndustryB A H A D U R G A R H ( 6 1 ) 5 7 , 2 3 5 5 2 Others , Industry, OthersM A W A N A ( 6 1 ) 5 1 , 7 0 1 3 7 Diversif iedP I L K H U A ( 6 1 ) 5 0 , 1 6 2 3 2 Industry, Others
M U R A D N A G A R ( 6 1 ) 4 4 , 3 9 5 ~0 Industry, Trade, C o m m e r c e , Primary-S A R D H A N A ( 6 1 ) 4 2 , 9 8 0 4 2 Industry, Primary, Trade , C o m m e r c eJ A H A N G I R A B A D ( 6 1 ) 3 7 , 9 8 1 29 Primary, Industry, Trade , C o m m e r c eLONI(81) 3 6 , 5 6 1 256 OthersK H E K R A ( 8 1 ) 3 5 , 1 9 1 40 OthersG U L A O T H K 6 1 ) 3 3 , 9 8 2 39 Trade , C o m m e r c e , OthersD A D R I ( 6 1 ) 3 2 , 8 8 3 66 Others , Trade , Commerce , Indus tryG O H A N A ( 6 1 ) 3 2 , 4 9 6 2 4 Trade , C o m m e r c e , Primary, OthersB E T A H A Z I P U R ( 9 1 ) 3 0 , 3 6 0 - -S I A N A ( 6 1 ) 2 9 , 8 8 8 33 Primary, Trade , C o m m e r c e , OthersS H I K A R P U R ( 6 1 ) 2 9 , 1 9 7 35 Primary, Industry, OthersD E B A L ( 6 1 ) 2 7 , 7 2 1 23 Industry, Trade , C o m m e r c e , PrimaryJHAJJAR(61) 2 7 , 6 9 3 14 Primary, Trade , C o m m e r c e , OthersH O D A L ( 6 1 ) 2 5 , 6 3 5 36 Diversif iedG A R H M U K T E S H W A R ( 6 1 ) 2 5 , 2 4 1 4 0 Primary, Industry, OthersB A G H P A T ( 6 1 ) 2 4 , 9 3 9 4 5 Primary, OthersK H A I R T H A L ( 7 1 ) 2 2 , 7 4 1 4 2 Primary, Trade , C o m m e r c e , OthersJEWAR(81) 2 1 , 3 7 6 39 OthersG A N A U R ( 7 1 ) 2 0 , 9 5 2 2 7 Industry, Trade, C o m m e r c e , Others
A N U P S H A H R ( 6 1 ) 1 9 , 6 8 4 29 Others , Industry, PrimaryKITHOR(81) 1 9 , 2 7 0 39 PrimaryB A W A N A * * « ( 8 1 ) 18 ,999 5 0 OthersS A M A L K H A ( 8 1 ) 1 8 , 3 8 4 3 5 OthersD A S N A ( 9 1 ) 16 ,963 - -S O H N A ( 6 1 ) 1 6 , 3 4 8 12 Trade , C o m m e r c e , Industry, Others
142

N A M E O FT O W N
P O P U L A T I O N G R . R T . 0i n 1 9 9 1 ® 1 9 8 1 - 9 1
F U N C T I O N A L C L A S S I F I C A T I O N .fc( B a s e d on 1971-81 Cen s u s * )
B E H R O R ( 9 1 ) 1 6 , 2 3 8 -C H H A P R A U L I ( 8 1 ) 1 6 , 0 0 8 15 PrimaryN A R A U R A ( 8 1 ) 1 5 , 6 5 2 63 OthersA U R A N G A B A D ( 8 1 ) 1 5 , 4 0 2 32 Others , PrimaryT U A R A ( 8 1 ) 15 ,399 2 6 Others
B H I W A D I ( 9 1 ) 15 ,285 - Industry**M A H A M ( 6 1 ) 1 5 , 0 8 3 28 Primary, Trade , C o m m e r c e , OthersH A S T I N A P U R ( 7 1 ) 15 ,081 29 Industry, OthersK A L A N A U R ( 8 1 ) 1 4 , 5 2 4 17 OthersBERI(61) 1 4 , 5 0 8 7 Primary , OthersL A W A R ( 8 1 ) 14 ,471 25 Primary, OthersS E W A L K H A S ( 8 1 ) 1 4 , 4 0 2 40 PrimaryP H A L A U D A ( 8 1 ) 1 3 , 9 7 0 34 PrimaryP A R I K S H r T G A R H ( 8 1 ) 1 3 , 6 7 7 20 OthersB E G U M B U D H A N A ( 9 1 ) 13 ,509 - -H A I L E Y M A N D I ( 6 1 ) 13 ,263 30 Trade , C o m m e r c e , OthersP A H A S U ( 6 1 ) 1 3 , 1 2 7 45 OthersO . F . M U R A D N A G A R ( 7 1 ) 1 2 , 7 9 2 -2 OthersTIKR1(81) 1 2 , 7 8 4 12 PrimaryT A O R U ( 8 1 ) 1 2 , 5 3 4 Bl Primary, Industry, Others
S H A H J A H A N P U R ( 6 1 ) 12 ,443 40 Primary, IndustryF E R O Z E P U R Jf f lRKA(61) 1 2 , 4 1 3 3 2 Primary, Trade , C o m m e r c e , Industry
P A S A U N D A ( 8 1 ) 1 2 , 3 8 7 - -D O G H A T ( 8 1 ) 12 ,309 22 PrimaryK H A N P U R ( 8 1 ) 1 1 , 4 2 0 37 PrimaryP A T A U D I ( 6 1 ) 1 1 , 2 7 8 33 Primary, OthersB U G R A S I ( 6 1 ) 1 1 , 0 9 3 33 Primary, Industry, OthersK A R N A W A L ( 8 1 ) 1 1 , 0 4 7 11 PrimaryF A R I D N AG A R ( 6 1 ) 1 0 , 9 4 0 20 Industry, Primary, OthersA G A R W A L M A N D I ( 8 1 ) 10 ,871 '.6 Primary, OthersD H A R U H E R A ( 9 1 ) 1 0 , 8 4 8 - Industry**
R A B U P U R A ( 8 1 ) 1 0 , 7 6 9 19 Primary, OthersK H A R K H O D A ( 8 1 ) 1 0 , 5 5 0 21 Primary, Others
K A L C H H I N A ( 9 1 ) 10 ,373 - -D A U R A L A ( 8 1 ) 10 ,025 9 Primary
D A N K A U R ( 6 1 ) 9 ,531 20 Others , Trade, C o m m e r c e , Industry-
A L I P U R * * * ( 8 1 ) 9 , 2 5 6 3 7 OthersP A T A L A t ( 8 1 ) 9 ,181 17 Primary
B . B A H A D U R N A G A R ( 8 1 ) 9 ,101 34 Others , PrimaryB A H S U M A ( 8 1 ) 9 , 0 6 0 14 PrimaryB A W A L ( 6 1 ) 9 , 0 1 0 16 Primary, OthersN I W A D I ( 8 1 ) 8 ,841 24 PrimaryP U N A H N A ( 9 1 ) 8 , 6 7 9 - -R 0 R I ( 9 1 ) 8 , 4 7 3 - -P O O T H K H U R D * * * ( 8 1 ) 8 , 2 9 3 16 OthersA M I N A G A R S A R A I ( 7 1 ) 8 , 2 7 4 21 Industry, Trade , C o m m e r c e , OthersJ A H A N G I R P U R ( 8 1 ) 8 , 2 0 6 27 Primary, OthersC H H A T A R J ( 8 1 ) 8 , 2 0 2 39 PrimaryF A R R U K H N A G A R (61) 8 , 0 4 6 26 Primary, Trade , C o m m e r c e , Industry
H A T H I N ( 8 1 ) 7 , 8 6 3 19 Primary, OthersKHERI S A M P L A ( 9 1 ) 7 , 8 3 8 - -N U H ( 6 1 ) 7 , 4 9 2 25 Trade , C o m m e r c e , OthersD U J A N A ( 9 1 ) 7 , 3 1 3 - -H A S S A N P U R ( 8 1 ) 7 , 1 3 0 39 Primary, Others
143

N A M E O FT O W N
P O P U L A T I O Nin 1 9 9 1 ®
G R . R T . Q1 9 8 1 - 9 1
F U N C T I O N A L C L A S S I F I C A T I O N .J(Based on 1971-81 C e n s u s * )
D U N D A H E R A ( 9 1 ) 6 , 7 6 7 - -B I L A S P U R ( 8 1 ) 6 , 1 2 7 31 OthersK A N J H A W A L A * * * ( 9 1 ) 6 , 1 0 0 - -K A K 0 D ( 8 1 ) 5 , 8 3 8 3 5 Others , PrimaryA S O L A * * * ( 9 1 ) 5 ,061 - -
P E H L A D P U R B A N G E R « * * ( 8 1 ) 4 , 8 3 2 -3 OthersB A B U G A R H ( 8 1 ) 3 , 5 8 1 49 Others
N o t e s :
Assandh, Bisokhar and Razapur were also listed as towns in the Census of India, 1 9 9 1 . H o w e v e r , their locationcould not be conf irmed from any official source(s) and therefore omitted from analysis .
In case of varying spel l ings of town names from different data sources , the spel l ings used by the C e n s u s of India,1 9 9 1 , have been adopted here .
(61) Declared a town in 1961 or before .(71) Declared a town in 1 9 7 1 .(81) Declared a town in 1 9 8 1 .(91) Declared a town in 1 9 9 1 .
• N a m e d as 'Patla' in the Topo-Shee t (Survey of India, 1980) and 'Patiala' in the regional plan ( N C RPlanning Board, 1988)
• Functional classif ication for 1991 not yet avai lable .A n e w l y added town. Classif ication based on local k n o w l e d g e .
*** Within the National Capital Territory ( N C T ) of De lh i .• * * * Delhi U . A . includes 23 towns other than Delhi (see Table 7 . 1 ) .
S o u r c e ( s ) :
® Census of India, 1 9 9 1 .# N C R Planning Board, 1 9 8 8 , pp . 1 4 0 - 1 4 2 .(61) T C P O , 1 9 7 4 , p . 3 4 .(71) N C R Planning Board, 1 9 8 8 , pp. 1 4 0 - 1 4 2 .(81) N C R Planning Board, 1 9 8 8 , pp. 140 -142 .
(91) Census of India, 1991 .
144

T a b l e 7 3 T R A N S P O R T D E M A N D F O R E C A S T * B E T W E E N C I T Y P A I R S * * , 2 0 0 1 ,N A T I O N A L C A P I T A L R E G I O N O F D E L H I
S . N o . C I T Y P A I R S N U M B E R O F P A S S E N G E RB U S R A I L
1. D E L H I - F A R I D A B A D 5 8 , 6 6 2 1 6 , 1 4 92 . D E L H I - P A L W A L 11 ,101 2 , 2 3 23 . F A R I D A B A D - P A L W A L 1 7 , 6 9 2 8 , 3 4 44 . D E L H I - S O N I P A T 5 , 1 5 0 2 5 , 4 8 45 . D E L H I - P A N I P A T 4 , 4 2 6 5 , 1 1 36 . PANTPAT - S O N I P A T 1 8 , 4 0 5 6 , 3 2 97 . D E L H I - B A H A D U R G A R H 2 0 , 3 1 7 15 ,8118. D E L H I - R O H T A K 8 , 4 4 2 5 , 9 4 29. B A H A D U R G A R H - R O H T A K 9 , 0 9 6 4 , 9 8 810. H A P U R - B U L A N D S H A H R 1 9 , 9 8 5 1,676; ; . D E L H I - R E W A R I 3 , 5 3 9 7 , 4 1 51 2 . P A N I P A T - R O H T A K 3 , 1 4 0 1,0081 3 . M E E R U T - H A P U R 3 1 , 6 2 9 2 , 2 1 414 . G H A Z I A B A D - H A P U R 4 9 , 4 6 3 1,56815 . M E E R U T - G H A Z I A B A D 2 3 , 2 8 6 3 , 9 7 8
16 . D E L H I - M E E R U T 1 7 , 2 4 0 1 1 , 5 0 8
17. D E L H I - G H A Z I A B A D 1 0 1 , 6 6 9 5 1 , 1 6 418. D E L H I - H A P U R 2 1 , 0 1 8 2 , 5 0 019. M E E R U T - B U L A N D S H A H R 13,771 2 , 1 4 5
20 . S O N I P A T - R O H T A K 6 3 9 -2 1 . F A R I D A B A D - R O H T A K 904 -2 2 . B A H A D U R G A R H - R E W A R I 2 1 2 -2 3 . G H A Z I A B A D - B U L A N D S H A H R 2 8 , 6 7 2 -
* Based upon:
i. D e m a n d for travel by bus and rail be tween the city pairs.
ii. Populat ion and manufacturing e m p l o y m e n t in the cit ies under study.
ii i . Travel time and travel cost by bus and rail, including acces s t ime , wait ing t ime, acces s cost andfare of the travel .
** Out of the 64 poss ible city pairs in the region, only above mentioned city pairs were considered to besignificant.
Source : Ba ig , 1 9 9 1 , p p . 7 5 - 7 6 .
145

T a b l e 7 . 4 P O P U L A T I O N A N D R A T E O F G R O W T H O F C O R R I D O R T O W N S ( E X C L U D I N GD E L H I ) I N T H E N A T I O N A L C A P I T A L R E G I O N O F D E L H I
C O R R I D O RN O .
T O W N S I N C L U D E D P O P U L A T I O N1991
G R . R T .1981-91
II.
III.
I V .
V.
VI.
v n .
v m .
IX.
x.XI.
Ghaziabad, O . F . Muradnagar,Muradnagar , B e g u m Budhana,Kalchhina, M o d i n a g a r , Rori,Meerut U . A . , Daurala
Ghaziabad, Dasna , Pi lkhua,Hapur, Babugarh,Garhmukteshwar
Ghaziabad, Dujana, Dadri ,Sikandrabad, Bulandshahr,Khurja
Faridabad, Pa lwal , Hodal
Gurgaon, Dundahera, Dharuhera,Bhiwadi , Bawal , Behror
Gurgaon , Sohna, N u h ,Ferozepur Jhirka, Alwar
Bahadurgarh, Kheri Sampla ,Rohtak, Maham
Sonipat , Ganaur, SamalkhaPanipat
Loni , Beta Hazipur, Khekra,Agarwal Mandi , Baghpat , Baraut
Panipat, Gohana, Rohtak
Meerut U . A . , Kharkhoda,Hapur, Gulaothi , Bulandshahr,Khurja
All Corridor T o w n s (exc luding Delhi andother towns in the National CapitalTerritory of Delhi )
Rest of the T o w n s (exc luding Delhi andother towns in the National CapitalTerritory of Delhi)
1 , 6 0 5 , 7 1 2
7 9 6 , 7 1 5
8 6 3 , 1 5 0
7 0 2 , 5 2 0
3 5 1 , 6 3 1
3 8 2 , 2 8 3
2 9 6 , 2 5 2
3 7 4 , 4 7 0
2 0 5 , 6 2 7
4 3 9 , 8 0 4
1 , 2 4 8 , 0 9 9
4 , 2 4 1 , 9 1 5
9 9 0 , 7 6 6
6 _
7 7
65
77
2 2 4
39
3 7
3 5
90
33
4S
S7
55
S o u r c e ( s ) :
Corridors identification based on T C P O , 1974; N C R Planning Board, 1988 and Ba ig , 1 9 9 1 .Population and growth rate compi led from Census of India, 1 9 9 1 .
146

T a b l e 7 . 5 a
N A M E •
L I S T O F V I L L A G E S ( I N 1991) I D E N T I F I E D A S P O T E N T I A L * T O W N S (IN 2 0 0 1 )
P O P U L A T I O N * (1991)
D A L L O P U R A * 5 6 , 7 8 3
Q A R A W A L N A G A R * 4 7 , 4 5 5I I A S T S A L * 3 9 , 5 9 6KIRARI S U L E M A N N A G A R * 3 3 , 4 2 1M U S T A F A B A D * 3 2 , 2 2 5P O O T H K A L A N * 2 8 , 7 6 7S A H I B A B A D - D A U L A T P U R * 2 7 , 3 4 3
N A W A D A M A J R A H A S T S A L * 1 8 , 1 0 0B U R A R I * 1 7 , 5 8 7C H I L L A S A R O D A B A N G A R * 1 6 , 4 6 0D A B R I * 16 ,405KHAJOORI K H A S * 1 6 , 3 3 4P A N I P A T T A R A F A N S A R ® 1 4 , 9 5 3S A L W A N V 14 ,803B H A T I * 1 4 , 3 2 6M A T I A L A * 1 4 , 0 0 2D H A R O T I K H U R D 1 3 , 3 2 4K O N D L I * 1 3 , 3 1 7P A L W A L ( R U R A L ) ® 1 2 , 4 6 9S A L A R P U R K H A D A R 1 2 , 3 3 8P A N I P A T T A R A F M A K H D U ® 1 2 , 0 7 8C H A T T A R P U R * 1 1 , 8 1 5J H A R O D A K A L A N * 1 1 , 6 8 5M I R Z A P U R * 1 1 , 5 7 7G H A R O L I * 1 1 , 1 8 7MIR P U R T U R K * 1 1 , 1 3 5N A H R I 1 0 , 1 9 6B A N K N E R * 1 0 , 1 5 2
S A D A T P U R G U J A R A N * 9 , 9 6 7B I J W A S A N * 9 , 4 3 9
M I T H E P U R * 9 , 2 1 2L A D R A W A N 9 , 1 0 8Q A M U R U D D B S N A G A R * 8 ,356K A K R O L A * 8 , 2 8 4S O N I P A T ( R U R A L ) ® 8 , 1 9 3R A M G A R H 8 , 1 1 1K A P A S H E R A * 7 , 8 1 5Q U T A B G A R H * 7 , 7 3 4C H H A W L A * 7 , 5 2 1SIRAS P U R * 7 ,441D U N D A H E D A 7 , 3 5 7LIB AS P U R * 7 , 3 1 3K H E R A K H U R D * 7 , 1 8 2R E W A R I ( R U R A L ) ® 7 , 1 1 1K I S H A N G A R H 6 , 8 0 1D A Y A L P U R * 6 , 6 0 7A S A N K H U R D 5 , 9 7 2J I W A N (JOHART) P U R * 5 , 9 3 7
147
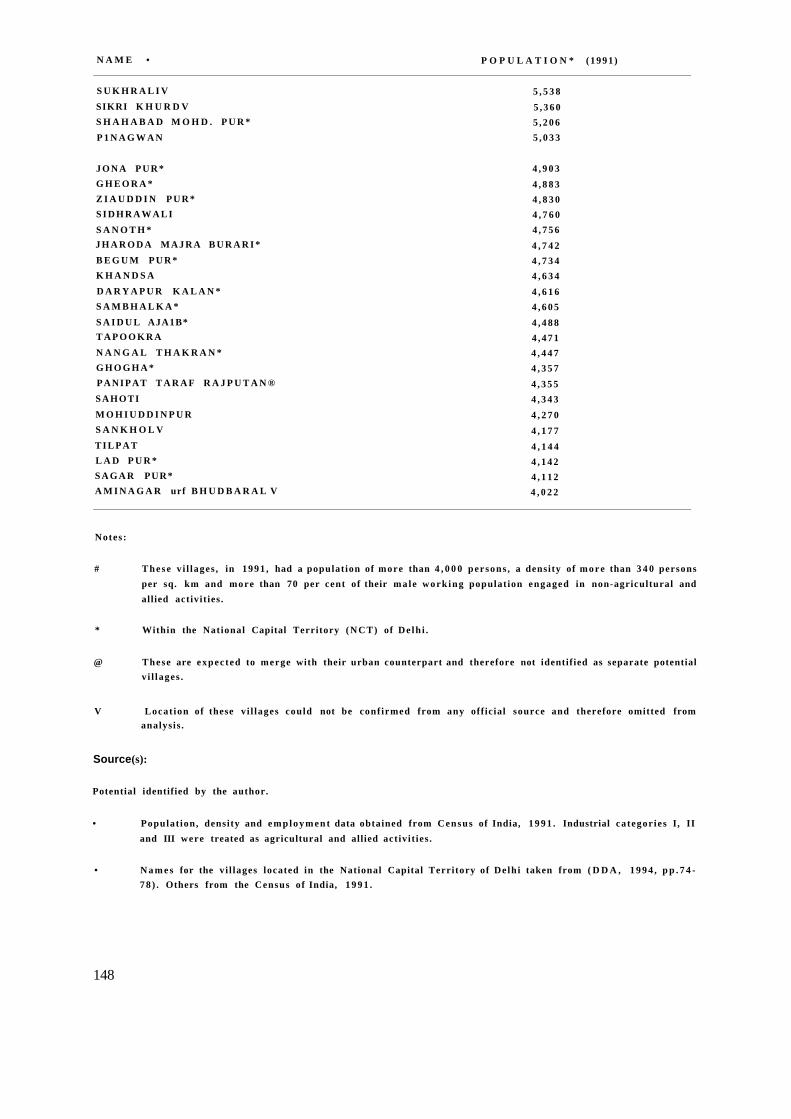
N A M E • P O P U L A T I O N * (1991)
S U K H R A L I V 5 , 5 3 8SIKRI K H U R D V 5 , 3 6 0S H A H A B A D M O H D . P U R * 5 , 2 0 6P 1 N A G W A N 5 , 0 3 3
J O N A P U R * 4 , 9 0 3G H E O R A * 4 , 8 8 3Z I A U D D I N P U R * 4 , 8 3 0S I D H R A W A L I 4 , 7 6 0S A N O T H * 4 , 7 5 6J H A R O D A M A J R A B U R A R I * 4 , 7 4 2B E G U M P U R * 4 , 7 3 4K H A N D S A 4 , 6 3 4D A R Y A P U R K A L A N * 4 , 6 1 6S A M B H A L K A * 4 , 6 0 5S A I D U L AJA1B* 4 , 4 8 8T A P O O K R A 4 , 4 7 1N A N G A L T H A K R A N * 4 , 4 4 7G H O G H A * 4 , 3 5 7PANIPAT T A R A F R A J P U T A N ® 4 , 3 5 5S A H O T I 4 , 3 4 3M O H I U D D I N P U R 4 , 2 7 0S A N K H O L V 4 , 1 7 7T I L P A T 4 , 1 4 4L A D P U R * 4 , 1 4 2S A G A R PUR* 4 , 1 1 2A M I N A G A R urf B H U D B A R A L V 4 , 0 2 2
Notes:
# T h e s e v i l lages , in 1991 , had a population of more than 4 , 0 0 0 persons , a density of m o r e than 3 4 0 personsper sq. km and more than 70 per cent of their male work ing population engaged in non-agricultural andallied activit ies.
* Within the National Capital Territory (NCT) of De lh i .
@ These are expected to merge with their urban counterpart and therefore not identified as separate potentialv i l lages .
V Locat ion of these vi l lages could not be confirmed from any official source and therefore omitted fromanalysis .
Source(s):
Potential identified by the author.
• Populat ion, density and e m p l o y m e n t data obtained from Census of India, 1 9 9 1 . Industrial categories I, IIand III were treated as agricultural and allied act ivit ies .
• N a m e s for the vi l lages located in the National Capital Territory of Delhi taken from ( D D A , 1 9 9 4 , p p . 7 4 -7 8 ) . Others from the Census of India, 1 9 9 1 .
148

T a b l e 7 . 5 b L I S T O F A D D I T I O N A L V I L L A G E S (IN 1991) I D E N T I F I E D A S P O T E N T I A L * T O W N S(IN 2 0 0 1 )
N A M E ( S ) O F P O P U L A T I O N D E N S I T Y % M A L E W O R K E R S I NV I L L A G E ( S ) (1991) p / s q . k m N o n - A g r i c u l t u r e S e c t o r
A T S E N I V 7 , 6 5 6 960 36BArr v 7 , 3 0 3 928 2 7BIHUNI V 2 , 5 4 3 667 18
U C H A G A O N • 8 , 7 5 5 1,314 39A M A R G A R H • 5 , 0 2 3 826 2 3
B A H I N * 5 , 1 5 4 4 3 7 14KOT + 5 , 4 7 5 3 0 " 35
B A H A L G A R H * 1,911 8 3R A T H D H A N A A 6 , 2 0 1 634 44
S H A H A J A H A N P U R 6 , 7 1 3 365 46
Notes :
I These v i l lages were se lected because they satisfied the criteria of CBA and were found to be predominantlylocated whi le interpreting the satellite images .
V These v i l lages are expected to form one town, under the name shown in bold letters.
• T h e s e v i l lages are expected to form one t o w n , under the name shown in bold letters.
• These v i l lages are expected to form one town, under the name shown in bold letters.
• These v i l lages are expected to form one town, under the name shown in bold letters.
S o u r c e :
Potential identified by the author.
Populat ion, densi ty and e m p l o y m e n t data obtained from C e n s u s of India, 1 9 9 1 . Industrial categories I, II and HI weretreated as agricultural and allied act ivit ies .
149

MA
P 7.1
C
EN
SU
S T
OW
NS
IN T
HE
NC
T O
F D
ELH
I, A
ND
IN T
HE
DM
A,
1991
-200
1
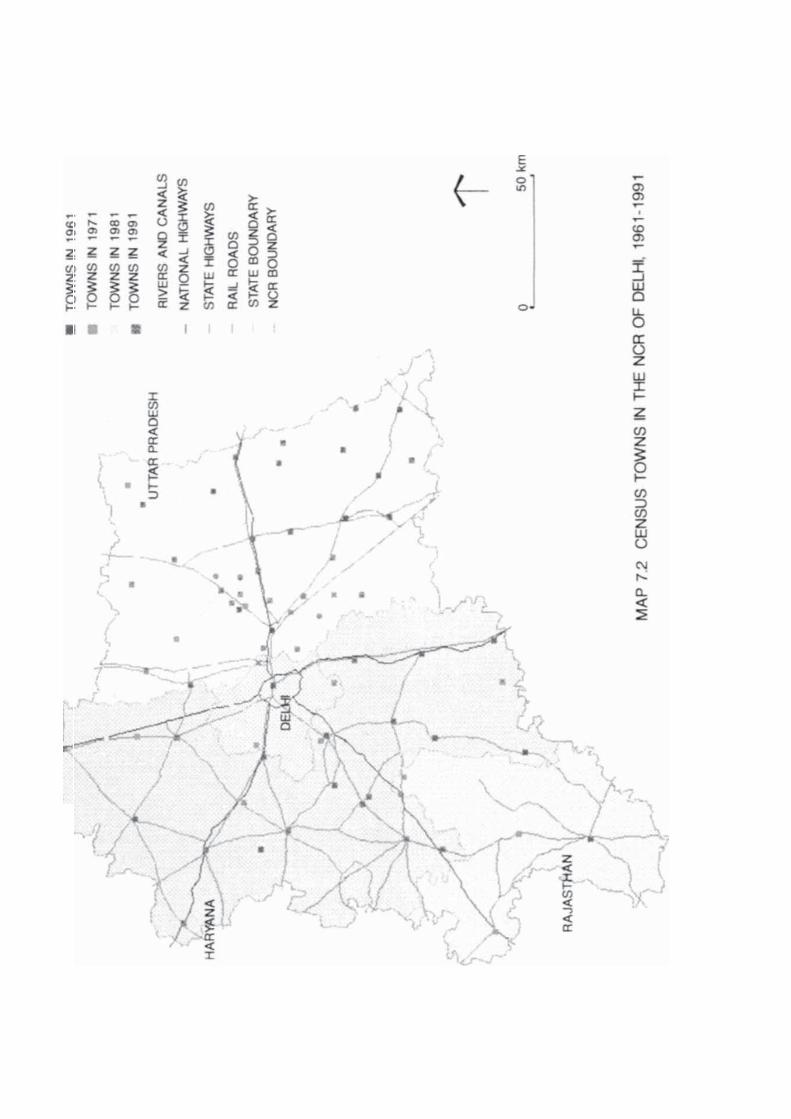

MAP
7.3
CEN
SUS
TOW
NS
AN
D M
AJO
R TR
AN
SPO
RTA
TIO
N C
OR
RID
OR
S IN
TH
E NC
R O
F DE
LHI,
1991

UTTA
R PR
ADES
H
tf TO
WN
S IN
19
61
• TO
WN
S IN
19
71
TOW
NS
IN
1981
• TO
WN
S IN
19
91
RIVE
RS A
ND
CA
NA
LS-
NATI
ONA
L HI
GHW
AYS
STAT
E HI
GHW
AYS
RAIL
RO
AD
SST
ATE
BOUN
DARY
NCR
BOUN
DARY
• 'A
SSEM
BLAG
E'
SETT
LEM
ENTS
• 'C
OUP
LE'
SETT
LEM
ENTS
T 50
km
MA
P 7.
4 S
ET
TL
EM
EN
T P
ATT
ER
N I
N T
HE
NC
R O
F D
ELH
I, 19
61-1
991

WW
NM
nL
|! L
UTT
AR
PRA
DES
HW
iniK
niri
jdM
ll I
%R
I '1M
MW
NM
*«V
IMftH
BI V
,zim
rt>
umm
mn
>,
torn
*5
Vi
7 s
; I
--V
1
RA
JA
ST
HA
N J
iL
.
W
TOW
NS
IN
1961
• TO
WN
S IN
19
71
TOW
NS
IN
1981
W
TOW
NS
IN 1
991
• TO
WN
S IN
200
1 (P
REDI
CTED
)
RIVE
RS A
ND
CA
NA
LS
- N
ATI
ON
AL
HIG
HWAY
S
- ST
ATE
HIG
HWAY
S
RAIL
RO
AD
S
STAT
E BO
UNDA
RY
NCR
BOUN
DARY
MA
P 7.
5S
ET
TL
EM
EN
T P
AT
TE
RN
F
OR
T
HE
NC
R
OF
DE
LH
I,
T SO
ki
19
61
-19
91
, 2
00
1 (P
RE
DIC
TE
D)

• TO
WN
S IN
19
61
• TO
WN
S IN
19
71
TOW
NS
IN
1981
TOW
NS
IN
1991
• TO
WN
S IN
200
1 (P
REDI
CTED
)
RIVE
RS A
ND
CA
NA
LS
- N
ATI
ON
AL
HIG
HWAY
S
STAT
E HI
GHW
AYS
- RA
IL R
OA
DS
STAT
E BO
UNDA
RY
NCR
BO
UN
DA
RY
'ASS
EMBL
AGE'
SET
TLEM
ENTS
• 'C
OU
PLE'
SET
TLEM
ENTS
• 'F
UNCT
IONA
L C
OU
PLE'
SETT
LEM
ENTS
Xiv.
SE
TTLE
MEN
T ID
ENTI
FICA
TIO
N(S
EE
7.3.
2.1,
2,3)
T 50 k
m
MA
P 7.
6 R
ECO
MM
END
ED S
ETTL
EMEN
T PA
TTER
N FO
R TH
E N
CR
OF
DELH
I, 20
01
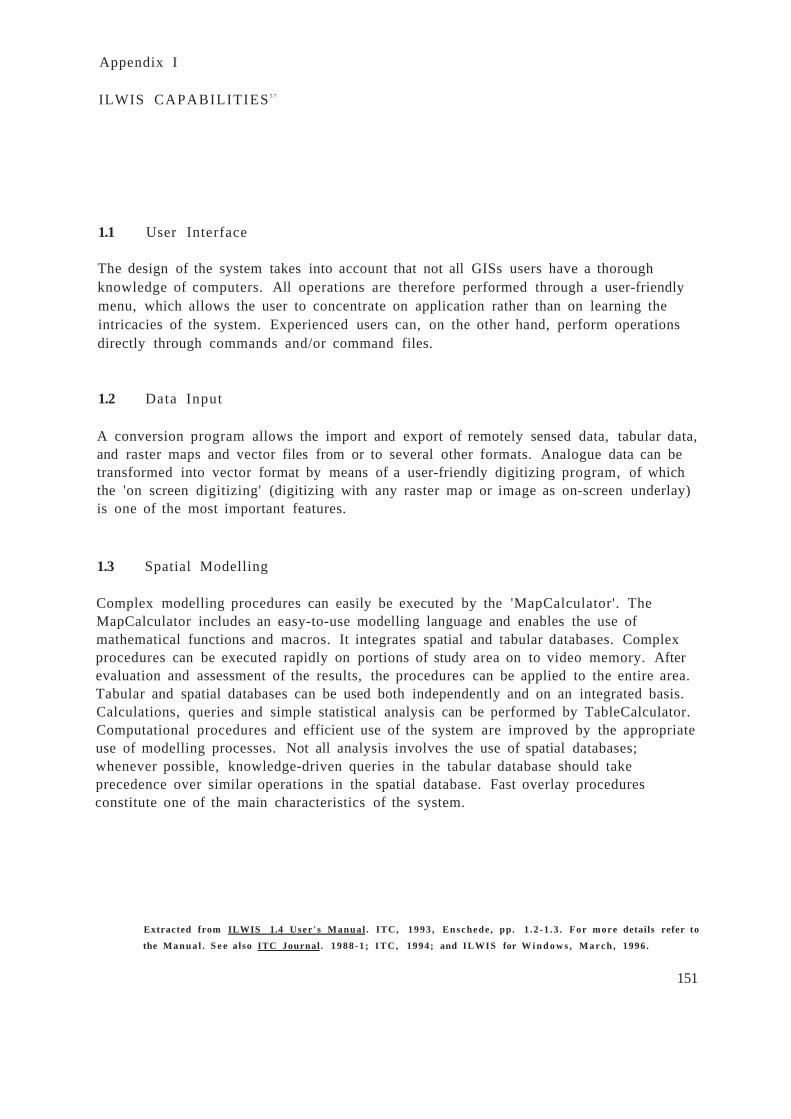
Appendix I
1.1 User Interface
The design of the system takes into account that not all GISs users have a thoroughknowledge of computers. All operations are therefore performed through a user-friendlymenu, which allows the user to concentrate on application rather than on learning theintricacies of the system. Experienced users can, on the other hand, perform operationsdirectly through commands and/or command files.
1.2 Data Input
A conversion program allows the import and export of remotely sensed data, tabular data,and raster maps and vector files from or to several other formats. Analogue data can betransformed into vector format by means of a user-friendly digitizing program, of whichthe 'on screen digitizing' (digitizing with any raster map or image as on-screen underlay)is one of the most important features.
1.3 Spatial Modelling
Complex modelling procedures can easily be executed by the 'MapCalculator'. TheMapCalculator includes an easy-to-use modelling language and enables the use ofmathematical functions and macros. It integrates spatial and tabular databases. Complexprocedures can be executed rapidly on portions of study area on to video memory. Afterevaluation and assessment of the results, the procedures can be applied to the entire area.Tabular and spatial databases can be used both independently and on an integrated basis.Calculations, queries and simple statistical analysis can be performed by TableCalculator.Computational procedures and efficient use of the system are improved by the appropriateuse of modelling processes. Not all analysis involves the use of spatial databases;whenever possible, knowledge-driven queries in the tabular database should takeprecedence over similar operations in the spatial database. Fast overlay proceduresconstitute one of the main characteristics of the system.
Extracted from ILWIS 1.4 User 's Manual . ITC, 1993 , Enschede , pp. 1 .2 -1 .3 . For more details refer to
the Manua l . S e e also ITC Journal. 1988-1 ; ITC, 1994; and ILWIS for W i n d o w s , M a r c h , 1996.
151
ILWIS CAPABILITIES 5 7

1.4 Image Processing
Image processing capabilities integrated with spatial modelling and tabular databasesconstitute a powerful tool. Together they enable analysis of data which has only recentlybeen possible. ILWIS also incorporates conventional image processing capabilities such asfiltering, geometric correction and classification procedures.
1.5 Special Features
For the interpolation of point data and contour lines, special programs are available tocreate DEMs (digital elevation models). Special filters and functions are available toproduce slope and aspect maps. Functions and filters can also be defined by the user.
1.6 Data Output
The system supports black & white and colour hard copy output devices in either vectoror raster format. It supports standard pen plotters, B&W and colour matrix printers andlaser printers. Conversion routines from the ILWIS data formats to a number of otherdata formats (raster, vector, tabular) are provided.
1.7 ILWIS for Windows
ILWIS for Windows is an integrated object oriented geographical information and remotesensing system. It provides for display of raster, point, segment and polygon maps, aswell as tables and graphs in zoomtable and scrollable windows. Display of multiple mapsand annotation layers are provided in one map window. It also provides for simultaneousdata retrieval of multiple maps and attribute tables.
152

Appendix II
PATTERN CURVES FOR FUNDAMENTAL PATTERN TYPESSource: ITC, 1993 , p . 6 . 1 2 9 .
p A l l
c l u s t e r e d r e g u l a r
I
PATTERN CURVES FOR THE SETTLEMENT PATTERN IN THE NCR. 1991
Simulated CSR As Exist ing Simulated Regular
153
Appendix III
HI.l THE RULES
m.1.1 Built-up Area
Topographical sheets from the Survey of India (see Appendix X) were available at a scaleof 1:250,000, appropriate for the research objectives. These topo sheets show large built-up/ inhibited areas in red, in contrast to the general appearance of the topo sheets. Allsuch filled areas were considered to be qualifying as 'Built-up Area' in the first instance.It was a class in dichotomy: built-up/ non built-up.
An 'exclusive' definition was applied: meaning that in case of doubts it was decided to benon built-up. As an example, an area showing urban road network - but not filled in redwas assigned to be non built-up.
HI. 1.2 Minimum Curtilage
A minimum curtilage of 5mm x 5mm and a minimum width of 2.5mm was adopted tostart with. However, subsequently the minimum curtilage adopted was 4mm x 4mm(terrain 1km x 1km or 100 ha) with a minimum width of 2mm (terrain 500m) (see III.2also). Also the built-up areas along major roads (e.g., ribbon developments) wereexcluded if these were narrower than 2mm on the topo sheet. The application was carriedout by preparing a template for the minimum curtilage and minimum width.
III. 1.3 Generalisation, Idealisation and Agglomeration
The minimum curtilage and the minimum width provide the standard for the minimumarea to be delineated. The same standard was also followed for the generalization of thedelineation. The line did not follow the outline of every small or narrow built-up parts butwas generalized along important boundaries of built-up area or along the averageboundary of built-up areas. The manual generalization process is though subjective,interactive and idiosyncratic, yet comprehensive in its perception and execution(Beissmann, 1993).
The technique of idealization was used to make a boundary between the two entities'built-up' and 'non built-up', where in reality only a diminishing density of built-up areacan be seen on the topo sheet. Here also the template of minimum curtilage and minimumwidth was used.
154
OPERATIONAL DEFINITION AND DELINEATION OF CONTINUOUSLYBUILT-UP AREAS IN THE NCR OF DELHI
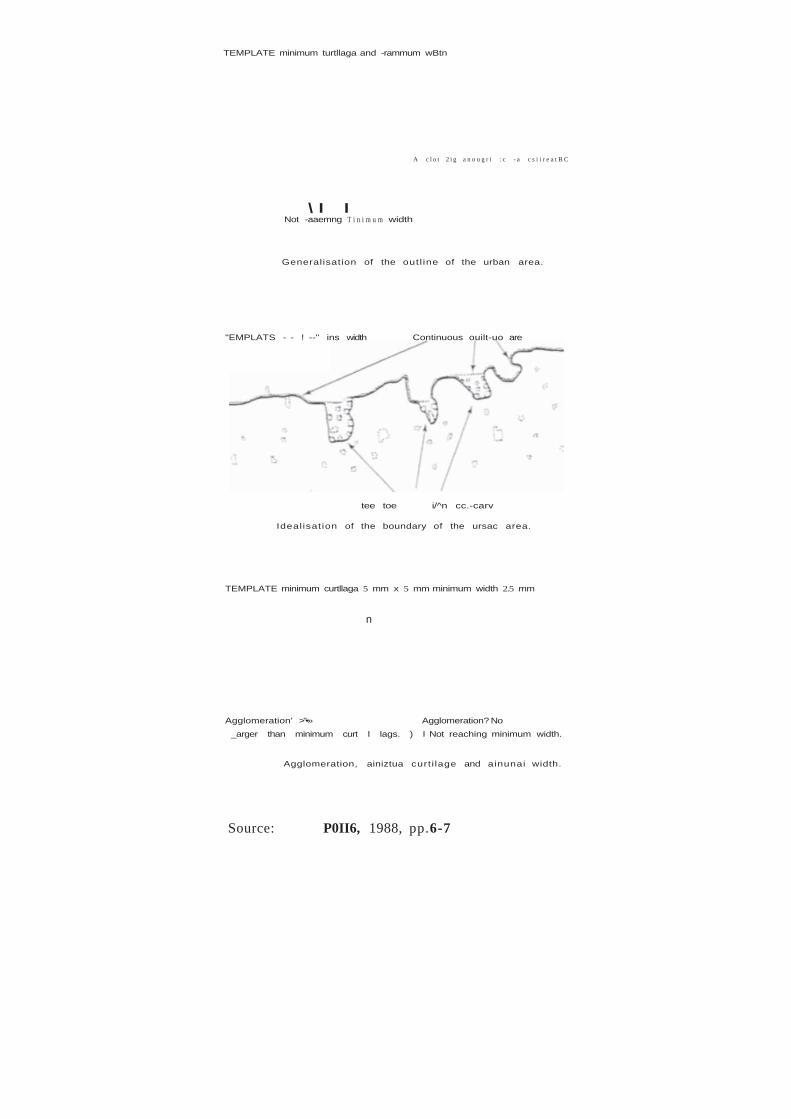
TEMPLATE minimum turtllaga and -rammum wBtn
A c l o t 2 i g a n o u g r i : c - a c s i i r e a t B C
\ I I Not -aaemng T i n i m u m width
Generalisation of the out l ine of the urban area.
"EMPLATS - - ! --" ins width Continuous ouilt-uo are
tee toe i/^n cc.-carv
Ideal isat ion of the boundary of the ursac area.
TEMPLATE minimum curtllaga 5 mm x 5 mm minimum width 2.5 mm
n
Agglomeration' >"•» Agglomeration? No_arger than minimum curt I lags. ) I Not reaching minimum width.
Agglomeration, ainiztua curt i lage and ainunai width.
Source: P0II6, 1988, pp.6-7

A small built-up area (smaller than the minimum curtilage) is generally combined with a nearby built-up area, if the distance to that area is less than twice the diameter of thesmall built-up area (measured in the direction of that other built-up area). The process isrepeated. The final delineation must fulfil the conditions of the minimum curtilage and theminimum width. The area delineated in this way should not contain non built-up areaslarger than the minimum curtilage. However, no such agglomeration possibilities wereencountered in the current exercise.
The above described rules were developed after Polle" (1988) and Mahavir and Galema(1991), with a possibility of being applied consistently while repeating the exercise onsatellite images.
HI. 1.4 Other Rules
Two other situations were expected in the delineation of built-up areas. In the firstsituation, there are two distinct built-up areas, both separately satisfying the minimumcurtilage but very close to each other. It was decided to combine them into one if theboundary to boundary distance between them was less than the minimum width criteria.As an illustration, eastern part of Delhi was separated from the main Delhi, because ofthe river Yamuna (wider than minimum width criteria). However, the same was combinedwith Ghaziabad, because the distance between the two was less than the minimum widthcriteria.
In the second situation, there is a distinct non built-up area, larger than the minimumcurtilage criteria but surrounded by a built-up area also satisfying the minimum curtilagecriteria. It was decided to ignore the inner non built-up area in this situation and take theboundary of surrounding built-up area. An illustration of this is central ridge area ofDelhi surrounded by its main built-up areas.
There still could be a situation where a very large non built-up area is surrounded by a ring of built-up area. However, such a situation is neither present nor expected in theregion under study.
Built-up areas thus obtained after application of all above mentioned rules were acceptedas Continuously Built-up Areas (CBAs).
III. 1.5 Local Knowledge Biases
The author possesses considerably good local knowledge on the region. This may beviewed as a source of bias in application of above rules when the delineation is beingdone on topo sheets. The same can be eliminated by applying the rules very strictly andrepeating the process by another qualified person not familiar with the region. The biaswill be minimized, if not eliminated, during the computerized processing of satelliteimages. However, possession of local knowledge will be a valuable asset whileinterpreting the satellite images (Mahavir and Galema, 1991).
156

ni .2 DELINEATION
A minimum curtilage of 5mm x 5mm and a minimum width of 2.5mm was adopted tostart with. Based upon the above rules, 17 CBAs were delineated5 8 on the Survey ofIndia topo sheets covering the region. While a few of the remaining human settiementswere smaller than the minimum curtilage, a few others did not qualify the minimumwidth criteria.
It is interesting to note that the region had only 15 towns of population 20,000 and abovein 1961 (TCPO, 1974). The figure stood at 19 and 30 in the years 1971 and 1981respectively (NCR Planning Board, 1987). Survey of India topo sheets available are basedon surveys carried out in the years 1965-75 (and printed in the years 1975-85). The timegap between surveying and printing ranged from 4 years to 20 years (see Appendix X).The results (on the number of delineated areas) obtained based on the operationaldefinition of the CBAs are not far from the census definition of urban areas. The regionhad a total of 44, 48 and 94 towns in the years 1961, 71 and 81 respectively (TCPO,1974; NCR Planning Board, 1987).
Based upon 1981 administrative boundaries, average area of a smallest category of townin the region was less than 3 sq.km (NCR Planning Board, 1987). This should,theoretically, enable delineation of all the towns on a topo sheet of 1:250,000 with theminimum curtilage criteria of 5mm x 5mm, i.e., 1.5625 sq.km. However, the actualinhibited area may be far less than the administrative boundary and not necessarily in a square shape. Moreover, area derived from the topo sheets of such a large scale willnormally be less than the actual areas on ground due to the fractal effect.
The whole exercise when repeated with the minimum curtilage 4mm x 4mm, i.e., 1 sq.km, and minimum width 2mm, i.e., 500m, no additional CBA was possible to bedelineated. Further reduction in minimum curtilage was difficult to handle both visuallyand physically.
Therefore, it can be concluded that from the point of view of Survey of India topo sheetsat a scale of 1:250,000, operational definition of CBA is governed by a minimumcurtilage of 4mm x 4mm, i.e., 1 sq.km, and minimum width 2mm, i.e., 500m. Thiscurtilage was further used as training curtilage for the processing and interpretation ofsatellite images.
These were the areas representing the towns of A lwar , Bahadurgarh, Bulandshahr, De lh i , Faridabad,Ghaziabad, Gurgaon , Hapur, Khurja, Meerut , Palwal , Panipat, Rewar i , Rohtak, Sikandrabad, Sohna andSonipat.
157

Appendix IV
LIST OF SATELLITE DATA PRODUCTS USED L\ THE RESEARCH*
SI. S A T E L L I T E S C E N E S E N S O R / R E S O L U T I O N D A T E P R O D U C T
No. P A T H / R O W S u b - S c e n e C O D E * *
1. IRS-1A 2 8 4 7 LISS-1 7 2 . 5 m 0 4 F E B 9 1 S T P C 0 0 2 7 7
2 . IRS-1A 2 8 - 4 8 LISS-1 7 2 . 5 m 2 0 M A R 9 1 S T P C 0 0 2 7 7
3. IRS-1A 2 9 ^ 7 LISS-1 7 2 . 5 m 2 3 D E C 9 0 S T P C 0 0 2 7 7
4. IRS-1A 2 9 - 4 8 LISS-1 7 2 . 5 m 2 3 D E C 9 0 S T P C 0 0 2 7 7
5 . 1RS-1A 3 0 - 4 7 LISS-1 7 2 . 5 m 2 8 F E B 9 1 S T P C 0 0 2 7 7
6. IRS-1A 3 0 - 4 8 LISS-1 7 2 . 5 m 2 8 F E B 9 1 S T P C 0 0 2 7 7
7. IRS-1B 2 8 - 4 7 LISS-1 7 2 . 5 m 0 6 J A N 9 4 S T P C 0 0 2 7 7
8. IRS-IB 2 8 ^ 8 LISS-1 7 2 . 5 m 0 6 J A N 9 4 S T P C 0 0 2 7 7
9. IRS-1B 29^*7 LISS-1 7 2 . 5 m 0 7 J A N 9 4 S T P C 0 0 2 7 7
10. IRS-IB 2 9 - 4 8 LISS-1 7 2 . 5 m 1 6 D E C 9 3 S T P C 0 0 2 7 7
11. IRS-1B 3 0 - 4 7 LISS-1 7 2 . 5 m 1 7 D E C 9 3 S T P C 0 0 2 7 7
12. IRS-1B 3 0 - 4 8 LISS-1 7 2 . 5 m 1 7 D E C 9 3 S T P C 0 0 2 7 7
1 3 . IRS-1A 28^*7 L I S S - 2 / A 2 3 6 . 2 5 m 0 4 F E B 9 1 S T P C 0 0 2 7 7
14. IRS-1A 2 9 ^ 8 LLSS-2/A2 3 6 . 2 5 m 2 3 D E C 9 0 S T P C 0 0 2 7 7
15 . IRS-IB 2 8 ^ 7 L I S S - 2 / A 2 3 6 . 2 5 m 0 6 J A N 9 4 S T P C 0 0 2 7 7
16. IRS-IB 29^*8 LISS-2 /A2 3 6 . 2 5 m 1 6 D E C 9 3 S T P C 0 0 2 7 7
See also f igure on next page for the c o v e r a g e of each scene .
All products were Standard C C T , 6 2 5 0 BPI, BSQ Format, 'Standard' data products with po lyconicprojection and cubic convolut ion resampling.
158

Coverage of the IRS 1-A and 1-B Scenes Used in the Study
Coverage of scenes with 72.5m resolutionCoverage of scenes with 36.25m resolution
2 8 - 4 7 Path/Row identification of the sceneB2 Quadrant identification of sub-scenes
159

Appendix V
COMPARATIVE FEATURES OF SOME OF THE GIS PACKAGES DEVELOPEDAND PRODUCED IN INDIA*
P A C K A G E T H E M A P S /D I G I T I Z
I S R O G I S
oN R D M S - L I S G R A M N I C - G I S
P A C K A G ED E V E L O P E DBY
SRI, Pune©
S A C ,Ahemadabad•
N I S T A D S ,N e w Delhi V
c s r e , r r r ,B o m b a y•
N I C ,N e w Delhi *
TYPE Vector Vector Vector Vector / Raster Vector
E N V I R O N -MENT
M S - D O S U N I X 5 .3 M S - D O S MS-DOS X e n i x / S C OUnix
C O M P U T E RC O N F I -G U R A T I O N
P C X T / A T 3 8 6 PC A T 3 8 6 /4 8 6
P C X T / A T 3 8 6 P C X T / A T P C A T 3 8 6
E S S E N T I A LM E M O R Y
6 4 0 KB 8 M B 6 4 0 KB 6 4 0 KB
E S S E N T I A LM O N I T O R
C G A ( V G ADesirable)
V G A C G A ( V G ADesirable)
E G A / V G A CGI
E S S E N T I A LDISK S P A C E
2 0 / 4 0 M B 155 M B H D D 4 0 M B H D
M A R K E TPRICE (Rs) *
6 0 , 0 0 0 , for 1 each o fT H E M A P S & DIGITIZ
5 0 , 0 0 0 Only onTurnkeyProjects
S P E C I A LPRICE (Rs) •
3 0 , 0 0 0 , for 1 DIGrTIZ & 2 T H E M A P S
5 0 , 0 0 0
* Compi led by the author from various information brochures provided by the deve lopers of thepackages . Information updated till January, 1 9 9 3 .
<Q With image process ing capabil i t ies .© Des igned and marketed by Sys tems Research Institute, Pune , India.© Des igned by Space Appl icat ion Centre , Ahemadabad for Indian Space Research Organisation,
Bangalore; marketed by Era Software Sys tems Pvt . Ltd.V National Institute for S c i e n c e , T e c h n o l o g y and D e v e l o p m e n t Studies , Ministry of S c i e n c e and
T e c h n o l o g y , Government o f India.• Des igned by Centre for Studies in Resources Engineer ing , Indian Institute of T e c h n o l o g y , B o m b a y ; for
Ministry of Sc ience and T e c h n o l o g y , Government of India.
+ National Informatics Centre , Government of India.4k Prices indicative, as in January, 1 9 9 3 . Indian Rs. 1 ,000. = US $ 3 0 .
e . g . , for educational and/or training institutions.
160

Appendix VI
VI. 1 POPULATION POLICIES:
1. to decelerate the population growth of Delhi so as to achieve a manageable Delhi(11.2 million people) by 2001;
2. to achieve a moderate growth of the Delhi Metropolitan Area (DMA), excludingDelhi, to hold a population of 3.7 million people by 2001, in Ghaziabad, Loni,NOIDA, Faridabad, Gurgaon, Bahadurgarh, and Kundli towns, and 0.1 million inrural areas; and
3. to induce the growth of urban population in the areas beyond the DMA in theNCR (assigned population 17.5 million people in 2001).
VI.2 POLICIES ON SETTLEMENT SYSTEMS:
1. to develop selected areas intensively on a priority basis; and
2. to evolve a four-tier hierarchical system of human settlements consisting ofregional centres, sub-regional centres, service centres and basic villages for thejudicious distribution of population.
VI.3 LANDUSE POLICIES:
1. the existing cultivated land of 2.4 million ha is to be reserved for intensiveagriculture;
2. the existing forest area of 1.2 per cent is to be increased to at least 10 per cent ofthe total area through conversion of barren lands, cultivable wastes, etc.;
3. zoning regulations are proposed and permitted uses are specified in order to avoidhaphazard development in the region; and
4. a control 'green belt' is proposed around the future urbanisation area to arrest anyundesirable encroachment, and to ensure orderly and compact urban development.In addition, green buffers on either side of national highways and state highwaysare proposed to prevent ribbon development.
5 9 Extracted from N C R Planning Board, 15
161
SECTORAL POLICIES PROPOSED IN THE REGIONAL PLAN 2001

VI.4 TRANSPORTATION POLICIES:
1. interconnection of regional centres and the National Capital, by efficient andeffective network system allowing free movement;
2. provision of these networks to connect maximum traffic attracting and generatingurban nodes in the region, and to diminish the centrality of Delhi;
3. decongestion of Delhi roads and terminals by diverting long distance throughtraffic; and
4. integration of road and rail networks in Delhi, DMA and the balance of the regionwith appropriate interfacing facilities.
VI.5 TELECOMMUNICATION POLICIES:
1. full automation of telephone services;
2. responding of telephone and telex facilities to demand;
3. extension of subscribers dialling facilities to all DMA and priority towns;
4. connection of priority and DMA towns with Delhi by reliable cable or radiomedia;
5. provision of reliable trunk services, either by direct dialling or through demandservices among the priority towns and DMA towns;
6. extension of telegraph facilities where justified; and
7. replacement of manual exchanges in Delhi as well as other towns of the region byautomated exchanges.
VI.6 INDUSTRIAL LOCATION POLICIES:
1. the present policy of not promoting location of large and medium scale industrieswithin Delhi is to be continued;
2. large and medium scale industries are to be permitted to be located in the DMAtowns for a period of 10 years; this policy to be reviewed thereafter; and
3. priority towns are to have a strong industrial content and incentives, as applicableto centrally backward areas, are to be given for the location of large, medium andsmall scale industries in priority towns.
162

VI.7 TRADE AND COMMERCE POLICIES:
1. there is not to be advantage in terms of preferential treatment of lower taxes byway of incentives to wholesale trade in Delhi vis-a-vis the adjoining states;
2. certain wholesale trades of hazardous nature, located in congested areas of Delhiand requiring bulk handling, are to be encouraged to develop in other DMAtowns; and
3. incentives, concessions and infrastructure is to be made available in regionaltowns so as to encourage and accelerate the growth of trade.
VI.8 OFFICE LOCATION POLICIES:
1. there should be strict control on the location of new government and public sectoroffices. The main criteria of the control is to be that, if they are to be located inDelhi, they perform ministerial, protocol or liaison functions which, by theirnature, can not be performed anywhere else. Existing offices which do notperform any such functions are to be identified, and shifted from Delhi;
2. a similar control on the opening of new central government and public sectoroffices in the DMA is to be exercised; and
3. central government offices, considered suitable for moving from Delhi and otherDMA towns, should be located in other towns of the NCR, and incentives shouldbe given for this.
VL9 POLICIES ON IMPROVEMENT OF ENVIRONMENT:
1. no industry should be permitted to discharge its affluent over land or into waterbodies without treatment and bringing the affluent to recommended standards;
2. new industries should be developed only in identified and classified industrialareas/ estates which have proper treatment facilities;
3. urban wastes should be treated so as to meet prescribed standards before beingdischarged into rivers or other water bodies;
4. detailed schemes are to be prepared, at the local level, for sewage treatment forDMA, priority and other towns, so that the affluent can be used for irrigation andrelated purposes;
5. solid wastes are to be recycled for effective and valuable use as a nutrient and/oras energy; and afforestation programmes are to be undertaken on all barren andun-cultivable land.
163

A p p e n d i x VII P O P U L A T I O N , G R O W T H R A T E A N D F U N C T I O N A L C L A S S I F I C A T I O N O FT O W N S I N T H E N C R O F D E L H I , 1991(Arranged alphabetical ly)
N A M E O FT O W N
P O P U L A T I O Nin 1 9 9 1 ©
GR.RT. t f J1981-91
F U N C T I O N A L C L A S S I F I C A T I O N
( B a s e d o n 1971-81 C e n s u s ' )
A G A R W A L M A N D I ( 8 1 ) 10 ,871 16 Primary, Others
A L n > U R * " * ( 8 1 ) 9 , 2 5 6 3 7 Others
A L W A R ( 6 1 ) 2 1 0 , 1 4 6 44 Others
A M I N A G A R S A R A I ( 7 1 ) 8 , 2 7 4 21 Industry, Trade , C o m m e r c e , Others
A N U P S H A H R ( 6 1 ) 1 9 , 6 8 4 29 Others , Industry, Primary
A S O L A * * * ( 9 1 ) 5 , 0 6 1 - -A U R A N G A B A D ( 8 1 ) 1 5 , 4 0 2 32 Others , Primary
B A B U G A R H ( 8 1 ) 3 , 5 8 1 49 Others
B A G H P A T ( 6 1 ) 2 4 , 9 3 9 45 Primary, Others
B A H A D U R G A R H ( 6 1 ) 5 7 , 2 3 5 52 Others , Industry, Others
B A H S U M A ( 8 1 ) 9 , 0 6 0 14 Primary
B A R A U T ( 6 1 ) 6 7 , 7 0 5 46 Trade , C o m m e r c e , Industry, Others
B A W A L < 6 1 ) 9 , 0 1 0 16 Primary, Others
B A W A N A * * * ( 8 1 ) 18 ,999 50 Others
B E G U M B U D H A N A ( 9 1 ) 1 3 , 5 0 9 - -B E H R O R ( 9 1 ) 1 6 , 2 3 8 - -BERI(61) 14 ,508 7 Primary, Others
B E T A H A Z I P U R (91) 3 0 , 3 6 0 - -B . B A H A D U R N A G A R ( 8 1 ) 9 , 1 0 1 34 Others , Primary
B H I W A D K 9 1 ) 15 ,285 - Industry**
B I L A S P U R ( 8 1 ) 6 , 1 2 7 3 1 Others
B U G R A S I ( 6 1 ) 11 ,093 33 Primary, Industry, Others
B U L A N D S H A H R ( 6 1 ) 127 ,201 22 Others , Trade, C o m m e r c e , Industry
C H H A P R A U L I ( 8 1 ) 1 6 , 0 0 8 15 Primary
C H H A T A R K 8 1 ) 8 , 2 0 2 39 Primary
D A D R I ( 6 1 ) 3 2 , 8 8 3 66 Others , Trade, C o m m e r c e , Industry
D A N K A U R ( 6 1 ) 9 ,531 20 Others , Trade, C o m m e r c e , Industry
D A S N A ( 9 1 ) 16 ,963 - -D A U R A L A ( 8 1 ) 10 ,025 9 Primary
D E B A L ( 6 1 ) 2 7 , 7 2 1 23 Industry, Trade , C o m m e r c e , Others
D E L H I U . A . * * * * ( 6 1 ) 8 , 4 1 9 , 0 8 4 4 6 Others
D H A R U H E R A ( 9 1 ) 1 0 , 8 4 8 - Industry**
D O G H A T ( 8 1 ) 1 2 . 3 0 9 22 Primary
D U J A N A ( 9 1 ) 7 , 3 1 3 - -D U N D A H E R A ( 9 1 ) 6 , 7 6 7 - -
F A R I D A B A D ( 6 1 ) 6 1 7 , 7 1 7 B6 Industry, OthersF A R I D N A G A R ( 6 1 ) 1 0 , 9 4 0 20 Industry, Primary, OthersF A R R U K H N A G A R (61) 8 , 0 4 6 2b Primary, Trade , C o m m e r c e , IndustryF E R O Z E P U R JHIRKA(61) 12 ,413 32 Primary, Trade , C o m m e r c e , Industry
G A N A U R ( 7 1 ) 2 0 , 9 5 2 2 7 Industry, Trade , C o m m e r c e , OthersG A R H M U K T E S H W A R ( 6 1 ) 2 5 , 2 4 1 40 Primary, Industry, Others
G H A Z I A B A D U . A . ( 6 1 ) 5 5 4 , 5 0 6 93 Others
G O H A N A ( 6 1 ) 3 2 , 4 9 6 24 Trade , C o m m e r c e , Primary, Others
G U L A O T H I ( 6 1 ) 3 3 , 9 8 2 39 Trade , C o m m e r c e , Others
G U R G A O N ( 6 1 ) 1 3 5 , 8 8 4 34 Others
164

N A M E O FO W N
P O P U L A T I O N G R . R T . ( Si n 1 9 9 1 0 1 9 8 1 - 9 1
) F U N C T I O N A L C L A S S I F I C A T I O N ^ ( B a s e d o n 1971-81 C e n s u s * )
H A I L E Y M A N D I ( 6 1 ) 13 ,263 30 Trade , C o m m e r c e , OthersH A P U R ( 6 1 ) 1 4 6 , 2 6 2 4 2 Trade , C o m m e r c e , Industry, OthersH A S S A N P U R ( 8 1 ) 7 , 1 3 0 39 Primary, Others
H A S T I N A P U R ( 7 1 ) 15 ,081 29 Industry, OthersH A T H I N ( 8 1 ) 7 , 8 6 3 19 Primary, OthersH O D A L ( 6 1 ) 2 5 , 6 3 5 36 Diversif ied
AH A N G I R A B A D ( 6 1 ) 3 7 , 9 8 1 2 9 Primary, Industry, Trade , C o m m e r c eA H A N G I R P U R ( 8 1 ) 8 , 2 0 6 27 Primary, OthersE W A R ( 8 1 ) 2 1 , 3 7 6 39 OthersHAJJAR(61) 2 7 , 6 9 3 14 Primary, Trade , C o m m e r c e , Others
K A K O D ( 8 1 ) 5 , 8 3 8 35 Others , PrimaryK A L A N A U R ( 8 1 ) 1 4 , 5 2 4 17 OthersK A L C H H T N A ( 9 1 ) 1 0 , 3 7 3 -K A N J H A W A L A * * * ( 9 1 ) 6 , 1 0 0 - -K A R N A W A L ( 8 1 ) 1 1 , 0 4 7 11 PrimaryK H A I R T H A L ( 7 1 ) 2 2 , 7 4 1 42 Primary, Trade , C o m m e r c e , OthersK H A N P U R ( 8 1 ) 1 1 , 4 2 0 3 7 PrimaryK H A R K H O D A ( 8 1 ) 1 0 , 5 5 0 2 1 Primary, OthersK H E K R A ( 8 1 ) 3 5 , 1 9 1 40 OthersKHERI S A M P L A ( 9 1 ) 7 , 8 3 8 -K H U R J A ( 6 1 ) 8 0 , 3 0 5 19 Industry, Trade, C o m m e r c e , OthersKITHOR(81) 1 9 , 2 7 0 39 Primary
L A W A R ( 8 1 ) 14 ,471 25 Primary, OthersL O N I ( 8 1 ) 3 6 , 5 6 1 256 Others
M A H A M ( 6 1 ) 1 5 , 0 8 3 2 8 Primary, Trade, C o m m e r c e , OthersM A W A N A ( 6 1 ) 5 1 , 7 0 1 3 7 Diversif iedM E E R U T U . A . ( 6 1 ) 8 4 9 , 7 9 9 5S Others, IndustryM O D I N A G A R ( 6 1 ) 1 0 1 , 6 6 0 29 Industry, OthersM U R A D N A G A R ( 6 1 ) 4 4 , 3 9 5 ~0 Industry, Trade , C o m m e r c e , Primary
N A R A U R A ( 8 1 ) 1 5 , 6 5 2 63 Others
N I W A D I ( 8 1 ) 8 ,841 24 Primary
N O I D A ( 9 1 ) 1 4 6 , 5 1 4 - Industry**N U H ( 6 1 ) 7 , 4 9 2 2 5 Trade , C o m m e r c e , Others
O . F . M U R A D N A G A R ( 7 1 ) 1 2 , 7 9 2 -2 Others
A H A S U ( 6 1 ) 1 3 , 1 2 7 45 OthersA L W A L < 6 1 ) 5 9 , 1 6 8 25 Others , Trade , C o m m e r c e , Industry
A N I P A T ( 6 1 ) 1 9 1 , 2 1 2 3 3 Industry, Trade , C o m m e r c e , OthersA R I K S H I T G A R H ( S l ) 1 3 , 6 7 7 2 0 OthersA S A U N D A ( 8 1 ) 1 2 , 3 8 7 - _
A T A L A * ( 8 1 ) 9 , 1 8 1 17 PrimaryA T A U D I ( 6 1 ) 1 1 , 2 7 8 33 Primary, OthersE H L A D P U R B A N G E R * * * ( 8 1 ) 4 , 8 3 2 -3 OthersH A L A U D A ( 8 1 ) 1 3 , 9 7 0 34 PrimaryI L K H U A ( 6 1 ) 5 0 , 1 6 2 32 Industry, OthersOOTH K H U R D * * * ( 8 1 ) 8 , 2 9 3 16 Others
U N A H N A ( 9 1 ) 8 , 6 7 9 - -
165
-

N A M E O F P O P U L A T I O N G R . R T . ® F U N C T I O N A L C L A S S I F I C A T I O N >T O W N i n 1 9 9 1 @ 1981-91 (Based o n 1971-81 C e n s u s * )
R A B U P U R A ( 8 1 ) 1 0 , 7 6 9 19 Primary, Others
REWARI(61 ) 7 5 , 3 4 2 46 Trade , C o m m e r c e , Others, Industry
R O H T A K ( 6 1 ) 2 1 6 , 0 9 6 29 Others, Trade , C o m m e r c e
RORI(91) 8 , 4 7 3 - -
S A M A L K H A ( 8 1 ) 1 8 , 3 8 4 3 5 Others
S A R D H A N A ( 6 1 ) 4 2 , 9 8 0 42 Industry, Primary, Trade , C o m m e r c e
S E W A L K H A S ( 8 1 ) 1 4 , 4 0 2 40 Primary
SHAHJ A H A N P U R ( 6 1 ) 12 ,443 40 Primary, Industry
S H I K A R P U R ( 6 1 ) 2 9 , 1 9 7 35 Primary, Industry, Others
S I A N A ( 6 1 ) 2 9 , 8 8 8 33 Primary, Trade , C o m m e r c e , Others
S I X A N D R A B A D ( 6 1 ) 6 0 , 9 9 2 4 1 Industry, Primary, Trade , C o m m e r c e
S O H N A ( 6 1 ) 16 ,348 12 Trade , C o m m e r c e , Industry, Others
SONTPAT(61) 1 4 3 , 9 2 2 31 Industry, Trade , C o m m e r c e , Others
T A O R U ( 8 1 ) 1 2 , 5 3 4 SI Primary, Industry, Others
T U A R A ( 8 1 ) 1 5 , 3 9 9 26 Others
TIKRI(81) 1 2 , 7 8 4 12 Primary
N o t e s :
Assandh, Bisokhar and Razapur were also listed as towns in the Census of India, 1 9 9 1 . H o w e v e r , their locationcould not be conf irmed from any official source and therefore they are omitted from this analysis .
In case of varying spel l ings of town names from different data sources , the spel l ings used by the Census of India,
1 9 9 1 , have been adopted here.
(61) Dec lared a town in 1961 or before .(71) Dec lared a town in 1 9 7 1 .(81) Declared a town in 1981 .(91) Declared a town in 1991 .
• N a m e d as 'Patla' in the Topo-Sheet (Survey of India, 1980) and 'Patiala' in the Regional Plan 2001 ( N C R
Planning Board, 1988)
Functional classification for 1991 not ye t avai lable .A newly added town. Classif ication based on local k n o w l e d g e .Within the National Capital Territory of Delhi .Delhi U . A . includes 23 towns other than Delhi (see Appendix VTTT).
S o u r c e
@ Census of India, 1991 .4 NCR Planning Board, 1988 , pp. 140-142 .(61) T C P O , 1974 , p . 3 4 .(71) N C R Planning Board, 1988 , pp. 140-142 .(81) N C R Planning Board, 1988 , p p . 1 4 0 - 1 4 2 .(91) Census of India, 1991 .
166

A p p e n d i x V I I I P O P U L A T I O N A N D G R O W T H R A T E O F T O W N S I N T H E N C T O F D E L H I ,1991
s. N A M E O F P O P U L A T I O N G R O W T H R A T EN O . T O W N in 1991 1 9 8 1 - 9 1 (
1. D E L H I C I T Y 7 , 6 0 2 , 3 9 4 45
2. A Y A N A G A R * 4 . 4 0 5 -73. B A B A R P U R * 4 7 , 4 5 1 1164 . B H A L S AW A J A H A N G I R P U R * 9 5 , 0 6 5 355 . B I N D A P U R * 3 6 , 1 4 8 2S96. D E O L I * 3 3 , 2 1 4 4737. D I C H O N K H U R D * 1 3 , 8 7 0 170s. GHTTORNI* 6 , 2 5 4 339. G O K A L P U R * 4 9 , 1 8 6 22S10. J A F F A R A B A D * 1 7 , 4 9 2 S11. M O L A R B U N D * 1 9 , 6 2 9 26S12. M U N D K A * 1 7 , 3 8 0 1401 3 . N A N G A L D E W A T * 7 , 6 5 7 7 314 . N A N G L O I J A T * 7 6 , 0 6 3 102L5. NASIR P U R * 8 1 , 3 6 6 23516. P A L A M * 9 8 , 9 7 5 117L7. P A T P A R G A N J (Gharonda N e e m Ka)* 2 2 , 9 4 5 2991 i. P U L P E H L A D P U R * 14 ,343 6319. RAJKORI* 1 1 , 7 6 6 10420 . R A N G P U R I * 3 , 2 5 1 -232 1 . S U L T A N P U R * 8 ,365 10022 . S U L T A N P U R M A J R A * 1 1 1 , 5 6 7 992 3 . TAJ P U R * 5 , 8 8 2 192 4 . TIGRI* 3 4 , 4 1 6 99
T O T A L D E L H I U R B A N A G G L O M E R A T I O N 8 , 4 1 9 , 0 8 4 49
2 5 . A L I P U R * * 9 , 2 5 6 3726 . A S O L A * * 5 ,061 -227. B A W A N A * * 18 ,999 5028. K A N J H A W A L A * * 6 , 1 0 0 1829. P E H L A D P U R B A N G E R * * 4 , 8 3 2 -330. P O O T H K H U R D * * 8 , 2 9 3 16
T O T A L N A T I O N A L C A P I T A L T E R R I T O R Y 8 , 4 7 1 , 6 2 5 4 9O F D E L H I ( U R B A N )
Included in Delhi Urban Agglomerat ion . These towns exper ienced an average growth rate of 118%between 1 9 8 1 - 9 1 .
** Not included in Delhi Urban Agglomerat ion but located within the National Capital Territory of Delhi .These towns exper ienced an average growth rate of 2 5 % between 1 9 8 1 - 9 1 .
S o u r c e :
Census o f India, 1991;Draft Sub Regional Plan - National Capital Territory of D e l h i , NCR Planning Cell (Delhi D e v e l o p m e n t Authority) ,Delhi Administrat ion, 1 9 9 4 , Delhi .
167

Appendix IX
T A B L E S H O W I N G P O I N T N E I G H B O U R A N A L Y S I S F O R T H E E X I S T I N G , S I M U L A T E D C S R A N DS I M U L A T E D R E G U L A R P O I N T L O C A T I O N S O F ( C E N S U S ) T O W N S I N T H E N C R O F D E L H I , 1991
Re f l e x i v e Neares t N e i g h b o u r s M e a n D i s t a n c e t o N e a r e s t N e i g h b o u r
Order Observed Assumed Order Observed AssumedValue with C S R Value with CSR
Existing Locations
1 52 5 5 . 9 4 1 11566 105682 34 2 9 . 6 2 2 15774 158533 22 2 1 . 8 8 3 18482 198164 2 0 1 8 . 1 4 2 1 1 8 6 2 3 1 1 85 10 15.84 5 2 3 9 3 9 2 6 0 0 96 14 14 .24 6 2 6 5 6 4 2 8 6 0 9
Locations Simulated for Comple te Spatial Randomness (CSR)
1 58 5 9 . 0 4 13323 121692 28 3 1 . 2 6 2 2 0 1 8 9 182543 20 2 3 . 0 9 3 2 4 9 9 5 2 2 8 1 84 14 19 .14 - 2 9 0 4 7 2 6 6 2 05 2 0 16 .72 5 3 3 3 3 4 2 9 9 4 96 8 15 .03 6 3 7 0 3 8 3 2 9 4 3
Locat ions Simulated for Regular Distribution
1 6 4 5 7 . 1 8 : 17267 104942 36 3 0 . 2 8 2 1 7 7 8 0 157413 2 0 2 2 . 3 7 3 19293 196764 36 18 .54 4 2 1 4 4 3 2 2 9 5 45 28 16 .19 5 2 6 7 5 0 2 5 8 2 56 16 14.55 6 28201 2 8 4 0 7
168

Appendix X
Shee t L o n g i t u d e L a t i t u d e Y e a r S u r v e y e d Year P r i n t e dC o d e C o v e r a g e C o v e r a g e
5 3 C 7 6 ° - 7 7 8 2 9 ° - 3 0 Q 1 9 6 5 - 6 6 19755 3 D 7 6 ° - 7 7 ° 2 8 c - 2 9 ° 1968 -70 , 72 -73 19775 3 G - — No t Avai lab le*5 3 H 7 7 ° - 7 8 ° 2 8 ° - 2 9 ° 1 9 6 9 - 7 3 , 7 5 - 7 6 19805 3 K 7 8 ° - 7 9 ° 2 9 ° - 3 0 ° 1 9 6 6 - 6 7 19865 3 L 7 8 ° - 7 9 ° 2 8 ° - 2 9 ° 1 9 6 9 - 7 0 19775 4 A 7 6 e - 7 7 ° 2 7 ° - 2 8 ° 1967-69 19765 4 E 7 7 ° - 7 8 * 2 7 ° - 2 8 ° 1968-70 1975541 7 8 ° - 7 9 ° 2 7 ° - 2 8 ° 1 9 7 0 - 7 4 1983
This sheet w a s not available from any source . H o w e v e r , i t w a s compensated by the maps provided by theDeptt . of T o w n and Country Planning, Uttar Pradesh.
169
SURVEY OF INDIA TOPO-SHEETS, SCALE 1:250,000, USED IN THE RESEARCH

Appendix XI
"243-Q. Constitution of Municipalities.-
(1) There shall be constituted in every state, -(a) a Nagar Panchayat (by whatever name called) for a transitional area, that is
to say, an area in transition from rural area to an urban area;
(b) a Municipal Council for a smaller urban area; and
(c) a Municipal Corporation for a larger urban area, in accordance with theprovisions of this Part: . . .
(2) In this article, "a transitional area", "a smaller urban area" or "a larger urban area"means such area as the Governor may, having regard to the population of the area,the density of the population therein, the revenue generated for local administration,the percentage of employment in non-agricultural activities, the economic importanceor such other factors as he may deem fit, specify by public notification for thepurposes of this Part." (Government of India, 1993, pp. 10-11).
Author's Note: The Census of India does not consider the aspects of revenue andeconomic importance while classifying a human settlement into anurban area. Moreover, it considers only the male employment and notthe overall employment as is inferred from above article of theConstitution.
"243-W. Powers, authority and responsibilities of Municipalities, e t c -
Subject to the provisions of this Constitution, the legislature of a State may, by law, endow-
(a) the Municipalities with such powers and authority as may be necessary to enablethem to function as institutions of self-government and such law may containprovisions for the devolution of powers and responsibilities upon Municipalities,subject to such conditions as may be specified therein, with respect to-
(i) the preparation of plans for economic development and social justice;
170
EXTRACTS FROM THE CONSTITUTION (SEVENTY-FOURTH AMENDMENT)ACT, 1992

(ii) the performance of functions and the implementation of schemes as may beentrusted to them including those in relation to the matters listed in theTwelfth Schedule;
(b) the Committees with such powers and authority as may be necessary to enable themto carry out the responsibilities conferred upon them including those in relation to thematters listed in the Twelfth Schedule." (Government of India, 1993, pp. 13-14).
TWELFTH SCHEDULE (Article 243-W)
1. Urban planning including town planning.2. Regulation of land-use and construction of buildings.3. Planning for economic and social development.4. Roads and bridges.5. Water supply for domestic, industrial and commercial purposes.6. Public health, sanitation conservancy and solid waste management.7. Fire services.8. Urban forestry, protection of environment and promotion of ecological aspects.9. Safeguarding the interests of weaker sections of society, including the handicapped
and mentally retarded.LO. Slum improvement and upgradation.1 i. Urban poverty alleviation.12. Provision of urban amenities and facilities such as parks, gardens, playgrounds.13. Promotion of cultural, educational and aesthetic aspects.14. Burials and burial grounds; cremations, cremation grounds and electric
crematoriums.15. Cattle ponds; prevention of cruelty to animals.L6. Vital statistics including registration of births and deaths.17. Public amenities including street lighting, parking lots, bus stops and public
conveniences.18. Regulation of slaughter houses and tanneries." (Government of India, 1993, pp. 18-
19).
171
REFERENCES
Abler , Ronald , A d a m s , John S. and Gou ld , Peter; Spatial Organisation : The Geographer ' s V i e w of the World:Prentice - Hall International, 1 9 7 2 , London.
Akhtar, N a d i m ; Decentral isat ion Po l i c i e s in Metropoli tan R e g i o n s - Case Study National Capital Region; unpublishedM . S c . T h e s i s , Schoo l o f Planning and Architecture, 1987 , N e w Delh i .
A l a m , M a n z o o r ; T h e National Sett lement Sy s t e m of India; in Bourne , L . S . , Sinclair , R. and D z i e w o n s k i , K. (eds . ) ;Urbanization and Sett lement Sys tems -International Perspect ive; Oxford Univers i ty Press , 1984 , N e w York, p p . 4 5 3 -4 7 2 .
A l -Amir , Sahar; Moni tor ing Urban Spatial Deve lopment in South Limburg U s i n g Remote Sens ing Techniques andG e o Information S y s t e m s ; unpublished M . S c . Thes i s , ITC, 1 9 9 1 , Enschede .
A l -Amir , Sahar; M o d e r n Spatial Planning Practice as Supported by the Mult i -Appl icable T o o l s of Remote Sensingand GISs: the Syrian Case : ITC (Publication N o . 3 4 ) , 1996 , Enschede .
Albaredes , Gi l les ; D y n a m i c GIS; in GIS Europe; V o l . 2 , June, 1 9 9 3 , p p . 3 2 - 3 5 .
Anderberg , Michael R.; Cluster Analysis for Applicat ions; A c a d e m i c Press , 1 9 7 3 , N e w York.
Aronoff , Stan; Geographic Information Systems: A M a n a g e m e n t Perspect ive; W D L Publicat ions, 1 9 9 3 , Ottawa,p p . 4 7 - 1 0 2 .
Aspinal l , Richard J. and Pearson, Diane M . ; Data Quality and Spatial Analys is : Analytical U s e of GIS for EcologicalM o d e l l i n g ; in Second International Conference^ Workshop on Integrated GIS and Environmental Mode l l ing;September 2 6 - 3 0 , 1993 , Breckenr idge , Co lorado .
Atkin, R . H . ; Mathematical Structure in Human Affairs; He inemann , 1974 , London , pp. 199 -206 .
A v e r y , T . E . and Berl in , G . L . ; Fundamentals of Remote Sens ing and Airphoto Interpretation; Burgess , M c M i l l a n ,1 9 9 2 , N e w York.
B a c k h o u s e , J. , L i ebenau , J. and Land, F . ; On the Disc ip l ine of Information Sys tems; in Journal of InformationS y s t e m s , V o l . 1 , N o . l , 1 9 9 1 , p p . 1 9 - 2 7 .
Baig , M . M . Anwar; Inter-city Passenger Travel Demand M o d e l l i n g : Case Study National Capital Region;unpublished M . S c . Thes i s , Schoo l o f Planning and Architecture, 1 9 9 1 , N e w Delhi .
Barnsley, Mike ; Moni tor ing Urban Areas in the EC U s i n g Satellite Remote Sens ing; in GIS Europe; V o l . 2 , N o . 9 ,October , 1 9 9 3 , p p . 4 2 ^ 4 .
Barns ley , M . J . , Barr, S . L . , Hamid , A . , Mul ler , J . P . A . L . , Sadler, G.J. and Shepherd , J . W . ; Analytical T o o l s toMonitor Urban Areas ; in Mather , Paul M. (ed . ) ; Geographical Information Handling - Research and Applications;John W i l e y , 1 9 9 3 , Chichester , pp . 1 4 7 - 1 8 4 .
Batty, Michae l ; Geographical Information Systems: GIS in Urban Land Pol icy Analys i s , GIS in RegionalDeve lopment Planning, Proceed ing of the Study Group Meet ing on Regional and Global E c o n o m i c Integration,D e v e l o p m e n t Planning, and Information T e c h n o l o g y , 11-14 , N o v e m b e r , 1 9 9 1 , U N C R D , 1992 , N a g o y a , p p . 2 7 - 6 0 .
Batty, Michae l ; A Random Walk A l o n g the Urban Boundary; in Geographical M a g a z i ne ; June, 1 9 9 2 , p p . 3 4 - 3 6 .
173

Batty, Michae l ; U s i n g Geographical Information Sys tems in Urban Planning and Pol i cy Making ; in Fischer , ManfredM. and Ni jkamp, Peter (eds . ) ; Geographical Information Systems: Spatial Model l ing and Pol icy Evaluation;Springer-Verlag , 1 9 9 3 , Berl in , p p . 5 1 - 6 9 .
Batty, Michael and L o n g l e y , Paul; Fractal Cities : A Geometry of Form and Function; Academic Press , 1994 ,London.
Beaumont , John R.; Locat ion - Al locat ion M o d e l s and Central Place Theory; in G h o s h , Avijit and Rushton, Gerard(eds . ) . Spatial Analys is and Location - Analysis M o d e l s ; Van Nostrand Reinhold , 1 9 8 7 , N e w York.
B e a v o , K . S . O . ; Central Place Theory - A Reir.terpretation: L o n g m a n , 1977 , N e w York.
Be i s smann, H.; The Problem of Scale and Incompatibil it ies in Data Sets of a Geographical Information Sys tem; inProceedings of the 25th International Sympos ium on Remote Sensing and Global Environmental Change : T o o l s forSustainable D e v e l o p m e n t ; Vol . II; Environmental Research Institute of M i c h i g a n , 1 9 9 3 , Ann Arbor, pp .11-214-222 .
Bennett , David A . , Armstrong , Marc P. and Weir ich , Frank; An Object-Oriented M o d e l b a s e M a n a g e m e n t Sys temfor Environmental Simulat ion; in Second International Conference / W o r k s h o p on Integrated GIS and EnvironmentalMode l l ing; September 2 6 - 3 0 , 1 9 9 3 , Breckenr idge , Co lorado , p p . 7 8 5 - 7 9 4 .
Berry , Brian J . L . ; City S ize Distributions and E c o n o m i c D e v e l o p m e n t , in Economic Deve lopment and CulturalChange: Vol - IX, N o . 4 , July 1 9 6 1 .
Bertaud, M a r i e - A g n e s ; The U s e of Satellite Images for Urban Planning: A Case Study from Karachi , Pakistan;Technica l Note ("Report I N U 4 2 ) , Po l i cy , Planning and Research Staff, The World Bank, M a y , 1989 , Washington ,p p . 2 0 - 3 4 .
Bin, Jiang and Mul ler , J . C . ; Geo-Visual izat ion for the Integration of Remote Sens ing and GIS; in Genderen , J .L .van, Zuidam, R.A. van and Pohl , C. ( eds . ) ; Proceedings of the International S y m p o s i u m on Operationalisation ofRemote Sensing; Vol . 6 , International Institute for Aerospace Survey and Earth S c i e n c e s , 1 9 9 3 , Enschede , p p . 8 7 - 9 6 .
Blakely , E . ; The N e w T e c h n o l o g y City : Infrastructure for the Future Communi ty ; in Brotchie , John, Batty,Michae l , Hall, Peter and N e w t o n , Peter (eds . ) ; Cit ies of the 21st Century : N e w T e c h n o l o g i e s and Spatial Sys tems;L o n g m a n Cheshire , 1 9 9 1 , N e w York, p . 2 3 0 .
B o h m e , Rolf (compiler) and A n s o n , Roger (English Language Editor); Inventory of World Topographic Mapping;V o l . 3 ; International Cartographic Assoc iat ion , Elsev ier Appl ied S c i e n c e , 1 9 9 3 , London , p . 1 4 2 - 1 4 8 .
Bolt , Dirk; The D e v e l o p m e n t Ratio : A Model for a Humane Urban Future; unpublished P h . D . T h e s i s , 1 9 8 3 ,Auckland.
Bolt , Dirk; A R e c o m m e n d e d Pattern of Urban Sett lements in Australia; An Urban Sett lement Planning and Des ignContribution to the Inquiry into the Pattern of Urban Sett lement of the House of Representat ives , Standing Commit t eefor Long Term Strategies , Parliament House , Canberra, Australia; 1 9 9 1 , Enschede .
Bolt , Dirk; A T e c h n o l o g y for Environmental ly Sustainable Urban D e v e l o p m e n t ; Guest Lecture del ivered at ITC,1 9 9 2 , Enschede .
Bolt , Dirk; Urbwatch and Urbserve Update: The Tes t / Demonstrat ion Project; in ITC Journal; 1 9 9 3 - 1 , Enschede .
Bolt , Dirk; The U s e of Advanced T e c h n o l o g i e s for the Promotion of a M o r e Sustainable Urban Future; paperpresented at the 4th EuropIA Conference on 'Advanced Te c hno l og i e s : Architecture , Planning and Engineering*.June, 1 9 9 3 , Delft .
Boot s , Barry N. and Get i s , Arthur; Point Pattern Analys i s ; S a g e , 1 9 8 8 , California.
B o r g , Claes -Goran; R & D - N e e d s in a Rapidly Changing Marketplace; in A s k n e , J. ( ed . ) ; Sensors and EnvironmentalApplication of Remote Sensing; Brookfie ld - Ba lkema, 1 9 9 5 , Rotterdam, pp . 15-16 .
174
Bourne , L . S . , Sinclair , R. and D z i e w o n s k i , K. (eds . ) ; Urbanization and Sett lement Sys tems -Internationa]Perspect ive; Oxford University Press , 1984 , N e w York.
B o w d e n , Leonard W . ; U s i n g Remote Sens ing for Planning Appl icat ions; in Ford , Kristina ( ed . ) ; Remote Sensingfor Planners; Centre for Urban Pol i cy Research, 1 9 7 9 , N e w Jersy, p p . 5 5 - 5 8 .
Branch, Melv i l l e C; City Planning and Aerial Information; Harvard Univers i ty , 1 9 7 1 , Massachuset t s , p p . 2 7 - 4 5 ,8 9 - 1 0 2 .
Breese , Gerald; Urbanizat ion in N e w l y Deve lop ing Countries; Prentice-Hall , 1966 , N e w Jersey, p . 5 7 .
Buch , Mahesh N . ; Planning the Indian City; Vikas , 1987 , N e w Delh i , p . 4 8 .
Burrough, P . A . ; Principles of Geographical Information Sys tems for Land Resource Asses sment , Clarendon, 1993a,Oxford.
Burrough, P . A . ; Spatial Data Quality and Error Analys i s Issues: GIS Functions and Environmental Mode l l ing; inSecond Internationa] Conference / Workshop on Integrated GIS and Environmental Mode l l ing; September 2 6 - 3 0 ,1993 , Breckenr idge , Co lorado .
C a m i n o s , Horac io and Goethert , Reinhard; Urbanization Primer; Massachusetts Institute of T e c h n o l o g y , 1978 ,Massachuset ts .
Cartwright, T.J . ; Information Systems for Planning in D e v e l o p i n g Countries; in Habitat International; V o l . 1 1 , N o . l ,1 9 8 7 , 1 9 1 - 2 0 5 .
Catanese , Anthony J.; Scientific Methods of Urban Analys i s ; Universi ty of Il l inois, 1972 .
Chadwick , G e o r g e ; M o d e l s of Urban and Regional S y s t e m s in Deve lop ing Countries; P e r g a m o n , 1987 , Oxford,chap .3 and 7.
C h a m p i o n , A . G . ; Counterurbanization: T h e Conceptual and Methodolog ica l Chal lenge; in C h a m p i o n , A . G . (ed . ) ,Counterurhanizat ion: T h e Changing Pace and Nature of Population Deconcentrat ion: Edward Arnold , 1989 , London,p p . 3 1 - 3 3 .
Chandra, Rajesh and Najamuddin; Problems of Regional Planning and Urbanisat ion - Basic Issues : Exper ience fromPlanning of the N C R Sub-Reg ions ; paper presented at the Inter-State Workshop on N C R Sub-Reg ions : Planningand D e v e l o p m e n t Implications; Organised by the Institute of T o w n Planners, India, 1994 , N e w De lh i .
Chapin , Ir . , F. Stuart; Urban Land L'se Planning; Univers i ty of Ill inois Press , 1965 , Urbana.
Charbonneau, L . , M o r i n , D. and Royer , A . ; Analys i s of Different Methods for Monitor ing the UrbanizationProcess ; in Geocar to International; (1 ) , 1993 , p p . 1 7 - 2 5 .
C h e n g , F. and T h i e l , K . - H . ; Del imit ing the Building Heights in a City from the S h a d o w in a Panchromatic S P O T -Image - Part 1, Test for F o r t y - T w o Bui ldings; in Internationa] Journal of Remote Sens ing; Vol . 16, N o . 3, 1995 ,p p . 4 0 9 - 4 1 5 .
Chor ley , Richard J. and Hagget , Peter ( eds . ) ; M o d e l s in Geography; Mathuen & C o . ; 1 9 6 8 , London.
Clark, David; Urban Geography: An Introductory Guide; C r o o m H e l m , 1982 , London .
Cowr in , Lauren Anita; T h e Rural T o w n : Minimal Urban Centre; in Urban Anthropology; V o l . 6 , N o . l , 1977 ,p p . 2 3 - 2 4 .
Cul len , Ian; Applied Urban Analys i s : A Critique and Synthes i s ; M e t h u e n , 1984 , London, p p . 7 8 - 1 0 8 .
175

Cullen, I .G. ; Q-analysis and the Theory of Socia l Scientif ic K n o w l e d g e ; in Environment and Planning B: Planningand Des ign ; Vol . 10 , 1983 , pp .393^401 .
Curran, Paul J.; Principles of Remote Sens ing , Longman, 1985 , London .
Dale , Peter F . ; GIS and Their Ro le in Urban D e v e l o p m e n t ; in Cities; V o l . 8 , N o . l , 1 9 9 1 .
Danie l s , P . W . ; T e c h n o l o g y , Internationalisation of S e r v i c e s and Metropoli tan Areas; in Brotchie , John, Batty,
Longman Cheshire , 1 9 9 1 , N e w York, p p . 2 2 5 - 2 2 6 .
Dansereau , Pierre; An Ecolog ica l Grading o f Human Sett lements; in G e o f o r u m . V o l . 9 , N o . 3 , 1978 , p p . 1 6 1 - 2 1 0 .
Das , R.J.; Rank-Size and Primate City Characteristics in India : A Tempora l Analys is ; in GeoJournal; V o l . 2 9 , N o . 2 ,
February, 1 9 9 3 , Dordrecht , pp. 125 -137 .
Dav i s , F . W . and Simonett , D . S . ; GIS and Remote Sensing; in M a g u i r e , David J. , Goodchi ld , Michae l F. and Rhind,David W. (eds . ) ; Geographical Information Sys tems - Principles and Appl icat ions , V o l . 1 ; L o n g m a n Scientif ic & Technica l , N e w York, 1 9 9 1 , p p . 1 9 1 - 2 1 3 .
de Bruijn, C . A . ; Del ineat ing Urban Areas from Landsat Images U s i n g Digital Process ing : A Compar i son WithGrid-Based Photo Interpretation; in Proceed ings of the International S y m p o s i u m on Remote Sens ing for Observationand Inventory of Earth Resources and the Endangered Environment; Vol . II, International Archives ofPhotogrammetry , Vol . XXII -7 , 1978 , Freiburg, p p . 9 0 3 - 9 1 5 .
de Bruijn, C . A . ; Spatial Factors in Urban Growth : T o w a r d s GIS M o d e l s for Cit ies in D e v e l o p i n g Countr ies; FTCJournal, 1 9 9 1 - 4 , E n s c h e d e , p p . 2 2 1 - 2 3 1 .
de Bruijn, C . A . ; General Introduction of Geoinformation and Land Information Sys tems; in Urban GIS Applicat ionsReader, (unpublished compi lat ion) , ITC, 1992 , Enschede .
de Bruijn, C . A . and RuoLsalainen, R.; M A S M A P , a Mini -Computer Based Mapping and Analys i s Sy s t e m for Usewith Small Format Airphotography; in Saini , N . S . ( ed . ) ; Urban and Regional Planning Information Sys tems forIndia' other E S C A P Countries; School o f Planning and Architecture, 1987 , N e w Delhi , pp. 1 5 8 - 1 6 9 .
de Co l a , Le e ; Fractal Analys is of a Classified Landsat Scene ; in Photogrammetric Engineering and Remote Sensing;V o l . 5 5 , N o . 5 , 1989 , p p . 6 0 1 - 6 1 0 .
Deekshatulu, B . L . ; Operationalisation of Remote Sens ing in India; in Genderen , J .L . van, Zu idam, R .A . van andPohl , C. ( eds . ) ; Proceedings of the International S y m p o s i u m on Operationalization of Remote Sens ing; V o l . 1 ,International Institute for Aerospace Survey and Earth S c i e n c e s , 1 9 9 3 , E n s c h e d e , pp. 1 9 2 - 2 1 4 .
Defense Mapping A g e n c y ; Digital Chart o f the World; United States De fense Mapping A g e n c y , 1992 , Washington
Delhi D e v e l o p m e n t Authority; Master Plan for Delhi ( 1 9 6 1 - 8 1 ) ; 1 9 6 2 , N e w De lh i .
Delhi D e v e l o p m e n t Authority; Master Plan for Delhi : Ministry of Urban D e v e l o p m e n t , Government of India; T h eGazette o f India, Extraordinary, N o . 4 3 7 , Part II-Section 3- Sub Sect ion (ii), August 1 , 1 9 9 0 , N e w De lh i .
Delhi D e v e l o p m e n t Authority; Master Plan for Delhi - Perspect ive 2 0 0 1 ; Delhi D e v e l o p m e n t Authority , 1 9 9 1 , N e wDelh i .
Delhi D e v e l o p m e n t Authority; Draft Sub Regional Plan National Capital Territory of De lh i ; N C R Planning Cel l ;Delhi D e v e l o p m e n t Authority, 1994 , N e w Delhi .
176

de M a n , W . H . Erick; Value Added of a Geographical Information Sys tem; in Y e h , Anthony G . O . (ed . ) , Proceedingsof the International Conference on Computers in Urban Planning and Urban M a n a g e m e n t ; Centre of Urban Studiesand Urban Planning , Univers i ty o f H o n g K o n g , 1 9 8 9 , p p . 3 1 5 - 3 2 0 .
de M e y e r e , Johan C; GIS: Spatial Information for Pol icy Making ; in Tee f fe l en , Pieter van, Grunsven , L e o van andVerkoren, Otto ( eds . ) , Possibi l i t ies and Constraints of GIS Applications in D e v e l o p i n g Countries; Proceed ings ofthe G 1 S D E C O Seminar organized by the GIS Working Group of the Faculty of Geographical S c i e n c e s , UtrechtUnivers i ty (7-8 Apri l , 1991 ) , N G S 152 , 1992 , Utrecht, p p . 3 5 - 3 9 .
Department of T o w n and Country Planning, Government of Haryana; N C R Sub-Regional Plan Haryana - 2 0 0 1 .(Draft - subsequently approved); undated, Chandigarh.
Department of T o w n and Country Planning, Government of Rajasthan; Rajasthan Sub-Regional Plan - 2001 NationalCapital Reg ion , (Draft - subsequently approved); 1992 , Jaipur.
Department of T o w n and Country Planning, Government of Uttar Pradesh; Sub-Regional Plan, Uttar Pradesh Sub-Reg ion , National Capita] Region 1 9 9 0 - 2 0 0 1 . (in Hindi; Draft - subsequently approved); undated, Meerut .
D e v l i n , Keith; Mathemat ics : The S c i e n c e o f Patterns, Scientif ic Ame r i c a n , 1 9 9 4 , N e w York.
D e w a r , D a v i d , T o d e s , Al i son and Watson , Vanessa; Regional D e v e l o p m e n t and Sett lement Pol icy: Premises andProspects; Al len and U n w i n , 1986 , L o ndo n .
D h i n w a , P . S . , Pathan, S . K . , Sastry, S . V . C . , R a o , M u k u n d , Majumder , K . L . , Chotani , M . L . , S ingh , J . Premnathand Sinha, R . L . P . ; Land U s e Change Analys is of Bharatpur District using GIS; in Photonirvachak. Journal of theIndian Soc ie ty for R e m o t e Sensing; V o l . 2 0 , N o . 4 , 1992 , Dehradun , p p . 2 3 7 - 2 5 0 .
Dill Marcus , W o l f Reinhard and He i senberg , Martin; Visual Pattern Recogni t ion in Drosophi la Involves RetinotopicMatching; i n Nature; V o l . 3 6 5 , October 2 1 , 1 9 9 3 , p p . 7 5 1 - 7 5 3 .
Div i s ion of Urban Survey and Human Sett lement Analys i s , Department of Land Resource and Urban Sc i ences , ITC;'Urbwatch ' and 'Urbserve ' : Programmes for Human Sett lements Moni tor ing and Intervention; 1992; ProjectD o c u m e n t s , and S e c o n d Quarterly Report , (April , 1993 ) , Enschede .
D o b s o n , Jerome E . ; A Conceptual Framework for Integrating R e m o t e Sens ing , GIS and Geography; inPhotogrammetric Engineering and Remote Sens ing; V o l . 5 9 , N o . 10, October , 1 9 9 3 , pp . 1 4 9 1 - 1 4 9 6 .
Donker , N . H . W . and Mulder , N .J . ; Analys is of M S S Digital Imagery with the Aid of Principal ComponentTransform; in ITC Journal; 1 9 7 7 - 3 , E n s c h e d e , p p . 4 3 4 - 4 6 6 .
D o x i a d i s , Constant inos A . ; E m e r g e nc e and Growth of an Urban Region: The D e v e l o p i n g Urban Detroit Area ,(Vo l .1 and 2 ) ; Detroit Edison C o m p a n y , 1966-67 , Detroit .
D o x i a d i s , C . A . ; The Human Sett lements That W e N e e d ; Tata M c G r a w Hil l , 1 9 7 6 , N e w D e l h i .
Dutton, Geof frey; Criteria of Growth in Urban Sys tems; in Ekistics; 3 6 ( 2 1 5 ) , October , 1 9 7 3 , p p . 2 9 8 - 3 0 6 .
El iot , T . S . ; Chorus from 'The Rock ' , I , Col lected P o e m s , 1 9 0 9 - 1 9 3 5 , Faber & Faber, 1936 , London.
Erickson, E u g e n e C. and Y o u n g , Frank W . ; Urban Hierarchies and Regional D e v e l o p m e n t in M o r o c c o : A GraphicalTechnique for Moni tor ing and Assessment ; in Journal of D e v e l o p m e n t Soc ie t i es ; Vol . VIII, N o . 2 , 1992 , pp. 160-178 .
Estes , John and H o l z , Robert K.; Remote Sens ing: C o m i n g of A g e in the '80s ; in H o l z , Robert K. (ed . ) ; TheSurveillant Sc ience : Remote Sensing of the Environment; John W i l e y , 1985 , N e w York , p p . 3 0 - 3 2 .
E v e r s o n , J . A . and FitzGerald, B . P . ; Sett lement Patterns; L o n g m a n , 1969 , L o n do n .
Fr iedmann, John; Cit ies in Social Transformation; in Fr iedmann, John and A l o n s o , Wi l l iam (eds . ) ; Regional
177

D e v e l o p m e n t and Planning: A Reader; The M . I . T . Press , 1 9 6 4 (Fifth printing, 1 9 7 2 ) , Massachuset t s , p p . 3 4 3 - 3 6 0 .
Friedmann, John; A Conceptual M o d e l for the Analys is of Planning Behaviour; in Faludi, Andreas ( ed . ) ; A Readerin Planning Theory; Pergamon Press , 1 9 7 3 , Oxford, p p . 3 4 5 - 3 7 0 .
Friedmann, J . and A l o n s o , W. (eds . ) ; Regional D e v e l o p m e n t and Planning: A Reader; M I T Press , 1964 , Cambr idge .
Fung, K . B . and Lasserre , M . ; Factors Concern ing T ime in Remote Sens ing and GIS; in Proceed ings of the CanadianInternational Conference on GIS; March 2 3 - 2 5 , 1 9 9 3 , Ottawa, p p . 8 8 9 - 8 9 5 .
Gambhir , J .C . and Bansal , S . P . ; Sub-Regional Plan for Delhi - Important Issues; Paper presented at the Inter-StateWorkshop on N C R Sub-Regions : Planning and D e v e l o p m e n t Implications; Organised by the Institute of T o w nPlanners, India, 1 9 9 4 , N e w De lh i .
Garner, B.J.; M o d e l s of Urban Geography and Set t lement Locat ion; in Chor ley , Richard J. and Haggett , Peter(eds . ) ; M o d e l s in Geography; Mathuen & C o . , 1968 , L o ndo n .
Garreau, Joel; Edge City: Life on the N e w Frontier: A n c h o r B o o k s , Doub leday , 1 9 9 1 , N e w York.
Genderen, John van; Taking the 'Remoteness ' Out of Remote Sens ing: The Issues and N e e d s to Operational ize EarthObservation; in ITC Journal: 1 9 9 3 - 3 , Enschede , p p . 2 9 4 - 3 0 0 .
G e o r g e , F . H . ; The Use of M o d e l s in S c i e n c e ; in C h o r l e y , Richard J. and Haggett , Peter (eds . ) ; M o d e l s inGeography; Mathuen & C o . , 1968 , London , p p . 4 3 - 5 6 .
Glasson , John; An Introduction to Regional Planning; U C L Press , 1978 (6th Impress ion, 1992 ) , London .
Gnaneshwar , V . ; Urban Pol ic ies in India - Paradoxes and Predicaments; in H A B I T A T I N T L . ; V o l . 19 , N o . 3 ,p p . 2 9 3 - 3 1 6 .
Goddard, S . ; A Guide to Information Sources in the Geographical S c i e n c e s , Barnes & N o b e l , 1 9 8 3 , N e w Jersy.
Goodal l , Brian; The Penguin Dictionary of Human Geography; Penguin B o o k s , 1987 , L o n do n .
Gore , Charles; Regions in Question : Space . Deve lopment Theory and Regional Pol icy: M e t h u e n , 1984 , London .
Gorte , Ben; T o o l s for Advanced Image Process ing and GIS using ILWIS; ITC Publication N o . 2 4 , Internationa]Institute for Aerospace Survey and Earth S c i ences , 1994 , Enschede
Gottmann, Jean; M e g a l o p o l i s ; The Urbanised Northeastern Seaboard of the United States; M I T Press , 1967 ,Massachusetts .
Government of India; Report of the Task Force on Planning and D e v e l o p m e n t of Small and Medium T o w n s andCit ies; Ministry o f W o r k s and Hous ing , 1977 , N e w Delh i .
Government of India; Report of the National Commiss ion or, Urb.-.r-.ization; Ministry of Urban D e v e l o p m e n t , 1988 ,N e w De lh i .
Government of India; T h e Gazette of India, Extraordinary, Part II, Sec t ion I, April 2 0 , 1 9 9 3 , pp. 1-10; as publishedin Constitutional Provis ions Relating to Vi l lage Panchayats and Municipal i t ies in India. Eastern Book C o m p a n y ,1 9 9 3 , L u c k n o w , pp . 10 -19 .
G o y e l , Purushottam; De lh i ' s March T o w a r d s Statehood; U B S Publ ishers ' Distributors; 1 9 9 3 , N e w De lh i .
Griffith, Daniel A . ; What is Spatial Autocorrelat ion? Ref lections on the Past 25 Years of Spatial Statistics; inL'Espace Geographique; N o . 3 , 1 9 9 3 , p p . 2 6 5 - 2 8 0 .
178

Guerin-Pace , France; Rank-Size Distribution and the Process of Urban Growth; in Urban Studies; Vol . 3 2 , N o . 3 ,1 9 9 5 , p p . 5 5 1 - 5 6 2 .
G u g a n , D.J . ; Integration of Remote Sens ing and GIS; in Genderen , J .L . van, Zu idam, R .A. van and Pohl , C. ( eds . ) ,Proceed ings of the International S y m p o s i u m on Operationalisation of Remote Sens ing: V o l . 6 , International Institutefor Aerospace Survey and Earth Sc i ences , 1993 , Enschede , p p . 7 7 - 8 6 .
Gupta, J.K. and V e r m a , S . B . ; D e v e l o p m e n t Options for Haryana Area falling in the N C R ; Paper presented at theInter-State Workshop on N C R Sub-Reg ions : Planning and D e v e l o p m e n t Implications; Organised by the Institute ofT o w n Planners , India, 1994 , N e w De lh i .
Gupta, Vipin; N e w Satellite Images for Sale - The Opportunities and Risks Ahead: Centre for Security andT e c h n o l o g y Studies , L a w r e n c e Livermore National Laboratory, Univers i ty o f California, U C R L - I D - 1 1 8 1 4 0 , C S T S -4 7 - 9 4 , 1 9 9 4 , L i v e r m o r e .
Gupta, Vip in; A series of lectures de l ivered at ITC, E n s c h e d e , in September , 1995 ; as reported by van Delft , Dirk;Zwaaien Naar de Satell iet; in N R C Handelshlad, Wetenschap & Onderwijs , 21 September , 1995 , Rotterdam, p . 6 .(in Dutch) ; and as 'Big Brother is Watching You!*, in itcetera. Vol . 2 9 , N o . 4 2 2 , October 1 9 9 5 , ITC, Enschede ,pp. 1-3. (in Dutch) .
Hagget t , Peter; Locational Analys is in Human Geography; Edward Arnold , 1965 , L o n do n .
Haggett , Peter; Geography : A Modern Synthesis; Harper International, 1972 , N e w York.
Haggett , P. and Chor ley , R.J.; M o d e l s , Paradigms and the N e w Geography; in Chor ley , Richard J. and Haggett ,Peter (eds . ) ; M o d e l s in Geography; Mathuen & C o . , 1968 , London , p p . 1 9 - 2 7 .
Haggett , Peter, Cliff, A n d r e w D. and Frey Allan; Locational Analysis in Human Geography; Edward Arnold , 1977,L o n d o n .
Hall , Peter; Urban and Regional Planning; Rout ledge , 1 9 9 2 , London.
Harris, Britton; Urban and Regional Planning in the Third World with GIS Support; in Regional Deve lopmentDia logue , V o l . 1 1 , N o . 3 , Autumn 1990 , United Nat ions Centre for Regional D e v e l o p m e n t , N a g o y a .
Harris, Britton and Batty, Michae l ; Locational M o d e l s , Geographic Information and Planning Support Sys tems; inJournal of Planning Education and Research; 12, 1 9 9 3 , p p . 1 8 4 - 1 9 8 .
Harris , Chauncy D . ; Cities o f the Soviet Union; A A G Monograph Ser ies N o . 5 , Assoc iat ion o f AmericanGeographers , 1 9 7 0 , reprinted in 1 9 7 2 , Washington D . C .
Harris, Trevor M. and E l m e s , Gregory A . ; T h e Application of GIS in Urban and Regional Planning: A Rev iew ofthe North Amer ican Exper ience; in Applied Geography; V o l . 1 3 , N o . l , 1 9 9 3 , p p . 9 - 2 7 .
Hartl, Ph . and C h e n g , F . ; De l imi t ing the Building Heights in a City from the Shadow in a Panchromatic S P O T -Image - Part 2 , Tes t of a Comple te City; in International Journal of Remote Sensing; Vol . 16 , N o . 15, 1995,p p . 2 8 2 9 - 2 8 4 2 .
Harvey , David; M o d e l s of the Evolution of Spatial Patterns in Human Geography; in Chor ley , Richard J. andHaggett , Peter ( eds . ) ; M o d e l s in Geography; Mathuen & C o . , 1968 , London , p p . 5 4 9 - 6 0 8 .
H a r v e y , David; Social Justice and the Citv; Edward Arno ld , 1 9 7 3 , L o n d o n .
Harvey , David; Explanation in Geography; Edward Arnold , 1979 , London.
H a y w o o d , Ian; Sett lement Planning and Deve lop ing Countr ies : The Gezira Exper ience in Sudan; Ekist ics , Vol . 5 2 ,N o . 3 1 3 , July /August 1 9 8 5 , Athens , p p . 3 3 2 - 3 3 7 .
179

Henderson, Floyd M . ; Housing and Population Analyses; in Ford, Kristina (ed.); Remote Sensing for Planners;Centre for Urban Policy Research, 1979, New Jersy, pp. 135-154.
Henderson III, Frederick B.; Remote Sensing for GIS; in GIS World; Vol. 8, No. 2, February, 1995, pp.42-44 (seealso pp.46-47).
Hinton, J.; The Best of Both Worlds: Development GIS for Vector and Raster Data Analysis; in GIS Europe;November, 1994, pp.32-34.
Hofstee, Paul and Budde, Petra; Urban ILWIS Workshop Manual; Vol.1 and 2, Division of Urban Survey andHuman Settlement Analysis, ITC, 1994, Enschede.
Isard, Walter; Regional Science, The Concept of Region, and Regional Structure; in Papers and Proceedings ofRegional Science Association; Vol.2, 1956, pp. 13-26.
Isard, Walter; Methods of Regional Analysis : An Introduction to Regional Science; MIT Press, 1960,Massachusetts.
ISRO; Indian Remote Sensing Satellite - Data Users Handbook; (Revision 1); Indian Space Research Organisation,Department of Space, Government of India, 1989, Bangalore.
ITC; Urbwatch and Urbserve: Programmes for Human Settlements Monitoring and Intervention; Second QuarterlyReport, January - April, 1993, Division of Urban Survey and Human Settlement Analysis, International Institute forAerospace Survey and Earth Sciences, Enschede, the Netherlands.
ITC; ILWIS 1.4 User's Manual; International Institute for Aerospace Survey and Earth Sciences; 1993, Enschede.
ITC; ILWIS 1.4 Beginner's Guide; International Institute for Aerospace Survey and Earth Sciences; 1994, Enschede.
ITC; ILWIS 1.41 Supplement to 1.4 User's Manual; International Institute for Aerospace Survey and Earth Sciences;1994, Enschede.
Jain, Anil K. and Dubes, Richard C; Algorithms for Clustering Data; Prentice Hall, 1988, New Jersy, pp. 1-6, 240-241.
Jensen, John R.; Land Use Analysis in Urbanized Areas; in Ford, Kristina (ed.); Remote Sensing for Planners;Centre for Urban Policy Research, 1979, New Jersy, pp.59-65.
Jensen, John R.; Urban Change Detection Mapping Using Landsat Digital Data; in Holz, Robert K. (ed.); TheSurveillant Science : Remote Sensing of the Environment; John Wiley, 1985, New York.
Jensen, John R.; Introductory Digital Image Processing : A Remote Sensing Perspective; Prentice-Hall, 1986, NewJersey, pp.310-325.
Johnston, R.J. (ed.); The Dictionary of Human Geography; Blackwell, 1981, Oxford.
Jong, Wouter M. de; Geographical Information Systems Database Design : Experiences of the Dutch NationalPhysical Planning Agency; in Scholten, Henk J. and Stillwell, John C.H. (eds.); Geographical Information Systemsfor Urban and Regional Planning; Kluwer Academic, 1990, Dordrecht, pp.43-56.
Kalyanaraman, S., Rajangam, R.K. and Rattan, R.; Indian Remote Sensing Spacecraft - 1C/1D; in InternationalJournal of Remote Sensing; Vol. 16, No. 5, 1995, pp.791-799.
Keeble, Lewis; Principles and Practice of Town and Country Planning; Estates Gazette, 1969, London
Kishore, Kama] and Singh, B.B.; Urban and Regional Planning Information Systems (URIS) in India: Its Need,Prospects and Experiences; in Saini, N.S. (ed.); Urban and Regional Planning Information Systems for India,'' otherESCAP Countries; School of Planning and Architecture, 1987, New Delhi, pp.320-327.
180

Koenigsberger , O . H . ; T h e Absorpt ion of N e w c o m e r s in the Cit ies o f the Third World; Shelter: V o l . V . N o . 2 ;H U D C O , Winter 1 9 8 2 , N e w De lh i .
Krishan, Gopal ; The S l o w i n g D o w n of Indian Urbanisat ion; in Geography; 7 8 ( 1 ) , 1 9 9 3 , p p . 8 0 - 8 4 .
Krueckeberg , D. A . ; Practical D e m a n d for Analytical M e t h o d s , in Planning Theory in the 1980s - a Search forFuture Direct ions , 1 9 8 2 , N e w Jersy, p p . 3 0 9 - 3 4 0 .
Kulshrestha, Satish Kumar; A Proposed Concept of Polarised Activi ty Centres for Spat io -Economic D e v e l o p m e n t ;unpublished P h . D . T h e s i s , Faculty o f Environmental D e s i g n , Ahmadu B e l l o Univers i ty , 1 9 8 0 , Zaria.
Kulshrestha, Sat ish; Rural Urban Continuum in Metro - Reg ions : A Spatial M o d e l ; Paper presented at the AnnualT o w n and Country Planning Seminar , Institute of T o w n Planners , India, 1 9 9 1 , Calcutta, p p . I / K / S K K - 1 - 1 4 .
Kundu, Amitabh; Theor i e s of City S ize Distribution and the Indian Urban Structure - A Reappraisal; unpublishedpaper in the Seminar on 'Urbanisation and Planned E c o n o m i c D e v e l o p m e n t - Present Scenar io and FuturePerspect ives ' ; organised by C S R D , Jawaharlal Nehru Univers i ty , 1982 , N e w De lh i .
Langran, Gail; Manipulat ion and Analys is of Temporal Geographic Information; in Proceed ings of the CanadianInternational Conference on GIS; March 2 3 - 2 5 , 1 9 9 3 , Ottawa, p p . 8 6 9 - 8 7 9 .
L e e , D o u g l a s s B. Jr.; Requiem for Large-Scale M o d e l s ; in Journal of the American Institute of Planners; V o l . 3 9 ,N o . 3 , M a y 1 9 7 3 , pp . 1 6 3 - 1 7 8 .
L e m a n , Alexander B . ; Human Sett lements : The Second Def init ion; Ekist ies; V o l . 5 4 , N o . 3 2 5 / 3 2 6 / 3 2 7 , Ju ly /Aug-N o v / d e c 1 9 8 7 , Athens , p p . 2 4 3 - 2 4 8 .
Linden, E u g e n e ; M e g a Cit ies; T I M E International - The W e e k l y N e w s M a g a z i n e , Vol . 1 4 1 , N o . 2 , January 11 ,1993 , N e w York (edition sold in Amsterdam) .
Lindenlaub, John C; Remote Sens ing: What i s it?; Fundamenta ls o f Remote Sens ing , Min i - ser ie s , Purdue ResearchFoundat ion, 1 9 7 6 , Indiana.
Loodts , J . and S t e e n m a n s , C; Digital Orthophotos and GIS: The Perfect Couple ; in Genderen , J . L . van , Zuidam,R.A. van and Pohl , C. (eds . ) ; Proceed ings of the International Sympos ium on Operationalisation of Remote Sensing;Vol . 6 , International Institute for Aerospace Survey and Earth S c i e n c e s , 1 9 9 3 , Enschede , p p . 2 0 5 - 2 1 6 .
Lowe l l , A m y ; M e n , W o m e n and Ghosts (1916) ; co l lected in The Comple te Poetical W o r k s o f A m y Lowel l ;Houghton Miff l in, 1955 , Bos ton , p p . 7 5 - 7 6 .
L y n c h , Kev in; T h e Image of the City; T h e M . I . T . Press , 1960 (13th Printing, 1975 ) , Cambridge .
M a b o g u n j e , A . L . ; Growth Poles and Growth Centres in Regional Deve lopment in Nigeria; ( U N R I S D Report N o .7 1 . 3 ) , G e n e v a , 1 9 7 1 , p . 3 .
Mahavir ( e d . ) ; Information T e c h n o l o g y for Urban and Regional Planning; unpublished compilat ion; School ofPlanning and Architecture, 1 9 9 1 , N e w De lh i .
Mahavir and Al -Amir , Sahar; Def in ing Urban Sett lements: Certainties Regarding Uncertainties; in Proceedings ofthe Second International S y m p o s i u m on Spatial Accuracy Assessment in Natural Resources and EnvironmentalS c i e n c e s . US Department o f Agriculture, Forest Serv i c e , 1 9 9 6 , Fort Col l ins , p . 7 2 4 .
Mahavir and Galema, Marjon; Monitor ing Urban Growth U s i n g S P O T Images and Aerial Photographs; ITC Journal,1 9 9 1 - 2 , E n s c h e d e , p p . 6 3 - 6 9 .
Mahavir and Sokhi , Ba ldeo Singh; Drainage Characteristics of an Area as a Determinant of Urban Deve lopment ;unpublished M . S c . T h e s i s , School o f Planning and Architecture , 1982 , N e w De lh i .
181

Mandelbrot , Benoi t B . ; The Fractal Geometry of Nature; W . H . Freeman, 1983 , San Francisco .
M a s s a m , Bryan H . ; Spatial Search - Application to Planning Problems in the Public Sector; P e r gamon, 1980 ,
Oxford.
Masser , Ian and Campbe l l , Heather; Condit ions for the Effect ive Uti l ization of Computers in Urban Planning inDeve lop ing Countr ies ; in Y e h , Anthony G .O. (ed . ) , Proceedings of the International Conference on Computers inUrban Planning and Urban M a n a g e m e n t ; Centre of Urban Studies and Urban Planning, Univers i ty of H o n g K o n g ,1989, p p . 4 3 9 - 4 5 5 .
Masthan, G. Bhanu, Kannan, S . , Lakshmi , R . S . , Ravikumar, A . , Shanti , P . N . , D a s , R .K. , Varadan, Geeta,Parthasaradhi, E . V . R . and Krishnanunni, K.; Indian National Geographic Information System - An Approach; inGIS for the 1990s; Proceed ings of the National Conference , 1990, Ottawa, p p . 3 3 0 - 3 4 2 .
Maure l , Pierre; Spot Image Offer N e w GIS T o o l s ; in GIS Europe; V o l . 2 , N o . 9 , October , 1 9 9 3 , p p . 4 6 - 4 8 .
M a y h e w , Susan and Penny Anne; The Conc i se Oxford Dict ionary of Geography; Oxford Univers i ty , 1 9 9 2 , Oxford .
M c H a r g , Ian L . ; Des ign With Nature; American M u s e u m of Natural History, 1969 , N e w York.
M c H a r g , Ian; Past, Present and Future of GIS; in GIS World . V o l . 8 , N o . 10 , October , 1995 , p p . 4 6 - 4 9 .
Mei jer , Evert N. and Kuipers , Karlijne W . ; GIS: Starts at the Bottom! The U s e of L o w End GIS Appl icat ion, inTeef fe l en , Pieter van, Grunsven, L e o van and Verkoren , Otto ( eds . ) , Possibi l i t ies and Constraints of GISApplicat ions in Deve lop ing Countries; Proceed ings of the G I S D E C O Seminar organized by the GIS Working Groupof the Faculty of Geographical S c i e n c e s , Utrecht Universi ty (7-8 April , 1 9 9 1 ) , N G S 1 5 2 , 1 9 9 2 , Utrecht, p p . 4 5 - 4 9 .
Meshram, D . S . and Bansal , R . P . ; Legal Provis ions for Public Participation in Urban Planning Process withReference to 74th A m e n d m e n t Ac t 1 9 9 2 ; in Journal of the Institute of T o w n Planners, India; V o l . 1 2 , N o . 1(155) ,September , 1 9 9 3 , N e w Delh i , p p . M .
M e y e r , Iain R. and Huggett , Richard J.; Sett lements; Harper and R o w , 1 9 8 1 , London.
Michalak , W i e s l a w Z . ; GIS in Land U s e Change Analysis: Integration of Remote ly Sensed Data into GIS; in AppliedGeography; V o l . 1 3 , N o . l , 1 9 9 3 , p p . 2 8 ^ 4 .
Mi l l s , Edwin S.; Urban Densi ty Functions; in Urban Studies; Vol . 7 , 1970 , G l a s g o w , p p . 5 - 2 0 .
Mi l l s , Edwin S. and Becker , Charles M . ; Studies in Indian Urban D e v e l o p m e n t ; World Bank Research Publ icat ion,Oxford University Press , 1986 , p p . 4 4 - 7 2 .
Misra , B . ; Optimum S i z e for a City; unpublished M . S c . T h e s i s , Schoo l of Planning and Architecture , 1966 , N e wDelh i .
Misra , P . ; Application of Remote Sens ing in Analys ing Sett lement Structure in Metropol i tan Reg ions ; inPhotonirvachak; Journal of the Indian Soc ie ty of Remote Sensing; V o l . 1 7 , N o . 3 , 1989 , Dehradun, pp. 1-9.
Misra , P . ; Transfer of Remote Sens ing to Users - Analys i s of Factors for M a n a g e m e n t of Change ; in Genderen , J .L .van, Zu idam, R . A . van and Pohl , C. ( eds . ) ; Proceedings of the International S y m p o s i u m on Operational izat ion ofRemote Sens ing: V o l . 1 , ITC, 1 9 9 3 , Enschede , p p . 5 7 - 6 7 .
Mor ley , Dav id , Proudfoot , Stuart and Burns , T h o m a s ( eds . ) ; Making Cities Work : The D y n a m i c s of UrbanInnovation: C r o o m H e l m , 1980 , London.
Morri l l , Richard; Populat ion Redistribution within Metropol i tan Reg ions in the 1980s: C o r e , Satell ite, and ExurbanGrowth; in Growth and C h a n g e . Vol . 2 3 , S u m m e r , 1992 , p p . 2 7 7 - 3 0 2 .
Morr i s , Wi l l iam; Amer ican Heritage Dict ionary of the English Language; Houghton Miff l in , 1 9 7 6 , Massachuset ts .
182

Muller , Jean-Claude; Latest D e v e l o p m e n t s in GIS/LIS; in International Journal of Geographical Information Systems;V o l . 7 , N o . 4 , 1 9 9 3 , p p . 2 9 3 - 3 0 3 .
Nagpaul , Hans; De lh i ; in D o g a n , Mattei and Kasarda, John D. (eds . ) ; The Metropol is Era ( V o l . 2 ) Mega-Ci t i e s :S a g e , 1 9 8 8 , N e w b u r y Park, pp. 1 8 4 - 2 1 1 .
Nangia , Sudesh; De lh i Metropoli tan Reg ion : A Study in Sett lement Geography: K . B . Publicat ions, 1976 , N e w
Delh i .
Nath, V . ; Planning for De lh i ; in GeoJournal; V o l . 2 9 , N o . 2 , February, 1 9 9 3 , Dordrecht , p p . 1 7 1 - 1 8 0 .
National Capital Reg ion Planning Board; Interim D e v e l o p m e n t Plan - 2001 - National Capital Reg ion; Ministry ofUrban D e v e l o p m e n t , Government o f India; 1987 , N e w Delh i .
National Capital Reg ion Planning Board; Regional Plan 2001 - National Capital Reg ion: Ministry of Urban
D e v e l o p m e n t , G o v e r n m e n t o f India; 1 9 8 8 , N e w De lh i .
Newkirk , Ross T. and W a n g , Fangju; Integrating Remote Sens ing and Geographic Information System Knowledgein an Expert Sy s t e m for Change Detect ion; in Y e h , Anthony G . O . (ed . ) , Proceedings of the International Conferenceon Computers in Urban Planning and Urban Management ; Centre of Urban Studies and Urban Planning, Universityo f H o n g K o n g , 1 9 8 9 , p p . 2 4 5 - 2 5 4 .
Ni l s son , Sten; T h e N e w Capitals of India. Pakistan and Bangladesh: Scandinavian Institute of Asian StudiesMonograph Ser ies ; Studentlitteratur, 1 9 7 3 , Lund.
N o e , Samuel V . ; T h e Wal led City of Delhi : Retrospect and Prospect; in Amirahmadi , Hooshang and El-Shakhs ,Salah S. ( eds . ) ; Urban D e v e l o p m e n t in the Musl im World; Centre for Urban Po l i cy Research, 1 9 9 3 , N e wBrunswick, p p . 7 2 - 9 3 .
N o r d b e c k , Sting; Urban Al lometric Growth; in Geograf iska Annaler: 53 B, 1 9 7 1 , p p . 5 4 - 6 7 .
N o r o n h a , Cec i l ; Urban D e v e l o p m e n t Regional Pol icy - N C R M o d e l ; paper presented at the Inter-State Workshopon N C R S u b - R e g i o n s : Planning and D e v e l o p m e n t Implications; Organised by the Institute of T o w n Planners, India,1 9 9 4 , N e w De lh i .
Odland, John; Spatial Autocorrelat ion: S a g e , 1988, California.
Openshaw, Stan; S o m e Sugges t ions Concern ing the D e v e l o p m e n t of Artificial Intel l igence Tools for SpatialMode l l ing and Analys i s in GIS; in Fischer , Manfred M. and Ni jkamp, Peter (eds . ) ; Geographical InformationSystems: Spatial Mode l l ing and Po l i cy Evaluat ion; Springer-Verlag , 1 9 9 3 , Berl in , pp. 17 -33 .
Operational Research Group; N C R ' s E c o n o m y and its Industrial D e v e l o p m e n t Potential - Interim Report - II, Vol .II, Industrial D e v e l o p m e n t Control ; (for the National Capital Regional P lan) , 1 9 9 4 , Baroda.
Ottens, H . F . L . ; T h e Proliferation of GIS: H o w About the D e v e l o p i n g Countries; in Tee f fe l en , Pieter van, Grunsven,Leo van and Verkoren , Otto (eds . ) , Possibilit ies and Constraints of GIS Applicat ions in Deve lop ing Countries;Proceed ings of the G I S D E C O Seminar organized by the GIS Working Group of the Faculty of GeographicalS c i e n c e s , Utrecht Univers i ty (7-8 April , 1991) , N G S 152 , 1 9 9 2 , Utrecht, p p . 2 7 - 3 4 .
Ottens, H . F . L . ; GIS Meta-Information and Expertise; in Harts, Janjaap, Ottens, Henk F . L . and Schol ten , Henk,J. ( eds . ) ; Proceedings of the Third European Conference on Geographical Information System (EGIS) , Munich ,EGIS Foundation, Utrecht , 1992 , pp . 1 4 9 3 - 1 5 0 1 .
Pahl, Ray; 'Urban Manager ia l i sm' Recons idered; in Par is , Chris ( e d . ) , Critical Readings in Planning T h e o r y .P e r g a m o n Press , 1 9 8 2 , Oxford , p p . 4 7 - 6 7 .
Pandey , Pradeep K.; Sustainabilisation of a Metropol i s : National Capital Region for a Better Delhi ; in Prospect;N o . 1/2, 1 9 9 2 , p p . 5 - 9 .
183

Paris, Chris; Editorial Introduction to Part T w o ; in Paris , Chris ( e d . ) , Critical Readings in Planning T h e o r y .Pergamon Press , 1982 , Oxford, p p . 4 3 - 4 4 .
Pathan, S .K. , Sastry, S . V . C . , D h i n w a , P . S . , R a o , Mukund and Majumdar , K . L . ; Urban Growth Trend Analys isUs ing GIS Techniques - A case Study of the B o m b a y Metropol i tan Region; in International Journal of RemoteSensing; V o l . 14 , N o . 17 , 1 9 9 3 , p p . 3 1 6 9 - 3 1 7 9 .
Pattison, Mark; Isaac Casaubon; Clarendon Press , 1 8 9 1 , Oxford , (reprinted by Slatkine Reprints, 1 9 7 0 , G e n e v e ) ,p . 4 2 2 .
Paulsson, Bengt; Urban Applicat ions of Satellite Remote Sens ing and GIS Analys i s ; Urban M a n a g e m e n t Discuss ionPaper U M P 9 , The World Bank, 1992 , Washington , D . C .
Perov ic , M i l o s R.; Research into the Urban Structure of Belgrade; Ekistics; V o l . 5 4 , N o . 3 2 5 / 3 2 6 / 3 2 7 , Ju ly /Aug-N o v / D e c 1987 , p p . 3 0 1 - 3 1 0 .
Perroux, F . ; E c o n omic Space: Theory and Appl icat ion; in Quarterly Journal o f E c o n o m i c s ; Vol . 6 4 , N o . l ,February, 1950 , p p . 8 9 - 1 0 4 . (reprinted in Friedmann and Al o nso ( eds . ) , 1964) .
Perroux, F.; 'Note sur la notion de po la de cro i s sance ' , 1 9 5 5 , quoted from Hermansen , T . ; D e v e l o p m e n t Po les andDeve lopment Centres in National and Regional deve lopment : Elements of a Theoretical Framework; in Kuklinski,A. (ed . ) ; Growth Poles and Growth Centres in Regional Planning; Mouton , 1972 , T h e Hague .
Physical Research Laboratory; Study on Settlement Sys tems - Phase II - Parts I-III (Rajasthan, Haryana, UttarPradesh); unpublished study commiss ioned as background work for the National Capital Regional Plan 2 0 0 1 ;(undated), Ahmedabad .
Plummer, S . E . , D a n s o n , F . M . and W i l s o n , A . K . ; A d v a n c e s in Remote Sensing T e c h n o l o g y ; in D a n s o n , F . M . andPlummer , S . E . ( eds . ) ; Advances in Environmental Remote Sens ing; John W i l e y , 1 9 9 5 , Chichester , pp. 1-7.
Pol le \ V . F . L . ; Detect ion of City Growth Areas U s i n g S P O T Image Interpretation; in International Arch ives ofPhotogrammetry and Remote Sensing; V o l . 2 7 , Part B9 Supplement , 1988 , Kyoto .
Pol le , V . F . L . (in cooperat ion with Juppenlatz, M . ) ; Moni tor ing and Measur ing Human Sett lement Changes byRemote Sensing M e thods - a Case Study with SPOT Images of Bandung , Indonesia; Report b c r s - 8 8 - 1 6 c . Project no .4 5 3 3 / T O - 3 . 1 1 , Netherlands Remote Sensing Board (Be l e idscommiss i e Remote Sens ing) , 1 9 8 8 , Delft .
Pol le , V . F . L . ; Growing Cities: Education and Research in Remote Sens ing and Geo-Information Sys tems for UrbanInformation; paper presented at the Seminar on Training and Education in Remote Sens ing for Resource M a n a g e m e n t(Silver Jubilee Celebrat ions) , Indian Institute of Remote Sens ing , 1992 , Dehradun.
PolIe\ Victor F . L . ; S P O T for Urban Areas - Workshop and Reader; Divis ion of Urban Survey and HumanSettlement Analys i s , ITC, 1 9 9 3 , Enschede .
Pol le , Victor F . L . ; Monitoring Urban D e v e l o p m e n t in Chiang M a i , Thai land : User Friendly Products from RemoteSensing and GIS for the T o w n Planning Offices; in P r o c e e d i n g s of the ISPRS C o m m i s s i o n VII S y m p o s i u m ; 'RemoteSensing of Human Set t lements ' , V o l . 3 0 , Part 7 b , September , 1994 , Rio de Janeiro, p p . 3 4 1 - 3 4 8 .
Pol le , Victor F . L . ; T h e U s e of Satellite Remote Sens ing for Urban Planning and M a n a g e m e n t in Deve lop ingCountries; in Remote Sensing Newsle t ter ; De Remote Sens ing Nieuwsbrief , Nationaal N i e u w s ; The (Dutch) Po l i cyCommiss ion Remote Sens ing (BCRS) , Nr . 6 4 , October , 1995 , p p . 2 6 - 3 1 .
Polle\ V . F . L . and Sl iuzas , R . V . ; T h e ITC's Exper ience with Urban and Regional Planning Information Sys tems;in Saini , N . S . ( ed . ) ; Urban and Regional Planning Information Sys tems for India 7 other E S C A P Countries; Schoolof Planning and Architecture, 1987 , N e w Delh i , pp. 1 4 5 - 1 4 9 .
Pratt, Wil l iam K.; Digital Image Process ing; John W i l e y , 1978 , N e w York, p p . 5 6 8 - 5 8 7 .
184

Preston, Richard E . ; Christal ler's Research on the Geography of Administrat ive Areas; in Progress in HumanG e o g r a p h y . V o l . 1 6 , N o . 4 , October 1992 , N e w York, p p . 5 2 3 - 5 3 9 .
Qa iyum, A . ; Regional D e v e l o p m e n t Planning in India : A Retrospect; in Journal of the Institute of T o w n Planners.India; V o l . 1 , N o . 1 - 2 ( 1 1 2 - 1 1 3 ) , 1 9 8 2 , N e w Delh i , p p . 2 5 - 3 9 .
Rao, K . M . Lakshmana; Remote Sens ing for Land U s e Planning; in International Journal of Remote Sens ing; V o l . 1 6 ,N o . l , 1 9 9 5 , p p . 5 3 - 6 0 .
Ratcliffe, John; An Introduction to T o w n and Country Planning: U C L Press , 1 9 8 1 , (7th Impress ion , 1992 ) , London.
Reif, Benjamin; M o d e l s in Urban and Regional Planning; Leonard Hill , 1 9 7 3 , L o n do n .
Remote Sensing nieuwsbrief; IRS-1C launched; T h e (Dutch) Pol icy C o m m i s s i o n Remote Sens ing ( B C R S ) , nr .66 ,February, 1 9 9 6 , Delf t , p p . 4 7 - 4 9 .
Rhind, David and H u d s o n , Ray; Land U s e ; M e t h u e n , 1 9 8 0 , N e w York, p p . 6 9 - 1 2 5 .
Ribeiro, E . F . N . ; Transfer o f Major Empl oyment Generators from Delhi ; in Delhi Vikas Varta: V o l . 4 , N o . l ,January-March, 1 9 9 3 , N e w Delh i , p p . 4 - 8 .
Richardson, Harry W . ; Regional Growth Theory; M a c M i l l a n , 1974 , London .
Robson , Wi l l iam A. and Regan, D . E . (eds . ) ; Great Cit ies of the World: Their G o v e r n m e n t . Pol i t ics and Planning;V o l . 1 , G e o r g e A l l e n and U n w i n , 1 9 7 2 , London , p . 4 1 0 .
Rondinel l i , De nn i s A . ; Secondary Cit ies in D e v e l o p i n g Countries; S A G E , 1 9 8 3 , California.
Rondinel l i , De nn i s A . ; Appl ied Methods of Regional Analys i s - The Spatial D i m e n s i o n s of D e v e l o p m e n t Pol icy;W e s t v i e w , 1 9 8 5 , Co lorado .
R o s e n , Kenneth T. and Mitchel Resnick; T h e S ize Distribution of Cit ies: An Examination of the Pareto L a w andPr imacy; in Journal of Urban E c o n o m i c s ; V o l . 8 , 1 9 8 0 , pp. 1 6 5 - 1 8 6 .
R o y , Prodipto and Patil, B .R. (eds . ) ; Manual for Block Level Planning; M a c M i l l a n India, 1 9 7 7 , Delhi .
Roya l tey , H . H . , Astrachan, E. and Sokal , R.R. ; Tests for Patterns in Geographic Variation; in GeographicalAnalys is : V o l . V H , October , 1975 , p p . 3 6 9 - 3 9 5 .
Sabins , F loyd F. Jr.; Remote Sens ing Principles and Interpretation; F r e e m a n , 1987 , N e w York.
S A C - T C P O ; A GIS Based Information System for Regional Planning -A case Study for Bharatpur District;Government of India, S p a c e Application Centre , Ahemadabad , and T o w n and Country Planning Organisat ion, 1992 ,N e w Delhi .
Saha , S h o v a n K.; Conservat ion Based D e v e l o p m e n t of Shahjahanabad : the Historic Capital City of India;unpublished P h . D . T h e s i s , Univers i ty o f K y o t o , 1992 . (under print).
Saini , N . S . ( ed . ) ; Urban and Regional Planning Information Systems for India/ other E S C A P Countries; Schoo l ofPlanning and Architecture , 1987 , N e w Delhi .
Saini , N . S . and Mahavir (eds . ) ; Urban Deve lopment Planning Strategies and Techniques ; Schoo l of Planning andArchitecture , 1 9 8 5 , N e w D e l h i .
Saini , N . S . and Sinha, R . L . P . ; Integrated D e v e l o p m e n t Planning for a Watershed: Schoo l of Planning andArchitecture , 1985 , N e w Delhi .
185

Scho l ten , Henk J. and St i l lwel l , John C . H . ; Geographical Information Sys tems: The Emerg ing Requirements; inScho l ten , Henk J. and St i l lwel l , John C . H . (eds . ) ; Geographical Information Systems for Urban and RegionalPlanning; Kluwer A c a d e m i c , 1990 , Dordrecht , p p . 3 - 1 4 .
School of Planning and Architecture; Study on Environment and E c o l o g y of the National Capital Region; unpublishedDraft Final Report , September , 1 9 9 4 , N e w De lh i .
Sharma, H.K. ; D e v e l o p m e n t and Financial Implications - U . P . Sub-Region of National Capital Reg ion; paperpresented at the Inter-State Workshop on N C R Sub-Reg ions : Planning and D e v e l o p m e n t Implications; organisedby the Institute of T o w n Planners , India, 1994 , N e w Delhi .
Sharma, Jagdish Saran; The National Geographical Dict ionary of India; Sterl ing Publishers, 1972 , N e w De lh i .
Shel ton, Ronald N. and Estes , John E . ; Remote Sens ing and Geographic Information Sys tems: An Unreal izedPotential; in Geo-Process ing; 1 (1981) , Amsterdam, p p . 3 9 5 - 4 2 0 .
S ingh, Kanchan; Sett lement Structure and Process of Regional D e v e l o p m e n t - A Case Study of Bundelkhand;unpublished P h . D . T h e s i s , School o f Social S c i e n c e s , Jawaharlal Nehru Univers i ty , 1 9 8 1 , N e w Delhi .
Sinha, B . P . ; Investment Pol ic ies and Financial Implications of the Haryana Sub-Regional Plan; paper presented atthe Inter-State Workshop on N C R Sub-Reg ions : Planning and D e v e l o p m e n t Implications; organised by the Instituteo f T o w n Planners, India, 1994 , N e w De lh i .
S m a i l e s , Arthur E . ; The Geography o f T o w n s ; Hutchinson's Univers i ty , 1 9 5 3 , L o ndo n . (As rev iewed by M a y e r ,Harold M . ; Economic Geography; 3 0 , 1 9 5 4 ) .
Sokhi , B . S . and Sharma, N . D . ; Urban Sprawl Moni tor ing and Mapping - Delhi ; unpublished report. HumanSett lements Analys is Group , Indian Institute of Remote Sens ing , 1989 , Dehradun.
Sokhi , B . S . , Sharma, N . D . and Uttarwar, P . S . ; Satell ite Remote Sensing in Urban Sprawl Mapping & Moni tor ing:A case Study of Delhi ; in Photonirvachak: Journal of the Indian Soc ie ty of Remote S e n s i n g , V o l . 17 , N o . 3 , 1989 ,Dehradun, p p . 5 7 - 6 9 .
Stamp, Sir Dudley ( ed . ) ; T h e Longmans Dict ionary o f Geography; L o n g m a n s , 1966 , London .
Stamp, Sir Dudley and Clark, Audrey N. ( eds . ) ; A Glossary of Geographical Terms; L o n g m a n , 1979 , L o ndo n .
Stanford Research Institute, M e n l o Park; School of Planning and Architecture, N e w Delhi and Smal l IndustryExtension Training Institute, Hyderabad; Costs of Urban Infrastructure for Industry as Related to City Size inD e v e l o p i n g Countries : India Case Study; A g e n c y for International D e v e l o p m e n t , 1968 , M e n l o Park.
Stewart, John Q. and Warntz , Wi l l iam; Phys ics of Population Distribution; in Journal of Regional S c i e n c e : V o l . 1 ,N o . l , S u m m e r , 1 9 5 8 . p p . 9 9 - 1 2 3 .
Subudhi 1 , A . P . , Badrinath, K . V . S . and G o v i l , S .K.; Digital Image Process ing of IRS-LISS-II Data for Urban Studies- Case Study of Delhi ; in Photonirvachak; Journal of the Indian Soc ie ty of Remote Sens ing; V o l . 1 7 , N o . 3 , 1989 ,Dehradun, p p . 3 5 - 4 2 .
Subudhi 2 , A . P . , Sharma, N . D . and Mishra , Debajit; U s e of Landsat Themat ic Mapper for Urban Landuse / LandC o v e r Mapping; in Photonirvachak; Journal of the Indian Soc ie ty of Remote Sens ing; V o l . 1 7 , N o . 3 , 1989 ,Dehradun, p p . 8 5 - 9 9 .
Tee f fe l en , Pieter van, Grunsven , L e o van and Verkoren , Otto ( eds . ) , Possibil i t ies and Constraints of GISApplicat ions in Deve lop ing Countries; Proceed ings of the G I S D E C O Seminar organized by the GIS Work ing Groupof the Faculty of Geographical S c i e n c e s , Utrecht Univers i ty (7-8 Apri l , 1991) , N G S 152 , 1992 , Utrecht.
Tel l ier , L . N . ; From the Weber Problem to a T o p o d y n a m i c ' Approach to Locational S y s t e m s ; in Environment andPlanning A . V o l . 2 4 ( 6 ) , 1 9 9 2 , L o n d o n , p p . 7 9 3 - 8 0 6 .
186

T h e Daily Te legraph; City of the Future may tow South for Winter; in T h e Dai ly Te legraph; September 2 2 , 1995 ,London , p . 15.
T h o m p s o n , D ' A r c y Wentworth; On Growth and Form; Cambridge Univers i ty Press , 1952 .
T h u n g , H . L . ; Prob lems and Prospects of Remote Sens ing for Planning; in D e v e l o p m e n t and Appl icat ions of RemoteSens ing for Planning. Management and Dec i s ion Making; Seminar (Beij ing) Proceedings , U N D P / E S C AP RegionalRemote Sens ing P r o g r a m m e , 1985 , Bangkok, p p . 7 9 - 8 1 .
T I M E International - T h e Week ly N e w s M agaz i ne ; V o l . 1 4 7 , N o . 8 , February 19, 1996 , N e w York (the Edition soldin Amsterdam) , inside c o v e r 1.
Tobler , R . W a l d o ; Satellite Confirmation o f Sett lement S ize Coeff ic ients; in A R E A ; V o l . 1 , N o . 3 , 1969 , London,p p . 3 0 - 3 4 .
T o b l e r , W . R . ; Resolut ion, Resampl ing and all that; in M o u n s e y , H. and T o m l i n s o n , R . F . (eds . ) , Building Databasesfor Global S c i e n c e ; Tay lor and Francis , 1988 , London, pp. 129-137 .
T o u , Julius T . and G o n z a l e z , Rafael C; Pattern Recogni t ion Principles; A d d i s o n - W e s l e y , 1974 , Massachusetts ,p p . 5 - 9 .
T o w n and Country Planning Organisat ion; The National Capital Regional Plan; Ministry of Works and Hous ing ,Government o f India; undated (approx. 1974 ) , N e w De lh i .
U N C H S ; Report of Habitat: United Nat ions Conference on Human Sett lements . 31 M a y - 1 1 June, 1976 , ( U NPublication Sales N o . E . 7 6 . I V . 7 ) , Vancouver , p . 3 7 .
U N C H S (Habitat); Global Report on Human Sett lements; U N C H S , 1 9 8 6 , Oxford.
U N C H S ; U N C H S (Habitat) Trilingual Thesaurus in the Field of Human Sett lements; U N C H S , 1986 , Nairobi .
U N C R D ; GIS in Regional Deve lopment Planning. Proceeding of the Study Group M e e t i n g on Regional and GlobalE c o n o m i c Integration, D e v e l o p m e n t Planning, and Information T e c h n o l o g y , 11-14 N o v e m b e r , 1 9 9 1 , U N C R D , 1992,N a g o y a .
U N C R D ; Planning Problems . M o d e l s , and Geographic Information Sys tems; Report and Summary of Proceedingof the M a l a y s i a - U N C R D International Expert Group M e e t i n g on Regional Planning in the 1990s: Us ing andM a n a g i n g Geographic Information, Kuala Lumpur , Malays ia , 24 -28 September , 1990 , U N C R D , 1 9 9 1 , N a g o y a .
U n w i n , David; Introductory Spatial Analys i s ; Methuen , 1 9 8 1 , London.
Venugopal , G. and Turcotte , Kevin M . ; Land U s e / C o v e r Classif ication U s i n g Enhanced IRS-1A LISS 1 Data - A Case Study of Calcutta Metropoli tan District , India - 1989; in GeoJournal; V o l . 2 9 , N o . 2 , 1 9 9 3 , pp. 1 3 9 - 1 4 1 .
Voute , Caesar; Satell ite Remote Sensing for D e v e l o p i n g Countries : Prospects and Constraints; in Satellite RemoteSens ing for D e v e l o p i n g Countries; Proceed ings o f E A R S e L - E S A S y m p o s i u m , 1982, Paris, p p . 1 9 3 - 2 0 0 .
W e b b e r , M e l v i n M . ; T h e Urban Place and the Nonplace Urban Rea lm; in W e b b e r , M e l v i n M . , D y c k m a n , John W . ,F o l e y , Donald L . , Guttenberg, Albert Z . , Wheaton , Wil l iam L . C . , and Wurster, Catherine Bauer; Explorations intoUrban Structure; Univers i ty of Pennsylvania , 1964 , Phi ladelphia , p p . 7 9 - 1 5 3 .
Webber , Me lv in M . ; Comprehens ive Planning and Social Responsibil i ty: Toward an AIP Consensus on theProfess ion's Roles and Purposes; in Faludi, Andreas ( ed . ) ; A Reader in Planning Theory; Pergamon Press , 1 9 7 3 ,Oxford .
W e b e r , C , Hirsch, J . and Diebo ld , F . ; Urban Growth : Change Analys is ( 1 9 8 6 - 8 9 ) Us ing T w o S P O T S c e n e s ; inPhoto Interpretation Images Aeriennes e t Spatiales; N o . 1 9 9 0 - 6 , D e c e m b e r , pp.39^44.
187

Westerlund, Frank V . ; Land U s e Analys i s in Urbanized Areas; in Ford, Kristina (ed . ) ; Remote Sensing for Planners;Centre for Urban Pol icy Research , 1 9 7 9 , N e w Jersy, p p . 9 5 - 1 2 1 .
Whitehand, J .W.R. ; Recent A d v a n c e s in Urban M o r p h o l o g y ; in Urban Studies: V o l . 2 9 , N o s . 3 / 4 , 1992 , G l a s g o w ,p p . 6 1 9 - 6 3 6 .
Wi l son , A . G . ; Urban and Regional Mode l s in Geography & Planning; John W i l e y , 1974 , London .
Wi l son , A . G . ; Research Methods for Urban and Regional Mode l l ing ; in Wi l son , A . G . , R e e s , P . H . and Le igh , C M .(eds . ) ; M o d e l s of Cities and Regions: Theoret ical and Empirical D e v e l o p m e n t s ; John W i l e y , 1977 , London , pp . 1-21.
Wilson A . G . and Kirkby, M.J . ; Mathematics for Geographers and Planners; Oxford, 1975 , London.
W o g a y e h u , Girma; Application of Remote Sens ing to Assess Urban Growth and Hous ing Dens i ty Change in a DataPoor Environment; Case Study of So ko t o City; unpublished M . S c . Thes i s , ITC, 1993 , Enschede .
Woldenberg , ; M.J . ; An Al lometric Analys is of Urban Land Uses in the United States in Ekist ics; V o l . 3 6 , 1 9 7 3 ,p p . 2 8 2 - 2 9 0 .
Yeung , Albert and Hall , G. Brent; D e s i g n i n g a Digital Urban Topographic Database for Appl icat ions in UrbanPlanning and Management ; in Y e n , Anthony G.O. ( e d . ) , Proceed ings of the International Conference on Computersin Urban Planning and Urban Management ; Centre of Urban Studies and Urban Planning, Univers i ty of H o n g K o n g ,1989, p p . 2 6 3 - 2 7 3 .
Zutshi, Bhupinder; Sett lement Structure and Spatial Organization - A Case Study of Kashmir Val ley; unpublishedP h . D . research, Schoo l o f Social Sc i ences , Jawaharlal Nehru Univers i ty , 1986 , N e w Delh i .
188

INDEX
Act 8, 5 4 , 100 , 106, 117, 119, 130, 136, 138, 139 , 170 , 182Constitution amendment 8 , 5 4 , 117, 119, 130 , 1 3 6 , 1 3 8 , 139 , 170 , 182N C R 106 , 117N C T 100, 138 , 139
arrangement 19, 2 6 - 2 9 , 3 9 , 122assemblage 6 , 1 2 5 - 1 2 7 , 1 2 9 - 1 3 2 , 1 3 5 , 136 , 140autocorrelation 2 5 , 2 6 , 2 9 , 3 1 , 5 8 , 7 9 , 1 2 2 , 1 2 4 , 178, 183
boundary 8 - 1 0 , 4 5 , 5 7 , 9 7 , 109 , 114 , 122 , 135 , 136 , 139 , 154 , 156 , 157, 173administrative 8 , 4 5 , 135 , 136 , 139 , 157territorial 139
built-up 6 , 9 , 17 , 18, 3 8 , 5 7 , 7 6 - 7 8 , 1 5 4 , 156
C B A 18 , 3 1 , 3 3 , 5 7 - 5 9 , 7 3 - 7 5 , 7 7 - 7 9 , 8 6 , 1 1 8 - 1 2 2 , 124 , 126 , 127 , 1 2 9 - 1 3 1 , 149 , 157cluster 2 0 - 2 2 , 2 4 , 2 8 , 3 1 , 6 6 , 173clustering 1 , 2 1 - 2 4 , 2 6 , 4 2 , 4 3 , 5 3 , 5 7 , 1 2 2 , 1 4 0 , 180communi ty 1 , 5 , 10, 15, 16, 18, 3 5 , 4 6 , 7 0 , 8 8 , 9 1 , 174Constitution 8 , 5 4 , 100 , 117 , 130 , 136 , 138 , 139 , 170CSR 2 7 , 2 8 , 1 2 2 , 168curtilage 18 , 120 , 154 , 156 , 157
data-poor 137D D A 8, 9 7 , 9 8 , 100 , 101 , 107 , 116 , 136 , 141 , 148Delhi 3 , 4 , 8 , 9 , 2 9 , 7 1 , 7 2 , 7 7 , 9 1 , 9 7 - 1 1 4 , 1 1 6 - 1 1 8 , 120 , 121 , 1 2 4 , 126 , 127 , 129 , 1 3 0 - 1 3 2 , 135 , 138, 139 ,
1 4 1 , 1 4 2 , 1 4 4 - 1 4 6 , 148 , 154 , 156 , 157, 160 , 1 6 1 - 1 6 4 , 1 6 6 - 1 6 8 , 1 7 3 , 1 7 5 - 1 8 8 , 190dimens ion 12 , 14 -16 , 8 2 , 9 0dispersion 1 9 , 2 6 - 2 8 , 122distribution 9 , 2 4 , 2 5 , 2 8 , 2 9 , 3 7 , 3 9 , 4 0 , 4 3 , 4 4 , 5 1 , 5 3 - 5 5 , 5 7 , 5 8 , 7 2 , 7 3 , 1 0 3 , 1 1 0 , 122 , 129 , 1 6 1 , 168,
179 , 1 8 1 , 185 , 186D M A 107 , 109 , 1 1 0 , 1 1 2 , 138, 161-163
F C C 74f i e l d check 7 7f lexible 5 8 , 8 0 , 119 , 137formal 5 , 2 6 , 3 3 , 3 5 , 5 8 , 9 1 , 1 1 7 , 1 3 5functional couple 1 3 1 , 1 3 3 , 135
general isat ion 3 1 , 136, 154generic 3 GIS 2 , 4 , 8 , 2 1 , 3 5 , 5 6 , 6 4 , 7 2 , 7 8 - 9 5 , 1 1 6 - 1 1 8 , 1 5 1 , 160 , 1 7 3 - 1 8 7 , 190ground truth 6 2 , 6 6 , 137 , 140G S D 65
hardware 2 1 , 3 5 , 6 9 , 8 0 , 8 1 , 8 5 , 9 2 , 9 4 , 112hierarchy 1 , 10 , 3 0 , 39^41 , 4 3 , 4 5 , 4 6 , 4 9 - 5 1 , 5 3 , 5 7 , 9 5 , 119 , 129human sca le 16, 97human sett lements 1 , 3 - 1 0 , 13-18 , 2 9 - 3 1 , 4 4 , 5 7 - 5 9 , 6 8 , 7 2 , 7 3 , 7 5 , 7 7 , 7 9 , 9 1 - 9 3 , 110 , 1 1 8 - 1 2 1 , 124 ,
126, 127, 1 2 9 - 1 3 2 , 1 3 5 - 1 3 7 , 139 , 140, 157, 1 6 1 , 176, 177 , 180 , 1 8 1 , 184 , 186 , 187humanware 8 0 , 81
189

idealisation 154IIRS 7 2 , 9 1 , 9 2ILWIS 2 6 , 2 9 , 7 3 , 8 6 , 9 4 , 122 , 151 , 1 5 2 , 178, 180image interpretation 7 5 , 9 5 , 140 , 184image process ing 1 9 - 2 1 , 5 5 , 6 5 , 6 6 , 6 9 , 7 3 - 7 6 , 7 8 , 7 9 , 8 5 , 8 6 , 8 8 , 9 1 , 9 4 , 117 , 140 , 1 5 2 , 160 , 178, 180 , 184 , 186informal 7 , 3 0 , 6 0 , 1 1 2 - 1 1 4 , 117 , 139IRS 5 9 , 6 4 , 7 0 - 7 3 , 7 5 , 7 6 , 1 2 1 , 137 , 1 5 8 , 1 5 9 , 1 8 5 - 1 8 7ISRO 7 0 , 7 1 , 7 4 , 180ITC 2 , 2 6 , 2 7 , 7 3 , 8 6 , 9 1 , 9 2 , 9 4 , 1 2 4 , 1 5 1 , 1 5 3 , 1 7 3 , 1 7 4 , 1 7 6 - 1 8 2 , 1 8 4 , 188 , 190ITPI 9 1 , 9 2
legislation 1 0 4 , 135local 2 , 7 - 1 0 , 2 2 , 3 0 , 3 7 , 4 0 , 5 1 , 5 4 , 6 5 , 6 7 , 9 2 , 9 4 , 9 7 , 100 , 107 , 1 1 2 , 114 , 116 , 117 , 118 , 119 , 129 , 130 ,
136, 137 , 144 , 156 , 1 6 3 , 166 , 170local level 2 2 , 107 , 163
master plan 8 , 9 7 , 9 8 , 1 0 1 , 1 1 4 , 117 , 176model 2 - 4 , 8 , 2 6 , 3 1 , 3 3 - 4 1 . 4 4 , 5 0 - 5 3 , 5 7 , 5 8 , 7 8 , 8 3 , 8 8 , 9 0 , 9 4 , 9 5 , 1 2 0 - 1 2 3 , 1 2 7 - 1 2 9 , 1 3 1 , 1 3 5 , 1 3 7 , 1 7 4 ,
178 , 1 8 1 , 183 , 2 model l ing 4 , 5 , 3 3 , 3 6 , 5 8 , 5 9 , 6 2 , 7 8 - 8 0 , 83 , 84 , 8 6 , 8 7 , 1 5 1 , 1 5 2 , 1 7 3 - 1 7 5 , 1 8 3 , 188
NCR 3 , 4 , 8 -10 , 12, 2 9 , 3 9 , 5 5 , 5 9 , 7 0 , 7 2 , 7 3 , 9 2 , 9 3 , 9 5 , 9 7 , 9 8 , 1 0 0 - 1 1 2 , 1 1 4 , 1 1 5 - 1 1 8 , 1 2 2 , 1 2 4 , 126 ,127, 129 , 130 , 136 , 1 3 8 - 1 4 2 , 144 -146 , 148 , 154 , 157 , 1 6 0 - 1 6 4 , 166- 1 6 8 , 1 7 3 , 1 7 5 - 1 8 4 , 186 , 187
N C T 101 , 103 , 107 , 110 , 1 1 1 , 1 1 8 , 1 3 0 - 1 3 2 , 1 3 5 , 1 4 1 , 1 4 4 , 1 4 8 , 167, 8 N e w Delhi 7 1 , 7 2 , 9 1 , 9 7 - 1 0 0 , 126, 160, 1 7 3 , 1 7 5 - 1 8 8 , 190N R S A 7 3 , 9 3
orgware 8 0 , 81
pattern 1-5, 11 -13 , 17 , 19 -31 , 3 3 , 3 6 - W , 4 3 , 4 5 , 5 1 , 5 4 , 5 6 - 5 9 , 6 1 , 6 3 , 6 5 , 6 7 - 6 9 , 7 4 , 7 8 , 7 9 , 8 6 , 8 7 , 9 4 , 9 5 ,104, 106, 1 1 6 - 1 2 4 , 1 2 6 - 1 2 9 , 135- 140, 1 5 3 , 1 7 4 , 177 , 179 , 185 , 187 , 189spatial 11 , 2 0 , 2 1 , 2 4 - 2 6 , 3 0 , 3 1 , 5 1 , 5 6 , 5 8 , 8 6 , 179spectral 2 0 , 2 1 , 140
pattern recognit ion 1 9 - 2 1 , 2 4 , 5 7 , 8 6 , 124 , 140 , 177 , 187P N A 122 , 168point location 135point pattern 2 5 - 2 7 , 5 8 , 7 9 , 1 2 2 , 1 2 4 , 174prototype 3 , 2 0 , 9 3 , 9 4 , 119
Regional Plan 2001 2 , 4 , 12 , 14 , 3 0 , 3 1 , 3 5 , 3 6 , 3 9 , 4 0 , 4 2 , 4 6 , 5 0 , 5 3 , 5 4 , 5 6 , 5 8 , 6 1 , 6 3 , 6 9 , 7 3 , 7 7 , 8 2 ,8 3 , 9 3 , 1 0 1 , 104 -107 , 109 , 110, 115, 116, 121 , 129 , 1 3 6 - 1 3 9 , 1 4 4 , 1 6 1 - 1 6 3 , 166, 167 ,173 , 1 7 5 - 1 8 1 , 1 8 3 - 1 8 8 , 190
relevance 1 , 3 , 5 , 3 7resolution 8 , 18, 2 4 , 3 6 , 5 5 , 6 0 , 6 4 - 6 6 , 6 9 - 7 3 , 75 , 7 7 - 7 9 , 84 , 8 6 , 8 8 , 9 3 , 137 , 158 , 159 , 187R N N 2 7 , 2 8 , 2 7rules 18, 2 2 , 2 4 , 3 1 , 5 4 , 8 1 , 8 7 , 125 , 126 , 1 3 1 , 136 , 140 , 154 , 156 , 157
satellite image 5 6 , 8 5 , 8 9 , 130scene 6 2 , 6 6 , 6 8 , 7 1 , 7 3 , 7 4 , 7 7 , 8 6 , 158 , 159 , 176search area 74settlement 1-8, 10, 13-18 , 2 1 , 2 9 - 3 1 , 3 3 , 3 6 - t 0 , 4 5 , 4 6 , 5 1 , 5 3 - 5 5 , 5 7 - 6 0 , 6 7 - 6 9 , 7 2 , 7 4 , 7 5 , 7 8 , 7 9 , 8 6 ,
9 3 - 9 5 , 109 , 1 1 6 - 1 2 3 , 1 2 7 - 1 2 9 , 1 3 4 , 1 3 5 , 1 3 6 - 1 4 0 , 1 6 1 , 170 , 1 7 3 - 1 7 5 , 1 7 7 - 1 8 0 , 1 8 2 - 1 8 4 ,1 8 6 - 1 8 8 , 190
'assemblage ' 125 , 126, 1 3 0 - 1 3 2 , 135 , 136 , 1 4 0'couple ' 125 , 126 , 130 , 1 3 1 , 1 3 3 , 135 , 136 , 140'functional coup le ' 125 , 126 , 130 , 131 , 1 3 3 , 135'insular' 126 , 1 3 1 , 134
190

sett lement pattern 1-5 , 2 1 , 2 9 - 3 1 , 33 , 3 6 - 4 0 , 54 , 57 , 58 , 59 , 6 7 , 68 , 78 , 79 , 86 , 9 4 , 9 5 , 1 1 6 - 1 1 9 , 1 2 1 - 1 2 3 , 127-129, 135 -137 , 140 , 177
shelter 181software 2 6 , 3 5 , 6 9 , 7 3 , 7 9 - 8 1 , 8 3 , 8 6 , 9 1 , 9 2 , 9 4 , 1 2 4 , 160S P A 9 1 , 9 2 , 1 0 3 , 1 0 5 , 1 0 9 - 1 1 2spatial arrangement 19spatial planning 4 , 15 , 3 3 , 3 5 , 5 9 , 6 0 , 6 7 , 7 9 , 8 1 , 8 3 , 8 4 , 9 3 , 9 5 , 1 1 6 , 1 2 1 , 173S P O T 18, 19, 5 9 , 6 3 - 6 5 , 6 7 , 6 8 , 7 1 , 7 3 , 7 7 , 8 9 , 115 , 175 , 1 7 9 , 1 8 1 , 1 8 2 , 184 , 187strategy 12 , 4 2 , 5 7 , 9 5 , 104sub-scene 7 4 , 7 7 , 158
Survey o f India 5 5 , 7 4 , 7 5 , 9 3 , 127 , 1 4 4 , 1 5 4 , 157 , 166 , 169
T C P O 4 6 , 9 1 - 9 3 , 1 0 1 , 1 0 3 - 1 0 5 , 109 , 115 , 121 , 127, 1 3 3 , 136, 144 , 146, 157 , 166 , 185territorial 13, 121 , 139tool 2 2 , 2 6 , 3 1 , 3 3 , 4 2 , 5 1 , 5 7 , 6 3 , 6 4 , 6 8 , 6 9 , 8 3 , 8 8 , 9 5 , 119 , 136, 152two d imens ions 14 , 23third d imens ion 14 , 15, 22
U N C H S 6 , 187U N C R D 8 2 , 9 4 , 173 , 187urban growth 6 , 3 8 , 6 3 , 1 0 4 , 1 2 1 , 176 , 179 , 181 , 184 , 187, 188urban planning 5 5 , 6 1 , 6 9 , 1 7 1 , 1 7 4 , 177 , 1 8 2 - 1 8 4 , 188urban sett lement 10 , 18 , 5 9 , 174urbanization 3 , 3 0 , 4 4 , 6 1 , 9 8 , 173 , 175 , 178Urbserve 2 , 9 2 , 174, 177, 180Urbwatch 2 , 9 2 , 174, 177, 180
v o l u m e 15 , 7 0 , 120 , 126
191

Mahavir
Born in New Delhi, India (1957), Mahavir obtained Bachelor'sDegree in Architecture (1979) and Master's Degree in Urbanand Regional Planning (1982). He was awarded Post GraduateDiploma, with Distinction, in Urban Survey and HumanSettlement Analysis from the International Institute forAerospace Survey and Earth Sciences (ITC), The Netherlandsin 1989. Mahavir has been on the staff of the School ofPlanning and Architecture (Deemed to be a University), NewDelhi, India, since 1982, where he is currently an Asstt.Professor in the Department of Physical Planning. Applicationof remote sensing and GISs for urban and regional planninghave been of particular interest to him. Besides teaching, he hasa vast professional experience too. In 1994, he was elected asa Fellow (FITP) of the Institute of Town Planners, India, wherehe has had many executive positions. He is also a Life Memberof the Indian Society for Remote Sensing.
Mahavir is married to Usha since 1987 and they have a sonLakshit.
This work is based on the research he pursued at theInternational Institute for Aerospace Survey and Earth Sciences(ITC), The Netherlands in cooperation with the University ofUtrecht, The Netherlands, during 1993-96. Mahavir is thankfulto his employers, School of Planning and Architecture, NewDelhi, India, for permitting him to pursue the research and tothe Netherlands Ministry of Development Cooperation (DGIS)for providing the necessary financial support.