
whitepaper plug assist - Engineering Simulations · thermoforming process must be simulated...
9
Optimizing The Plug Assist Geometry Using Simulations Jerry Dees Engineering Simulations LLC 2700 W. College Ave. Suite 9-306 Appleton, WI 54915 Phone: 920-738-8996 Email: [email protected] Web site: www.engineeringsimulations.net Abstract Finite element analysis (FEA) simulations of the thermoforming process will accurately predict the final material thickness distribution in a product, if the analysis is properly set-up. However, the real purpose of simulations is to assist in the design of the process and product. Simulations can be used to determine the best type of thermoforming process for a given product, develop the optimum geometry of a plug assist, and determine the resulting material distribution to be used in a structural analysis of a product. This white paper will explain the use of some simplifying assumptions for thermoforming simulations to allow an efficient design of optimum plug assist geometry. Thermoforming Using Vacuum or Pressure (Not Plug Assisted) With just a few exceptions, thermoformable polymers will have very similar material behavior during forming. Nearly all of the thermoformable polymers will stretch and thin in a very similar manner. As a result, different polymers will produce nearly identical material distributions, if the thermoforming process uses only vacuum and or pressure. This also assumes that the polymer is uniformly heated and stays within its forming temperature window until it contacts and is cooled by the mold surface. One of the first reports of similar material behavior during thermoforming was in a 1989 ANTEC paper (1), where three different polymers with different forming temperature windows produced nearly identical material distributions in the same mold. Throne, one of the leading experts in thermoforming, concluded in his 2000 ANTEC paper (2) that “elaborate viscoelastic modeling of polymers for FEA is probably unwarranted, since thermoforming is for the most part, a geometry-driven process, not a material property-driven process”. A thermoforming analysis process called Geometric Analysis has been used to predict thickness distributions in thermoformed parts, for many years. Mold geometry was broken into simple geometric shapes such as wedges or cones from which the material thickness distribution was calculated, without specific knowledge of the material properties. Geometric Analysis would not have been effective in predicting the material thickness distribution if every polymer behaved differently. The reason that thermoforming can be considered a geometry-driven process is because most polymers that are thermoformed follow a hyperelastic material model during forming. Hyperelastic materials are rubber-like, retaining their initial volume throughout the forming process until they are cooled below the forming temperature window. Due to the inherent hyperelastic material behavior, final material distribution in a thermoformed product, that uses only vacuum or pressure for forming, is not significantly changed by the other process conditions, if the sheet is uniformly heated within the forming temperature window. The only exception may be the amount of sheet sag when forming a large part.
-
Upload
nguyenkien -
Category
Documents
-
view
224 -
download
0
Transcript of whitepaper plug assist - Engineering Simulations · thermoforming process must be simulated...
Optimizing The Plug Assist Geometry Using Simulations
Jerry Dees Engineering Simulations LLC
2700 W. College Ave. Suite 9-306 Appleton, WI 54915
Phone: 920-738-8996 Email: [email protected] Web site: www.engineeringsimulations.net
Abstract
Finite element analysis (FEA) simulations of the thermoforming process will accurately predict the final material thickness distribution in a product, if the analysis is properly set-up. However, the real purpose of simulations is to assist in the design of the process and product. Simulations can be used to determine the best type of thermoforming process for a given product, develop the optimum geometry of a plug assist, and determine the resulting material distribution to be used in a structural analysis of a product. This white paper will explain the use of some simplifying assumptions for thermoforming simulations to allow an efficient design of optimum plug assist geometry.
Thermoforming Using Vacuum or Pressure (Not Plug Assisted)
With just a few exceptions, thermoformable polymers will have very similar material behavior during forming. Nearly all of the thermoformable polymers will stretch and thin in a very similar manner. As a result, different polymers will produce nearly identical material distributions, if the thermoforming process uses only vacuum and or pressure. This also assumes that the polymer is uniformly heated and stays within its forming temperature window until it contacts and is cooled by the mold surface. One of the first reports of similar material behavior during thermoforming was in a 1989 ANTEC paper (1), where three different polymers with different forming temperature windows produced nearly identical material distributions in the same mold. Throne, one of the leading experts in thermoforming, concluded in his 2000 ANTEC paper (2) that “elaborate viscoelastic modeling of polymers for FEA is probably unwarranted, since thermoforming is for the most part, a geometry-driven process, not a material property-driven process”. A thermoforming analysis process called Geometric Analysis has been used to predict thickness distributions in thermoformed parts, for many years. Mold geometry was broken into simple geometric shapes such as wedges or cones from which the material thickness distribution was calculated, without specific knowledge of the material properties. Geometric Analysis would not have been effective in predicting the material thickness distribution if every polymer behaved differently. The reason that thermoforming can be considered a geometry-driven process is because most polymers that are thermoformed follow a hyperelastic material model during forming. Hyperelastic materials are rubber-like, retaining their initial volume throughout the forming process until they are cooled below the forming temperature window. Due to the inherent hyperelastic material behavior, final material distribution in a thermoformed product, that uses only vacuum or pressure for forming, is not significantly changed by the other process conditions, if the sheet is uniformly heated within the forming temperature window. The only exception may be the amount of sheet sag when forming a large part.
While it is not incorrect to attempt to develop a viscoelastic material model for a polymer at forming temperature, it is usually not necessary. For the few polymers that do not follow the hyperelastic material model, a visco-elastic material model would need to be developed for simulations through testing.
FEA Simulations of Thermoforming Using Vacuum or Pressure (Not Plug Assisted)
Similar material behavior for different polymers during forming allows a wide range of hyperelastic material property models to be used as input to a FEA simulation of the thermoforming process. A range of hyperelastic material models will produce results with about the same final material distribution. Thus, there is no need to develop the exact stress-strain curves at the forming temperature for every polymer prior to running a simulation. However, if one needs to know the vacuum or pressure levels required to form a part, which is almost never the case, the exact stress-strain curve at the forming temperature would be required as input.
The degree of difficulty in simulation of the thermoforming process without a plug assist is much lower than when including the plug assist. As a result, simulation of vacuum or pressure forming without a plug assist can be conducted using a number of commercial non-linear FEA programs. The field of reliable and efficient FEA programs decreases significantly when a plug assist is added to the process. FEA programs that handle contact issues well will be the most efficient at solving thermoforming problems with complex shapes and plug assists. The non-linear FEA program, Abaqus Explicit, was used in the plug assist design example described in this white paper.
Thermoforming With a Plug Assist
A plug assist is used to pre-stretch the sheet prior to turning on vacuum or pressure during forming. Adding a plug assist to the thermoforming process is where the difficulty in both understanding the process and conducting a FEA simulation of the process seems to begin. When a process is not well understood it is referred to as an art and this is often the case with plug assist thermoforming. The thermoforming process must be understood before it can be simulated with FEA. Also, the thermoforming process must be simulated properly, before it can be optimized. Unlike thermoforming with vacuum or pressure only, using a plug assist causes many of the other thermoforming process variables to play a large role in the final part material distribution. Most thermoformable polymers, as they are stretched by the plug, still follow a hyperelastic material model. Since the process variables had little effect on the final part material distribution when thermoforming without a plug assist, then the primary effect of the process variables must be on the surface interaction between the sheet and plug. The thermoforming process variables that affect the product material distribution when using a plug assist can be separated into three groups as follows:
1. Variables that affect the time of separation of the sheet from the plug Factors that affect when the sheet separates from the plug, such as when the vacuum and or pressure are applied, are timing variables. Control of the venting of the mold can also affect when
the sheet separates from the plug. Slowing the venting of the mold cavity during the plug assist stage, creating backpressure on the sheet, is a very effective forming option, but will not be considered in this discussion. In this discussion it is assumed that the mold cavity is fully and properly vented. Timing of the vacuum and pressure resulting in separation of the sheet from the plug prior to the plug reaching its full design penetration depth simply changes the effective plug penetration depth. 2. Variables that affect the contact interface between the sheet and plug The temperature of the sheet and plug as well as the type of sheet and plug materials all affect the plug/sheet interface properties. The effect of the non-timing process variables can be summarized in one factor, the coefficient-of-friction (COF) between the plug and sheet.
One of the most important factors, and perhaps one of the most over-looked, affecting plug/sheet COF is the temperature of the plug. In many thermoforming processes the plug temperature is not controlled. Previous research work has shown the significant effect of plug temperature on plug/sheet COF (3). Plug temperature variation may be the most significant causes of variability in the final material distribution of a plug assisted thermoformed part. 3. Plug Geometry The plug geometry will significantly impact the final material distribution in the part. Plug geometry variables including penetration depth, distance between plug and mold, and radius between the sidewall and bottom of the plug will change the material distribution in the part. The radius between sidewall and bottom of the plug is actually a combination of the penetration depth and distance between plug and mold variables. The plug geometry can be optimized to produce as uniform a material distribution as possible or to move material to the best location in the part for performance considerations.
Simulations of Thermoforming
With a Plug Assist Accurate FEA simulations of thermoforming with a plug assist require knowledge of the plug/sheet COF. Some have attempted to simulate all of the process conditions, including heat transfer, and thus predict the plug/sheet COF. While it is not incorrect to attempt to simulate everything in the process, it is much simpler and probably more accurate to run a thermoforming trial with a known plug assist geometry (using the same plug material that will be used in the process), to determine the plug/sheet COF value. Trial samples of the thermoformed product should be obtained after the process has stabilized (both plug and sheet temperatures must be stable). The material distribution in the product can then be compared with results from a series of FEA simulations, which have used a range of plug/sheet COF values, to determine the correct COF value. A quandary that one encounters in simulating thermoforming is how to properly handle the viscoelastic properties of the polymer between the plug assist and vacuum/pressure stages of forming. An effective and time saving assumption is to use hyperelastic properties while the material is being stretched, but assume that the stresses in the polymer are completely relaxed at the end of the plug assist stage. Hyperelastic material properties are again used in the vacuum/pressure stage. This assumption allows the transition in the simulation from the plug assist stage to the vacuum or pressure stage without developing a viscoelastic model for each material.
Plug Assist Geometry Optimization Using Simulations
The plug geometry optimization process starts with simulations of existing plug assist geometry at three different plug/sheet COF values. The simulation results will be compared with experimental data to determine the COF to use for the optimization phase.
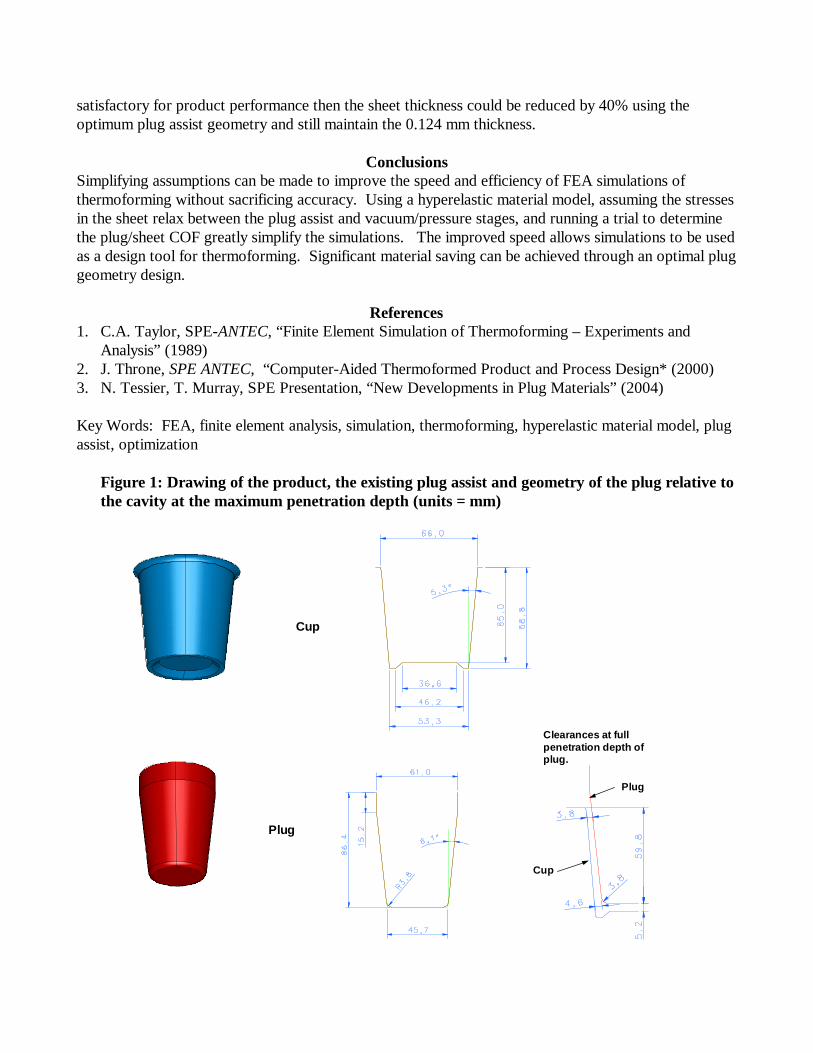
Figure 1 shows a drawing of the product, the existing plug assist and the geometry of the plug relative to the cavity at the maximum penetration depth. Figure 2 shows the quarter-symmetry FEA model at various stages of the simulation process. An interesting and important observation should be made at the end of the plug assist stage. The thinnest part of the sheet is the area just above contact with the plug. Since this area is thinnest, hyperelastic material behavior will dictate that the area will have the least resistance to further stretching when the vacuum or pressure loading is applied. This means the thin area should be designed to be as close as possible to the mold surface at the end of the plug assist stage. If the thin area is too far from the mold surface, it will dominate the remainder of the forming process, producing a very thin area in the sidewall and a thick bottom. Figure 3 shows the results of the thermoforming simulations using various plug/sheet COF values compared with the experimental data. The horizontal axis is the distance along the profile of the product starting at the top rim and continuing to the center of the cup bottom. While not an exact match, the best correlation between the experimental data and simulations was with a COF of 1.5. The plug assist optimization proceeds with a plug/sheet COF of 1.5. For this product, there are three primary geometry variables as shown in Figure 4: depth of plug penetration, minimum distance between plug and mold at maximum plug penetration, and the radius of the plug at the bottom corner. The plug geometry optimization process will be conducted by changing one geometry variable while holding the other variables constant. Usually, the optimum plug geometry can be determined with twelve to fifteen simulations. The first geometry variable to assess is the distance between the plug and mold at maximum plug penetration. Figure 5 shows the results of three different plug-to-mold distances with the other variables held constant. The black areas on the contour plots show the area of the product that is below a thickness of 0.2 mm. It can be seen that the minimum distance (3 mm) from plug to mold produces the best material property distribution, which is almost always the case. This is due to the previous observation about the minimum sheet thickness at the end of the plug assist stage and the need to get that thin area of the sheet to the mold as quickly as possible. Figure 6 shows the results of simulations with various depths of plug penetration and plug end radius. The plug to mold distance was held at 3 mm. The best material distribution would be the one with the least amount of black area, or thickness less than 0.2 mm. It can be observed that the optimum plug geometry would have a penetration depth of 55 mm, a plug end radius of 18 mm with a minimum plug to mold distance of 3 mm. Figure 7 compares contour plots from the existing plug assist geometry and the optimum geometry. The minimum thickness increased from 0.124 mm to 0.216 mm. If the 0.124 mm thickness was
satisfactory for product performance then the sheet thickness could be reduced by 40% using the optimum plug assist geometry and still maintain the 0.124 mm thickness.
Conclusions Simplifying assumptions can be made to improve the speed and efficiency of FEA simulations of thermoforming without sacrificing accuracy. Using a hyperelastic material model, assuming the stresses in the sheet relax between the plug assist and vacuum/pressure stages, and running a trial to determine the plug/sheet COF greatly simplify the simulations. The improved speed allows simulations to be used as a design tool for thermoforming. Significant material saving can be achieved through an optimal plug geometry design.
References 1. C.A. Taylor, SPE-ANTEC, “Finite Element Simulation of Thermoforming – Experiments and
Analysis” (1989) 2. J. Throne, SPE ANTEC, “Computer-Aided Thermoformed Product and Process Design* (2000) 3. N. Tessier, T. Murray, SPE Presentation, “New Developments in Plug Materials” (2004) Key Words: FEA, finite element analysis, simulation, thermoforming, hyperelastic material model, plug assist, optimization Figure 1: Drawing of the product, the existing plug assist and geometry of the plug relative to
the cavity at the maximum penetration depth (units = mm)
Cup
Plug
Clearances at full penetration depth of plug.
Cup
Plug
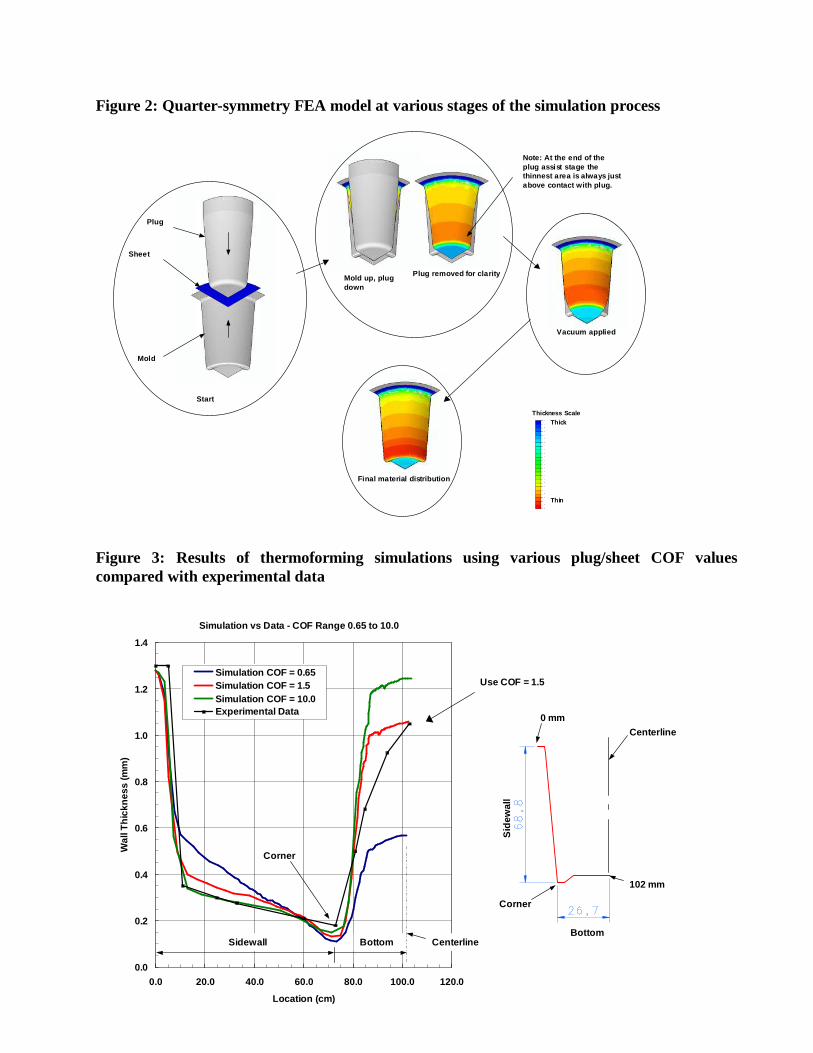
Figure 2: Quarter-symmetry FEA model at various stages of the simulation process
Figure 3: Results of thermoforming simulations using various plug/sheet COF values compared with experimental data
Simulation vs Data - COF Range 0.65 to 10.0
0.0
0.2
0.4
0.6
0.8
1.0
1.2
1.4
0.0 20.0 40.0 60.0 80.0 100.0 120.0
Location (cm)
Wal
l Th
ickn
ess
(mm
)
Simulation COF = 0.65Simulation COF = 1.5Simulation COF = 10.0Experimental Data
Sid
ewal
l
Bottom
Corner
0 mm
Centerline
Sidewall Bottom
Corner
Centerline
Use COF = 1.5
102 mm
Plug
Sheet
Mold
Plug removed for clarityMold up, plug down
Vacuum applied
Final material distribution
Thickness Scale
Start
Thick
Thin
Note: At the end of the plug assist stage the thinnest area is always just above contact with plug.
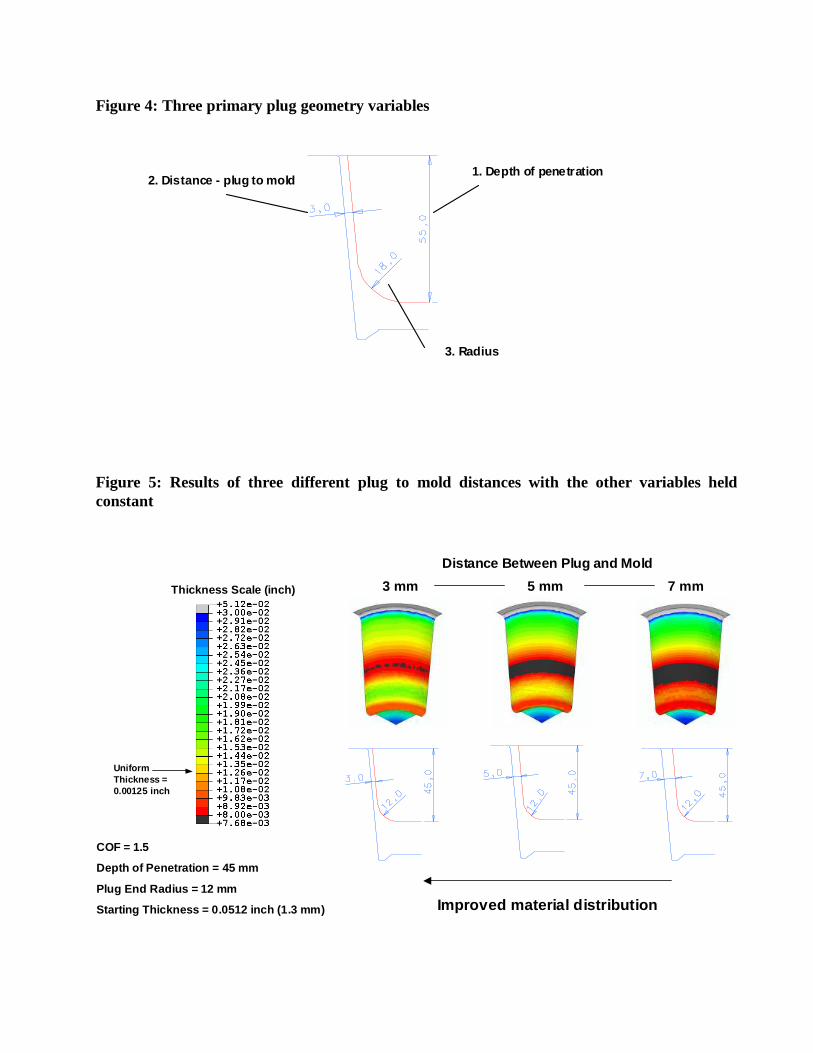
Figure 4: Three primary plug geometry variables
Figure 5: Results of three different plug to mold distances with the other variables held constant
2. Distance - plug to mold1. Depth of penetration
3. Radius
Distance Between Plug and Mold
3 mm 5 mm 7 mm
Uniform Thickness = 0.00125 inch
Thickness Scale (inch)
COF = 1.5
Depth of Penetration = 45 mm
Plug End Radius = 12 mm
Starting Thickness = 0.0512 inch (1.3 mm) Improved material distribution
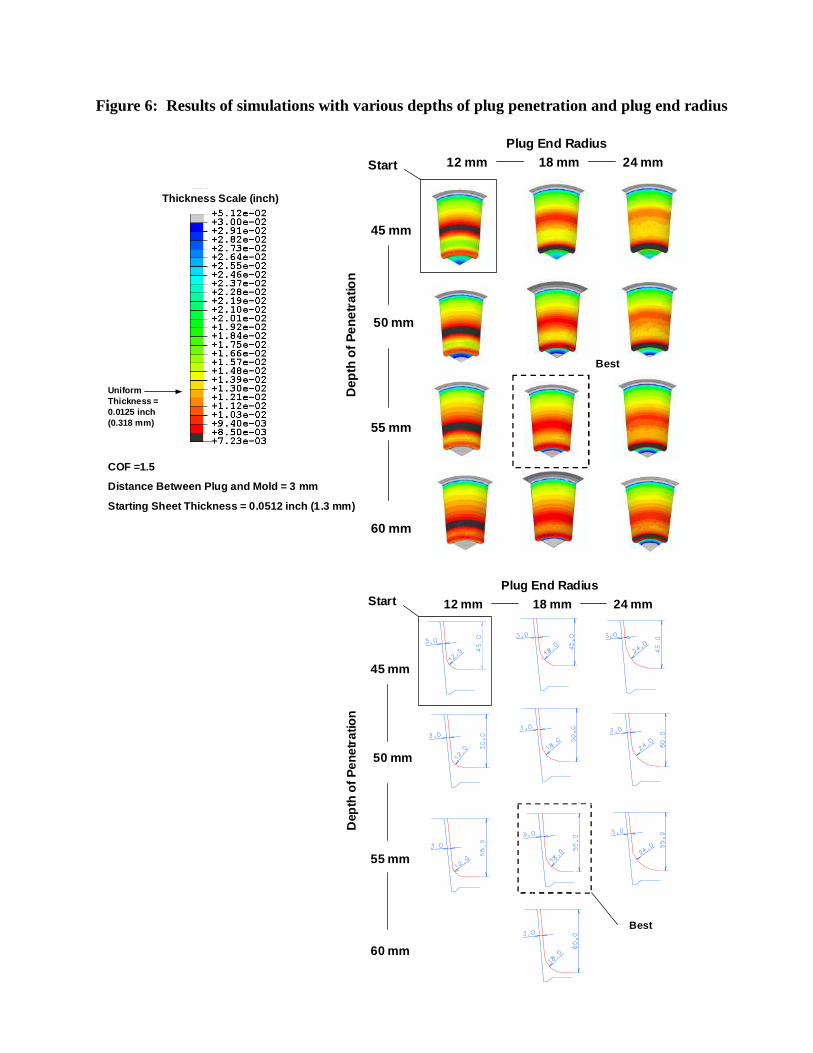
Figure 6: Results of simulations with various depths of plug penetration and plug end radius
45 mm
50 mm
Dep
th o
f P
enet
ratio
n
55 mm
Plug End Radius18 mm 24 mm12 mm
60 mm
Thickness Scale (inch)
Uniform Thickness = 0.0125 inch (0.318 mm)
Best
Start
COF =1.5
Distance Between Plug and Mold = 3 mm
Starting Sheet Thickness = 0.0512 inch (1.3 mm)
45 mm
50 mm
Dep
th o
f Pen
etra
tion
55 mm
Plug End Radius
18 mm 24 mm12 mm
60 mm
Best
Start
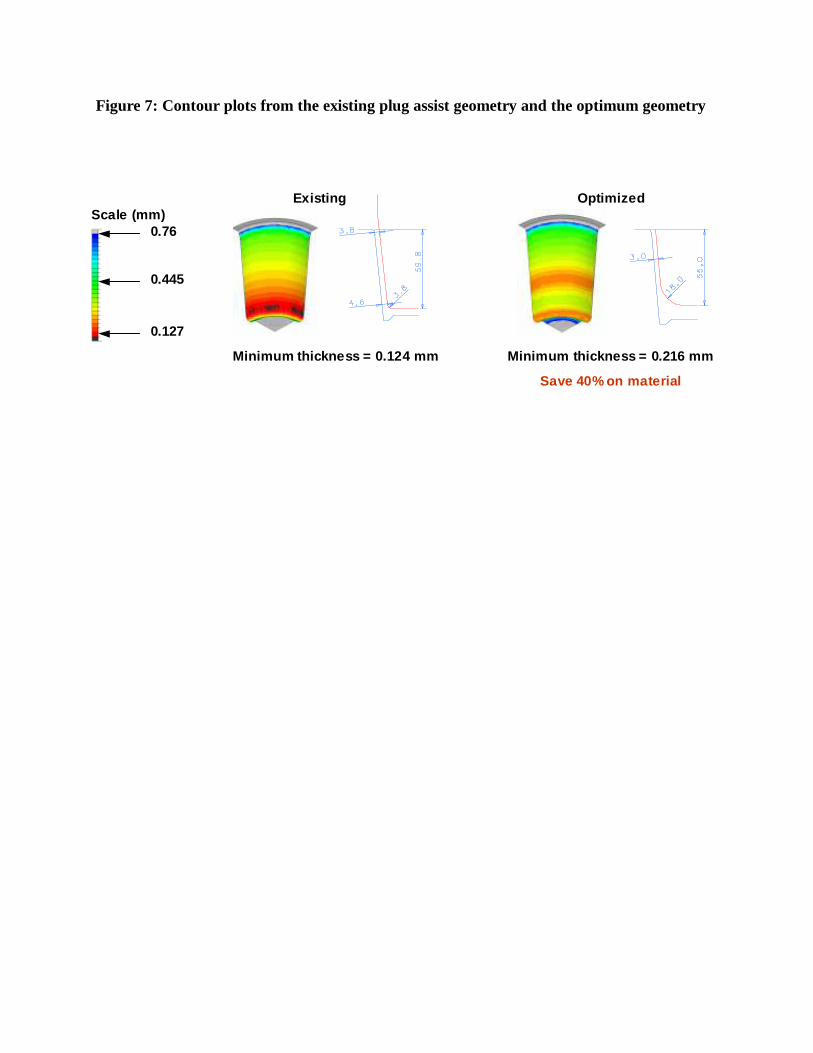
Figure 7: Contour plots from the existing plug assist geometry and the optimum geometry
Minimum thickness = 0.124 mm Minimum thickness = 0.216 mm
Save 40% on material
Scale (mm)0.76
0.127
0.445
Existing Optimized