Surveys Google Docs Amanda Santana UNESP- Guaratinguetá, 2011.

How Google Surveys WorksWhite paper
Surveys
Title of the White Paper Ibea quodia cum utaturem
WHITE PAPER
How Google Surveys Works
June 2018
How Google Surveys WorksWhite paper
Surveys
OverviewGoogle Surveys is a market research platform that surveys internet and smartphone users Since its launch in 2012 Surveys has evolved in several ways the maximum questions per survey has increased from 2 to 10 the online panel has expanded to tens of millions of unique daily users and a new mobile app panel has 5M active users and additional segmentation capabilities1 This paper will explain how Surveys works as of June 2018 while also discussing its advantages and limitations for mitigating different kinds of biases2 A future paper will evaluate the accuracy of results against benchmarks
1 Google Surveys originally launched with the name lsquoGoogle Consumer Surveysrsquo2 For an earlier whitepaper on Google Surveys see wwwgooglecominsightsconsumersurveysstaticconsumer_surveys_whitepaperpdf3 httpswwwcdcgovnchsdatanhisearlyreleasewireless201806pdf4 wwwpewresearchorgmethodologyu-s-survey-researchcollecting-survey-datacellphone-surveys5 wwwpewresearchorg20170515what-low-response-rates-mean-for-telephone-surveys6 wwwpeople-pressorg20120515assessing-the-representativeness-of-public-opinion-surveys7 httpwwwpewresearchorgfact-tank20180305some-americans-dont-use-the-internet-who-are-they
Online surveys have increasingly gained acceptance for market research and polling as phone-based surveys have faced multiple challenges In the United States for instance Random Digit Dialing (RDD) of phone landlines was the gold standard for many years Randomly dialing a number yielded a probability-based sample where each household had a roughly equal chance of being sampled However from 2003 to 2017 the percentage of households with landlines declined sharply from 97 to 473
One approach to increasing the coverage of phone surveys has been to add mobile phones into the sample but that has raised additional problems First the Pew Research Center has determined that itrsquos more expensive to call mobile phones because US federal regulations impose greater restrictions against automated dialing of mobile phones4 Second mobile phone users may be less likely to answer calls from unfamiliar numbers Response rates for phone surveys dropped from 36 in 1997 to 9 in 20165 partly due to the inclusion of mobile phones6
These challenges have led to the gradual use of online surveys instead of or in addition to phone surveys Online surveys are faster cheaper and can reach larger samples more easily than other survey modes Unfortunately itrsquos also harder to ldquorandomly dialrdquo an internet user which is why online surveys are often non-probability-based samples
Online surveys face an additional challenge they can only reach people who are online This has become a less severe problem in the US as more people have come online increasing from 52 in 2000 to 89 in 2018 Still the online US population differs from the general US population by skewing younger having higher household incomes attaining higher educational levels and living in more urban or suburban areas than the 11 who are offline7
Two questions prompted the launch of Google Surveys six years ago (1) Could access to online content incentivize people to answer short surveys and (2) Would the resulting data be accurate and cost effective We believe that the answers to both questions are ldquoyesrdquo
The rise of online surveys
Katrina Sostek and Brett Slatkin Authors gcosurveys gcosurveyswhitepaper
How Google Surveys WorksWhite paper
Surveys
8 See case study video from Gannett at youtubeOsvGyc8wrFA
Who answers Google Surveys and whereGoogle Surveys offers two panels of respondents (1) internet users reading content on a network of web publisher sites using Google Opinion Rewards for Publishers and (2) smartphone users who have downloaded and signed up to use an Android app called Google Opinion Rewards Wersquoll address these two panels in more detail below
Globally Surveys reaches tens of millions of possible respondents per day including 5M from the mobile app In the US there are also tens of millions of possible respondents per day including 2M from the mobile app
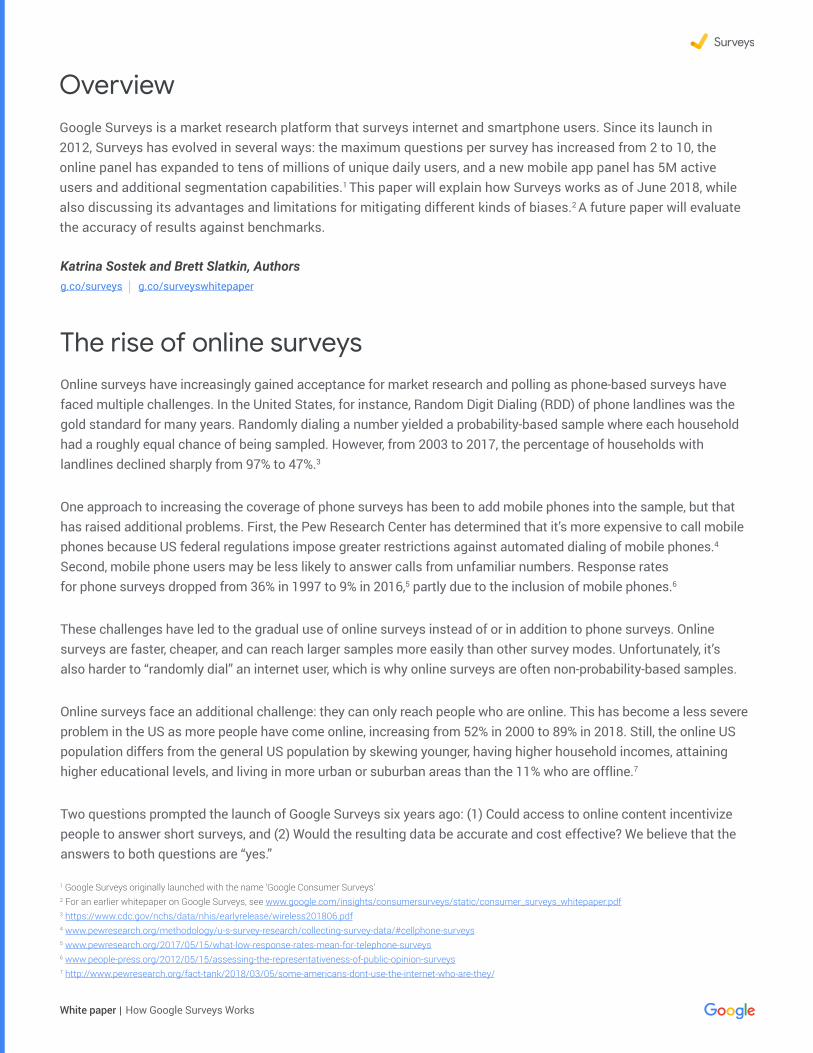
Surveys run on the publisher network are distributed across a wide-ranging network of 1500+ sites that focus on a diverse set of topics
Completed responses across all surveys come from a mix of sites that are 74 News 5 Reference 4 Arts and Entertainment and 17 Other Examples of publisher sites include Gannett8 regional newspapers USA Today and The Financial Times (all News) Womanrsquos World (Arts and Entertainment) babynamescom (Reference) and drivers-testorg (Other)
Researchers pay to run surveys and Surveys pays publishers for each survey answered on their site Surveys pays publishers tens of millions of dollars each year
Surveys partially and temporarily block the content on each publisherrsquos site Surveys are shown on both desktop and mobile sites and the surveyrsquos display is optimized for mobile devices
The publisher network
Researcher Researcher
Site AParticipant 1
Participant
Participant 3
Site
Site C
Google SurveysEditor
The survey is served on partnering publisher web sites
A researcher writes and alignsa survey to meet research needs
Respondents answer these surveys to access content on the website
Results are collected aggregatedand presented back to the researcher
Google SurveysReporting
The lifecycle of a Google Survey
How Google Surveys WorksWhite paper
Surveys
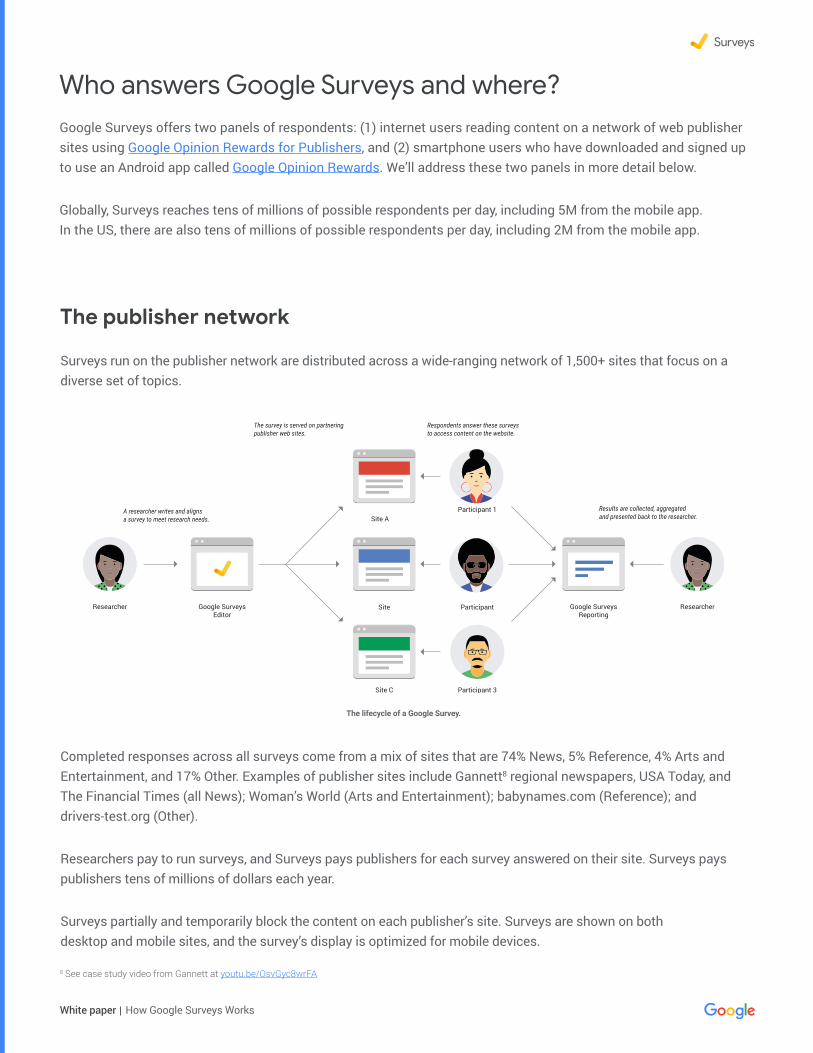
Survey prompts on desktop and mobile publisher sites
On the publisher network a ldquoriver samplingrdquo or ldquoweb interceptrdquo approach is used to select survey respondents as opposed to using a predefined panel9 By intercepting site visitors Google Surveys avoids one potential bias of opt-in survey panels which can be composed of people who simply love taking surveys aka Professional Survey Takers10
Surveys respondents on publisher sites are motivated to answer surveys to gain access to the sitesrsquo content such as articles reference or educational materials This kind of survey is often called a ldquosurveywallrdquo because like a paywall the survey blocks a sitersquos content until the survey is answered A surveywall uses that sitersquos content as an incentive to solicit a response
Publishers choose where when and how frequently surveys appear Readers have alternatives to answering the survey either skip the survey entirely or take another action such as paying for a subscription
To encourage high response rates we make it easy for respondents to answer surveys When Google Surveys first launched surveys were limited to two questions We have since determined that users are often willing to answer longer surveys and the maximum number of questions is now 10 However we limit the number of open-ended text questions to two per survey those are typically the most time-intensive to answer and may decrease response rates
9 wwwpewresearchorg20160502variation-in-online-nonprobability-survey-designpanel-recruitment-and-survey-sampling10 onlinelibrarywileycomdoi1010029781118763520ch10summary
How Google Surveys WorksWhite paper
Surveys
The mobile app Google Opinion Rewards is a predefined opt-in panel for Android users Mobile panel members install the app then earn 10cent-$1 in Google Play Store credit for each survey they answer Credits can be used to purchase things like books music movies and games This incentive can introduce bias because at this time users of the mobile app must have an Android phone and generally be motivated by Google Play Store credit We are actively working to diversify the rewards options on the mobile app to attract more types of users and reduce bias
After downloading the mobile app from the Play Store users sign up by entering their age gender and other demographic details After completing the signup process users will then get a notification whenever a survey is available to be answered Users canrsquot request surveys we ask them to answer surveys whenever we need their responses to improve the representativeness of survey results Most users get 1-2 surveys per week with each survey offering a reward of between 10cent and $1 in Play credit in the US
The Google Opinion Rewards app is also available in the iOS App Store and allows users to earn PayPal credits This app is currently not available for user sampling
So far in 2018 Surveys has completed an average of 5M surveys per month Those surveys averaged 1-2M complete responses per day and 4M responses to individual questions per day
For surveys run on the online publisher network the response rate was 25 11 For the opt-in mobile app panel the completion rate was 7512
11 Response rate is defined as the percentage of surveys viewed by potential respondents that receive an answer to at least the first question 12 Completion rate on the mobile app is defined as the percentage of surveys downloaded to a panelistrsquos phone that are also completed
The mobile app
How big is Google Surveys
The mobile app Google Opinion Rewards
How Google Surveys WorksWhite paper
Surveys
Google Surveys are created with three steps Define the audience design the questions and confirm pricing After a survey begins collecting responses the results will be available to view
Researchers create Surveys with an online editor First the researcher names the survey and defines the audience
Researchers begin by choosing a panel the general population on the publisher network or the mobile app In both panels surveys can be sent to specific demographic groups based on gender age and geography (country region13 or state)
Surveys can be run in ten countries on the publisher network and the mobile app Australia Brazil Canada Germany Italy14 Japan Mexico the Netherlands14 the United Kingdom and the United States The publisher network is additionally supported in over 40 countries14 Surveys on the mobile app can also be fielded to users who speak specific languages
How to run a Google Survey
Define the audience
The audience selection step in the editor
13 For the four US regions see enwikipediaorgwikiList_of_regions_of_the_United_StatesOfficial_regions_of_the_United_States 14 Only available with Convenience Sampling (described in section lsquoSampling biasrsquo)
How Google Surveys WorksWhite paper
Surveys
Surveys can have up to 10 questions Up to four of the questions can be screening questions if respondents
screen out at any point their survey ends there and they
see no more questions
Several question types are available single select
(radio button) multiple select (checkboxes) rating questions (Likert scale) image questions and open-ended text questions
Design the questions
Each respondent will see the questions in the order the researcher specifies Answers for each question can be shown in a fixed order randomized or randomly reversed which is useful for answers that have a logical order as in the example above Question text can be formatted with bold and _italics_ Questions are limited to 175 characters and answers to 44 characters in English-speaking countries these character limits differ by country
Google Surveys does not support branching where the answer to one question determines which question the respondent sees next However we support answer piping where the answer to one question can be quoted in a later questionrsquos text or answers To pipe an answer to Question 1 into the text of a follow-up question or answer use ldquoQ1_ANSWERrdquo without the quotations
To include a screening question as in the example above click ldquoScreen with this questionrdquo Then select the answers to ldquoscreen inrdquo respondents to continue on to the next question
The question design step in the editor
How Google Surveys WorksWhite paper
Surveys
Confirm price
The confirm pricing step for a survey with no screening questions
If a survey has screening questions it may cost significantly more than $3 per complete response depending on how difficult it is to reach the surveyrsquos audience The price will not be shown automatically but instead will
be determined by a trial run of the survey
The pricing process is different for surveys with screening questions versus those without If a survey has no screening questions the price will vary from 10cent to $3 per complete response depending on the number of questions and user criteria of the survey The editor will automatically display the pricing for the survey The researcher will then confirm the surveyrsquos details choose a desired number of responses (from 50 to 50000) and set the frequency
How Google Surveys WorksWhite paper
Surveys
The trial run will estimate the surveyrsquos incidence rate that is the number of respondents who choose a screen-in answer to the last screening question in the survey The lower the incidence rate the more the survey will cost For example if the incidence rate is 10 and the researcher buys 1000 complete responses wersquoll need to collect at least 10000 responses to the screening question to reach 1000 complete responses
The trial run will run for up to 24 hours at which point the researcher will get an email quoting the price for the survey A survey must have a 5 incidence rate to run if the incidence is less than 5 the researcher will be asked to redesign the survey Once this phase is complete the researcher can then purchase the survey
After a researcher creates and purchases a survey a Google Surveys team member will inspect the survey to make sure it complies with our policies then email the researcher if edits are needed A common review note is to ask researchers to change ldquoYesrdquo or ldquoNordquo binary questions to add an additional option like ldquoNo Answerrdquo or ldquoPrefer not to sayrdquo This kind of opt-out option increases the chance that users who may not fall into ldquoYesrdquo or ldquoNordquo will respond accurately Once a survey passes review and begins running it can no longer be changed
Surveys are fielded for a minimum of two days to avoid bias from the time of day or a single day Surveys with screening questions or stricter user criteria may take longer due to the rarity of the subpopulation being measured
The trial run step for a survey with screening questions
How Google Surveys WorksWhite paper
Surveys
View results
After a survey has collected an initial portion of its responses the researcher will get an email inviting them to view the results in an online report These early results will have low sample sizes and large error bars as more results are collected the sample size will increase and the error bar sizes will decrease The results will continue to update until the survey is complete
The survey results overview page
Survey report pages offer more than just top-level results They include comparisons (crosstabs) filters by demographic groups controls like raw (unweighted) instead of weighted results and options to share
or download the respondent-level data to a spreadsheet
How Google Surveys WorksWhite paper
Surveys
The question results page showing crosstabs and demographic filters
A major challenge for online non-probability surveys is mitigating sampling bias that is ensuring that samples represent the general population of internet users Within our panels we offer representative sampling for some countries and convenience sampling for others (described below)
For representative sampling we evaluate the representativeness of a survey by balancing its sample demographics to match the demographics of the specified population adult (18 or older) internet users We match based on three demographic dimensions age gender and geography In the US we use estimates for the national internet population from the US Census Bureaursquos 2015 Current Population Survey (CPS) Computer and Internet Use Supplement15 In other countries with representative sampling we rely on a combination of government data and internal Google data sources
Convenience sampling means that respondents may be of any age gender or from any geographic region within a country
Sampling bias
15 wwwcensusgovprograms-surveyscpstechnical-documentationcomplete2015html
How Google Surveys WorksWhite paper
Surveys
Collecting representative samples
For countries with representative sampling Google Surveys uses a two-step process to ensure each surveyrsquos representativeness First we use stratified sampling to dynamically engage respondents with the goal of matching the demographics of the target internet population Next we apply post-stratification weighting to more closely match those same demographics of the target internet population
While a survey is collecting responses Surveys does its best to match the respondentsrsquo demographics to the internet populationrsquos demographics with the following steps
Once the survey has collected all responses the ideal actual distribution would match the target populationrsquos demographic distribution In practice however actual distributions usually differ slightly from a target populationrsquos demographic distribution This discrepancy is due to the nature of the dynamic targeting described above the availability of respondents on publisher sites at any given time and the tradeoff between finishing a survey in a reasonable amount of time and perfectly matching the distribution
A table at the bottom of each survey report shows the sampling bias how the surveyrsquos sample differs from the target internet population for gender age and geography
Calculate the target percentage of the joint distributions that is the percentage of each three-dimensional demographic group such as 18ndash24-year-old males in Idaho
Select respondents randomly within each demographic group (age x gender x state) to answer the survey We donrsquot balance responses using any additional paradata such as time of day operating system or answers to other survey questions
As responses are collected update the actual current percentage of respondents of each group in real time
If the actual and target percentages differ at any time dynamically adjust the criteria of the survey to compensate for under- or over-sampling For example if a survey has enough responses from 18ndash24-year-old males in Idaho but needs more representation from 35ndash44-year-old females in Nebraska we will show fewer surveys to 18ndash24-year-old males in Idaho and more surveys to 35ndash44-year-old females in Nebraska
1
3
2
4
How Google Surveys WorksWhite paper
Surveys
The bias table from the question results page
The Root Mean Squared Error (RMSE) score describes the square root of the mean of the squared errors across all values (eg male and female) within each dimension (gender age and geography) The larger the RMSE score the less representative the sample is of the specified population
One note about geographic representativeness Google Surveys guarantees a representative distribution of regions or states within a country whenever possible However Surveys does not guarantee geographic representativeness within a region or state mdash such as a representative balance between cities and rural areas mdash as part of its dynamic fielding and weighting schemes The publisher network does however have extensive coverage within states through its 1500+ publisher sites in which local newspapers are strongly represented
We also balance responses across different publishers by preventing any one publisher from dominating a surveyrsquos results This reduces bias from specific publishers that may focus on local topics national issues or particular subject matters This approach also limits the possibility of repeatedly sampling the same respondents for multiple surveys across our system Our system also ensures that the same respondent doesnrsquot have the opportunity to answer the same survey more than once These frequency capping measures help diversify our panel and mitigate bias towards frequent internet users
How Google Surveys WorksWhite paper
Surveys
To correct for sampling bias after the survey is run we apply weights to upweight underrepresented groups and downweight overrepresented groups This calculation is coarser than the calculation for dynamic fielding instead of matching the three-dimensional joint distributions we match each single dimension mdash the marginal distributions mdash on their own We then calculate weights using an iterative process also known as raking to reduce bias across all three dimensions16
Herersquos how raking works First we exclude all respondents with unknown demographics for age gender or geography Then we calculate weights that will match the gender breakdown to the target demographic If the target distribution is 52 female and 48 male but the actual distribution is 50 female and 50 male then we apply a weight of 52 50 = 104 to all female responses and 48 50 = 096 to all male responses
After weighting respondents by the gender dimension on its own we do the same for the age dimension on its own and then the region dimension on its own Every time we get one dimension to perfectly match the target demographic the previous dimensions will no longer exactly match We use an iterative raking technique to do 10 rounds of calculations for all three dimensions on their own17 After 10 rounds the weights will approach convergence and all three dimensions will closely match their targets
The weights in each survey are calculated based on the first question We use the first question for weighting because thatrsquos the only question we can assume should match the target populationrsquos demographic distribution
For example if the first question is a screening question that asks ldquoWhat is your genderrdquo and only respondents who answer ldquomalerdquo screen through to the second question we wouldnrsquot want to match the second question to 52 female and 48 male it will always be 100 male
Even if the first question isnrsquot a screening question respondents may drop off throughout the survey in a way that is skewed towards one demographic group due to the design of the survey Thus we weight responses to follow-up questions by taking the first-question weights filtering them to only those who answered the follow-up question and renormalizing so that the sum of the weights equals the total number of responses to the follow-up question
Weighting
16 Google Surveys moved to a raking methodology in October 2016 The previous methodology is explained in the original whitepaper wwwgooglecominsightsconsumersurveysstaticconsumer_surveys_whitepaperpdf17 enwikipediaorgwikiIterative_proportional_fitting
How Google Surveys WorksWhite paper
Surveys
In the survey results the values displayed in the error bars represent the modeled margin of error This means that if we repeat this survey many times in the same way 95 of the time the resulting range of values would contain the true value
We follow the Pew Research Center in using the term ldquomodeled margin of errorrdquo to differentiate from the statistical term ldquomargin of errorrdquo which only applies to true probability-based samples18 Because Google Surveys collects online non-probability samples the margin of error calculation is based on assumptions about the Surveys sampling model and what would happen if we repeated the same sampling process many times
We use the Modified (or ad hoc) Wilson method to calculate the error bars which can be asymmetrical eg +18-16 The Wilson method works well for small sample sizes as well as extreme probabilities (close to 0 or 100)19 We follow the Modified Wilson calculation using effective sample size as shown in Applied Survey Data Analysis20 The calculation is the same as the Wilson method but uses n = p(1 - p) var(p) in place of n21
Error bars
A question report page showing error bars and the modeled margin of error
In this example the modeled margin of error for Basketball is +18-16 The range of values is 124 to 158 ie 14 adjusted by the modeled
margin of error
Four factors influence and can reduce the size of the modeled
margin of error
1 Larger sample sizes
2 Percentages closer to the extremes of 0 or 100
3 Lower confidence levels (we use a 95 confidence level)
4 Lower variability of weights
18 wwwpewresearchorg20180126variability-of-survey-estimates19 Dean Natalie and Pagano Marcello 2015 ldquoEvaluating Confidence Interval Methods for Binomial Proportions in Clustered Surveysrdquo Journal of Survey Statistics and Methodology 3 (4) 484-503 doiorg101093jssamsmv02420 Heeringa Steven G West Brady T and Berglund Patricia A 2017 Applied Survey Data Analysis Second Edition 16521 enwikipediaorgwikiBinomial_proportion_confidence_intervalWilson_score_interval
Surveys may be subject to other sources of biases and errors including mdash but not limited to mdash sampling and nonresponse as discussed in more detail below
How Google Surveys WorksWhite paper
Surveys
The way we determine respondent demographics differs by survey panel
The mobile app is the simpler of the two panels We ask users to self-report their age gender and zipcode when they sign up to use the app We periodically ask these questions again to refresh the panelistsrsquo demographics in case they have changed
The publisher network uses inferred demographics which means that we donrsquot explicitly ask the panelists for their demographics We do this to minimize the number of questions in a survey which offers a better respondent experience and encourages higher response rates Any researcher who doesnrsquot want to rely on inferred demographics can explicitly add demographic questions to their surveys However our dynamic fielding and weighting process to match ground-truth data will still be based on inferred demographics
Like many ads on the web Google Surveys infers the age and gender of anonymous respondents based on browsing behavior and geography based on IP addresses Users can opt out of inferred demographics in the Ads Settings which applies across Google ads services the 2M+ sites and apps that partner with Google to show ads and Google Surveys In the case of Surveys opting out means that usersrsquo demographics will show as unknown and their responses will be excluded from weighted results For all users unless otherwise stated responses are anonymous and collected in aggregate
How we know age gender and region
In addition to sampling bias Google Surveys monitors and mitigates other kinds of bias
Response non-response and modal bias
Response bias is the bias from inattentive or untruthful answers to questions
The publisher network and mobile app have different kinds of inattentive or untruthful responses Respondents on the publisher network are intercepted while trying to view content online so they do not necessarily want to answer a survey and may just want to see that content The mobile app has the opposite problem where users want to answer as many surveys as possible because they voluntarily opted into the mobile panel out of a desire to answer surveys and earn rewards
Another source of low-quality responses from both the publisher network and the mobile app is open-ended text questions Respondents may respond with gibberish profanity or something like ldquoI hate surveysrdquo These types of answers are removed from the surveyrsquos results using common natural language processing libraries employed across Google
Response bias
How Google Surveys WorksWhite paper
Surveys
Google Surveys tracks investigates and removes multiple kinds of low-quality responses and respondents If low-quality responses are dropped from a survey the survey will remain in the field to collect more responses to make up for the sample that is now missing If chronically inattentive or untruthful respondents are detected they may be prevented from getting any more surveys in the future
Potential responses to a survey can fall into several categories non-response screen-out response partial response or complete response These categories are illustrated below
Non-response bias occurs when a group of people in the sample choose not to respond to the survey in a systematic way which can cause the omission of that grouprsquos opinions Non-responses can come from people who donrsquot like answering surveys in general or are alienated by the first question in some way Unfortunately it can be difficult to ask non-respondents why they chose not to respond because they are unlikely to respond
Respondents may also choose to stop answering questions midway through a survey These partial responses can introduce dropoff bias perhaps an overly-specific question turns off respondents or respondents could drop off towards the end of a long survey For example if a survey is about an extremely specific topic like equestrian equipment then people who are uninterested or uninformed about equestrian equipment may stop answering partway through
Non-response and dropoff bias
QUESTION 2 CATEGORYPOTENTIALRESPONDENT
Person 2
Person 3
Person 4
Person 5
Do you have afavorite letter
ldquoNordquo
ldquoYesrdquo
ldquoYesrdquo
ldquoYesrdquo
ldquoBrdquo
ldquoPrdquo ldquoZrdquo
What is yourfavorite letter
What is your secondfavorite letter
Non-response
Screen-outResponse
PartialResponse
PartialResponse
CompleteResponse
QUESTION 1 QUESTION 3
Person 1 skips the survey
screens out
drops out
drops out
The different categories of potential responses
How Google Surveys WorksWhite paper
Surveys
In a surveyrsquos report page we display the question response dropoff pattern
Researchers may want to investigate if therersquos a systemic reason for potential respondents to not respond to part or all of a survey The raw data download lists the status of each response Screen-out Partial or
Complete along with the answers to each question which allows more in-depth analysis
The question response dropoff chart
Modal bias or mode effects occur when the way in which a question is asked affects the respondentsrsquo answers in a systematic way because of how the survey is administered
All methods of conducting surveys are susceptible to modal bias In face-to-face or live phone interviews the fact that respondents are talking to live interviewers can influence how they answer questions they may want to be more agreeable in person This phenomenon is called the social desirability bias
Modal bias and survey design
How Google Surveys WorksWhite paper
Surveys
Different survey modes can also allow for different question structures In a live interview when a respondent declines to answer a question the interviewer can follow a script with follow-up questions an online platform like Google Surveys canrsquot do this For example consider an election poll that asks respondents to choose between three candidates Over the phone a live interviewer could list the three candidates and no other answer options If the respondent declines to answer the question the live interviewer can then ask a follow-up question to see if the respondent prefers a candidate not listed doesnrsquot want to answer or is undecided
This structure cannot be replicated online If only three candidate options are presented to a potential online respondent the only way to proceed is to choose one of those three candidates or drop out of the survey We could attempt to replicate the live interview structure online by adding a fourth option such as ldquoOtherrdquo or ldquoPrefer not to sayrdquo However respondents may be more likely to choose one of these alternative options when they are explicitly offered as an ldquoeasy outrdquo versus having to refuse to answer the question with a live interviewer
One way to partially mitigate this mode effect is through survey design Instead of adding ldquoOtherrdquo or ldquoPrefer not to sayrdquo options an open-ended text option can be used instead as in the Google Surveys 2016 US Election Poll22
This makes it more difficult for users to select the ldquoOtherrdquo option because they have to formulate and type out an alternative answer
Another mode effect to consider is that different question types may yield different results Results may differ if a question is formulated as a multiple-select (checkbox) question with five options versus separating that question into five individual single-select (radio button) questions A respondent may not want to check all the boxes or remember to check all the boxes whereas putting each option in a single question will encourage them to slow down and focus
22 See the Election Poll survey design at googlOA33DH
Multi-select questions can help reduce the number of questions in a survey but itrsquos important to note the effect that multiple-select questions may have on the results This is even more important when comparing the results of multiple-select questions to the results from other survey modes like live
interviews that often use single-select instead of multiple-select questions
How Google Surveys WorksWhite paper
Surveys
Katrina Sostek and Brett Slatkin are software engineers at Google The whitepaper was originally published in May 2017 All information is accurate as of June 2018 copy 2018 Google LLC All rights reserved Google and the Google logo are trademarks of Google Inc All other company and product names may be trademarks of the respective companies with which they are associated
Since launching in 2012 Google Surveys has moved from 2-question surveys to 10-question surveys expanded the publisher network and built the mobile app panel Surveys offers several advantages compared to traditional phone surveys faster cheaper results with larger sample sizes drawn from an online panel of tens of millions of potential respondents
Like all survey modes Surveys continues to face challenges from different kinds of biases mdash sampling response non-response dropoff modal mdash and we continue to improve our approaches to mitigate these biases Our work to improve our survey capabilities and accuracy is never done and wersquoll continue to refine our methodology as the landscape of respondents and technology continues to change
Privacy is very important to Google Users always have the option to pass on a survey and have the ability to opt out of the DoubleClick cookie completely Unless otherwise stated all responses are anonymous and collected in aggregate Certain surveys such as local surveys may be used to get feedback about a location recently visited and request permission for these responses to be posted publicly Google does not sell usersrsquo personal information to advertisers or anyone else For more information about the Google privacy policy please visit wwwgooglecompoliciesprivacy
Google Surveys is a member of the American Association of Public Opinion Researchrsquos (AAPOR) Transparency Initiative The initiative was founded in 2014 and establishes disclosure standards for organizations who run and publish surveys By joining the initiative Google Surveys pledges to uphold these disclosure standards when publishing results
We would like to acknowledge our fellow Google colleagues for providing insights and expertise that assisted the publication of this paper Amy Adams Harding Asfandyar Qureshi Carolin Jahn James Freeland James Pine Jon Fraser Kenneth Leftin Kevin Tudish Marisa Currie-Rose Michael Brandell Shaun Lysen and Yongwei Yang
In addition we would like to show our gratitude to Stacey Symonds and Fritz Holznagel for their guidance
Conclusion
Privacy
AAPORrsquos Transparency Initiative
Acknowledgements
Questions or comments surveys-supportgooglecom
How Google Surveys WorksWhite paper
Surveys
OverviewGoogle Surveys is a market research platform that surveys internet and smartphone users Since its launch in 2012 Surveys has evolved in several ways the maximum questions per survey has increased from 2 to 10 the online panel has expanded to tens of millions of unique daily users and a new mobile app panel has 5M active users and additional segmentation capabilities1 This paper will explain how Surveys works as of June 2018 while also discussing its advantages and limitations for mitigating different kinds of biases2 A future paper will evaluate the accuracy of results against benchmarks
1 Google Surveys originally launched with the name lsquoGoogle Consumer Surveysrsquo2 For an earlier whitepaper on Google Surveys see wwwgooglecominsightsconsumersurveysstaticconsumer_surveys_whitepaperpdf3 httpswwwcdcgovnchsdatanhisearlyreleasewireless201806pdf4 wwwpewresearchorgmethodologyu-s-survey-researchcollecting-survey-datacellphone-surveys5 wwwpewresearchorg20170515what-low-response-rates-mean-for-telephone-surveys6 wwwpeople-pressorg20120515assessing-the-representativeness-of-public-opinion-surveys7 httpwwwpewresearchorgfact-tank20180305some-americans-dont-use-the-internet-who-are-they
Online surveys have increasingly gained acceptance for market research and polling as phone-based surveys have faced multiple challenges In the United States for instance Random Digit Dialing (RDD) of phone landlines was the gold standard for many years Randomly dialing a number yielded a probability-based sample where each household had a roughly equal chance of being sampled However from 2003 to 2017 the percentage of households with landlines declined sharply from 97 to 473
One approach to increasing the coverage of phone surveys has been to add mobile phones into the sample but that has raised additional problems First the Pew Research Center has determined that itrsquos more expensive to call mobile phones because US federal regulations impose greater restrictions against automated dialing of mobile phones4 Second mobile phone users may be less likely to answer calls from unfamiliar numbers Response rates for phone surveys dropped from 36 in 1997 to 9 in 20165 partly due to the inclusion of mobile phones6
These challenges have led to the gradual use of online surveys instead of or in addition to phone surveys Online surveys are faster cheaper and can reach larger samples more easily than other survey modes Unfortunately itrsquos also harder to ldquorandomly dialrdquo an internet user which is why online surveys are often non-probability-based samples
Online surveys face an additional challenge they can only reach people who are online This has become a less severe problem in the US as more people have come online increasing from 52 in 2000 to 89 in 2018 Still the online US population differs from the general US population by skewing younger having higher household incomes attaining higher educational levels and living in more urban or suburban areas than the 11 who are offline7
Two questions prompted the launch of Google Surveys six years ago (1) Could access to online content incentivize people to answer short surveys and (2) Would the resulting data be accurate and cost effective We believe that the answers to both questions are ldquoyesrdquo
The rise of online surveys
Katrina Sostek and Brett Slatkin Authors gcosurveys gcosurveyswhitepaper
How Google Surveys WorksWhite paper
Surveys
8 See case study video from Gannett at youtubeOsvGyc8wrFA
Who answers Google Surveys and whereGoogle Surveys offers two panels of respondents (1) internet users reading content on a network of web publisher sites using Google Opinion Rewards for Publishers and (2) smartphone users who have downloaded and signed up to use an Android app called Google Opinion Rewards Wersquoll address these two panels in more detail below
Globally Surveys reaches tens of millions of possible respondents per day including 5M from the mobile app In the US there are also tens of millions of possible respondents per day including 2M from the mobile app
Surveys run on the publisher network are distributed across a wide-ranging network of 1500+ sites that focus on a diverse set of topics
Completed responses across all surveys come from a mix of sites that are 74 News 5 Reference 4 Arts and Entertainment and 17 Other Examples of publisher sites include Gannett8 regional newspapers USA Today and The Financial Times (all News) Womanrsquos World (Arts and Entertainment) babynamescom (Reference) and drivers-testorg (Other)
Researchers pay to run surveys and Surveys pays publishers for each survey answered on their site Surveys pays publishers tens of millions of dollars each year
Surveys partially and temporarily block the content on each publisherrsquos site Surveys are shown on both desktop and mobile sites and the surveyrsquos display is optimized for mobile devices
The publisher network
Researcher Researcher
Site AParticipant 1
Participant
Participant 3
Site
Site C
Google SurveysEditor
The survey is served on partnering publisher web sites
A researcher writes and alignsa survey to meet research needs
Respondents answer these surveys to access content on the website
Results are collected aggregatedand presented back to the researcher
Google SurveysReporting
The lifecycle of a Google Survey
How Google Surveys WorksWhite paper
Surveys
Survey prompts on desktop and mobile publisher sites
On the publisher network a ldquoriver samplingrdquo or ldquoweb interceptrdquo approach is used to select survey respondents as opposed to using a predefined panel9 By intercepting site visitors Google Surveys avoids one potential bias of opt-in survey panels which can be composed of people who simply love taking surveys aka Professional Survey Takers10
Surveys respondents on publisher sites are motivated to answer surveys to gain access to the sitesrsquo content such as articles reference or educational materials This kind of survey is often called a ldquosurveywallrdquo because like a paywall the survey blocks a sitersquos content until the survey is answered A surveywall uses that sitersquos content as an incentive to solicit a response
Publishers choose where when and how frequently surveys appear Readers have alternatives to answering the survey either skip the survey entirely or take another action such as paying for a subscription
To encourage high response rates we make it easy for respondents to answer surveys When Google Surveys first launched surveys were limited to two questions We have since determined that users are often willing to answer longer surveys and the maximum number of questions is now 10 However we limit the number of open-ended text questions to two per survey those are typically the most time-intensive to answer and may decrease response rates
9 wwwpewresearchorg20160502variation-in-online-nonprobability-survey-designpanel-recruitment-and-survey-sampling10 onlinelibrarywileycomdoi1010029781118763520ch10summary
How Google Surveys WorksWhite paper
Surveys
The mobile app Google Opinion Rewards is a predefined opt-in panel for Android users Mobile panel members install the app then earn 10cent-$1 in Google Play Store credit for each survey they answer Credits can be used to purchase things like books music movies and games This incentive can introduce bias because at this time users of the mobile app must have an Android phone and generally be motivated by Google Play Store credit We are actively working to diversify the rewards options on the mobile app to attract more types of users and reduce bias
After downloading the mobile app from the Play Store users sign up by entering their age gender and other demographic details After completing the signup process users will then get a notification whenever a survey is available to be answered Users canrsquot request surveys we ask them to answer surveys whenever we need their responses to improve the representativeness of survey results Most users get 1-2 surveys per week with each survey offering a reward of between 10cent and $1 in Play credit in the US
The Google Opinion Rewards app is also available in the iOS App Store and allows users to earn PayPal credits This app is currently not available for user sampling
So far in 2018 Surveys has completed an average of 5M surveys per month Those surveys averaged 1-2M complete responses per day and 4M responses to individual questions per day
For surveys run on the online publisher network the response rate was 25 11 For the opt-in mobile app panel the completion rate was 7512
11 Response rate is defined as the percentage of surveys viewed by potential respondents that receive an answer to at least the first question 12 Completion rate on the mobile app is defined as the percentage of surveys downloaded to a panelistrsquos phone that are also completed
The mobile app
How big is Google Surveys
The mobile app Google Opinion Rewards
How Google Surveys WorksWhite paper
Surveys
Google Surveys are created with three steps Define the audience design the questions and confirm pricing After a survey begins collecting responses the results will be available to view
Researchers create Surveys with an online editor First the researcher names the survey and defines the audience
Researchers begin by choosing a panel the general population on the publisher network or the mobile app In both panels surveys can be sent to specific demographic groups based on gender age and geography (country region13 or state)
Surveys can be run in ten countries on the publisher network and the mobile app Australia Brazil Canada Germany Italy14 Japan Mexico the Netherlands14 the United Kingdom and the United States The publisher network is additionally supported in over 40 countries14 Surveys on the mobile app can also be fielded to users who speak specific languages
How to run a Google Survey
Define the audience
The audience selection step in the editor
13 For the four US regions see enwikipediaorgwikiList_of_regions_of_the_United_StatesOfficial_regions_of_the_United_States 14 Only available with Convenience Sampling (described in section lsquoSampling biasrsquo)
How Google Surveys WorksWhite paper
Surveys
Surveys can have up to 10 questions Up to four of the questions can be screening questions if respondents
screen out at any point their survey ends there and they
see no more questions
Several question types are available single select
(radio button) multiple select (checkboxes) rating questions (Likert scale) image questions and open-ended text questions
Design the questions
Each respondent will see the questions in the order the researcher specifies Answers for each question can be shown in a fixed order randomized or randomly reversed which is useful for answers that have a logical order as in the example above Question text can be formatted with bold and _italics_ Questions are limited to 175 characters and answers to 44 characters in English-speaking countries these character limits differ by country
Google Surveys does not support branching where the answer to one question determines which question the respondent sees next However we support answer piping where the answer to one question can be quoted in a later questionrsquos text or answers To pipe an answer to Question 1 into the text of a follow-up question or answer use ldquoQ1_ANSWERrdquo without the quotations
To include a screening question as in the example above click ldquoScreen with this questionrdquo Then select the answers to ldquoscreen inrdquo respondents to continue on to the next question
The question design step in the editor
How Google Surveys WorksWhite paper
Surveys
Confirm price
The confirm pricing step for a survey with no screening questions
If a survey has screening questions it may cost significantly more than $3 per complete response depending on how difficult it is to reach the surveyrsquos audience The price will not be shown automatically but instead will
be determined by a trial run of the survey
The pricing process is different for surveys with screening questions versus those without If a survey has no screening questions the price will vary from 10cent to $3 per complete response depending on the number of questions and user criteria of the survey The editor will automatically display the pricing for the survey The researcher will then confirm the surveyrsquos details choose a desired number of responses (from 50 to 50000) and set the frequency
How Google Surveys WorksWhite paper
Surveys
The trial run will estimate the surveyrsquos incidence rate that is the number of respondents who choose a screen-in answer to the last screening question in the survey The lower the incidence rate the more the survey will cost For example if the incidence rate is 10 and the researcher buys 1000 complete responses wersquoll need to collect at least 10000 responses to the screening question to reach 1000 complete responses
The trial run will run for up to 24 hours at which point the researcher will get an email quoting the price for the survey A survey must have a 5 incidence rate to run if the incidence is less than 5 the researcher will be asked to redesign the survey Once this phase is complete the researcher can then purchase the survey
After a researcher creates and purchases a survey a Google Surveys team member will inspect the survey to make sure it complies with our policies then email the researcher if edits are needed A common review note is to ask researchers to change ldquoYesrdquo or ldquoNordquo binary questions to add an additional option like ldquoNo Answerrdquo or ldquoPrefer not to sayrdquo This kind of opt-out option increases the chance that users who may not fall into ldquoYesrdquo or ldquoNordquo will respond accurately Once a survey passes review and begins running it can no longer be changed
Surveys are fielded for a minimum of two days to avoid bias from the time of day or a single day Surveys with screening questions or stricter user criteria may take longer due to the rarity of the subpopulation being measured
The trial run step for a survey with screening questions
How Google Surveys WorksWhite paper
Surveys
View results
After a survey has collected an initial portion of its responses the researcher will get an email inviting them to view the results in an online report These early results will have low sample sizes and large error bars as more results are collected the sample size will increase and the error bar sizes will decrease The results will continue to update until the survey is complete
The survey results overview page
Survey report pages offer more than just top-level results They include comparisons (crosstabs) filters by demographic groups controls like raw (unweighted) instead of weighted results and options to share
or download the respondent-level data to a spreadsheet
How Google Surveys WorksWhite paper
Surveys
The question results page showing crosstabs and demographic filters
A major challenge for online non-probability surveys is mitigating sampling bias that is ensuring that samples represent the general population of internet users Within our panels we offer representative sampling for some countries and convenience sampling for others (described below)
For representative sampling we evaluate the representativeness of a survey by balancing its sample demographics to match the demographics of the specified population adult (18 or older) internet users We match based on three demographic dimensions age gender and geography In the US we use estimates for the national internet population from the US Census Bureaursquos 2015 Current Population Survey (CPS) Computer and Internet Use Supplement15 In other countries with representative sampling we rely on a combination of government data and internal Google data sources
Convenience sampling means that respondents may be of any age gender or from any geographic region within a country
Sampling bias
15 wwwcensusgovprograms-surveyscpstechnical-documentationcomplete2015html
How Google Surveys WorksWhite paper
Surveys
Collecting representative samples
For countries with representative sampling Google Surveys uses a two-step process to ensure each surveyrsquos representativeness First we use stratified sampling to dynamically engage respondents with the goal of matching the demographics of the target internet population Next we apply post-stratification weighting to more closely match those same demographics of the target internet population
While a survey is collecting responses Surveys does its best to match the respondentsrsquo demographics to the internet populationrsquos demographics with the following steps
Once the survey has collected all responses the ideal actual distribution would match the target populationrsquos demographic distribution In practice however actual distributions usually differ slightly from a target populationrsquos demographic distribution This discrepancy is due to the nature of the dynamic targeting described above the availability of respondents on publisher sites at any given time and the tradeoff between finishing a survey in a reasonable amount of time and perfectly matching the distribution
A table at the bottom of each survey report shows the sampling bias how the surveyrsquos sample differs from the target internet population for gender age and geography
Calculate the target percentage of the joint distributions that is the percentage of each three-dimensional demographic group such as 18ndash24-year-old males in Idaho
Select respondents randomly within each demographic group (age x gender x state) to answer the survey We donrsquot balance responses using any additional paradata such as time of day operating system or answers to other survey questions
As responses are collected update the actual current percentage of respondents of each group in real time
If the actual and target percentages differ at any time dynamically adjust the criteria of the survey to compensate for under- or over-sampling For example if a survey has enough responses from 18ndash24-year-old males in Idaho but needs more representation from 35ndash44-year-old females in Nebraska we will show fewer surveys to 18ndash24-year-old males in Idaho and more surveys to 35ndash44-year-old females in Nebraska
1
3
2
4
How Google Surveys WorksWhite paper
Surveys
The bias table from the question results page
The Root Mean Squared Error (RMSE) score describes the square root of the mean of the squared errors across all values (eg male and female) within each dimension (gender age and geography) The larger the RMSE score the less representative the sample is of the specified population
One note about geographic representativeness Google Surveys guarantees a representative distribution of regions or states within a country whenever possible However Surveys does not guarantee geographic representativeness within a region or state mdash such as a representative balance between cities and rural areas mdash as part of its dynamic fielding and weighting schemes The publisher network does however have extensive coverage within states through its 1500+ publisher sites in which local newspapers are strongly represented
We also balance responses across different publishers by preventing any one publisher from dominating a surveyrsquos results This reduces bias from specific publishers that may focus on local topics national issues or particular subject matters This approach also limits the possibility of repeatedly sampling the same respondents for multiple surveys across our system Our system also ensures that the same respondent doesnrsquot have the opportunity to answer the same survey more than once These frequency capping measures help diversify our panel and mitigate bias towards frequent internet users
How Google Surveys WorksWhite paper
Surveys
To correct for sampling bias after the survey is run we apply weights to upweight underrepresented groups and downweight overrepresented groups This calculation is coarser than the calculation for dynamic fielding instead of matching the three-dimensional joint distributions we match each single dimension mdash the marginal distributions mdash on their own We then calculate weights using an iterative process also known as raking to reduce bias across all three dimensions16
Herersquos how raking works First we exclude all respondents with unknown demographics for age gender or geography Then we calculate weights that will match the gender breakdown to the target demographic If the target distribution is 52 female and 48 male but the actual distribution is 50 female and 50 male then we apply a weight of 52 50 = 104 to all female responses and 48 50 = 096 to all male responses
After weighting respondents by the gender dimension on its own we do the same for the age dimension on its own and then the region dimension on its own Every time we get one dimension to perfectly match the target demographic the previous dimensions will no longer exactly match We use an iterative raking technique to do 10 rounds of calculations for all three dimensions on their own17 After 10 rounds the weights will approach convergence and all three dimensions will closely match their targets
The weights in each survey are calculated based on the first question We use the first question for weighting because thatrsquos the only question we can assume should match the target populationrsquos demographic distribution
For example if the first question is a screening question that asks ldquoWhat is your genderrdquo and only respondents who answer ldquomalerdquo screen through to the second question we wouldnrsquot want to match the second question to 52 female and 48 male it will always be 100 male
Even if the first question isnrsquot a screening question respondents may drop off throughout the survey in a way that is skewed towards one demographic group due to the design of the survey Thus we weight responses to follow-up questions by taking the first-question weights filtering them to only those who answered the follow-up question and renormalizing so that the sum of the weights equals the total number of responses to the follow-up question
Weighting
16 Google Surveys moved to a raking methodology in October 2016 The previous methodology is explained in the original whitepaper wwwgooglecominsightsconsumersurveysstaticconsumer_surveys_whitepaperpdf17 enwikipediaorgwikiIterative_proportional_fitting
How Google Surveys WorksWhite paper
Surveys
In the survey results the values displayed in the error bars represent the modeled margin of error This means that if we repeat this survey many times in the same way 95 of the time the resulting range of values would contain the true value
We follow the Pew Research Center in using the term ldquomodeled margin of errorrdquo to differentiate from the statistical term ldquomargin of errorrdquo which only applies to true probability-based samples18 Because Google Surveys collects online non-probability samples the margin of error calculation is based on assumptions about the Surveys sampling model and what would happen if we repeated the same sampling process many times
We use the Modified (or ad hoc) Wilson method to calculate the error bars which can be asymmetrical eg +18-16 The Wilson method works well for small sample sizes as well as extreme probabilities (close to 0 or 100)19 We follow the Modified Wilson calculation using effective sample size as shown in Applied Survey Data Analysis20 The calculation is the same as the Wilson method but uses n = p(1 - p) var(p) in place of n21
Error bars
A question report page showing error bars and the modeled margin of error
In this example the modeled margin of error for Basketball is +18-16 The range of values is 124 to 158 ie 14 adjusted by the modeled
margin of error
Four factors influence and can reduce the size of the modeled
margin of error
1 Larger sample sizes
2 Percentages closer to the extremes of 0 or 100
3 Lower confidence levels (we use a 95 confidence level)
4 Lower variability of weights
18 wwwpewresearchorg20180126variability-of-survey-estimates19 Dean Natalie and Pagano Marcello 2015 ldquoEvaluating Confidence Interval Methods for Binomial Proportions in Clustered Surveysrdquo Journal of Survey Statistics and Methodology 3 (4) 484-503 doiorg101093jssamsmv02420 Heeringa Steven G West Brady T and Berglund Patricia A 2017 Applied Survey Data Analysis Second Edition 16521 enwikipediaorgwikiBinomial_proportion_confidence_intervalWilson_score_interval
Surveys may be subject to other sources of biases and errors including mdash but not limited to mdash sampling and nonresponse as discussed in more detail below
How Google Surveys WorksWhite paper
Surveys
The way we determine respondent demographics differs by survey panel
The mobile app is the simpler of the two panels We ask users to self-report their age gender and zipcode when they sign up to use the app We periodically ask these questions again to refresh the panelistsrsquo demographics in case they have changed
The publisher network uses inferred demographics which means that we donrsquot explicitly ask the panelists for their demographics We do this to minimize the number of questions in a survey which offers a better respondent experience and encourages higher response rates Any researcher who doesnrsquot want to rely on inferred demographics can explicitly add demographic questions to their surveys However our dynamic fielding and weighting process to match ground-truth data will still be based on inferred demographics
Like many ads on the web Google Surveys infers the age and gender of anonymous respondents based on browsing behavior and geography based on IP addresses Users can opt out of inferred demographics in the Ads Settings which applies across Google ads services the 2M+ sites and apps that partner with Google to show ads and Google Surveys In the case of Surveys opting out means that usersrsquo demographics will show as unknown and their responses will be excluded from weighted results For all users unless otherwise stated responses are anonymous and collected in aggregate
How we know age gender and region
In addition to sampling bias Google Surveys monitors and mitigates other kinds of bias
Response non-response and modal bias
Response bias is the bias from inattentive or untruthful answers to questions
The publisher network and mobile app have different kinds of inattentive or untruthful responses Respondents on the publisher network are intercepted while trying to view content online so they do not necessarily want to answer a survey and may just want to see that content The mobile app has the opposite problem where users want to answer as many surveys as possible because they voluntarily opted into the mobile panel out of a desire to answer surveys and earn rewards
Another source of low-quality responses from both the publisher network and the mobile app is open-ended text questions Respondents may respond with gibberish profanity or something like ldquoI hate surveysrdquo These types of answers are removed from the surveyrsquos results using common natural language processing libraries employed across Google
Response bias
How Google Surveys WorksWhite paper
Surveys
Google Surveys tracks investigates and removes multiple kinds of low-quality responses and respondents If low-quality responses are dropped from a survey the survey will remain in the field to collect more responses to make up for the sample that is now missing If chronically inattentive or untruthful respondents are detected they may be prevented from getting any more surveys in the future
Potential responses to a survey can fall into several categories non-response screen-out response partial response or complete response These categories are illustrated below
Non-response bias occurs when a group of people in the sample choose not to respond to the survey in a systematic way which can cause the omission of that grouprsquos opinions Non-responses can come from people who donrsquot like answering surveys in general or are alienated by the first question in some way Unfortunately it can be difficult to ask non-respondents why they chose not to respond because they are unlikely to respond
Respondents may also choose to stop answering questions midway through a survey These partial responses can introduce dropoff bias perhaps an overly-specific question turns off respondents or respondents could drop off towards the end of a long survey For example if a survey is about an extremely specific topic like equestrian equipment then people who are uninterested or uninformed about equestrian equipment may stop answering partway through
Non-response and dropoff bias
QUESTION 2 CATEGORYPOTENTIALRESPONDENT
Person 2
Person 3
Person 4
Person 5
Do you have afavorite letter
ldquoNordquo
ldquoYesrdquo
ldquoYesrdquo
ldquoYesrdquo
ldquoBrdquo
ldquoPrdquo ldquoZrdquo
What is yourfavorite letter
What is your secondfavorite letter
Non-response
Screen-outResponse
PartialResponse
PartialResponse
CompleteResponse
QUESTION 1 QUESTION 3
Person 1 skips the survey
screens out
drops out
drops out
The different categories of potential responses
How Google Surveys WorksWhite paper
Surveys
In a surveyrsquos report page we display the question response dropoff pattern
Researchers may want to investigate if therersquos a systemic reason for potential respondents to not respond to part or all of a survey The raw data download lists the status of each response Screen-out Partial or
Complete along with the answers to each question which allows more in-depth analysis
The question response dropoff chart
Modal bias or mode effects occur when the way in which a question is asked affects the respondentsrsquo answers in a systematic way because of how the survey is administered
All methods of conducting surveys are susceptible to modal bias In face-to-face or live phone interviews the fact that respondents are talking to live interviewers can influence how they answer questions they may want to be more agreeable in person This phenomenon is called the social desirability bias
Modal bias and survey design
How Google Surveys WorksWhite paper
Surveys
Different survey modes can also allow for different question structures In a live interview when a respondent declines to answer a question the interviewer can follow a script with follow-up questions an online platform like Google Surveys canrsquot do this For example consider an election poll that asks respondents to choose between three candidates Over the phone a live interviewer could list the three candidates and no other answer options If the respondent declines to answer the question the live interviewer can then ask a follow-up question to see if the respondent prefers a candidate not listed doesnrsquot want to answer or is undecided
This structure cannot be replicated online If only three candidate options are presented to a potential online respondent the only way to proceed is to choose one of those three candidates or drop out of the survey We could attempt to replicate the live interview structure online by adding a fourth option such as ldquoOtherrdquo or ldquoPrefer not to sayrdquo However respondents may be more likely to choose one of these alternative options when they are explicitly offered as an ldquoeasy outrdquo versus having to refuse to answer the question with a live interviewer
One way to partially mitigate this mode effect is through survey design Instead of adding ldquoOtherrdquo or ldquoPrefer not to sayrdquo options an open-ended text option can be used instead as in the Google Surveys 2016 US Election Poll22
This makes it more difficult for users to select the ldquoOtherrdquo option because they have to formulate and type out an alternative answer
Another mode effect to consider is that different question types may yield different results Results may differ if a question is formulated as a multiple-select (checkbox) question with five options versus separating that question into five individual single-select (radio button) questions A respondent may not want to check all the boxes or remember to check all the boxes whereas putting each option in a single question will encourage them to slow down and focus
22 See the Election Poll survey design at googlOA33DH
Multi-select questions can help reduce the number of questions in a survey but itrsquos important to note the effect that multiple-select questions may have on the results This is even more important when comparing the results of multiple-select questions to the results from other survey modes like live
interviews that often use single-select instead of multiple-select questions
How Google Surveys WorksWhite paper
Surveys
Katrina Sostek and Brett Slatkin are software engineers at Google The whitepaper was originally published in May 2017 All information is accurate as of June 2018 copy 2018 Google LLC All rights reserved Google and the Google logo are trademarks of Google Inc All other company and product names may be trademarks of the respective companies with which they are associated
Since launching in 2012 Google Surveys has moved from 2-question surveys to 10-question surveys expanded the publisher network and built the mobile app panel Surveys offers several advantages compared to traditional phone surveys faster cheaper results with larger sample sizes drawn from an online panel of tens of millions of potential respondents
Like all survey modes Surveys continues to face challenges from different kinds of biases mdash sampling response non-response dropoff modal mdash and we continue to improve our approaches to mitigate these biases Our work to improve our survey capabilities and accuracy is never done and wersquoll continue to refine our methodology as the landscape of respondents and technology continues to change
Privacy is very important to Google Users always have the option to pass on a survey and have the ability to opt out of the DoubleClick cookie completely Unless otherwise stated all responses are anonymous and collected in aggregate Certain surveys such as local surveys may be used to get feedback about a location recently visited and request permission for these responses to be posted publicly Google does not sell usersrsquo personal information to advertisers or anyone else For more information about the Google privacy policy please visit wwwgooglecompoliciesprivacy
Google Surveys is a member of the American Association of Public Opinion Researchrsquos (AAPOR) Transparency Initiative The initiative was founded in 2014 and establishes disclosure standards for organizations who run and publish surveys By joining the initiative Google Surveys pledges to uphold these disclosure standards when publishing results
We would like to acknowledge our fellow Google colleagues for providing insights and expertise that assisted the publication of this paper Amy Adams Harding Asfandyar Qureshi Carolin Jahn James Freeland James Pine Jon Fraser Kenneth Leftin Kevin Tudish Marisa Currie-Rose Michael Brandell Shaun Lysen and Yongwei Yang
In addition we would like to show our gratitude to Stacey Symonds and Fritz Holznagel for their guidance
Conclusion
Privacy
AAPORrsquos Transparency Initiative
Acknowledgements
Questions or comments surveys-supportgooglecom
How Google Surveys WorksWhite paper
Surveys
Survey prompts on desktop and mobile publisher sites
On the publisher network a ldquoriver samplingrdquo or ldquoweb interceptrdquo approach is used to select survey respondents as opposed to using a predefined panel9 By intercepting site visitors Google Surveys avoids one potential bias of opt-in survey panels which can be composed of people who simply love taking surveys aka Professional Survey Takers10
Surveys respondents on publisher sites are motivated to answer surveys to gain access to the sitesrsquo content such as articles reference or educational materials This kind of survey is often called a ldquosurveywallrdquo because like a paywall the survey blocks a sitersquos content until the survey is answered A surveywall uses that sitersquos content as an incentive to solicit a response
Publishers choose where when and how frequently surveys appear Readers have alternatives to answering the survey either skip the survey entirely or take another action such as paying for a subscription
To encourage high response rates we make it easy for respondents to answer surveys When Google Surveys first launched surveys were limited to two questions We have since determined that users are often willing to answer longer surveys and the maximum number of questions is now 10 However we limit the number of open-ended text questions to two per survey those are typically the most time-intensive to answer and may decrease response rates
9 wwwpewresearchorg20160502variation-in-online-nonprobability-survey-designpanel-recruitment-and-survey-sampling10 onlinelibrarywileycomdoi1010029781118763520ch10summary
How Google Surveys WorksWhite paper
Surveys
The mobile app Google Opinion Rewards is a predefined opt-in panel for Android users Mobile panel members install the app then earn 10cent-$1 in Google Play Store credit for each survey they answer Credits can be used to purchase things like books music movies and games This incentive can introduce bias because at this time users of the mobile app must have an Android phone and generally be motivated by Google Play Store credit We are actively working to diversify the rewards options on the mobile app to attract more types of users and reduce bias
After downloading the mobile app from the Play Store users sign up by entering their age gender and other demographic details After completing the signup process users will then get a notification whenever a survey is available to be answered Users canrsquot request surveys we ask them to answer surveys whenever we need their responses to improve the representativeness of survey results Most users get 1-2 surveys per week with each survey offering a reward of between 10cent and $1 in Play credit in the US
The Google Opinion Rewards app is also available in the iOS App Store and allows users to earn PayPal credits This app is currently not available for user sampling
So far in 2018 Surveys has completed an average of 5M surveys per month Those surveys averaged 1-2M complete responses per day and 4M responses to individual questions per day
For surveys run on the online publisher network the response rate was 25 11 For the opt-in mobile app panel the completion rate was 7512
11 Response rate is defined as the percentage of surveys viewed by potential respondents that receive an answer to at least the first question 12 Completion rate on the mobile app is defined as the percentage of surveys downloaded to a panelistrsquos phone that are also completed
The mobile app
How big is Google Surveys
The mobile app Google Opinion Rewards
How Google Surveys WorksWhite paper
Surveys
Google Surveys are created with three steps Define the audience design the questions and confirm pricing After a survey begins collecting responses the results will be available to view
Researchers create Surveys with an online editor First the researcher names the survey and defines the audience
Researchers begin by choosing a panel the general population on the publisher network or the mobile app In both panels surveys can be sent to specific demographic groups based on gender age and geography (country region13 or state)
Surveys can be run in ten countries on the publisher network and the mobile app Australia Brazil Canada Germany Italy14 Japan Mexico the Netherlands14 the United Kingdom and the United States The publisher network is additionally supported in over 40 countries14 Surveys on the mobile app can also be fielded to users who speak specific languages
How to run a Google Survey
Define the audience
The audience selection step in the editor
13 For the four US regions see enwikipediaorgwikiList_of_regions_of_the_United_StatesOfficial_regions_of_the_United_States 14 Only available with Convenience Sampling (described in section lsquoSampling biasrsquo)
How Google Surveys WorksWhite paper
Surveys
Surveys can have up to 10 questions Up to four of the questions can be screening questions if respondents
screen out at any point their survey ends there and they
see no more questions
Several question types are available single select
(radio button) multiple select (checkboxes) rating questions (Likert scale) image questions and open-ended text questions
Design the questions
Each respondent will see the questions in the order the researcher specifies Answers for each question can be shown in a fixed order randomized or randomly reversed which is useful for answers that have a logical order as in the example above Question text can be formatted with bold and _italics_ Questions are limited to 175 characters and answers to 44 characters in English-speaking countries these character limits differ by country
Google Surveys does not support branching where the answer to one question determines which question the respondent sees next However we support answer piping where the answer to one question can be quoted in a later questionrsquos text or answers To pipe an answer to Question 1 into the text of a follow-up question or answer use ldquoQ1_ANSWERrdquo without the quotations
To include a screening question as in the example above click ldquoScreen with this questionrdquo Then select the answers to ldquoscreen inrdquo respondents to continue on to the next question
The question design step in the editor
How Google Surveys WorksWhite paper
Surveys
Confirm price
The confirm pricing step for a survey with no screening questions
If a survey has screening questions it may cost significantly more than $3 per complete response depending on how difficult it is to reach the surveyrsquos audience The price will not be shown automatically but instead will
be determined by a trial run of the survey
The pricing process is different for surveys with screening questions versus those without If a survey has no screening questions the price will vary from 10cent to $3 per complete response depending on the number of questions and user criteria of the survey The editor will automatically display the pricing for the survey The researcher will then confirm the surveyrsquos details choose a desired number of responses (from 50 to 50000) and set the frequency
How Google Surveys WorksWhite paper
Surveys
The trial run will estimate the surveyrsquos incidence rate that is the number of respondents who choose a screen-in answer to the last screening question in the survey The lower the incidence rate the more the survey will cost For example if the incidence rate is 10 and the researcher buys 1000 complete responses wersquoll need to collect at least 10000 responses to the screening question to reach 1000 complete responses
The trial run will run for up to 24 hours at which point the researcher will get an email quoting the price for the survey A survey must have a 5 incidence rate to run if the incidence is less than 5 the researcher will be asked to redesign the survey Once this phase is complete the researcher can then purchase the survey
After a researcher creates and purchases a survey a Google Surveys team member will inspect the survey to make sure it complies with our policies then email the researcher if edits are needed A common review note is to ask researchers to change ldquoYesrdquo or ldquoNordquo binary questions to add an additional option like ldquoNo Answerrdquo or ldquoPrefer not to sayrdquo This kind of opt-out option increases the chance that users who may not fall into ldquoYesrdquo or ldquoNordquo will respond accurately Once a survey passes review and begins running it can no longer be changed
Surveys are fielded for a minimum of two days to avoid bias from the time of day or a single day Surveys with screening questions or stricter user criteria may take longer due to the rarity of the subpopulation being measured
The trial run step for a survey with screening questions
How Google Surveys WorksWhite paper
Surveys
View results
After a survey has collected an initial portion of its responses the researcher will get an email inviting them to view the results in an online report These early results will have low sample sizes and large error bars as more results are collected the sample size will increase and the error bar sizes will decrease The results will continue to update until the survey is complete
The survey results overview page
Survey report pages offer more than just top-level results They include comparisons (crosstabs) filters by demographic groups controls like raw (unweighted) instead of weighted results and options to share
or download the respondent-level data to a spreadsheet
How Google Surveys WorksWhite paper
Surveys
The question results page showing crosstabs and demographic filters
A major challenge for online non-probability surveys is mitigating sampling bias that is ensuring that samples represent the general population of internet users Within our panels we offer representative sampling for some countries and convenience sampling for others (described below)
For representative sampling we evaluate the representativeness of a survey by balancing its sample demographics to match the demographics of the specified population adult (18 or older) internet users We match based on three demographic dimensions age gender and geography In the US we use estimates for the national internet population from the US Census Bureaursquos 2015 Current Population Survey (CPS) Computer and Internet Use Supplement15 In other countries with representative sampling we rely on a combination of government data and internal Google data sources
Convenience sampling means that respondents may be of any age gender or from any geographic region within a country
Sampling bias
15 wwwcensusgovprograms-surveyscpstechnical-documentationcomplete2015html
How Google Surveys WorksWhite paper
Surveys
Collecting representative samples
For countries with representative sampling Google Surveys uses a two-step process to ensure each surveyrsquos representativeness First we use stratified sampling to dynamically engage respondents with the goal of matching the demographics of the target internet population Next we apply post-stratification weighting to more closely match those same demographics of the target internet population
While a survey is collecting responses Surveys does its best to match the respondentsrsquo demographics to the internet populationrsquos demographics with the following steps
Once the survey has collected all responses the ideal actual distribution would match the target populationrsquos demographic distribution In practice however actual distributions usually differ slightly from a target populationrsquos demographic distribution This discrepancy is due to the nature of the dynamic targeting described above the availability of respondents on publisher sites at any given time and the tradeoff between finishing a survey in a reasonable amount of time and perfectly matching the distribution
A table at the bottom of each survey report shows the sampling bias how the surveyrsquos sample differs from the target internet population for gender age and geography
Calculate the target percentage of the joint distributions that is the percentage of each three-dimensional demographic group such as 18ndash24-year-old males in Idaho
Select respondents randomly within each demographic group (age x gender x state) to answer the survey We donrsquot balance responses using any additional paradata such as time of day operating system or answers to other survey questions
As responses are collected update the actual current percentage of respondents of each group in real time
If the actual and target percentages differ at any time dynamically adjust the criteria of the survey to compensate for under- or over-sampling For example if a survey has enough responses from 18ndash24-year-old males in Idaho but needs more representation from 35ndash44-year-old females in Nebraska we will show fewer surveys to 18ndash24-year-old males in Idaho and more surveys to 35ndash44-year-old females in Nebraska
1
3
2
4
How Google Surveys WorksWhite paper
Surveys
The bias table from the question results page
The Root Mean Squared Error (RMSE) score describes the square root of the mean of the squared errors across all values (eg male and female) within each dimension (gender age and geography) The larger the RMSE score the less representative the sample is of the specified population
One note about geographic representativeness Google Surveys guarantees a representative distribution of regions or states within a country whenever possible However Surveys does not guarantee geographic representativeness within a region or state mdash such as a representative balance between cities and rural areas mdash as part of its dynamic fielding and weighting schemes The publisher network does however have extensive coverage within states through its 1500+ publisher sites in which local newspapers are strongly represented
We also balance responses across different publishers by preventing any one publisher from dominating a surveyrsquos results This reduces bias from specific publishers that may focus on local topics national issues or particular subject matters This approach also limits the possibility of repeatedly sampling the same respondents for multiple surveys across our system Our system also ensures that the same respondent doesnrsquot have the opportunity to answer the same survey more than once These frequency capping measures help diversify our panel and mitigate bias towards frequent internet users
How Google Surveys WorksWhite paper
Surveys
To correct for sampling bias after the survey is run we apply weights to upweight underrepresented groups and downweight overrepresented groups This calculation is coarser than the calculation for dynamic fielding instead of matching the three-dimensional joint distributions we match each single dimension mdash the marginal distributions mdash on their own We then calculate weights using an iterative process also known as raking to reduce bias across all three dimensions16
Herersquos how raking works First we exclude all respondents with unknown demographics for age gender or geography Then we calculate weights that will match the gender breakdown to the target demographic If the target distribution is 52 female and 48 male but the actual distribution is 50 female and 50 male then we apply a weight of 52 50 = 104 to all female responses and 48 50 = 096 to all male responses
After weighting respondents by the gender dimension on its own we do the same for the age dimension on its own and then the region dimension on its own Every time we get one dimension to perfectly match the target demographic the previous dimensions will no longer exactly match We use an iterative raking technique to do 10 rounds of calculations for all three dimensions on their own17 After 10 rounds the weights will approach convergence and all three dimensions will closely match their targets
The weights in each survey are calculated based on the first question We use the first question for weighting because thatrsquos the only question we can assume should match the target populationrsquos demographic distribution
For example if the first question is a screening question that asks ldquoWhat is your genderrdquo and only respondents who answer ldquomalerdquo screen through to the second question we wouldnrsquot want to match the second question to 52 female and 48 male it will always be 100 male
Even if the first question isnrsquot a screening question respondents may drop off throughout the survey in a way that is skewed towards one demographic group due to the design of the survey Thus we weight responses to follow-up questions by taking the first-question weights filtering them to only those who answered the follow-up question and renormalizing so that the sum of the weights equals the total number of responses to the follow-up question
Weighting
16 Google Surveys moved to a raking methodology in October 2016 The previous methodology is explained in the original whitepaper wwwgooglecominsightsconsumersurveysstaticconsumer_surveys_whitepaperpdf17 enwikipediaorgwikiIterative_proportional_fitting
How Google Surveys WorksWhite paper
Surveys
In the survey results the values displayed in the error bars represent the modeled margin of error This means that if we repeat this survey many times in the same way 95 of the time the resulting range of values would contain the true value
We follow the Pew Research Center in using the term ldquomodeled margin of errorrdquo to differentiate from the statistical term ldquomargin of errorrdquo which only applies to true probability-based samples18 Because Google Surveys collects online non-probability samples the margin of error calculation is based on assumptions about the Surveys sampling model and what would happen if we repeated the same sampling process many times
We use the Modified (or ad hoc) Wilson method to calculate the error bars which can be asymmetrical eg +18-16 The Wilson method works well for small sample sizes as well as extreme probabilities (close to 0 or 100)19 We follow the Modified Wilson calculation using effective sample size as shown in Applied Survey Data Analysis20 The calculation is the same as the Wilson method but uses n = p(1 - p) var(p) in place of n21
Error bars
A question report page showing error bars and the modeled margin of error
In this example the modeled margin of error for Basketball is +18-16 The range of values is 124 to 158 ie 14 adjusted by the modeled
margin of error
Four factors influence and can reduce the size of the modeled
margin of error
1 Larger sample sizes
2 Percentages closer to the extremes of 0 or 100
3 Lower confidence levels (we use a 95 confidence level)
4 Lower variability of weights
18 wwwpewresearchorg20180126variability-of-survey-estimates19 Dean Natalie and Pagano Marcello 2015 ldquoEvaluating Confidence Interval Methods for Binomial Proportions in Clustered Surveysrdquo Journal of Survey Statistics and Methodology 3 (4) 484-503 doiorg101093jssamsmv02420 Heeringa Steven G West Brady T and Berglund Patricia A 2017 Applied Survey Data Analysis Second Edition 16521 enwikipediaorgwikiBinomial_proportion_confidence_intervalWilson_score_interval
Surveys may be subject to other sources of biases and errors including mdash but not limited to mdash sampling and nonresponse as discussed in more detail below
How Google Surveys WorksWhite paper
Surveys
The way we determine respondent demographics differs by survey panel
The mobile app is the simpler of the two panels We ask users to self-report their age gender and zipcode when they sign up to use the app We periodically ask these questions again to refresh the panelistsrsquo demographics in case they have changed
The publisher network uses inferred demographics which means that we donrsquot explicitly ask the panelists for their demographics We do this to minimize the number of questions in a survey which offers a better respondent experience and encourages higher response rates Any researcher who doesnrsquot want to rely on inferred demographics can explicitly add demographic questions to their surveys However our dynamic fielding and weighting process to match ground-truth data will still be based on inferred demographics
Like many ads on the web Google Surveys infers the age and gender of anonymous respondents based on browsing behavior and geography based on IP addresses Users can opt out of inferred demographics in the Ads Settings which applies across Google ads services the 2M+ sites and apps that partner with Google to show ads and Google Surveys In the case of Surveys opting out means that usersrsquo demographics will show as unknown and their responses will be excluded from weighted results For all users unless otherwise stated responses are anonymous and collected in aggregate
How we know age gender and region
In addition to sampling bias Google Surveys monitors and mitigates other kinds of bias
Response non-response and modal bias
Response bias is the bias from inattentive or untruthful answers to questions
The publisher network and mobile app have different kinds of inattentive or untruthful responses Respondents on the publisher network are intercepted while trying to view content online so they do not necessarily want to answer a survey and may just want to see that content The mobile app has the opposite problem where users want to answer as many surveys as possible because they voluntarily opted into the mobile panel out of a desire to answer surveys and earn rewards
Another source of low-quality responses from both the publisher network and the mobile app is open-ended text questions Respondents may respond with gibberish profanity or something like ldquoI hate surveysrdquo These types of answers are removed from the surveyrsquos results using common natural language processing libraries employed across Google
Response bias
How Google Surveys WorksWhite paper
Surveys
Google Surveys tracks investigates and removes multiple kinds of low-quality responses and respondents If low-quality responses are dropped from a survey the survey will remain in the field to collect more responses to make up for the sample that is now missing If chronically inattentive or untruthful respondents are detected they may be prevented from getting any more surveys in the future
Potential responses to a survey can fall into several categories non-response screen-out response partial response or complete response These categories are illustrated below
Non-response bias occurs when a group of people in the sample choose not to respond to the survey in a systematic way which can cause the omission of that grouprsquos opinions Non-responses can come from people who donrsquot like answering surveys in general or are alienated by the first question in some way Unfortunately it can be difficult to ask non-respondents why they chose not to respond because they are unlikely to respond
Respondents may also choose to stop answering questions midway through a survey These partial responses can introduce dropoff bias perhaps an overly-specific question turns off respondents or respondents could drop off towards the end of a long survey For example if a survey is about an extremely specific topic like equestrian equipment then people who are uninterested or uninformed about equestrian equipment may stop answering partway through
Non-response and dropoff bias
QUESTION 2 CATEGORYPOTENTIALRESPONDENT
Person 2
Person 3
Person 4
Person 5
Do you have afavorite letter
ldquoNordquo
ldquoYesrdquo
ldquoYesrdquo
ldquoYesrdquo
ldquoBrdquo
ldquoPrdquo ldquoZrdquo
What is yourfavorite letter
What is your secondfavorite letter
Non-response
Screen-outResponse
PartialResponse
PartialResponse
CompleteResponse
QUESTION 1 QUESTION 3
Person 1 skips the survey
screens out
drops out
drops out
The different categories of potential responses
How Google Surveys WorksWhite paper
Surveys
In a surveyrsquos report page we display the question response dropoff pattern
Researchers may want to investigate if therersquos a systemic reason for potential respondents to not respond to part or all of a survey The raw data download lists the status of each response Screen-out Partial or
Complete along with the answers to each question which allows more in-depth analysis
The question response dropoff chart
Modal bias or mode effects occur when the way in which a question is asked affects the respondentsrsquo answers in a systematic way because of how the survey is administered
All methods of conducting surveys are susceptible to modal bias In face-to-face or live phone interviews the fact that respondents are talking to live interviewers can influence how they answer questions they may want to be more agreeable in person This phenomenon is called the social desirability bias
Modal bias and survey design
How Google Surveys WorksWhite paper
Surveys
Different survey modes can also allow for different question structures In a live interview when a respondent declines to answer a question the interviewer can follow a script with follow-up questions an online platform like Google Surveys canrsquot do this For example consider an election poll that asks respondents to choose between three candidates Over the phone a live interviewer could list the three candidates and no other answer options If the respondent declines to answer the question the live interviewer can then ask a follow-up question to see if the respondent prefers a candidate not listed doesnrsquot want to answer or is undecided
This structure cannot be replicated online If only three candidate options are presented to a potential online respondent the only way to proceed is to choose one of those three candidates or drop out of the survey We could attempt to replicate the live interview structure online by adding a fourth option such as ldquoOtherrdquo or ldquoPrefer not to sayrdquo However respondents may be more likely to choose one of these alternative options when they are explicitly offered as an ldquoeasy outrdquo versus having to refuse to answer the question with a live interviewer
One way to partially mitigate this mode effect is through survey design Instead of adding ldquoOtherrdquo or ldquoPrefer not to sayrdquo options an open-ended text option can be used instead as in the Google Surveys 2016 US Election Poll22
This makes it more difficult for users to select the ldquoOtherrdquo option because they have to formulate and type out an alternative answer
Another mode effect to consider is that different question types may yield different results Results may differ if a question is formulated as a multiple-select (checkbox) question with five options versus separating that question into five individual single-select (radio button) questions A respondent may not want to check all the boxes or remember to check all the boxes whereas putting each option in a single question will encourage them to slow down and focus
22 See the Election Poll survey design at googlOA33DH
Multi-select questions can help reduce the number of questions in a survey but itrsquos important to note the effect that multiple-select questions may have on the results This is even more important when comparing the results of multiple-select questions to the results from other survey modes like live
interviews that often use single-select instead of multiple-select questions
How Google Surveys WorksWhite paper
Surveys
Katrina Sostek and Brett Slatkin are software engineers at Google The whitepaper was originally published in May 2017 All information is accurate as of June 2018 copy 2018 Google LLC All rights reserved Google and the Google logo are trademarks of Google Inc All other company and product names may be trademarks of the respective companies with which they are associated
Since launching in 2012 Google Surveys has moved from 2-question surveys to 10-question surveys expanded the publisher network and built the mobile app panel Surveys offers several advantages compared to traditional phone surveys faster cheaper results with larger sample sizes drawn from an online panel of tens of millions of potential respondents
Like all survey modes Surveys continues to face challenges from different kinds of biases mdash sampling response non-response dropoff modal mdash and we continue to improve our approaches to mitigate these biases Our work to improve our survey capabilities and accuracy is never done and wersquoll continue to refine our methodology as the landscape of respondents and technology continues to change
Privacy is very important to Google Users always have the option to pass on a survey and have the ability to opt out of the DoubleClick cookie completely Unless otherwise stated all responses are anonymous and collected in aggregate Certain surveys such as local surveys may be used to get feedback about a location recently visited and request permission for these responses to be posted publicly Google does not sell usersrsquo personal information to advertisers or anyone else For more information about the Google privacy policy please visit wwwgooglecompoliciesprivacy
Google Surveys is a member of the American Association of Public Opinion Researchrsquos (AAPOR) Transparency Initiative The initiative was founded in 2014 and establishes disclosure standards for organizations who run and publish surveys By joining the initiative Google Surveys pledges to uphold these disclosure standards when publishing results
We would like to acknowledge our fellow Google colleagues for providing insights and expertise that assisted the publication of this paper Amy Adams Harding Asfandyar Qureshi Carolin Jahn James Freeland James Pine Jon Fraser Kenneth Leftin Kevin Tudish Marisa Currie-Rose Michael Brandell Shaun Lysen and Yongwei Yang
In addition we would like to show our gratitude to Stacey Symonds and Fritz Holznagel for their guidance
Conclusion
Privacy
AAPORrsquos Transparency Initiative
Acknowledgements
Questions or comments surveys-supportgooglecom
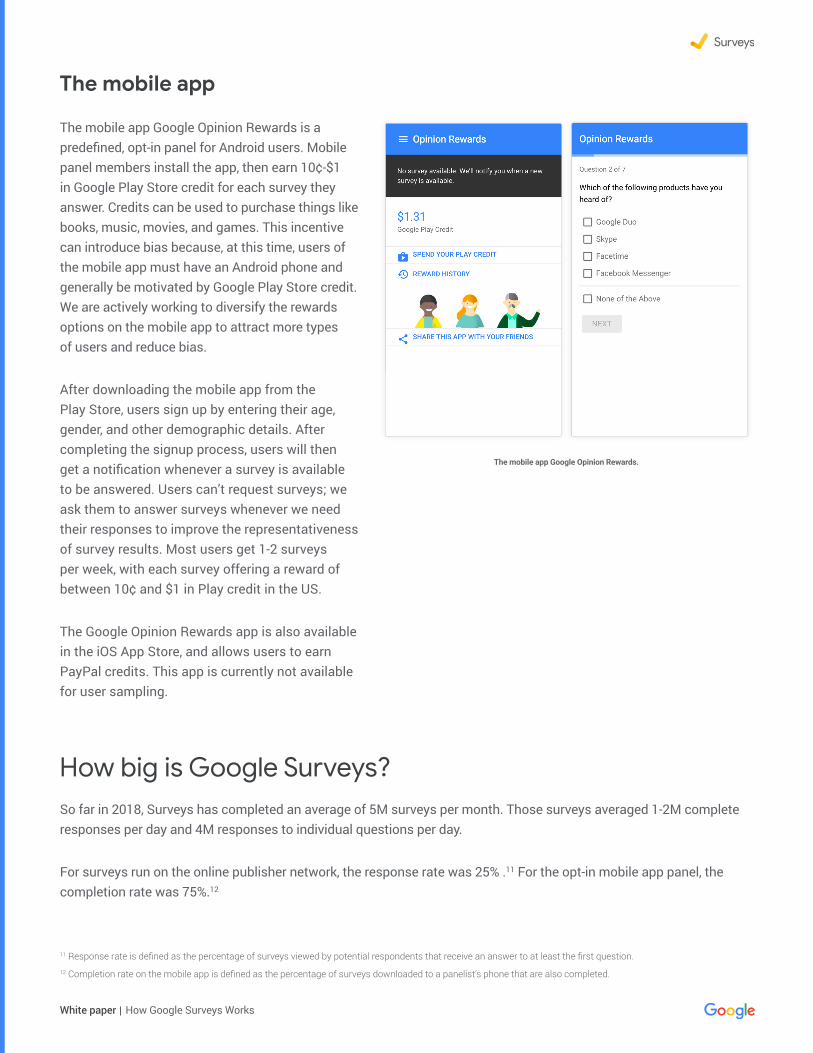
How Google Surveys WorksWhite paper
Surveys
The mobile app Google Opinion Rewards is a predefined opt-in panel for Android users Mobile panel members install the app then earn 10cent-$1 in Google Play Store credit for each survey they answer Credits can be used to purchase things like books music movies and games This incentive can introduce bias because at this time users of the mobile app must have an Android phone and generally be motivated by Google Play Store credit We are actively working to diversify the rewards options on the mobile app to attract more types of users and reduce bias
After downloading the mobile app from the Play Store users sign up by entering their age gender and other demographic details After completing the signup process users will then get a notification whenever a survey is available to be answered Users canrsquot request surveys we ask them to answer surveys whenever we need their responses to improve the representativeness of survey results Most users get 1-2 surveys per week with each survey offering a reward of between 10cent and $1 in Play credit in the US
The Google Opinion Rewards app is also available in the iOS App Store and allows users to earn PayPal credits This app is currently not available for user sampling
So far in 2018 Surveys has completed an average of 5M surveys per month Those surveys averaged 1-2M complete responses per day and 4M responses to individual questions per day
For surveys run on the online publisher network the response rate was 25 11 For the opt-in mobile app panel the completion rate was 7512
11 Response rate is defined as the percentage of surveys viewed by potential respondents that receive an answer to at least the first question 12 Completion rate on the mobile app is defined as the percentage of surveys downloaded to a panelistrsquos phone that are also completed
The mobile app
How big is Google Surveys
The mobile app Google Opinion Rewards
How Google Surveys WorksWhite paper
Surveys
Google Surveys are created with three steps Define the audience design the questions and confirm pricing After a survey begins collecting responses the results will be available to view
Researchers create Surveys with an online editor First the researcher names the survey and defines the audience
Researchers begin by choosing a panel the general population on the publisher network or the mobile app In both panels surveys can be sent to specific demographic groups based on gender age and geography (country region13 or state)
Surveys can be run in ten countries on the publisher network and the mobile app Australia Brazil Canada Germany Italy14 Japan Mexico the Netherlands14 the United Kingdom and the United States The publisher network is additionally supported in over 40 countries14 Surveys on the mobile app can also be fielded to users who speak specific languages
How to run a Google Survey
Define the audience
The audience selection step in the editor
13 For the four US regions see enwikipediaorgwikiList_of_regions_of_the_United_StatesOfficial_regions_of_the_United_States 14 Only available with Convenience Sampling (described in section lsquoSampling biasrsquo)
How Google Surveys WorksWhite paper
Surveys
Surveys can have up to 10 questions Up to four of the questions can be screening questions if respondents
screen out at any point their survey ends there and they
see no more questions
Several question types are available single select
(radio button) multiple select (checkboxes) rating questions (Likert scale) image questions and open-ended text questions
Design the questions
Each respondent will see the questions in the order the researcher specifies Answers for each question can be shown in a fixed order randomized or randomly reversed which is useful for answers that have a logical order as in the example above Question text can be formatted with bold and _italics_ Questions are limited to 175 characters and answers to 44 characters in English-speaking countries these character limits differ by country
Google Surveys does not support branching where the answer to one question determines which question the respondent sees next However we support answer piping where the answer to one question can be quoted in a later questionrsquos text or answers To pipe an answer to Question 1 into the text of a follow-up question or answer use ldquoQ1_ANSWERrdquo without the quotations
To include a screening question as in the example above click ldquoScreen with this questionrdquo Then select the answers to ldquoscreen inrdquo respondents to continue on to the next question
The question design step in the editor
How Google Surveys WorksWhite paper
Surveys
Confirm price
The confirm pricing step for a survey with no screening questions
If a survey has screening questions it may cost significantly more than $3 per complete response depending on how difficult it is to reach the surveyrsquos audience The price will not be shown automatically but instead will
be determined by a trial run of the survey
The pricing process is different for surveys with screening questions versus those without If a survey has no screening questions the price will vary from 10cent to $3 per complete response depending on the number of questions and user criteria of the survey The editor will automatically display the pricing for the survey The researcher will then confirm the surveyrsquos details choose a desired number of responses (from 50 to 50000) and set the frequency
How Google Surveys WorksWhite paper
Surveys
The trial run will estimate the surveyrsquos incidence rate that is the number of respondents who choose a screen-in answer to the last screening question in the survey The lower the incidence rate the more the survey will cost For example if the incidence rate is 10 and the researcher buys 1000 complete responses wersquoll need to collect at least 10000 responses to the screening question to reach 1000 complete responses
The trial run will run for up to 24 hours at which point the researcher will get an email quoting the price for the survey A survey must have a 5 incidence rate to run if the incidence is less than 5 the researcher will be asked to redesign the survey Once this phase is complete the researcher can then purchase the survey
After a researcher creates and purchases a survey a Google Surveys team member will inspect the survey to make sure it complies with our policies then email the researcher if edits are needed A common review note is to ask researchers to change ldquoYesrdquo or ldquoNordquo binary questions to add an additional option like ldquoNo Answerrdquo or ldquoPrefer not to sayrdquo This kind of opt-out option increases the chance that users who may not fall into ldquoYesrdquo or ldquoNordquo will respond accurately Once a survey passes review and begins running it can no longer be changed
Surveys are fielded for a minimum of two days to avoid bias from the time of day or a single day Surveys with screening questions or stricter user criteria may take longer due to the rarity of the subpopulation being measured
The trial run step for a survey with screening questions
How Google Surveys WorksWhite paper
Surveys
View results
After a survey has collected an initial portion of its responses the researcher will get an email inviting them to view the results in an online report These early results will have low sample sizes and large error bars as more results are collected the sample size will increase and the error bar sizes will decrease The results will continue to update until the survey is complete
The survey results overview page
Survey report pages offer more than just top-level results They include comparisons (crosstabs) filters by demographic groups controls like raw (unweighted) instead of weighted results and options to share
or download the respondent-level data to a spreadsheet
How Google Surveys WorksWhite paper
Surveys
The question results page showing crosstabs and demographic filters
A major challenge for online non-probability surveys is mitigating sampling bias that is ensuring that samples represent the general population of internet users Within our panels we offer representative sampling for some countries and convenience sampling for others (described below)
For representative sampling we evaluate the representativeness of a survey by balancing its sample demographics to match the demographics of the specified population adult (18 or older) internet users We match based on three demographic dimensions age gender and geography In the US we use estimates for the national internet population from the US Census Bureaursquos 2015 Current Population Survey (CPS) Computer and Internet Use Supplement15 In other countries with representative sampling we rely on a combination of government data and internal Google data sources
Convenience sampling means that respondents may be of any age gender or from any geographic region within a country
Sampling bias
15 wwwcensusgovprograms-surveyscpstechnical-documentationcomplete2015html
How Google Surveys WorksWhite paper
Surveys
Collecting representative samples
For countries with representative sampling Google Surveys uses a two-step process to ensure each surveyrsquos representativeness First we use stratified sampling to dynamically engage respondents with the goal of matching the demographics of the target internet population Next we apply post-stratification weighting to more closely match those same demographics of the target internet population
While a survey is collecting responses Surveys does its best to match the respondentsrsquo demographics to the internet populationrsquos demographics with the following steps
Once the survey has collected all responses the ideal actual distribution would match the target populationrsquos demographic distribution In practice however actual distributions usually differ slightly from a target populationrsquos demographic distribution This discrepancy is due to the nature of the dynamic targeting described above the availability of respondents on publisher sites at any given time and the tradeoff between finishing a survey in a reasonable amount of time and perfectly matching the distribution
A table at the bottom of each survey report shows the sampling bias how the surveyrsquos sample differs from the target internet population for gender age and geography
Calculate the target percentage of the joint distributions that is the percentage of each three-dimensional demographic group such as 18ndash24-year-old males in Idaho
Select respondents randomly within each demographic group (age x gender x state) to answer the survey We donrsquot balance responses using any additional paradata such as time of day operating system or answers to other survey questions
As responses are collected update the actual current percentage of respondents of each group in real time
If the actual and target percentages differ at any time dynamically adjust the criteria of the survey to compensate for under- or over-sampling For example if a survey has enough responses from 18ndash24-year-old males in Idaho but needs more representation from 35ndash44-year-old females in Nebraska we will show fewer surveys to 18ndash24-year-old males in Idaho and more surveys to 35ndash44-year-old females in Nebraska
1
3
2
4
How Google Surveys WorksWhite paper
Surveys
The bias table from the question results page
The Root Mean Squared Error (RMSE) score describes the square root of the mean of the squared errors across all values (eg male and female) within each dimension (gender age and geography) The larger the RMSE score the less representative the sample is of the specified population
One note about geographic representativeness Google Surveys guarantees a representative distribution of regions or states within a country whenever possible However Surveys does not guarantee geographic representativeness within a region or state mdash such as a representative balance between cities and rural areas mdash as part of its dynamic fielding and weighting schemes The publisher network does however have extensive coverage within states through its 1500+ publisher sites in which local newspapers are strongly represented
We also balance responses across different publishers by preventing any one publisher from dominating a surveyrsquos results This reduces bias from specific publishers that may focus on local topics national issues or particular subject matters This approach also limits the possibility of repeatedly sampling the same respondents for multiple surveys across our system Our system also ensures that the same respondent doesnrsquot have the opportunity to answer the same survey more than once These frequency capping measures help diversify our panel and mitigate bias towards frequent internet users
How Google Surveys WorksWhite paper
Surveys
To correct for sampling bias after the survey is run we apply weights to upweight underrepresented groups and downweight overrepresented groups This calculation is coarser than the calculation for dynamic fielding instead of matching the three-dimensional joint distributions we match each single dimension mdash the marginal distributions mdash on their own We then calculate weights using an iterative process also known as raking to reduce bias across all three dimensions16
Herersquos how raking works First we exclude all respondents with unknown demographics for age gender or geography Then we calculate weights that will match the gender breakdown to the target demographic If the target distribution is 52 female and 48 male but the actual distribution is 50 female and 50 male then we apply a weight of 52 50 = 104 to all female responses and 48 50 = 096 to all male responses
After weighting respondents by the gender dimension on its own we do the same for the age dimension on its own and then the region dimension on its own Every time we get one dimension to perfectly match the target demographic the previous dimensions will no longer exactly match We use an iterative raking technique to do 10 rounds of calculations for all three dimensions on their own17 After 10 rounds the weights will approach convergence and all three dimensions will closely match their targets
The weights in each survey are calculated based on the first question We use the first question for weighting because thatrsquos the only question we can assume should match the target populationrsquos demographic distribution
For example if the first question is a screening question that asks ldquoWhat is your genderrdquo and only respondents who answer ldquomalerdquo screen through to the second question we wouldnrsquot want to match the second question to 52 female and 48 male it will always be 100 male
Even if the first question isnrsquot a screening question respondents may drop off throughout the survey in a way that is skewed towards one demographic group due to the design of the survey Thus we weight responses to follow-up questions by taking the first-question weights filtering them to only those who answered the follow-up question and renormalizing so that the sum of the weights equals the total number of responses to the follow-up question
Weighting
16 Google Surveys moved to a raking methodology in October 2016 The previous methodology is explained in the original whitepaper wwwgooglecominsightsconsumersurveysstaticconsumer_surveys_whitepaperpdf17 enwikipediaorgwikiIterative_proportional_fitting
How Google Surveys WorksWhite paper
Surveys
In the survey results the values displayed in the error bars represent the modeled margin of error This means that if we repeat this survey many times in the same way 95 of the time the resulting range of values would contain the true value
We follow the Pew Research Center in using the term ldquomodeled margin of errorrdquo to differentiate from the statistical term ldquomargin of errorrdquo which only applies to true probability-based samples18 Because Google Surveys collects online non-probability samples the margin of error calculation is based on assumptions about the Surveys sampling model and what would happen if we repeated the same sampling process many times
We use the Modified (or ad hoc) Wilson method to calculate the error bars which can be asymmetrical eg +18-16 The Wilson method works well for small sample sizes as well as extreme probabilities (close to 0 or 100)19 We follow the Modified Wilson calculation using effective sample size as shown in Applied Survey Data Analysis20 The calculation is the same as the Wilson method but uses n = p(1 - p) var(p) in place of n21
Error bars
A question report page showing error bars and the modeled margin of error
In this example the modeled margin of error for Basketball is +18-16 The range of values is 124 to 158 ie 14 adjusted by the modeled
margin of error
Four factors influence and can reduce the size of the modeled
margin of error
1 Larger sample sizes
2 Percentages closer to the extremes of 0 or 100
3 Lower confidence levels (we use a 95 confidence level)
4 Lower variability of weights
18 wwwpewresearchorg20180126variability-of-survey-estimates19 Dean Natalie and Pagano Marcello 2015 ldquoEvaluating Confidence Interval Methods for Binomial Proportions in Clustered Surveysrdquo Journal of Survey Statistics and Methodology 3 (4) 484-503 doiorg101093jssamsmv02420 Heeringa Steven G West Brady T and Berglund Patricia A 2017 Applied Survey Data Analysis Second Edition 16521 enwikipediaorgwikiBinomial_proportion_confidence_intervalWilson_score_interval
Surveys may be subject to other sources of biases and errors including mdash but not limited to mdash sampling and nonresponse as discussed in more detail below
How Google Surveys WorksWhite paper
Surveys
The way we determine respondent demographics differs by survey panel
The mobile app is the simpler of the two panels We ask users to self-report their age gender and zipcode when they sign up to use the app We periodically ask these questions again to refresh the panelistsrsquo demographics in case they have changed
The publisher network uses inferred demographics which means that we donrsquot explicitly ask the panelists for their demographics We do this to minimize the number of questions in a survey which offers a better respondent experience and encourages higher response rates Any researcher who doesnrsquot want to rely on inferred demographics can explicitly add demographic questions to their surveys However our dynamic fielding and weighting process to match ground-truth data will still be based on inferred demographics
Like many ads on the web Google Surveys infers the age and gender of anonymous respondents based on browsing behavior and geography based on IP addresses Users can opt out of inferred demographics in the Ads Settings which applies across Google ads services the 2M+ sites and apps that partner with Google to show ads and Google Surveys In the case of Surveys opting out means that usersrsquo demographics will show as unknown and their responses will be excluded from weighted results For all users unless otherwise stated responses are anonymous and collected in aggregate
How we know age gender and region
In addition to sampling bias Google Surveys monitors and mitigates other kinds of bias
Response non-response and modal bias
Response bias is the bias from inattentive or untruthful answers to questions
The publisher network and mobile app have different kinds of inattentive or untruthful responses Respondents on the publisher network are intercepted while trying to view content online so they do not necessarily want to answer a survey and may just want to see that content The mobile app has the opposite problem where users want to answer as many surveys as possible because they voluntarily opted into the mobile panel out of a desire to answer surveys and earn rewards
Another source of low-quality responses from both the publisher network and the mobile app is open-ended text questions Respondents may respond with gibberish profanity or something like ldquoI hate surveysrdquo These types of answers are removed from the surveyrsquos results using common natural language processing libraries employed across Google
Response bias
How Google Surveys WorksWhite paper
Surveys
Google Surveys tracks investigates and removes multiple kinds of low-quality responses and respondents If low-quality responses are dropped from a survey the survey will remain in the field to collect more responses to make up for the sample that is now missing If chronically inattentive or untruthful respondents are detected they may be prevented from getting any more surveys in the future
Potential responses to a survey can fall into several categories non-response screen-out response partial response or complete response These categories are illustrated below
Non-response bias occurs when a group of people in the sample choose not to respond to the survey in a systematic way which can cause the omission of that grouprsquos opinions Non-responses can come from people who donrsquot like answering surveys in general or are alienated by the first question in some way Unfortunately it can be difficult to ask non-respondents why they chose not to respond because they are unlikely to respond
Respondents may also choose to stop answering questions midway through a survey These partial responses can introduce dropoff bias perhaps an overly-specific question turns off respondents or respondents could drop off towards the end of a long survey For example if a survey is about an extremely specific topic like equestrian equipment then people who are uninterested or uninformed about equestrian equipment may stop answering partway through
Non-response and dropoff bias
QUESTION 2 CATEGORYPOTENTIALRESPONDENT
Person 2
Person 3
Person 4
Person 5
Do you have afavorite letter
ldquoNordquo
ldquoYesrdquo
ldquoYesrdquo
ldquoYesrdquo
ldquoBrdquo
ldquoPrdquo ldquoZrdquo
What is yourfavorite letter
What is your secondfavorite letter
Non-response
Screen-outResponse
PartialResponse
PartialResponse
CompleteResponse
QUESTION 1 QUESTION 3
Person 1 skips the survey
screens out
drops out
drops out
The different categories of potential responses
How Google Surveys WorksWhite paper
Surveys
In a surveyrsquos report page we display the question response dropoff pattern
Researchers may want to investigate if therersquos a systemic reason for potential respondents to not respond to part or all of a survey The raw data download lists the status of each response Screen-out Partial or
Complete along with the answers to each question which allows more in-depth analysis
The question response dropoff chart
Modal bias or mode effects occur when the way in which a question is asked affects the respondentsrsquo answers in a systematic way because of how the survey is administered
All methods of conducting surveys are susceptible to modal bias In face-to-face or live phone interviews the fact that respondents are talking to live interviewers can influence how they answer questions they may want to be more agreeable in person This phenomenon is called the social desirability bias
Modal bias and survey design
How Google Surveys WorksWhite paper
Surveys
Different survey modes can also allow for different question structures In a live interview when a respondent declines to answer a question the interviewer can follow a script with follow-up questions an online platform like Google Surveys canrsquot do this For example consider an election poll that asks respondents to choose between three candidates Over the phone a live interviewer could list the three candidates and no other answer options If the respondent declines to answer the question the live interviewer can then ask a follow-up question to see if the respondent prefers a candidate not listed doesnrsquot want to answer or is undecided
This structure cannot be replicated online If only three candidate options are presented to a potential online respondent the only way to proceed is to choose one of those three candidates or drop out of the survey We could attempt to replicate the live interview structure online by adding a fourth option such as ldquoOtherrdquo or ldquoPrefer not to sayrdquo However respondents may be more likely to choose one of these alternative options when they are explicitly offered as an ldquoeasy outrdquo versus having to refuse to answer the question with a live interviewer
One way to partially mitigate this mode effect is through survey design Instead of adding ldquoOtherrdquo or ldquoPrefer not to sayrdquo options an open-ended text option can be used instead as in the Google Surveys 2016 US Election Poll22
This makes it more difficult for users to select the ldquoOtherrdquo option because they have to formulate and type out an alternative answer
Another mode effect to consider is that different question types may yield different results Results may differ if a question is formulated as a multiple-select (checkbox) question with five options versus separating that question into five individual single-select (radio button) questions A respondent may not want to check all the boxes or remember to check all the boxes whereas putting each option in a single question will encourage them to slow down and focus
22 See the Election Poll survey design at googlOA33DH
Multi-select questions can help reduce the number of questions in a survey but itrsquos important to note the effect that multiple-select questions may have on the results This is even more important when comparing the results of multiple-select questions to the results from other survey modes like live
interviews that often use single-select instead of multiple-select questions
How Google Surveys WorksWhite paper
Surveys
Katrina Sostek and Brett Slatkin are software engineers at Google The whitepaper was originally published in May 2017 All information is accurate as of June 2018 copy 2018 Google LLC All rights reserved Google and the Google logo are trademarks of Google Inc All other company and product names may be trademarks of the respective companies with which they are associated
Since launching in 2012 Google Surveys has moved from 2-question surveys to 10-question surveys expanded the publisher network and built the mobile app panel Surveys offers several advantages compared to traditional phone surveys faster cheaper results with larger sample sizes drawn from an online panel of tens of millions of potential respondents
Like all survey modes Surveys continues to face challenges from different kinds of biases mdash sampling response non-response dropoff modal mdash and we continue to improve our approaches to mitigate these biases Our work to improve our survey capabilities and accuracy is never done and wersquoll continue to refine our methodology as the landscape of respondents and technology continues to change
Privacy is very important to Google Users always have the option to pass on a survey and have the ability to opt out of the DoubleClick cookie completely Unless otherwise stated all responses are anonymous and collected in aggregate Certain surveys such as local surveys may be used to get feedback about a location recently visited and request permission for these responses to be posted publicly Google does not sell usersrsquo personal information to advertisers or anyone else For more information about the Google privacy policy please visit wwwgooglecompoliciesprivacy
Google Surveys is a member of the American Association of Public Opinion Researchrsquos (AAPOR) Transparency Initiative The initiative was founded in 2014 and establishes disclosure standards for organizations who run and publish surveys By joining the initiative Google Surveys pledges to uphold these disclosure standards when publishing results
We would like to acknowledge our fellow Google colleagues for providing insights and expertise that assisted the publication of this paper Amy Adams Harding Asfandyar Qureshi Carolin Jahn James Freeland James Pine Jon Fraser Kenneth Leftin Kevin Tudish Marisa Currie-Rose Michael Brandell Shaun Lysen and Yongwei Yang
In addition we would like to show our gratitude to Stacey Symonds and Fritz Holznagel for their guidance
Conclusion
Privacy
AAPORrsquos Transparency Initiative
Acknowledgements
Questions or comments surveys-supportgooglecom
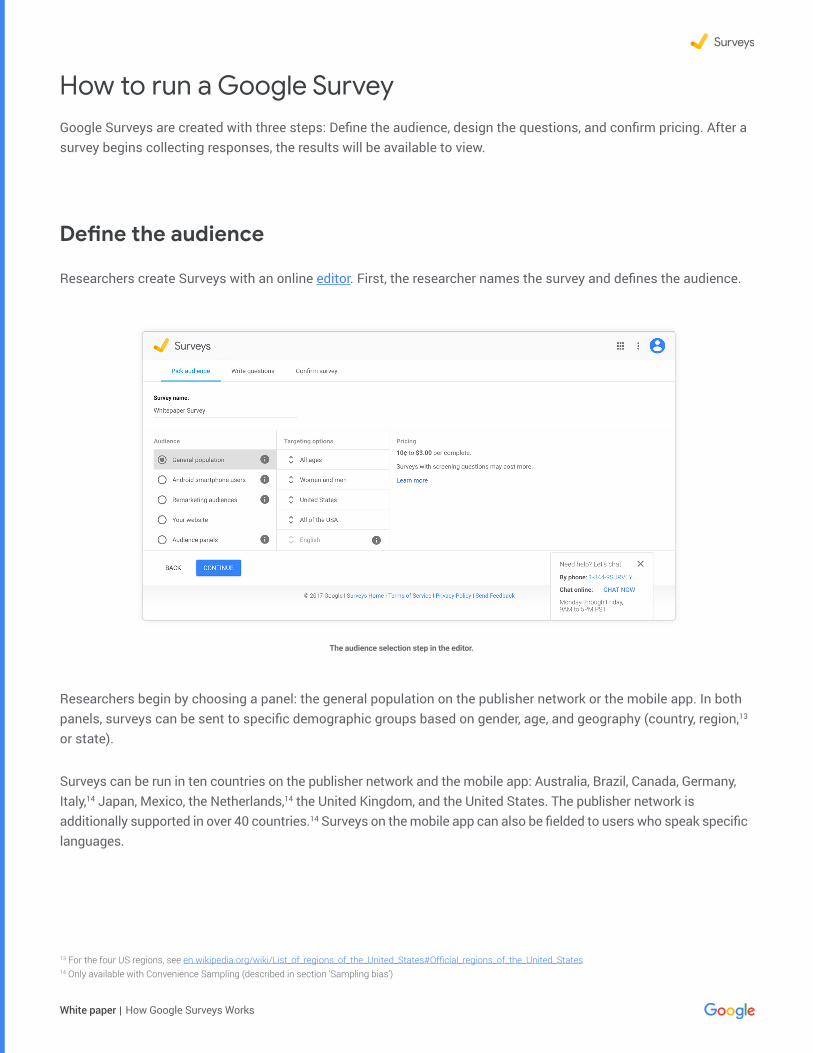
How Google Surveys WorksWhite paper
Surveys
Google Surveys are created with three steps Define the audience design the questions and confirm pricing After a survey begins collecting responses the results will be available to view
Researchers create Surveys with an online editor First the researcher names the survey and defines the audience
Researchers begin by choosing a panel the general population on the publisher network or the mobile app In both panels surveys can be sent to specific demographic groups based on gender age and geography (country region13 or state)
Surveys can be run in ten countries on the publisher network and the mobile app Australia Brazil Canada Germany Italy14 Japan Mexico the Netherlands14 the United Kingdom and the United States The publisher network is additionally supported in over 40 countries14 Surveys on the mobile app can also be fielded to users who speak specific languages
How to run a Google Survey
Define the audience
The audience selection step in the editor
13 For the four US regions see enwikipediaorgwikiList_of_regions_of_the_United_StatesOfficial_regions_of_the_United_States 14 Only available with Convenience Sampling (described in section lsquoSampling biasrsquo)
How Google Surveys WorksWhite paper
Surveys
Surveys can have up to 10 questions Up to four of the questions can be screening questions if respondents
screen out at any point their survey ends there and they
see no more questions
Several question types are available single select
(radio button) multiple select (checkboxes) rating questions (Likert scale) image questions and open-ended text questions
Design the questions
Each respondent will see the questions in the order the researcher specifies Answers for each question can be shown in a fixed order randomized or randomly reversed which is useful for answers that have a logical order as in the example above Question text can be formatted with bold and _italics_ Questions are limited to 175 characters and answers to 44 characters in English-speaking countries these character limits differ by country
Google Surveys does not support branching where the answer to one question determines which question the respondent sees next However we support answer piping where the answer to one question can be quoted in a later questionrsquos text or answers To pipe an answer to Question 1 into the text of a follow-up question or answer use ldquoQ1_ANSWERrdquo without the quotations
To include a screening question as in the example above click ldquoScreen with this questionrdquo Then select the answers to ldquoscreen inrdquo respondents to continue on to the next question
The question design step in the editor
How Google Surveys WorksWhite paper
Surveys
Confirm price
The confirm pricing step for a survey with no screening questions
If a survey has screening questions it may cost significantly more than $3 per complete response depending on how difficult it is to reach the surveyrsquos audience The price will not be shown automatically but instead will
be determined by a trial run of the survey
The pricing process is different for surveys with screening questions versus those without If a survey has no screening questions the price will vary from 10cent to $3 per complete response depending on the number of questions and user criteria of the survey The editor will automatically display the pricing for the survey The researcher will then confirm the surveyrsquos details choose a desired number of responses (from 50 to 50000) and set the frequency
How Google Surveys WorksWhite paper
Surveys
The trial run will estimate the surveyrsquos incidence rate that is the number of respondents who choose a screen-in answer to the last screening question in the survey The lower the incidence rate the more the survey will cost For example if the incidence rate is 10 and the researcher buys 1000 complete responses wersquoll need to collect at least 10000 responses to the screening question to reach 1000 complete responses
The trial run will run for up to 24 hours at which point the researcher will get an email quoting the price for the survey A survey must have a 5 incidence rate to run if the incidence is less than 5 the researcher will be asked to redesign the survey Once this phase is complete the researcher can then purchase the survey
After a researcher creates and purchases a survey a Google Surveys team member will inspect the survey to make sure it complies with our policies then email the researcher if edits are needed A common review note is to ask researchers to change ldquoYesrdquo or ldquoNordquo binary questions to add an additional option like ldquoNo Answerrdquo or ldquoPrefer not to sayrdquo This kind of opt-out option increases the chance that users who may not fall into ldquoYesrdquo or ldquoNordquo will respond accurately Once a survey passes review and begins running it can no longer be changed
Surveys are fielded for a minimum of two days to avoid bias from the time of day or a single day Surveys with screening questions or stricter user criteria may take longer due to the rarity of the subpopulation being measured
The trial run step for a survey with screening questions
How Google Surveys WorksWhite paper
Surveys
View results
After a survey has collected an initial portion of its responses the researcher will get an email inviting them to view the results in an online report These early results will have low sample sizes and large error bars as more results are collected the sample size will increase and the error bar sizes will decrease The results will continue to update until the survey is complete
The survey results overview page
Survey report pages offer more than just top-level results They include comparisons (crosstabs) filters by demographic groups controls like raw (unweighted) instead of weighted results and options to share
or download the respondent-level data to a spreadsheet
How Google Surveys WorksWhite paper
Surveys
The question results page showing crosstabs and demographic filters
A major challenge for online non-probability surveys is mitigating sampling bias that is ensuring that samples represent the general population of internet users Within our panels we offer representative sampling for some countries and convenience sampling for others (described below)
For representative sampling we evaluate the representativeness of a survey by balancing its sample demographics to match the demographics of the specified population adult (18 or older) internet users We match based on three demographic dimensions age gender and geography In the US we use estimates for the national internet population from the US Census Bureaursquos 2015 Current Population Survey (CPS) Computer and Internet Use Supplement15 In other countries with representative sampling we rely on a combination of government data and internal Google data sources
Convenience sampling means that respondents may be of any age gender or from any geographic region within a country
Sampling bias
15 wwwcensusgovprograms-surveyscpstechnical-documentationcomplete2015html
How Google Surveys WorksWhite paper
Surveys
Collecting representative samples
For countries with representative sampling Google Surveys uses a two-step process to ensure each surveyrsquos representativeness First we use stratified sampling to dynamically engage respondents with the goal of matching the demographics of the target internet population Next we apply post-stratification weighting to more closely match those same demographics of the target internet population
While a survey is collecting responses Surveys does its best to match the respondentsrsquo demographics to the internet populationrsquos demographics with the following steps
Once the survey has collected all responses the ideal actual distribution would match the target populationrsquos demographic distribution In practice however actual distributions usually differ slightly from a target populationrsquos demographic distribution This discrepancy is due to the nature of the dynamic targeting described above the availability of respondents on publisher sites at any given time and the tradeoff between finishing a survey in a reasonable amount of time and perfectly matching the distribution
A table at the bottom of each survey report shows the sampling bias how the surveyrsquos sample differs from the target internet population for gender age and geography
Calculate the target percentage of the joint distributions that is the percentage of each three-dimensional demographic group such as 18ndash24-year-old males in Idaho
Select respondents randomly within each demographic group (age x gender x state) to answer the survey We donrsquot balance responses using any additional paradata such as time of day operating system or answers to other survey questions
As responses are collected update the actual current percentage of respondents of each group in real time
If the actual and target percentages differ at any time dynamically adjust the criteria of the survey to compensate for under- or over-sampling For example if a survey has enough responses from 18ndash24-year-old males in Idaho but needs more representation from 35ndash44-year-old females in Nebraska we will show fewer surveys to 18ndash24-year-old males in Idaho and more surveys to 35ndash44-year-old females in Nebraska
1
3
2
4
How Google Surveys WorksWhite paper
Surveys
The bias table from the question results page
The Root Mean Squared Error (RMSE) score describes the square root of the mean of the squared errors across all values (eg male and female) within each dimension (gender age and geography) The larger the RMSE score the less representative the sample is of the specified population
One note about geographic representativeness Google Surveys guarantees a representative distribution of regions or states within a country whenever possible However Surveys does not guarantee geographic representativeness within a region or state mdash such as a representative balance between cities and rural areas mdash as part of its dynamic fielding and weighting schemes The publisher network does however have extensive coverage within states through its 1500+ publisher sites in which local newspapers are strongly represented
We also balance responses across different publishers by preventing any one publisher from dominating a surveyrsquos results This reduces bias from specific publishers that may focus on local topics national issues or particular subject matters This approach also limits the possibility of repeatedly sampling the same respondents for multiple surveys across our system Our system also ensures that the same respondent doesnrsquot have the opportunity to answer the same survey more than once These frequency capping measures help diversify our panel and mitigate bias towards frequent internet users
How Google Surveys WorksWhite paper
Surveys
To correct for sampling bias after the survey is run we apply weights to upweight underrepresented groups and downweight overrepresented groups This calculation is coarser than the calculation for dynamic fielding instead of matching the three-dimensional joint distributions we match each single dimension mdash the marginal distributions mdash on their own We then calculate weights using an iterative process also known as raking to reduce bias across all three dimensions16
Herersquos how raking works First we exclude all respondents with unknown demographics for age gender or geography Then we calculate weights that will match the gender breakdown to the target demographic If the target distribution is 52 female and 48 male but the actual distribution is 50 female and 50 male then we apply a weight of 52 50 = 104 to all female responses and 48 50 = 096 to all male responses
After weighting respondents by the gender dimension on its own we do the same for the age dimension on its own and then the region dimension on its own Every time we get one dimension to perfectly match the target demographic the previous dimensions will no longer exactly match We use an iterative raking technique to do 10 rounds of calculations for all three dimensions on their own17 After 10 rounds the weights will approach convergence and all three dimensions will closely match their targets
The weights in each survey are calculated based on the first question We use the first question for weighting because thatrsquos the only question we can assume should match the target populationrsquos demographic distribution
For example if the first question is a screening question that asks ldquoWhat is your genderrdquo and only respondents who answer ldquomalerdquo screen through to the second question we wouldnrsquot want to match the second question to 52 female and 48 male it will always be 100 male
Even if the first question isnrsquot a screening question respondents may drop off throughout the survey in a way that is skewed towards one demographic group due to the design of the survey Thus we weight responses to follow-up questions by taking the first-question weights filtering them to only those who answered the follow-up question and renormalizing so that the sum of the weights equals the total number of responses to the follow-up question
Weighting
16 Google Surveys moved to a raking methodology in October 2016 The previous methodology is explained in the original whitepaper wwwgooglecominsightsconsumersurveysstaticconsumer_surveys_whitepaperpdf17 enwikipediaorgwikiIterative_proportional_fitting
How Google Surveys WorksWhite paper
Surveys
In the survey results the values displayed in the error bars represent the modeled margin of error This means that if we repeat this survey many times in the same way 95 of the time the resulting range of values would contain the true value
We follow the Pew Research Center in using the term ldquomodeled margin of errorrdquo to differentiate from the statistical term ldquomargin of errorrdquo which only applies to true probability-based samples18 Because Google Surveys collects online non-probability samples the margin of error calculation is based on assumptions about the Surveys sampling model and what would happen if we repeated the same sampling process many times
We use the Modified (or ad hoc) Wilson method to calculate the error bars which can be asymmetrical eg +18-16 The Wilson method works well for small sample sizes as well as extreme probabilities (close to 0 or 100)19 We follow the Modified Wilson calculation using effective sample size as shown in Applied Survey Data Analysis20 The calculation is the same as the Wilson method but uses n = p(1 - p) var(p) in place of n21
Error bars
A question report page showing error bars and the modeled margin of error
In this example the modeled margin of error for Basketball is +18-16 The range of values is 124 to 158 ie 14 adjusted by the modeled
margin of error
Four factors influence and can reduce the size of the modeled
margin of error
1 Larger sample sizes
2 Percentages closer to the extremes of 0 or 100
3 Lower confidence levels (we use a 95 confidence level)
4 Lower variability of weights
18 wwwpewresearchorg20180126variability-of-survey-estimates19 Dean Natalie and Pagano Marcello 2015 ldquoEvaluating Confidence Interval Methods for Binomial Proportions in Clustered Surveysrdquo Journal of Survey Statistics and Methodology 3 (4) 484-503 doiorg101093jssamsmv02420 Heeringa Steven G West Brady T and Berglund Patricia A 2017 Applied Survey Data Analysis Second Edition 16521 enwikipediaorgwikiBinomial_proportion_confidence_intervalWilson_score_interval
Surveys may be subject to other sources of biases and errors including mdash but not limited to mdash sampling and nonresponse as discussed in more detail below
How Google Surveys WorksWhite paper
Surveys
The way we determine respondent demographics differs by survey panel
The mobile app is the simpler of the two panels We ask users to self-report their age gender and zipcode when they sign up to use the app We periodically ask these questions again to refresh the panelistsrsquo demographics in case they have changed
The publisher network uses inferred demographics which means that we donrsquot explicitly ask the panelists for their demographics We do this to minimize the number of questions in a survey which offers a better respondent experience and encourages higher response rates Any researcher who doesnrsquot want to rely on inferred demographics can explicitly add demographic questions to their surveys However our dynamic fielding and weighting process to match ground-truth data will still be based on inferred demographics
Like many ads on the web Google Surveys infers the age and gender of anonymous respondents based on browsing behavior and geography based on IP addresses Users can opt out of inferred demographics in the Ads Settings which applies across Google ads services the 2M+ sites and apps that partner with Google to show ads and Google Surveys In the case of Surveys opting out means that usersrsquo demographics will show as unknown and their responses will be excluded from weighted results For all users unless otherwise stated responses are anonymous and collected in aggregate
How we know age gender and region
In addition to sampling bias Google Surveys monitors and mitigates other kinds of bias
Response non-response and modal bias
Response bias is the bias from inattentive or untruthful answers to questions
The publisher network and mobile app have different kinds of inattentive or untruthful responses Respondents on the publisher network are intercepted while trying to view content online so they do not necessarily want to answer a survey and may just want to see that content The mobile app has the opposite problem where users want to answer as many surveys as possible because they voluntarily opted into the mobile panel out of a desire to answer surveys and earn rewards
Another source of low-quality responses from both the publisher network and the mobile app is open-ended text questions Respondents may respond with gibberish profanity or something like ldquoI hate surveysrdquo These types of answers are removed from the surveyrsquos results using common natural language processing libraries employed across Google
Response bias
How Google Surveys WorksWhite paper
Surveys
Google Surveys tracks investigates and removes multiple kinds of low-quality responses and respondents If low-quality responses are dropped from a survey the survey will remain in the field to collect more responses to make up for the sample that is now missing If chronically inattentive or untruthful respondents are detected they may be prevented from getting any more surveys in the future
Potential responses to a survey can fall into several categories non-response screen-out response partial response or complete response These categories are illustrated below
Non-response bias occurs when a group of people in the sample choose not to respond to the survey in a systematic way which can cause the omission of that grouprsquos opinions Non-responses can come from people who donrsquot like answering surveys in general or are alienated by the first question in some way Unfortunately it can be difficult to ask non-respondents why they chose not to respond because they are unlikely to respond
Respondents may also choose to stop answering questions midway through a survey These partial responses can introduce dropoff bias perhaps an overly-specific question turns off respondents or respondents could drop off towards the end of a long survey For example if a survey is about an extremely specific topic like equestrian equipment then people who are uninterested or uninformed about equestrian equipment may stop answering partway through
Non-response and dropoff bias
QUESTION 2 CATEGORYPOTENTIALRESPONDENT
Person 2
Person 3
Person 4
Person 5
Do you have afavorite letter
ldquoNordquo
ldquoYesrdquo
ldquoYesrdquo
ldquoYesrdquo
ldquoBrdquo
ldquoPrdquo ldquoZrdquo
What is yourfavorite letter
What is your secondfavorite letter
Non-response
Screen-outResponse
PartialResponse
PartialResponse
CompleteResponse
QUESTION 1 QUESTION 3
Person 1 skips the survey
screens out
drops out
drops out
The different categories of potential responses
How Google Surveys WorksWhite paper
Surveys
In a surveyrsquos report page we display the question response dropoff pattern
Researchers may want to investigate if therersquos a systemic reason for potential respondents to not respond to part or all of a survey The raw data download lists the status of each response Screen-out Partial or
Complete along with the answers to each question which allows more in-depth analysis
The question response dropoff chart
Modal bias or mode effects occur when the way in which a question is asked affects the respondentsrsquo answers in a systematic way because of how the survey is administered
All methods of conducting surveys are susceptible to modal bias In face-to-face or live phone interviews the fact that respondents are talking to live interviewers can influence how they answer questions they may want to be more agreeable in person This phenomenon is called the social desirability bias
Modal bias and survey design
How Google Surveys WorksWhite paper
Surveys
Different survey modes can also allow for different question structures In a live interview when a respondent declines to answer a question the interviewer can follow a script with follow-up questions an online platform like Google Surveys canrsquot do this For example consider an election poll that asks respondents to choose between three candidates Over the phone a live interviewer could list the three candidates and no other answer options If the respondent declines to answer the question the live interviewer can then ask a follow-up question to see if the respondent prefers a candidate not listed doesnrsquot want to answer or is undecided
This structure cannot be replicated online If only three candidate options are presented to a potential online respondent the only way to proceed is to choose one of those three candidates or drop out of the survey We could attempt to replicate the live interview structure online by adding a fourth option such as ldquoOtherrdquo or ldquoPrefer not to sayrdquo However respondents may be more likely to choose one of these alternative options when they are explicitly offered as an ldquoeasy outrdquo versus having to refuse to answer the question with a live interviewer
One way to partially mitigate this mode effect is through survey design Instead of adding ldquoOtherrdquo or ldquoPrefer not to sayrdquo options an open-ended text option can be used instead as in the Google Surveys 2016 US Election Poll22
This makes it more difficult for users to select the ldquoOtherrdquo option because they have to formulate and type out an alternative answer
Another mode effect to consider is that different question types may yield different results Results may differ if a question is formulated as a multiple-select (checkbox) question with five options versus separating that question into five individual single-select (radio button) questions A respondent may not want to check all the boxes or remember to check all the boxes whereas putting each option in a single question will encourage them to slow down and focus
22 See the Election Poll survey design at googlOA33DH
Multi-select questions can help reduce the number of questions in a survey but itrsquos important to note the effect that multiple-select questions may have on the results This is even more important when comparing the results of multiple-select questions to the results from other survey modes like live
interviews that often use single-select instead of multiple-select questions
How Google Surveys WorksWhite paper
Surveys
Katrina Sostek and Brett Slatkin are software engineers at Google The whitepaper was originally published in May 2017 All information is accurate as of June 2018 copy 2018 Google LLC All rights reserved Google and the Google logo are trademarks of Google Inc All other company and product names may be trademarks of the respective companies with which they are associated
Since launching in 2012 Google Surveys has moved from 2-question surveys to 10-question surveys expanded the publisher network and built the mobile app panel Surveys offers several advantages compared to traditional phone surveys faster cheaper results with larger sample sizes drawn from an online panel of tens of millions of potential respondents
Like all survey modes Surveys continues to face challenges from different kinds of biases mdash sampling response non-response dropoff modal mdash and we continue to improve our approaches to mitigate these biases Our work to improve our survey capabilities and accuracy is never done and wersquoll continue to refine our methodology as the landscape of respondents and technology continues to change
Privacy is very important to Google Users always have the option to pass on a survey and have the ability to opt out of the DoubleClick cookie completely Unless otherwise stated all responses are anonymous and collected in aggregate Certain surveys such as local surveys may be used to get feedback about a location recently visited and request permission for these responses to be posted publicly Google does not sell usersrsquo personal information to advertisers or anyone else For more information about the Google privacy policy please visit wwwgooglecompoliciesprivacy
Google Surveys is a member of the American Association of Public Opinion Researchrsquos (AAPOR) Transparency Initiative The initiative was founded in 2014 and establishes disclosure standards for organizations who run and publish surveys By joining the initiative Google Surveys pledges to uphold these disclosure standards when publishing results
We would like to acknowledge our fellow Google colleagues for providing insights and expertise that assisted the publication of this paper Amy Adams Harding Asfandyar Qureshi Carolin Jahn James Freeland James Pine Jon Fraser Kenneth Leftin Kevin Tudish Marisa Currie-Rose Michael Brandell Shaun Lysen and Yongwei Yang
In addition we would like to show our gratitude to Stacey Symonds and Fritz Holznagel for their guidance
Conclusion
Privacy
AAPORrsquos Transparency Initiative
Acknowledgements
Questions or comments surveys-supportgooglecom
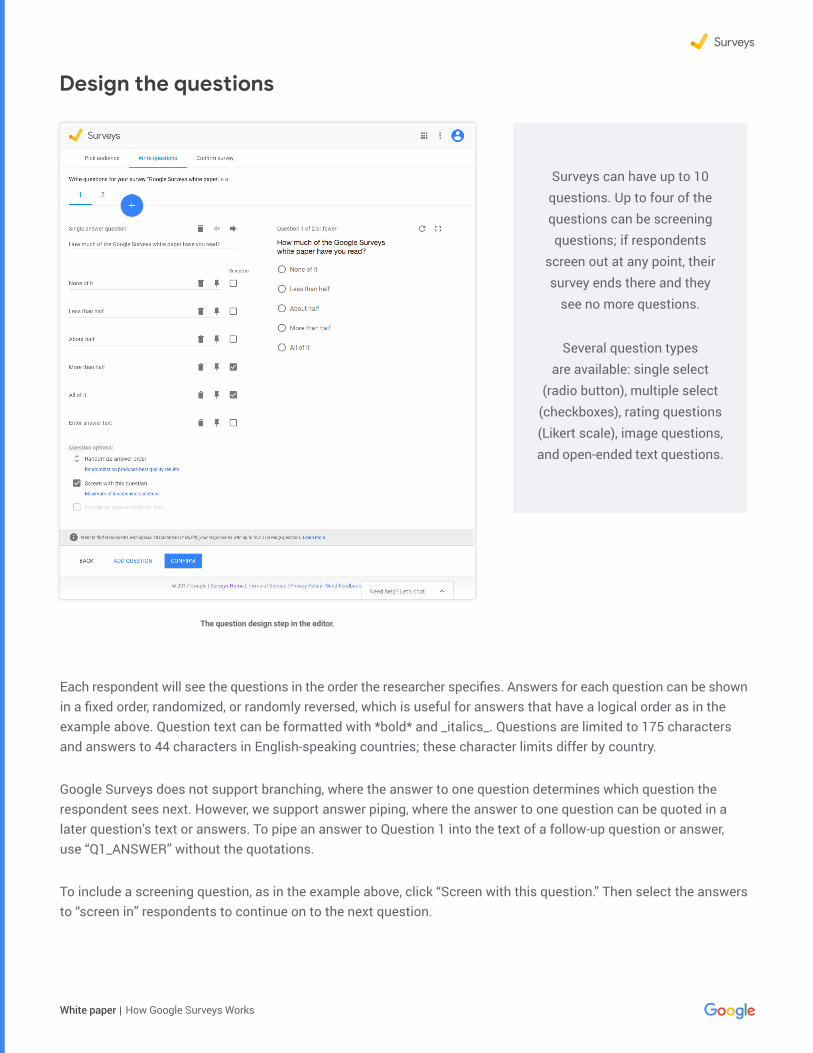
How Google Surveys WorksWhite paper
Surveys
Surveys can have up to 10 questions Up to four of the questions can be screening questions if respondents
screen out at any point their survey ends there and they
see no more questions
Several question types are available single select
(radio button) multiple select (checkboxes) rating questions (Likert scale) image questions and open-ended text questions
Design the questions
Each respondent will see the questions in the order the researcher specifies Answers for each question can be shown in a fixed order randomized or randomly reversed which is useful for answers that have a logical order as in the example above Question text can be formatted with bold and _italics_ Questions are limited to 175 characters and answers to 44 characters in English-speaking countries these character limits differ by country
Google Surveys does not support branching where the answer to one question determines which question the respondent sees next However we support answer piping where the answer to one question can be quoted in a later questionrsquos text or answers To pipe an answer to Question 1 into the text of a follow-up question or answer use ldquoQ1_ANSWERrdquo without the quotations
To include a screening question as in the example above click ldquoScreen with this questionrdquo Then select the answers to ldquoscreen inrdquo respondents to continue on to the next question
The question design step in the editor
How Google Surveys WorksWhite paper
Surveys
Confirm price
The confirm pricing step for a survey with no screening questions
If a survey has screening questions it may cost significantly more than $3 per complete response depending on how difficult it is to reach the surveyrsquos audience The price will not be shown automatically but instead will
be determined by a trial run of the survey
The pricing process is different for surveys with screening questions versus those without If a survey has no screening questions the price will vary from 10cent to $3 per complete response depending on the number of questions and user criteria of the survey The editor will automatically display the pricing for the survey The researcher will then confirm the surveyrsquos details choose a desired number of responses (from 50 to 50000) and set the frequency
How Google Surveys WorksWhite paper
Surveys
The trial run will estimate the surveyrsquos incidence rate that is the number of respondents who choose a screen-in answer to the last screening question in the survey The lower the incidence rate the more the survey will cost For example if the incidence rate is 10 and the researcher buys 1000 complete responses wersquoll need to collect at least 10000 responses to the screening question to reach 1000 complete responses
The trial run will run for up to 24 hours at which point the researcher will get an email quoting the price for the survey A survey must have a 5 incidence rate to run if the incidence is less than 5 the researcher will be asked to redesign the survey Once this phase is complete the researcher can then purchase the survey
After a researcher creates and purchases a survey a Google Surveys team member will inspect the survey to make sure it complies with our policies then email the researcher if edits are needed A common review note is to ask researchers to change ldquoYesrdquo or ldquoNordquo binary questions to add an additional option like ldquoNo Answerrdquo or ldquoPrefer not to sayrdquo This kind of opt-out option increases the chance that users who may not fall into ldquoYesrdquo or ldquoNordquo will respond accurately Once a survey passes review and begins running it can no longer be changed
Surveys are fielded for a minimum of two days to avoid bias from the time of day or a single day Surveys with screening questions or stricter user criteria may take longer due to the rarity of the subpopulation being measured
The trial run step for a survey with screening questions
How Google Surveys WorksWhite paper
Surveys
View results
After a survey has collected an initial portion of its responses the researcher will get an email inviting them to view the results in an online report These early results will have low sample sizes and large error bars as more results are collected the sample size will increase and the error bar sizes will decrease The results will continue to update until the survey is complete
The survey results overview page
Survey report pages offer more than just top-level results They include comparisons (crosstabs) filters by demographic groups controls like raw (unweighted) instead of weighted results and options to share
or download the respondent-level data to a spreadsheet
How Google Surveys WorksWhite paper
Surveys
The question results page showing crosstabs and demographic filters
A major challenge for online non-probability surveys is mitigating sampling bias that is ensuring that samples represent the general population of internet users Within our panels we offer representative sampling for some countries and convenience sampling for others (described below)
For representative sampling we evaluate the representativeness of a survey by balancing its sample demographics to match the demographics of the specified population adult (18 or older) internet users We match based on three demographic dimensions age gender and geography In the US we use estimates for the national internet population from the US Census Bureaursquos 2015 Current Population Survey (CPS) Computer and Internet Use Supplement15 In other countries with representative sampling we rely on a combination of government data and internal Google data sources
Convenience sampling means that respondents may be of any age gender or from any geographic region within a country
Sampling bias
15 wwwcensusgovprograms-surveyscpstechnical-documentationcomplete2015html
How Google Surveys WorksWhite paper
Surveys
Collecting representative samples
For countries with representative sampling Google Surveys uses a two-step process to ensure each surveyrsquos representativeness First we use stratified sampling to dynamically engage respondents with the goal of matching the demographics of the target internet population Next we apply post-stratification weighting to more closely match those same demographics of the target internet population
While a survey is collecting responses Surveys does its best to match the respondentsrsquo demographics to the internet populationrsquos demographics with the following steps
Once the survey has collected all responses the ideal actual distribution would match the target populationrsquos demographic distribution In practice however actual distributions usually differ slightly from a target populationrsquos demographic distribution This discrepancy is due to the nature of the dynamic targeting described above the availability of respondents on publisher sites at any given time and the tradeoff between finishing a survey in a reasonable amount of time and perfectly matching the distribution
A table at the bottom of each survey report shows the sampling bias how the surveyrsquos sample differs from the target internet population for gender age and geography
Calculate the target percentage of the joint distributions that is the percentage of each three-dimensional demographic group such as 18ndash24-year-old males in Idaho
Select respondents randomly within each demographic group (age x gender x state) to answer the survey We donrsquot balance responses using any additional paradata such as time of day operating system or answers to other survey questions
As responses are collected update the actual current percentage of respondents of each group in real time
If the actual and target percentages differ at any time dynamically adjust the criteria of the survey to compensate for under- or over-sampling For example if a survey has enough responses from 18ndash24-year-old males in Idaho but needs more representation from 35ndash44-year-old females in Nebraska we will show fewer surveys to 18ndash24-year-old males in Idaho and more surveys to 35ndash44-year-old females in Nebraska
1
3
2
4
How Google Surveys WorksWhite paper
Surveys
The bias table from the question results page
The Root Mean Squared Error (RMSE) score describes the square root of the mean of the squared errors across all values (eg male and female) within each dimension (gender age and geography) The larger the RMSE score the less representative the sample is of the specified population
One note about geographic representativeness Google Surveys guarantees a representative distribution of regions or states within a country whenever possible However Surveys does not guarantee geographic representativeness within a region or state mdash such as a representative balance between cities and rural areas mdash as part of its dynamic fielding and weighting schemes The publisher network does however have extensive coverage within states through its 1500+ publisher sites in which local newspapers are strongly represented
We also balance responses across different publishers by preventing any one publisher from dominating a surveyrsquos results This reduces bias from specific publishers that may focus on local topics national issues or particular subject matters This approach also limits the possibility of repeatedly sampling the same respondents for multiple surveys across our system Our system also ensures that the same respondent doesnrsquot have the opportunity to answer the same survey more than once These frequency capping measures help diversify our panel and mitigate bias towards frequent internet users
How Google Surveys WorksWhite paper
Surveys
To correct for sampling bias after the survey is run we apply weights to upweight underrepresented groups and downweight overrepresented groups This calculation is coarser than the calculation for dynamic fielding instead of matching the three-dimensional joint distributions we match each single dimension mdash the marginal distributions mdash on their own We then calculate weights using an iterative process also known as raking to reduce bias across all three dimensions16
Herersquos how raking works First we exclude all respondents with unknown demographics for age gender or geography Then we calculate weights that will match the gender breakdown to the target demographic If the target distribution is 52 female and 48 male but the actual distribution is 50 female and 50 male then we apply a weight of 52 50 = 104 to all female responses and 48 50 = 096 to all male responses
After weighting respondents by the gender dimension on its own we do the same for the age dimension on its own and then the region dimension on its own Every time we get one dimension to perfectly match the target demographic the previous dimensions will no longer exactly match We use an iterative raking technique to do 10 rounds of calculations for all three dimensions on their own17 After 10 rounds the weights will approach convergence and all three dimensions will closely match their targets
The weights in each survey are calculated based on the first question We use the first question for weighting because thatrsquos the only question we can assume should match the target populationrsquos demographic distribution
For example if the first question is a screening question that asks ldquoWhat is your genderrdquo and only respondents who answer ldquomalerdquo screen through to the second question we wouldnrsquot want to match the second question to 52 female and 48 male it will always be 100 male
Even if the first question isnrsquot a screening question respondents may drop off throughout the survey in a way that is skewed towards one demographic group due to the design of the survey Thus we weight responses to follow-up questions by taking the first-question weights filtering them to only those who answered the follow-up question and renormalizing so that the sum of the weights equals the total number of responses to the follow-up question
Weighting
16 Google Surveys moved to a raking methodology in October 2016 The previous methodology is explained in the original whitepaper wwwgooglecominsightsconsumersurveysstaticconsumer_surveys_whitepaperpdf17 enwikipediaorgwikiIterative_proportional_fitting
How Google Surveys WorksWhite paper
Surveys
In the survey results the values displayed in the error bars represent the modeled margin of error This means that if we repeat this survey many times in the same way 95 of the time the resulting range of values would contain the true value
We follow the Pew Research Center in using the term ldquomodeled margin of errorrdquo to differentiate from the statistical term ldquomargin of errorrdquo which only applies to true probability-based samples18 Because Google Surveys collects online non-probability samples the margin of error calculation is based on assumptions about the Surveys sampling model and what would happen if we repeated the same sampling process many times
We use the Modified (or ad hoc) Wilson method to calculate the error bars which can be asymmetrical eg +18-16 The Wilson method works well for small sample sizes as well as extreme probabilities (close to 0 or 100)19 We follow the Modified Wilson calculation using effective sample size as shown in Applied Survey Data Analysis20 The calculation is the same as the Wilson method but uses n = p(1 - p) var(p) in place of n21
Error bars
A question report page showing error bars and the modeled margin of error
In this example the modeled margin of error for Basketball is +18-16 The range of values is 124 to 158 ie 14 adjusted by the modeled
margin of error
Four factors influence and can reduce the size of the modeled
margin of error
1 Larger sample sizes
2 Percentages closer to the extremes of 0 or 100
3 Lower confidence levels (we use a 95 confidence level)
4 Lower variability of weights
18 wwwpewresearchorg20180126variability-of-survey-estimates19 Dean Natalie and Pagano Marcello 2015 ldquoEvaluating Confidence Interval Methods for Binomial Proportions in Clustered Surveysrdquo Journal of Survey Statistics and Methodology 3 (4) 484-503 doiorg101093jssamsmv02420 Heeringa Steven G West Brady T and Berglund Patricia A 2017 Applied Survey Data Analysis Second Edition 16521 enwikipediaorgwikiBinomial_proportion_confidence_intervalWilson_score_interval
Surveys may be subject to other sources of biases and errors including mdash but not limited to mdash sampling and nonresponse as discussed in more detail below
How Google Surveys WorksWhite paper
Surveys
The way we determine respondent demographics differs by survey panel
The mobile app is the simpler of the two panels We ask users to self-report their age gender and zipcode when they sign up to use the app We periodically ask these questions again to refresh the panelistsrsquo demographics in case they have changed
The publisher network uses inferred demographics which means that we donrsquot explicitly ask the panelists for their demographics We do this to minimize the number of questions in a survey which offers a better respondent experience and encourages higher response rates Any researcher who doesnrsquot want to rely on inferred demographics can explicitly add demographic questions to their surveys However our dynamic fielding and weighting process to match ground-truth data will still be based on inferred demographics
Like many ads on the web Google Surveys infers the age and gender of anonymous respondents based on browsing behavior and geography based on IP addresses Users can opt out of inferred demographics in the Ads Settings which applies across Google ads services the 2M+ sites and apps that partner with Google to show ads and Google Surveys In the case of Surveys opting out means that usersrsquo demographics will show as unknown and their responses will be excluded from weighted results For all users unless otherwise stated responses are anonymous and collected in aggregate
How we know age gender and region
In addition to sampling bias Google Surveys monitors and mitigates other kinds of bias
Response non-response and modal bias
Response bias is the bias from inattentive or untruthful answers to questions
The publisher network and mobile app have different kinds of inattentive or untruthful responses Respondents on the publisher network are intercepted while trying to view content online so they do not necessarily want to answer a survey and may just want to see that content The mobile app has the opposite problem where users want to answer as many surveys as possible because they voluntarily opted into the mobile panel out of a desire to answer surveys and earn rewards
Another source of low-quality responses from both the publisher network and the mobile app is open-ended text questions Respondents may respond with gibberish profanity or something like ldquoI hate surveysrdquo These types of answers are removed from the surveyrsquos results using common natural language processing libraries employed across Google
Response bias
How Google Surveys WorksWhite paper
Surveys
Google Surveys tracks investigates and removes multiple kinds of low-quality responses and respondents If low-quality responses are dropped from a survey the survey will remain in the field to collect more responses to make up for the sample that is now missing If chronically inattentive or untruthful respondents are detected they may be prevented from getting any more surveys in the future
Potential responses to a survey can fall into several categories non-response screen-out response partial response or complete response These categories are illustrated below
Non-response bias occurs when a group of people in the sample choose not to respond to the survey in a systematic way which can cause the omission of that grouprsquos opinions Non-responses can come from people who donrsquot like answering surveys in general or are alienated by the first question in some way Unfortunately it can be difficult to ask non-respondents why they chose not to respond because they are unlikely to respond
Respondents may also choose to stop answering questions midway through a survey These partial responses can introduce dropoff bias perhaps an overly-specific question turns off respondents or respondents could drop off towards the end of a long survey For example if a survey is about an extremely specific topic like equestrian equipment then people who are uninterested or uninformed about equestrian equipment may stop answering partway through
Non-response and dropoff bias
QUESTION 2 CATEGORYPOTENTIALRESPONDENT
Person 2
Person 3
Person 4
Person 5
Do you have afavorite letter
ldquoNordquo
ldquoYesrdquo
ldquoYesrdquo
ldquoYesrdquo
ldquoBrdquo
ldquoPrdquo ldquoZrdquo
What is yourfavorite letter
What is your secondfavorite letter
Non-response
Screen-outResponse
PartialResponse
PartialResponse
CompleteResponse
QUESTION 1 QUESTION 3
Person 1 skips the survey
screens out
drops out
drops out
The different categories of potential responses
How Google Surveys WorksWhite paper
Surveys
In a surveyrsquos report page we display the question response dropoff pattern
Researchers may want to investigate if therersquos a systemic reason for potential respondents to not respond to part or all of a survey The raw data download lists the status of each response Screen-out Partial or
Complete along with the answers to each question which allows more in-depth analysis
The question response dropoff chart
Modal bias or mode effects occur when the way in which a question is asked affects the respondentsrsquo answers in a systematic way because of how the survey is administered
All methods of conducting surveys are susceptible to modal bias In face-to-face or live phone interviews the fact that respondents are talking to live interviewers can influence how they answer questions they may want to be more agreeable in person This phenomenon is called the social desirability bias
Modal bias and survey design
How Google Surveys WorksWhite paper
Surveys
Different survey modes can also allow for different question structures In a live interview when a respondent declines to answer a question the interviewer can follow a script with follow-up questions an online platform like Google Surveys canrsquot do this For example consider an election poll that asks respondents to choose between three candidates Over the phone a live interviewer could list the three candidates and no other answer options If the respondent declines to answer the question the live interviewer can then ask a follow-up question to see if the respondent prefers a candidate not listed doesnrsquot want to answer or is undecided
This structure cannot be replicated online If only three candidate options are presented to a potential online respondent the only way to proceed is to choose one of those three candidates or drop out of the survey We could attempt to replicate the live interview structure online by adding a fourth option such as ldquoOtherrdquo or ldquoPrefer not to sayrdquo However respondents may be more likely to choose one of these alternative options when they are explicitly offered as an ldquoeasy outrdquo versus having to refuse to answer the question with a live interviewer
One way to partially mitigate this mode effect is through survey design Instead of adding ldquoOtherrdquo or ldquoPrefer not to sayrdquo options an open-ended text option can be used instead as in the Google Surveys 2016 US Election Poll22
This makes it more difficult for users to select the ldquoOtherrdquo option because they have to formulate and type out an alternative answer
Another mode effect to consider is that different question types may yield different results Results may differ if a question is formulated as a multiple-select (checkbox) question with five options versus separating that question into five individual single-select (radio button) questions A respondent may not want to check all the boxes or remember to check all the boxes whereas putting each option in a single question will encourage them to slow down and focus
22 See the Election Poll survey design at googlOA33DH
Multi-select questions can help reduce the number of questions in a survey but itrsquos important to note the effect that multiple-select questions may have on the results This is even more important when comparing the results of multiple-select questions to the results from other survey modes like live
interviews that often use single-select instead of multiple-select questions
How Google Surveys WorksWhite paper
Surveys
Katrina Sostek and Brett Slatkin are software engineers at Google The whitepaper was originally published in May 2017 All information is accurate as of June 2018 copy 2018 Google LLC All rights reserved Google and the Google logo are trademarks of Google Inc All other company and product names may be trademarks of the respective companies with which they are associated
Since launching in 2012 Google Surveys has moved from 2-question surveys to 10-question surveys expanded the publisher network and built the mobile app panel Surveys offers several advantages compared to traditional phone surveys faster cheaper results with larger sample sizes drawn from an online panel of tens of millions of potential respondents
Like all survey modes Surveys continues to face challenges from different kinds of biases mdash sampling response non-response dropoff modal mdash and we continue to improve our approaches to mitigate these biases Our work to improve our survey capabilities and accuracy is never done and wersquoll continue to refine our methodology as the landscape of respondents and technology continues to change
Privacy is very important to Google Users always have the option to pass on a survey and have the ability to opt out of the DoubleClick cookie completely Unless otherwise stated all responses are anonymous and collected in aggregate Certain surveys such as local surveys may be used to get feedback about a location recently visited and request permission for these responses to be posted publicly Google does not sell usersrsquo personal information to advertisers or anyone else For more information about the Google privacy policy please visit wwwgooglecompoliciesprivacy
Google Surveys is a member of the American Association of Public Opinion Researchrsquos (AAPOR) Transparency Initiative The initiative was founded in 2014 and establishes disclosure standards for organizations who run and publish surveys By joining the initiative Google Surveys pledges to uphold these disclosure standards when publishing results
We would like to acknowledge our fellow Google colleagues for providing insights and expertise that assisted the publication of this paper Amy Adams Harding Asfandyar Qureshi Carolin Jahn James Freeland James Pine Jon Fraser Kenneth Leftin Kevin Tudish Marisa Currie-Rose Michael Brandell Shaun Lysen and Yongwei Yang
In addition we would like to show our gratitude to Stacey Symonds and Fritz Holznagel for their guidance
Conclusion
Privacy
AAPORrsquos Transparency Initiative
Acknowledgements
Questions or comments surveys-supportgooglecom
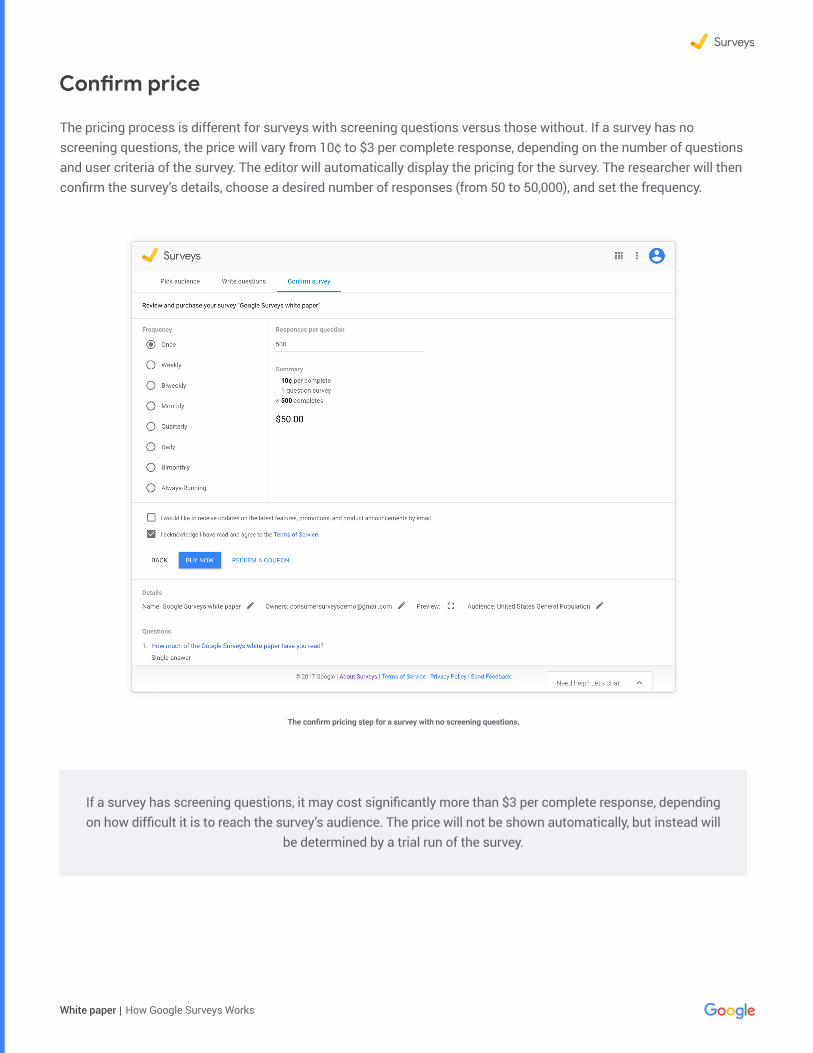
How Google Surveys WorksWhite paper
Surveys
Confirm price
The confirm pricing step for a survey with no screening questions
If a survey has screening questions it may cost significantly more than $3 per complete response depending on how difficult it is to reach the surveyrsquos audience The price will not be shown automatically but instead will
be determined by a trial run of the survey
The pricing process is different for surveys with screening questions versus those without If a survey has no screening questions the price will vary from 10cent to $3 per complete response depending on the number of questions and user criteria of the survey The editor will automatically display the pricing for the survey The researcher will then confirm the surveyrsquos details choose a desired number of responses (from 50 to 50000) and set the frequency
How Google Surveys WorksWhite paper
Surveys
The trial run will estimate the surveyrsquos incidence rate that is the number of respondents who choose a screen-in answer to the last screening question in the survey The lower the incidence rate the more the survey will cost For example if the incidence rate is 10 and the researcher buys 1000 complete responses wersquoll need to collect at least 10000 responses to the screening question to reach 1000 complete responses
The trial run will run for up to 24 hours at which point the researcher will get an email quoting the price for the survey A survey must have a 5 incidence rate to run if the incidence is less than 5 the researcher will be asked to redesign the survey Once this phase is complete the researcher can then purchase the survey
After a researcher creates and purchases a survey a Google Surveys team member will inspect the survey to make sure it complies with our policies then email the researcher if edits are needed A common review note is to ask researchers to change ldquoYesrdquo or ldquoNordquo binary questions to add an additional option like ldquoNo Answerrdquo or ldquoPrefer not to sayrdquo This kind of opt-out option increases the chance that users who may not fall into ldquoYesrdquo or ldquoNordquo will respond accurately Once a survey passes review and begins running it can no longer be changed
Surveys are fielded for a minimum of two days to avoid bias from the time of day or a single day Surveys with screening questions or stricter user criteria may take longer due to the rarity of the subpopulation being measured
The trial run step for a survey with screening questions
How Google Surveys WorksWhite paper
Surveys
View results
After a survey has collected an initial portion of its responses the researcher will get an email inviting them to view the results in an online report These early results will have low sample sizes and large error bars as more results are collected the sample size will increase and the error bar sizes will decrease The results will continue to update until the survey is complete
The survey results overview page
Survey report pages offer more than just top-level results They include comparisons (crosstabs) filters by demographic groups controls like raw (unweighted) instead of weighted results and options to share
or download the respondent-level data to a spreadsheet
How Google Surveys WorksWhite paper
Surveys
The question results page showing crosstabs and demographic filters
A major challenge for online non-probability surveys is mitigating sampling bias that is ensuring that samples represent the general population of internet users Within our panels we offer representative sampling for some countries and convenience sampling for others (described below)
For representative sampling we evaluate the representativeness of a survey by balancing its sample demographics to match the demographics of the specified population adult (18 or older) internet users We match based on three demographic dimensions age gender and geography In the US we use estimates for the national internet population from the US Census Bureaursquos 2015 Current Population Survey (CPS) Computer and Internet Use Supplement15 In other countries with representative sampling we rely on a combination of government data and internal Google data sources
Convenience sampling means that respondents may be of any age gender or from any geographic region within a country
Sampling bias
15 wwwcensusgovprograms-surveyscpstechnical-documentationcomplete2015html
How Google Surveys WorksWhite paper
Surveys
Collecting representative samples
For countries with representative sampling Google Surveys uses a two-step process to ensure each surveyrsquos representativeness First we use stratified sampling to dynamically engage respondents with the goal of matching the demographics of the target internet population Next we apply post-stratification weighting to more closely match those same demographics of the target internet population
While a survey is collecting responses Surveys does its best to match the respondentsrsquo demographics to the internet populationrsquos demographics with the following steps
Once the survey has collected all responses the ideal actual distribution would match the target populationrsquos demographic distribution In practice however actual distributions usually differ slightly from a target populationrsquos demographic distribution This discrepancy is due to the nature of the dynamic targeting described above the availability of respondents on publisher sites at any given time and the tradeoff between finishing a survey in a reasonable amount of time and perfectly matching the distribution
A table at the bottom of each survey report shows the sampling bias how the surveyrsquos sample differs from the target internet population for gender age and geography
Calculate the target percentage of the joint distributions that is the percentage of each three-dimensional demographic group such as 18ndash24-year-old males in Idaho
Select respondents randomly within each demographic group (age x gender x state) to answer the survey We donrsquot balance responses using any additional paradata such as time of day operating system or answers to other survey questions
As responses are collected update the actual current percentage of respondents of each group in real time
If the actual and target percentages differ at any time dynamically adjust the criteria of the survey to compensate for under- or over-sampling For example if a survey has enough responses from 18ndash24-year-old males in Idaho but needs more representation from 35ndash44-year-old females in Nebraska we will show fewer surveys to 18ndash24-year-old males in Idaho and more surveys to 35ndash44-year-old females in Nebraska
1
3
2
4
How Google Surveys WorksWhite paper
Surveys
The bias table from the question results page
The Root Mean Squared Error (RMSE) score describes the square root of the mean of the squared errors across all values (eg male and female) within each dimension (gender age and geography) The larger the RMSE score the less representative the sample is of the specified population
One note about geographic representativeness Google Surveys guarantees a representative distribution of regions or states within a country whenever possible However Surveys does not guarantee geographic representativeness within a region or state mdash such as a representative balance between cities and rural areas mdash as part of its dynamic fielding and weighting schemes The publisher network does however have extensive coverage within states through its 1500+ publisher sites in which local newspapers are strongly represented
We also balance responses across different publishers by preventing any one publisher from dominating a surveyrsquos results This reduces bias from specific publishers that may focus on local topics national issues or particular subject matters This approach also limits the possibility of repeatedly sampling the same respondents for multiple surveys across our system Our system also ensures that the same respondent doesnrsquot have the opportunity to answer the same survey more than once These frequency capping measures help diversify our panel and mitigate bias towards frequent internet users
How Google Surveys WorksWhite paper
Surveys
To correct for sampling bias after the survey is run we apply weights to upweight underrepresented groups and downweight overrepresented groups This calculation is coarser than the calculation for dynamic fielding instead of matching the three-dimensional joint distributions we match each single dimension mdash the marginal distributions mdash on their own We then calculate weights using an iterative process also known as raking to reduce bias across all three dimensions16
Herersquos how raking works First we exclude all respondents with unknown demographics for age gender or geography Then we calculate weights that will match the gender breakdown to the target demographic If the target distribution is 52 female and 48 male but the actual distribution is 50 female and 50 male then we apply a weight of 52 50 = 104 to all female responses and 48 50 = 096 to all male responses
After weighting respondents by the gender dimension on its own we do the same for the age dimension on its own and then the region dimension on its own Every time we get one dimension to perfectly match the target demographic the previous dimensions will no longer exactly match We use an iterative raking technique to do 10 rounds of calculations for all three dimensions on their own17 After 10 rounds the weights will approach convergence and all three dimensions will closely match their targets
The weights in each survey are calculated based on the first question We use the first question for weighting because thatrsquos the only question we can assume should match the target populationrsquos demographic distribution
For example if the first question is a screening question that asks ldquoWhat is your genderrdquo and only respondents who answer ldquomalerdquo screen through to the second question we wouldnrsquot want to match the second question to 52 female and 48 male it will always be 100 male
Even if the first question isnrsquot a screening question respondents may drop off throughout the survey in a way that is skewed towards one demographic group due to the design of the survey Thus we weight responses to follow-up questions by taking the first-question weights filtering them to only those who answered the follow-up question and renormalizing so that the sum of the weights equals the total number of responses to the follow-up question
Weighting
16 Google Surveys moved to a raking methodology in October 2016 The previous methodology is explained in the original whitepaper wwwgooglecominsightsconsumersurveysstaticconsumer_surveys_whitepaperpdf17 enwikipediaorgwikiIterative_proportional_fitting
How Google Surveys WorksWhite paper
Surveys
In the survey results the values displayed in the error bars represent the modeled margin of error This means that if we repeat this survey many times in the same way 95 of the time the resulting range of values would contain the true value
We follow the Pew Research Center in using the term ldquomodeled margin of errorrdquo to differentiate from the statistical term ldquomargin of errorrdquo which only applies to true probability-based samples18 Because Google Surveys collects online non-probability samples the margin of error calculation is based on assumptions about the Surveys sampling model and what would happen if we repeated the same sampling process many times
We use the Modified (or ad hoc) Wilson method to calculate the error bars which can be asymmetrical eg +18-16 The Wilson method works well for small sample sizes as well as extreme probabilities (close to 0 or 100)19 We follow the Modified Wilson calculation using effective sample size as shown in Applied Survey Data Analysis20 The calculation is the same as the Wilson method but uses n = p(1 - p) var(p) in place of n21
Error bars
A question report page showing error bars and the modeled margin of error
In this example the modeled margin of error for Basketball is +18-16 The range of values is 124 to 158 ie 14 adjusted by the modeled
margin of error
Four factors influence and can reduce the size of the modeled
margin of error
1 Larger sample sizes
2 Percentages closer to the extremes of 0 or 100
3 Lower confidence levels (we use a 95 confidence level)
4 Lower variability of weights
18 wwwpewresearchorg20180126variability-of-survey-estimates19 Dean Natalie and Pagano Marcello 2015 ldquoEvaluating Confidence Interval Methods for Binomial Proportions in Clustered Surveysrdquo Journal of Survey Statistics and Methodology 3 (4) 484-503 doiorg101093jssamsmv02420 Heeringa Steven G West Brady T and Berglund Patricia A 2017 Applied Survey Data Analysis Second Edition 16521 enwikipediaorgwikiBinomial_proportion_confidence_intervalWilson_score_interval
Surveys may be subject to other sources of biases and errors including mdash but not limited to mdash sampling and nonresponse as discussed in more detail below
How Google Surveys WorksWhite paper
Surveys
The way we determine respondent demographics differs by survey panel
The mobile app is the simpler of the two panels We ask users to self-report their age gender and zipcode when they sign up to use the app We periodically ask these questions again to refresh the panelistsrsquo demographics in case they have changed
The publisher network uses inferred demographics which means that we donrsquot explicitly ask the panelists for their demographics We do this to minimize the number of questions in a survey which offers a better respondent experience and encourages higher response rates Any researcher who doesnrsquot want to rely on inferred demographics can explicitly add demographic questions to their surveys However our dynamic fielding and weighting process to match ground-truth data will still be based on inferred demographics
Like many ads on the web Google Surveys infers the age and gender of anonymous respondents based on browsing behavior and geography based on IP addresses Users can opt out of inferred demographics in the Ads Settings which applies across Google ads services the 2M+ sites and apps that partner with Google to show ads and Google Surveys In the case of Surveys opting out means that usersrsquo demographics will show as unknown and their responses will be excluded from weighted results For all users unless otherwise stated responses are anonymous and collected in aggregate
How we know age gender and region
In addition to sampling bias Google Surveys monitors and mitigates other kinds of bias
Response non-response and modal bias
Response bias is the bias from inattentive or untruthful answers to questions
The publisher network and mobile app have different kinds of inattentive or untruthful responses Respondents on the publisher network are intercepted while trying to view content online so they do not necessarily want to answer a survey and may just want to see that content The mobile app has the opposite problem where users want to answer as many surveys as possible because they voluntarily opted into the mobile panel out of a desire to answer surveys and earn rewards
Another source of low-quality responses from both the publisher network and the mobile app is open-ended text questions Respondents may respond with gibberish profanity or something like ldquoI hate surveysrdquo These types of answers are removed from the surveyrsquos results using common natural language processing libraries employed across Google
Response bias
How Google Surveys WorksWhite paper
Surveys
Google Surveys tracks investigates and removes multiple kinds of low-quality responses and respondents If low-quality responses are dropped from a survey the survey will remain in the field to collect more responses to make up for the sample that is now missing If chronically inattentive or untruthful respondents are detected they may be prevented from getting any more surveys in the future
Potential responses to a survey can fall into several categories non-response screen-out response partial response or complete response These categories are illustrated below
Non-response bias occurs when a group of people in the sample choose not to respond to the survey in a systematic way which can cause the omission of that grouprsquos opinions Non-responses can come from people who donrsquot like answering surveys in general or are alienated by the first question in some way Unfortunately it can be difficult to ask non-respondents why they chose not to respond because they are unlikely to respond
Respondents may also choose to stop answering questions midway through a survey These partial responses can introduce dropoff bias perhaps an overly-specific question turns off respondents or respondents could drop off towards the end of a long survey For example if a survey is about an extremely specific topic like equestrian equipment then people who are uninterested or uninformed about equestrian equipment may stop answering partway through
Non-response and dropoff bias
QUESTION 2 CATEGORYPOTENTIALRESPONDENT
Person 2
Person 3
Person 4
Person 5
Do you have afavorite letter
ldquoNordquo
ldquoYesrdquo
ldquoYesrdquo
ldquoYesrdquo
ldquoBrdquo
ldquoPrdquo ldquoZrdquo
What is yourfavorite letter
What is your secondfavorite letter
Non-response
Screen-outResponse
PartialResponse
PartialResponse
CompleteResponse
QUESTION 1 QUESTION 3
Person 1 skips the survey
screens out
drops out
drops out
The different categories of potential responses
How Google Surveys WorksWhite paper
Surveys
In a surveyrsquos report page we display the question response dropoff pattern
Researchers may want to investigate if therersquos a systemic reason for potential respondents to not respond to part or all of a survey The raw data download lists the status of each response Screen-out Partial or
Complete along with the answers to each question which allows more in-depth analysis
The question response dropoff chart
Modal bias or mode effects occur when the way in which a question is asked affects the respondentsrsquo answers in a systematic way because of how the survey is administered
All methods of conducting surveys are susceptible to modal bias In face-to-face or live phone interviews the fact that respondents are talking to live interviewers can influence how they answer questions they may want to be more agreeable in person This phenomenon is called the social desirability bias
Modal bias and survey design
How Google Surveys WorksWhite paper
Surveys
Different survey modes can also allow for different question structures In a live interview when a respondent declines to answer a question the interviewer can follow a script with follow-up questions an online platform like Google Surveys canrsquot do this For example consider an election poll that asks respondents to choose between three candidates Over the phone a live interviewer could list the three candidates and no other answer options If the respondent declines to answer the question the live interviewer can then ask a follow-up question to see if the respondent prefers a candidate not listed doesnrsquot want to answer or is undecided
This structure cannot be replicated online If only three candidate options are presented to a potential online respondent the only way to proceed is to choose one of those three candidates or drop out of the survey We could attempt to replicate the live interview structure online by adding a fourth option such as ldquoOtherrdquo or ldquoPrefer not to sayrdquo However respondents may be more likely to choose one of these alternative options when they are explicitly offered as an ldquoeasy outrdquo versus having to refuse to answer the question with a live interviewer
One way to partially mitigate this mode effect is through survey design Instead of adding ldquoOtherrdquo or ldquoPrefer not to sayrdquo options an open-ended text option can be used instead as in the Google Surveys 2016 US Election Poll22
This makes it more difficult for users to select the ldquoOtherrdquo option because they have to formulate and type out an alternative answer
Another mode effect to consider is that different question types may yield different results Results may differ if a question is formulated as a multiple-select (checkbox) question with five options versus separating that question into five individual single-select (radio button) questions A respondent may not want to check all the boxes or remember to check all the boxes whereas putting each option in a single question will encourage them to slow down and focus
22 See the Election Poll survey design at googlOA33DH
Multi-select questions can help reduce the number of questions in a survey but itrsquos important to note the effect that multiple-select questions may have on the results This is even more important when comparing the results of multiple-select questions to the results from other survey modes like live
interviews that often use single-select instead of multiple-select questions
How Google Surveys WorksWhite paper
Surveys
Katrina Sostek and Brett Slatkin are software engineers at Google The whitepaper was originally published in May 2017 All information is accurate as of June 2018 copy 2018 Google LLC All rights reserved Google and the Google logo are trademarks of Google Inc All other company and product names may be trademarks of the respective companies with which they are associated
Since launching in 2012 Google Surveys has moved from 2-question surveys to 10-question surveys expanded the publisher network and built the mobile app panel Surveys offers several advantages compared to traditional phone surveys faster cheaper results with larger sample sizes drawn from an online panel of tens of millions of potential respondents
Like all survey modes Surveys continues to face challenges from different kinds of biases mdash sampling response non-response dropoff modal mdash and we continue to improve our approaches to mitigate these biases Our work to improve our survey capabilities and accuracy is never done and wersquoll continue to refine our methodology as the landscape of respondents and technology continues to change
Privacy is very important to Google Users always have the option to pass on a survey and have the ability to opt out of the DoubleClick cookie completely Unless otherwise stated all responses are anonymous and collected in aggregate Certain surveys such as local surveys may be used to get feedback about a location recently visited and request permission for these responses to be posted publicly Google does not sell usersrsquo personal information to advertisers or anyone else For more information about the Google privacy policy please visit wwwgooglecompoliciesprivacy
Google Surveys is a member of the American Association of Public Opinion Researchrsquos (AAPOR) Transparency Initiative The initiative was founded in 2014 and establishes disclosure standards for organizations who run and publish surveys By joining the initiative Google Surveys pledges to uphold these disclosure standards when publishing results
We would like to acknowledge our fellow Google colleagues for providing insights and expertise that assisted the publication of this paper Amy Adams Harding Asfandyar Qureshi Carolin Jahn James Freeland James Pine Jon Fraser Kenneth Leftin Kevin Tudish Marisa Currie-Rose Michael Brandell Shaun Lysen and Yongwei Yang
In addition we would like to show our gratitude to Stacey Symonds and Fritz Holznagel for their guidance
Conclusion
Privacy
AAPORrsquos Transparency Initiative
Acknowledgements
Questions or comments surveys-supportgooglecom
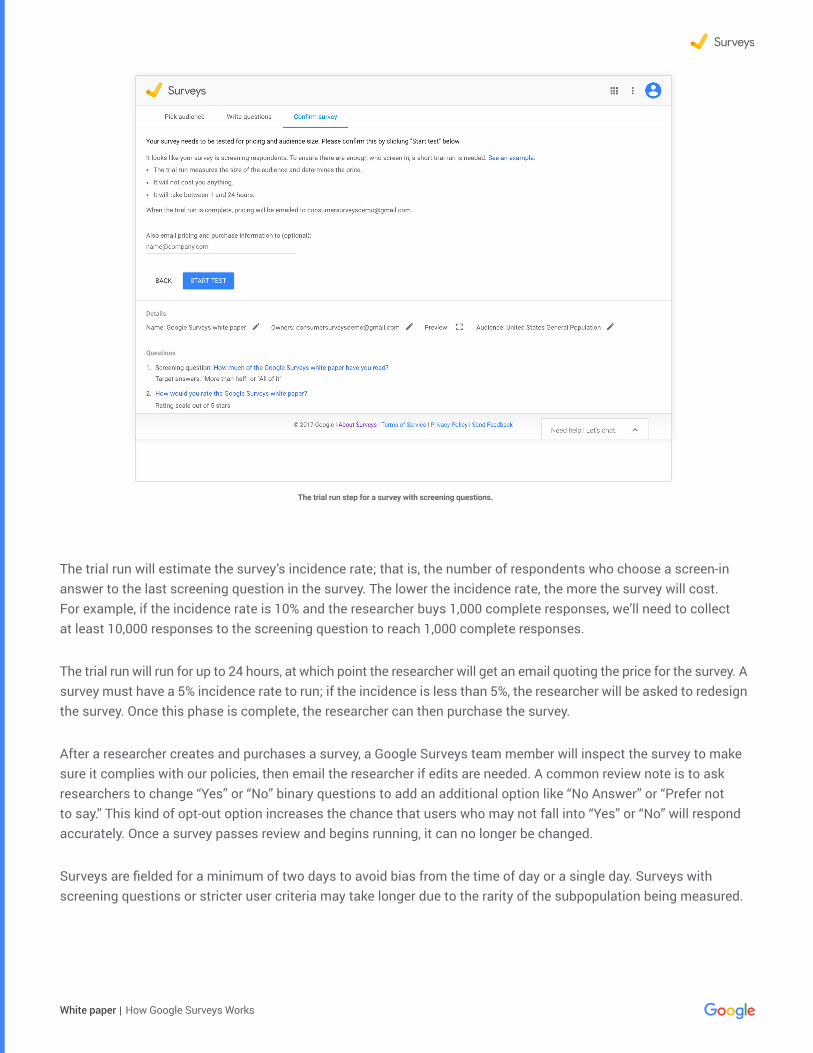
How Google Surveys WorksWhite paper
Surveys
View results
After a survey has collected an initial portion of its responses the researcher will get an email inviting them to view the results in an online report These early results will have low sample sizes and large error bars as more results are collected the sample size will increase and the error bar sizes will decrease The results will continue to update until the survey is complete
The survey results overview page
Survey report pages offer more than just top-level results They include comparisons (crosstabs) filters by demographic groups controls like raw (unweighted) instead of weighted results and options to share
or download the respondent-level data to a spreadsheet
How Google Surveys WorksWhite paper
Surveys
The question results page showing crosstabs and demographic filters
A major challenge for online non-probability surveys is mitigating sampling bias that is ensuring that samples represent the general population of internet users Within our panels we offer representative sampling for some countries and convenience sampling for others (described below)
For representative sampling we evaluate the representativeness of a survey by balancing its sample demographics to match the demographics of the specified population adult (18 or older) internet users We match based on three demographic dimensions age gender and geography In the US we use estimates for the national internet population from the US Census Bureaursquos 2015 Current Population Survey (CPS) Computer and Internet Use Supplement15 In other countries with representative sampling we rely on a combination of government data and internal Google data sources
Convenience sampling means that respondents may be of any age gender or from any geographic region within a country
Sampling bias
15 wwwcensusgovprograms-surveyscpstechnical-documentationcomplete2015html
How Google Surveys WorksWhite paper
Surveys
Collecting representative samples
For countries with representative sampling Google Surveys uses a two-step process to ensure each surveyrsquos representativeness First we use stratified sampling to dynamically engage respondents with the goal of matching the demographics of the target internet population Next we apply post-stratification weighting to more closely match those same demographics of the target internet population
While a survey is collecting responses Surveys does its best to match the respondentsrsquo demographics to the internet populationrsquos demographics with the following steps
Once the survey has collected all responses the ideal actual distribution would match the target populationrsquos demographic distribution In practice however actual distributions usually differ slightly from a target populationrsquos demographic distribution This discrepancy is due to the nature of the dynamic targeting described above the availability of respondents on publisher sites at any given time and the tradeoff between finishing a survey in a reasonable amount of time and perfectly matching the distribution
A table at the bottom of each survey report shows the sampling bias how the surveyrsquos sample differs from the target internet population for gender age and geography
Calculate the target percentage of the joint distributions that is the percentage of each three-dimensional demographic group such as 18ndash24-year-old males in Idaho
Select respondents randomly within each demographic group (age x gender x state) to answer the survey We donrsquot balance responses using any additional paradata such as time of day operating system or answers to other survey questions
As responses are collected update the actual current percentage of respondents of each group in real time
If the actual and target percentages differ at any time dynamically adjust the criteria of the survey to compensate for under- or over-sampling For example if a survey has enough responses from 18ndash24-year-old males in Idaho but needs more representation from 35ndash44-year-old females in Nebraska we will show fewer surveys to 18ndash24-year-old males in Idaho and more surveys to 35ndash44-year-old females in Nebraska
1
3
2
4
How Google Surveys WorksWhite paper
Surveys
The bias table from the question results page
The Root Mean Squared Error (RMSE) score describes the square root of the mean of the squared errors across all values (eg male and female) within each dimension (gender age and geography) The larger the RMSE score the less representative the sample is of the specified population
One note about geographic representativeness Google Surveys guarantees a representative distribution of regions or states within a country whenever possible However Surveys does not guarantee geographic representativeness within a region or state mdash such as a representative balance between cities and rural areas mdash as part of its dynamic fielding and weighting schemes The publisher network does however have extensive coverage within states through its 1500+ publisher sites in which local newspapers are strongly represented
We also balance responses across different publishers by preventing any one publisher from dominating a surveyrsquos results This reduces bias from specific publishers that may focus on local topics national issues or particular subject matters This approach also limits the possibility of repeatedly sampling the same respondents for multiple surveys across our system Our system also ensures that the same respondent doesnrsquot have the opportunity to answer the same survey more than once These frequency capping measures help diversify our panel and mitigate bias towards frequent internet users
How Google Surveys WorksWhite paper
Surveys
To correct for sampling bias after the survey is run we apply weights to upweight underrepresented groups and downweight overrepresented groups This calculation is coarser than the calculation for dynamic fielding instead of matching the three-dimensional joint distributions we match each single dimension mdash the marginal distributions mdash on their own We then calculate weights using an iterative process also known as raking to reduce bias across all three dimensions16
Herersquos how raking works First we exclude all respondents with unknown demographics for age gender or geography Then we calculate weights that will match the gender breakdown to the target demographic If the target distribution is 52 female and 48 male but the actual distribution is 50 female and 50 male then we apply a weight of 52 50 = 104 to all female responses and 48 50 = 096 to all male responses
After weighting respondents by the gender dimension on its own we do the same for the age dimension on its own and then the region dimension on its own Every time we get one dimension to perfectly match the target demographic the previous dimensions will no longer exactly match We use an iterative raking technique to do 10 rounds of calculations for all three dimensions on their own17 After 10 rounds the weights will approach convergence and all three dimensions will closely match their targets
The weights in each survey are calculated based on the first question We use the first question for weighting because thatrsquos the only question we can assume should match the target populationrsquos demographic distribution
For example if the first question is a screening question that asks ldquoWhat is your genderrdquo and only respondents who answer ldquomalerdquo screen through to the second question we wouldnrsquot want to match the second question to 52 female and 48 male it will always be 100 male
Even if the first question isnrsquot a screening question respondents may drop off throughout the survey in a way that is skewed towards one demographic group due to the design of the survey Thus we weight responses to follow-up questions by taking the first-question weights filtering them to only those who answered the follow-up question and renormalizing so that the sum of the weights equals the total number of responses to the follow-up question
Weighting
16 Google Surveys moved to a raking methodology in October 2016 The previous methodology is explained in the original whitepaper wwwgooglecominsightsconsumersurveysstaticconsumer_surveys_whitepaperpdf17 enwikipediaorgwikiIterative_proportional_fitting
How Google Surveys WorksWhite paper
Surveys
In the survey results the values displayed in the error bars represent the modeled margin of error This means that if we repeat this survey many times in the same way 95 of the time the resulting range of values would contain the true value
We follow the Pew Research Center in using the term ldquomodeled margin of errorrdquo to differentiate from the statistical term ldquomargin of errorrdquo which only applies to true probability-based samples18 Because Google Surveys collects online non-probability samples the margin of error calculation is based on assumptions about the Surveys sampling model and what would happen if we repeated the same sampling process many times
We use the Modified (or ad hoc) Wilson method to calculate the error bars which can be asymmetrical eg +18-16 The Wilson method works well for small sample sizes as well as extreme probabilities (close to 0 or 100)19 We follow the Modified Wilson calculation using effective sample size as shown in Applied Survey Data Analysis20 The calculation is the same as the Wilson method but uses n = p(1 - p) var(p) in place of n21
Error bars
A question report page showing error bars and the modeled margin of error
In this example the modeled margin of error for Basketball is +18-16 The range of values is 124 to 158 ie 14 adjusted by the modeled
margin of error
Four factors influence and can reduce the size of the modeled
margin of error
1 Larger sample sizes
2 Percentages closer to the extremes of 0 or 100
3 Lower confidence levels (we use a 95 confidence level)
4 Lower variability of weights
18 wwwpewresearchorg20180126variability-of-survey-estimates19 Dean Natalie and Pagano Marcello 2015 ldquoEvaluating Confidence Interval Methods for Binomial Proportions in Clustered Surveysrdquo Journal of Survey Statistics and Methodology 3 (4) 484-503 doiorg101093jssamsmv02420 Heeringa Steven G West Brady T and Berglund Patricia A 2017 Applied Survey Data Analysis Second Edition 16521 enwikipediaorgwikiBinomial_proportion_confidence_intervalWilson_score_interval
Surveys may be subject to other sources of biases and errors including mdash but not limited to mdash sampling and nonresponse as discussed in more detail below
How Google Surveys WorksWhite paper
Surveys
The way we determine respondent demographics differs by survey panel
The mobile app is the simpler of the two panels We ask users to self-report their age gender and zipcode when they sign up to use the app We periodically ask these questions again to refresh the panelistsrsquo demographics in case they have changed
The publisher network uses inferred demographics which means that we donrsquot explicitly ask the panelists for their demographics We do this to minimize the number of questions in a survey which offers a better respondent experience and encourages higher response rates Any researcher who doesnrsquot want to rely on inferred demographics can explicitly add demographic questions to their surveys However our dynamic fielding and weighting process to match ground-truth data will still be based on inferred demographics
Like many ads on the web Google Surveys infers the age and gender of anonymous respondents based on browsing behavior and geography based on IP addresses Users can opt out of inferred demographics in the Ads Settings which applies across Google ads services the 2M+ sites and apps that partner with Google to show ads and Google Surveys In the case of Surveys opting out means that usersrsquo demographics will show as unknown and their responses will be excluded from weighted results For all users unless otherwise stated responses are anonymous and collected in aggregate
How we know age gender and region
In addition to sampling bias Google Surveys monitors and mitigates other kinds of bias
Response non-response and modal bias
Response bias is the bias from inattentive or untruthful answers to questions
The publisher network and mobile app have different kinds of inattentive or untruthful responses Respondents on the publisher network are intercepted while trying to view content online so they do not necessarily want to answer a survey and may just want to see that content The mobile app has the opposite problem where users want to answer as many surveys as possible because they voluntarily opted into the mobile panel out of a desire to answer surveys and earn rewards
Another source of low-quality responses from both the publisher network and the mobile app is open-ended text questions Respondents may respond with gibberish profanity or something like ldquoI hate surveysrdquo These types of answers are removed from the surveyrsquos results using common natural language processing libraries employed across Google
Response bias
How Google Surveys WorksWhite paper
Surveys
Google Surveys tracks investigates and removes multiple kinds of low-quality responses and respondents If low-quality responses are dropped from a survey the survey will remain in the field to collect more responses to make up for the sample that is now missing If chronically inattentive or untruthful respondents are detected they may be prevented from getting any more surveys in the future
Potential responses to a survey can fall into several categories non-response screen-out response partial response or complete response These categories are illustrated below
Non-response bias occurs when a group of people in the sample choose not to respond to the survey in a systematic way which can cause the omission of that grouprsquos opinions Non-responses can come from people who donrsquot like answering surveys in general or are alienated by the first question in some way Unfortunately it can be difficult to ask non-respondents why they chose not to respond because they are unlikely to respond
Respondents may also choose to stop answering questions midway through a survey These partial responses can introduce dropoff bias perhaps an overly-specific question turns off respondents or respondents could drop off towards the end of a long survey For example if a survey is about an extremely specific topic like equestrian equipment then people who are uninterested or uninformed about equestrian equipment may stop answering partway through
Non-response and dropoff bias
QUESTION 2 CATEGORYPOTENTIALRESPONDENT
Person 2
Person 3
Person 4
Person 5
Do you have afavorite letter
ldquoNordquo
ldquoYesrdquo
ldquoYesrdquo
ldquoYesrdquo
ldquoBrdquo
ldquoPrdquo ldquoZrdquo
What is yourfavorite letter
What is your secondfavorite letter
Non-response
Screen-outResponse
PartialResponse
PartialResponse
CompleteResponse
QUESTION 1 QUESTION 3
Person 1 skips the survey
screens out
drops out
drops out
The different categories of potential responses
How Google Surveys WorksWhite paper
Surveys
In a surveyrsquos report page we display the question response dropoff pattern
Researchers may want to investigate if therersquos a systemic reason for potential respondents to not respond to part or all of a survey The raw data download lists the status of each response Screen-out Partial or
Complete along with the answers to each question which allows more in-depth analysis
The question response dropoff chart
Modal bias or mode effects occur when the way in which a question is asked affects the respondentsrsquo answers in a systematic way because of how the survey is administered
All methods of conducting surveys are susceptible to modal bias In face-to-face or live phone interviews the fact that respondents are talking to live interviewers can influence how they answer questions they may want to be more agreeable in person This phenomenon is called the social desirability bias
Modal bias and survey design
How Google Surveys WorksWhite paper
Surveys
Different survey modes can also allow for different question structures In a live interview when a respondent declines to answer a question the interviewer can follow a script with follow-up questions an online platform like Google Surveys canrsquot do this For example consider an election poll that asks respondents to choose between three candidates Over the phone a live interviewer could list the three candidates and no other answer options If the respondent declines to answer the question the live interviewer can then ask a follow-up question to see if the respondent prefers a candidate not listed doesnrsquot want to answer or is undecided
This structure cannot be replicated online If only three candidate options are presented to a potential online respondent the only way to proceed is to choose one of those three candidates or drop out of the survey We could attempt to replicate the live interview structure online by adding a fourth option such as ldquoOtherrdquo or ldquoPrefer not to sayrdquo However respondents may be more likely to choose one of these alternative options when they are explicitly offered as an ldquoeasy outrdquo versus having to refuse to answer the question with a live interviewer
One way to partially mitigate this mode effect is through survey design Instead of adding ldquoOtherrdquo or ldquoPrefer not to sayrdquo options an open-ended text option can be used instead as in the Google Surveys 2016 US Election Poll22
This makes it more difficult for users to select the ldquoOtherrdquo option because they have to formulate and type out an alternative answer
Another mode effect to consider is that different question types may yield different results Results may differ if a question is formulated as a multiple-select (checkbox) question with five options versus separating that question into five individual single-select (radio button) questions A respondent may not want to check all the boxes or remember to check all the boxes whereas putting each option in a single question will encourage them to slow down and focus
22 See the Election Poll survey design at googlOA33DH
Multi-select questions can help reduce the number of questions in a survey but itrsquos important to note the effect that multiple-select questions may have on the results This is even more important when comparing the results of multiple-select questions to the results from other survey modes like live
interviews that often use single-select instead of multiple-select questions
How Google Surveys WorksWhite paper
Surveys
Katrina Sostek and Brett Slatkin are software engineers at Google The whitepaper was originally published in May 2017 All information is accurate as of June 2018 copy 2018 Google LLC All rights reserved Google and the Google logo are trademarks of Google Inc All other company and product names may be trademarks of the respective companies with which they are associated
Since launching in 2012 Google Surveys has moved from 2-question surveys to 10-question surveys expanded the publisher network and built the mobile app panel Surveys offers several advantages compared to traditional phone surveys faster cheaper results with larger sample sizes drawn from an online panel of tens of millions of potential respondents
Like all survey modes Surveys continues to face challenges from different kinds of biases mdash sampling response non-response dropoff modal mdash and we continue to improve our approaches to mitigate these biases Our work to improve our survey capabilities and accuracy is never done and wersquoll continue to refine our methodology as the landscape of respondents and technology continues to change
Privacy is very important to Google Users always have the option to pass on a survey and have the ability to opt out of the DoubleClick cookie completely Unless otherwise stated all responses are anonymous and collected in aggregate Certain surveys such as local surveys may be used to get feedback about a location recently visited and request permission for these responses to be posted publicly Google does not sell usersrsquo personal information to advertisers or anyone else For more information about the Google privacy policy please visit wwwgooglecompoliciesprivacy
Google Surveys is a member of the American Association of Public Opinion Researchrsquos (AAPOR) Transparency Initiative The initiative was founded in 2014 and establishes disclosure standards for organizations who run and publish surveys By joining the initiative Google Surveys pledges to uphold these disclosure standards when publishing results
We would like to acknowledge our fellow Google colleagues for providing insights and expertise that assisted the publication of this paper Amy Adams Harding Asfandyar Qureshi Carolin Jahn James Freeland James Pine Jon Fraser Kenneth Leftin Kevin Tudish Marisa Currie-Rose Michael Brandell Shaun Lysen and Yongwei Yang
In addition we would like to show our gratitude to Stacey Symonds and Fritz Holznagel for their guidance
Conclusion
Privacy
AAPORrsquos Transparency Initiative
Acknowledgements
Questions or comments surveys-supportgooglecom
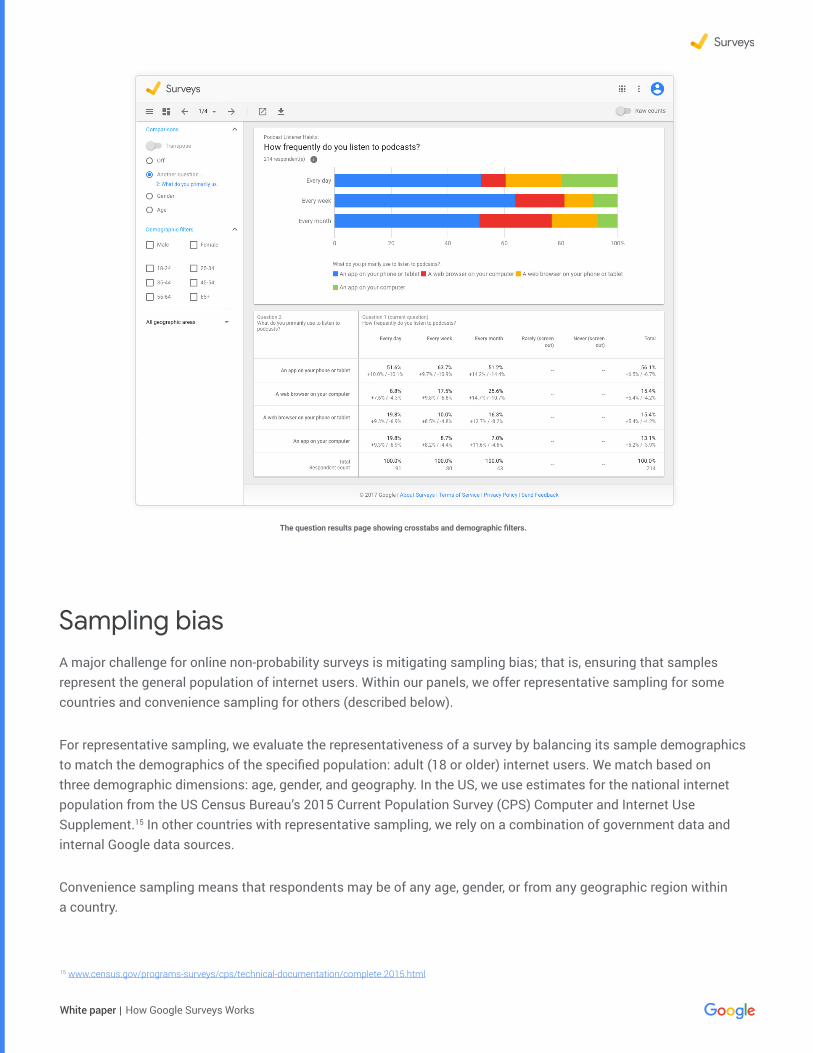
How Google Surveys WorksWhite paper
Surveys
The question results page showing crosstabs and demographic filters
A major challenge for online non-probability surveys is mitigating sampling bias that is ensuring that samples represent the general population of internet users Within our panels we offer representative sampling for some countries and convenience sampling for others (described below)
For representative sampling we evaluate the representativeness of a survey by balancing its sample demographics to match the demographics of the specified population adult (18 or older) internet users We match based on three demographic dimensions age gender and geography In the US we use estimates for the national internet population from the US Census Bureaursquos 2015 Current Population Survey (CPS) Computer and Internet Use Supplement15 In other countries with representative sampling we rely on a combination of government data and internal Google data sources
Convenience sampling means that respondents may be of any age gender or from any geographic region within a country
Sampling bias
15 wwwcensusgovprograms-surveyscpstechnical-documentationcomplete2015html
How Google Surveys WorksWhite paper
Surveys
Collecting representative samples
For countries with representative sampling Google Surveys uses a two-step process to ensure each surveyrsquos representativeness First we use stratified sampling to dynamically engage respondents with the goal of matching the demographics of the target internet population Next we apply post-stratification weighting to more closely match those same demographics of the target internet population
While a survey is collecting responses Surveys does its best to match the respondentsrsquo demographics to the internet populationrsquos demographics with the following steps
Once the survey has collected all responses the ideal actual distribution would match the target populationrsquos demographic distribution In practice however actual distributions usually differ slightly from a target populationrsquos demographic distribution This discrepancy is due to the nature of the dynamic targeting described above the availability of respondents on publisher sites at any given time and the tradeoff between finishing a survey in a reasonable amount of time and perfectly matching the distribution
A table at the bottom of each survey report shows the sampling bias how the surveyrsquos sample differs from the target internet population for gender age and geography
Calculate the target percentage of the joint distributions that is the percentage of each three-dimensional demographic group such as 18ndash24-year-old males in Idaho
Select respondents randomly within each demographic group (age x gender x state) to answer the survey We donrsquot balance responses using any additional paradata such as time of day operating system or answers to other survey questions
As responses are collected update the actual current percentage of respondents of each group in real time
If the actual and target percentages differ at any time dynamically adjust the criteria of the survey to compensate for under- or over-sampling For example if a survey has enough responses from 18ndash24-year-old males in Idaho but needs more representation from 35ndash44-year-old females in Nebraska we will show fewer surveys to 18ndash24-year-old males in Idaho and more surveys to 35ndash44-year-old females in Nebraska
1
3
2
4
How Google Surveys WorksWhite paper
Surveys
The bias table from the question results page
The Root Mean Squared Error (RMSE) score describes the square root of the mean of the squared errors across all values (eg male and female) within each dimension (gender age and geography) The larger the RMSE score the less representative the sample is of the specified population
One note about geographic representativeness Google Surveys guarantees a representative distribution of regions or states within a country whenever possible However Surveys does not guarantee geographic representativeness within a region or state mdash such as a representative balance between cities and rural areas mdash as part of its dynamic fielding and weighting schemes The publisher network does however have extensive coverage within states through its 1500+ publisher sites in which local newspapers are strongly represented
We also balance responses across different publishers by preventing any one publisher from dominating a surveyrsquos results This reduces bias from specific publishers that may focus on local topics national issues or particular subject matters This approach also limits the possibility of repeatedly sampling the same respondents for multiple surveys across our system Our system also ensures that the same respondent doesnrsquot have the opportunity to answer the same survey more than once These frequency capping measures help diversify our panel and mitigate bias towards frequent internet users
How Google Surveys WorksWhite paper
Surveys
To correct for sampling bias after the survey is run we apply weights to upweight underrepresented groups and downweight overrepresented groups This calculation is coarser than the calculation for dynamic fielding instead of matching the three-dimensional joint distributions we match each single dimension mdash the marginal distributions mdash on their own We then calculate weights using an iterative process also known as raking to reduce bias across all three dimensions16
Herersquos how raking works First we exclude all respondents with unknown demographics for age gender or geography Then we calculate weights that will match the gender breakdown to the target demographic If the target distribution is 52 female and 48 male but the actual distribution is 50 female and 50 male then we apply a weight of 52 50 = 104 to all female responses and 48 50 = 096 to all male responses
After weighting respondents by the gender dimension on its own we do the same for the age dimension on its own and then the region dimension on its own Every time we get one dimension to perfectly match the target demographic the previous dimensions will no longer exactly match We use an iterative raking technique to do 10 rounds of calculations for all three dimensions on their own17 After 10 rounds the weights will approach convergence and all three dimensions will closely match their targets
The weights in each survey are calculated based on the first question We use the first question for weighting because thatrsquos the only question we can assume should match the target populationrsquos demographic distribution
For example if the first question is a screening question that asks ldquoWhat is your genderrdquo and only respondents who answer ldquomalerdquo screen through to the second question we wouldnrsquot want to match the second question to 52 female and 48 male it will always be 100 male
Even if the first question isnrsquot a screening question respondents may drop off throughout the survey in a way that is skewed towards one demographic group due to the design of the survey Thus we weight responses to follow-up questions by taking the first-question weights filtering them to only those who answered the follow-up question and renormalizing so that the sum of the weights equals the total number of responses to the follow-up question
Weighting
16 Google Surveys moved to a raking methodology in October 2016 The previous methodology is explained in the original whitepaper wwwgooglecominsightsconsumersurveysstaticconsumer_surveys_whitepaperpdf17 enwikipediaorgwikiIterative_proportional_fitting
How Google Surveys WorksWhite paper
Surveys
In the survey results the values displayed in the error bars represent the modeled margin of error This means that if we repeat this survey many times in the same way 95 of the time the resulting range of values would contain the true value
We follow the Pew Research Center in using the term ldquomodeled margin of errorrdquo to differentiate from the statistical term ldquomargin of errorrdquo which only applies to true probability-based samples18 Because Google Surveys collects online non-probability samples the margin of error calculation is based on assumptions about the Surveys sampling model and what would happen if we repeated the same sampling process many times
We use the Modified (or ad hoc) Wilson method to calculate the error bars which can be asymmetrical eg +18-16 The Wilson method works well for small sample sizes as well as extreme probabilities (close to 0 or 100)19 We follow the Modified Wilson calculation using effective sample size as shown in Applied Survey Data Analysis20 The calculation is the same as the Wilson method but uses n = p(1 - p) var(p) in place of n21
Error bars
A question report page showing error bars and the modeled margin of error
In this example the modeled margin of error for Basketball is +18-16 The range of values is 124 to 158 ie 14 adjusted by the modeled
margin of error
Four factors influence and can reduce the size of the modeled
margin of error
1 Larger sample sizes
2 Percentages closer to the extremes of 0 or 100
3 Lower confidence levels (we use a 95 confidence level)
4 Lower variability of weights
18 wwwpewresearchorg20180126variability-of-survey-estimates19 Dean Natalie and Pagano Marcello 2015 ldquoEvaluating Confidence Interval Methods for Binomial Proportions in Clustered Surveysrdquo Journal of Survey Statistics and Methodology 3 (4) 484-503 doiorg101093jssamsmv02420 Heeringa Steven G West Brady T and Berglund Patricia A 2017 Applied Survey Data Analysis Second Edition 16521 enwikipediaorgwikiBinomial_proportion_confidence_intervalWilson_score_interval
Surveys may be subject to other sources of biases and errors including mdash but not limited to mdash sampling and nonresponse as discussed in more detail below
How Google Surveys WorksWhite paper
Surveys
The way we determine respondent demographics differs by survey panel
The mobile app is the simpler of the two panels We ask users to self-report their age gender and zipcode when they sign up to use the app We periodically ask these questions again to refresh the panelistsrsquo demographics in case they have changed
The publisher network uses inferred demographics which means that we donrsquot explicitly ask the panelists for their demographics We do this to minimize the number of questions in a survey which offers a better respondent experience and encourages higher response rates Any researcher who doesnrsquot want to rely on inferred demographics can explicitly add demographic questions to their surveys However our dynamic fielding and weighting process to match ground-truth data will still be based on inferred demographics
Like many ads on the web Google Surveys infers the age and gender of anonymous respondents based on browsing behavior and geography based on IP addresses Users can opt out of inferred demographics in the Ads Settings which applies across Google ads services the 2M+ sites and apps that partner with Google to show ads and Google Surveys In the case of Surveys opting out means that usersrsquo demographics will show as unknown and their responses will be excluded from weighted results For all users unless otherwise stated responses are anonymous and collected in aggregate
How we know age gender and region
In addition to sampling bias Google Surveys monitors and mitigates other kinds of bias
Response non-response and modal bias
Response bias is the bias from inattentive or untruthful answers to questions
The publisher network and mobile app have different kinds of inattentive or untruthful responses Respondents on the publisher network are intercepted while trying to view content online so they do not necessarily want to answer a survey and may just want to see that content The mobile app has the opposite problem where users want to answer as many surveys as possible because they voluntarily opted into the mobile panel out of a desire to answer surveys and earn rewards
Another source of low-quality responses from both the publisher network and the mobile app is open-ended text questions Respondents may respond with gibberish profanity or something like ldquoI hate surveysrdquo These types of answers are removed from the surveyrsquos results using common natural language processing libraries employed across Google
Response bias
How Google Surveys WorksWhite paper
Surveys
Google Surveys tracks investigates and removes multiple kinds of low-quality responses and respondents If low-quality responses are dropped from a survey the survey will remain in the field to collect more responses to make up for the sample that is now missing If chronically inattentive or untruthful respondents are detected they may be prevented from getting any more surveys in the future
Potential responses to a survey can fall into several categories non-response screen-out response partial response or complete response These categories are illustrated below
Non-response bias occurs when a group of people in the sample choose not to respond to the survey in a systematic way which can cause the omission of that grouprsquos opinions Non-responses can come from people who donrsquot like answering surveys in general or are alienated by the first question in some way Unfortunately it can be difficult to ask non-respondents why they chose not to respond because they are unlikely to respond
Respondents may also choose to stop answering questions midway through a survey These partial responses can introduce dropoff bias perhaps an overly-specific question turns off respondents or respondents could drop off towards the end of a long survey For example if a survey is about an extremely specific topic like equestrian equipment then people who are uninterested or uninformed about equestrian equipment may stop answering partway through
Non-response and dropoff bias
QUESTION 2 CATEGORYPOTENTIALRESPONDENT
Person 2
Person 3
Person 4
Person 5
Do you have afavorite letter
ldquoNordquo
ldquoYesrdquo
ldquoYesrdquo
ldquoYesrdquo
ldquoBrdquo
ldquoPrdquo ldquoZrdquo
What is yourfavorite letter
What is your secondfavorite letter
Non-response
Screen-outResponse
PartialResponse
PartialResponse
CompleteResponse
QUESTION 1 QUESTION 3
Person 1 skips the survey
screens out
drops out
drops out
The different categories of potential responses
How Google Surveys WorksWhite paper
Surveys
In a surveyrsquos report page we display the question response dropoff pattern
Researchers may want to investigate if therersquos a systemic reason for potential respondents to not respond to part or all of a survey The raw data download lists the status of each response Screen-out Partial or
Complete along with the answers to each question which allows more in-depth analysis
The question response dropoff chart
Modal bias or mode effects occur when the way in which a question is asked affects the respondentsrsquo answers in a systematic way because of how the survey is administered
All methods of conducting surveys are susceptible to modal bias In face-to-face or live phone interviews the fact that respondents are talking to live interviewers can influence how they answer questions they may want to be more agreeable in person This phenomenon is called the social desirability bias
Modal bias and survey design
How Google Surveys WorksWhite paper
Surveys
Different survey modes can also allow for different question structures In a live interview when a respondent declines to answer a question the interviewer can follow a script with follow-up questions an online platform like Google Surveys canrsquot do this For example consider an election poll that asks respondents to choose between three candidates Over the phone a live interviewer could list the three candidates and no other answer options If the respondent declines to answer the question the live interviewer can then ask a follow-up question to see if the respondent prefers a candidate not listed doesnrsquot want to answer or is undecided
This structure cannot be replicated online If only three candidate options are presented to a potential online respondent the only way to proceed is to choose one of those three candidates or drop out of the survey We could attempt to replicate the live interview structure online by adding a fourth option such as ldquoOtherrdquo or ldquoPrefer not to sayrdquo However respondents may be more likely to choose one of these alternative options when they are explicitly offered as an ldquoeasy outrdquo versus having to refuse to answer the question with a live interviewer
One way to partially mitigate this mode effect is through survey design Instead of adding ldquoOtherrdquo or ldquoPrefer not to sayrdquo options an open-ended text option can be used instead as in the Google Surveys 2016 US Election Poll22
This makes it more difficult for users to select the ldquoOtherrdquo option because they have to formulate and type out an alternative answer
Another mode effect to consider is that different question types may yield different results Results may differ if a question is formulated as a multiple-select (checkbox) question with five options versus separating that question into five individual single-select (radio button) questions A respondent may not want to check all the boxes or remember to check all the boxes whereas putting each option in a single question will encourage them to slow down and focus
22 See the Election Poll survey design at googlOA33DH
Multi-select questions can help reduce the number of questions in a survey but itrsquos important to note the effect that multiple-select questions may have on the results This is even more important when comparing the results of multiple-select questions to the results from other survey modes like live
interviews that often use single-select instead of multiple-select questions
How Google Surveys WorksWhite paper
Surveys
Katrina Sostek and Brett Slatkin are software engineers at Google The whitepaper was originally published in May 2017 All information is accurate as of June 2018 copy 2018 Google LLC All rights reserved Google and the Google logo are trademarks of Google Inc All other company and product names may be trademarks of the respective companies with which they are associated
Since launching in 2012 Google Surveys has moved from 2-question surveys to 10-question surveys expanded the publisher network and built the mobile app panel Surveys offers several advantages compared to traditional phone surveys faster cheaper results with larger sample sizes drawn from an online panel of tens of millions of potential respondents
Like all survey modes Surveys continues to face challenges from different kinds of biases mdash sampling response non-response dropoff modal mdash and we continue to improve our approaches to mitigate these biases Our work to improve our survey capabilities and accuracy is never done and wersquoll continue to refine our methodology as the landscape of respondents and technology continues to change
Privacy is very important to Google Users always have the option to pass on a survey and have the ability to opt out of the DoubleClick cookie completely Unless otherwise stated all responses are anonymous and collected in aggregate Certain surveys such as local surveys may be used to get feedback about a location recently visited and request permission for these responses to be posted publicly Google does not sell usersrsquo personal information to advertisers or anyone else For more information about the Google privacy policy please visit wwwgooglecompoliciesprivacy
Google Surveys is a member of the American Association of Public Opinion Researchrsquos (AAPOR) Transparency Initiative The initiative was founded in 2014 and establishes disclosure standards for organizations who run and publish surveys By joining the initiative Google Surveys pledges to uphold these disclosure standards when publishing results
We would like to acknowledge our fellow Google colleagues for providing insights and expertise that assisted the publication of this paper Amy Adams Harding Asfandyar Qureshi Carolin Jahn James Freeland James Pine Jon Fraser Kenneth Leftin Kevin Tudish Marisa Currie-Rose Michael Brandell Shaun Lysen and Yongwei Yang
In addition we would like to show our gratitude to Stacey Symonds and Fritz Holznagel for their guidance
Conclusion
Privacy
AAPORrsquos Transparency Initiative
Acknowledgements
Questions or comments surveys-supportgooglecom
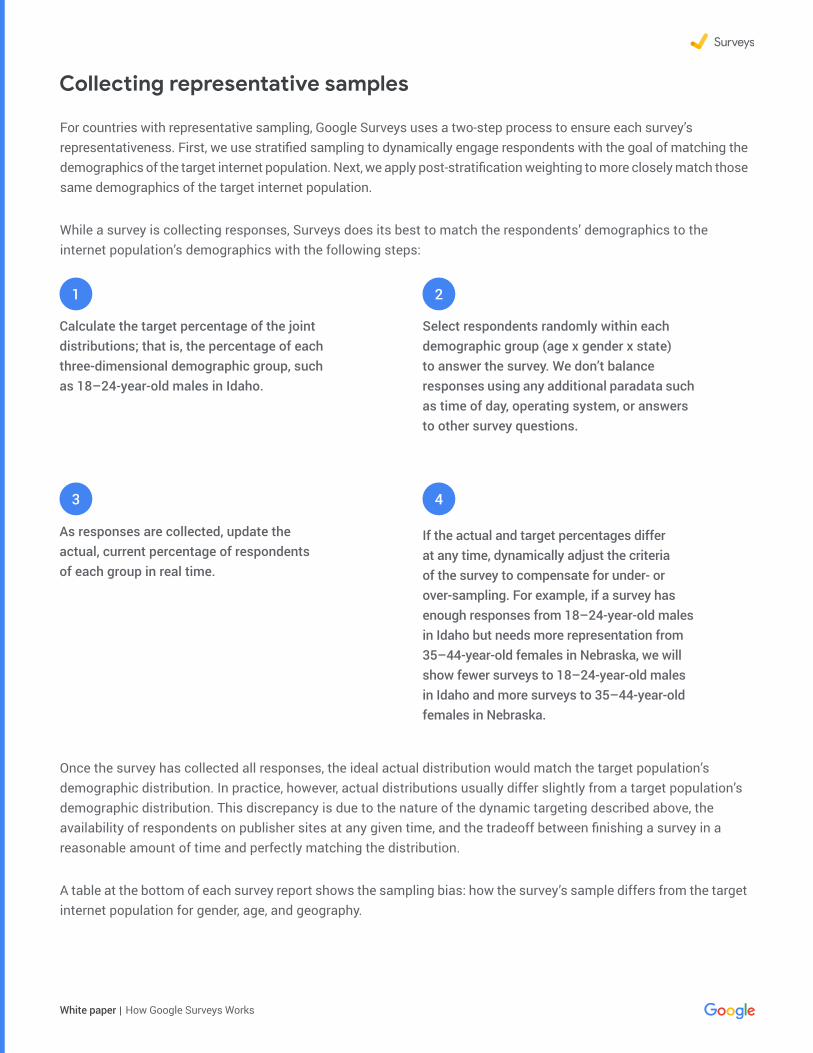
How Google Surveys WorksWhite paper
Surveys
Collecting representative samples
For countries with representative sampling Google Surveys uses a two-step process to ensure each surveyrsquos representativeness First we use stratified sampling to dynamically engage respondents with the goal of matching the demographics of the target internet population Next we apply post-stratification weighting to more closely match those same demographics of the target internet population
While a survey is collecting responses Surveys does its best to match the respondentsrsquo demographics to the internet populationrsquos demographics with the following steps
Once the survey has collected all responses the ideal actual distribution would match the target populationrsquos demographic distribution In practice however actual distributions usually differ slightly from a target populationrsquos demographic distribution This discrepancy is due to the nature of the dynamic targeting described above the availability of respondents on publisher sites at any given time and the tradeoff between finishing a survey in a reasonable amount of time and perfectly matching the distribution
A table at the bottom of each survey report shows the sampling bias how the surveyrsquos sample differs from the target internet population for gender age and geography
Calculate the target percentage of the joint distributions that is the percentage of each three-dimensional demographic group such as 18ndash24-year-old males in Idaho
Select respondents randomly within each demographic group (age x gender x state) to answer the survey We donrsquot balance responses using any additional paradata such as time of day operating system or answers to other survey questions
As responses are collected update the actual current percentage of respondents of each group in real time
If the actual and target percentages differ at any time dynamically adjust the criteria of the survey to compensate for under- or over-sampling For example if a survey has enough responses from 18ndash24-year-old males in Idaho but needs more representation from 35ndash44-year-old females in Nebraska we will show fewer surveys to 18ndash24-year-old males in Idaho and more surveys to 35ndash44-year-old females in Nebraska
1
3
2
4
How Google Surveys WorksWhite paper
Surveys
The bias table from the question results page
The Root Mean Squared Error (RMSE) score describes the square root of the mean of the squared errors across all values (eg male and female) within each dimension (gender age and geography) The larger the RMSE score the less representative the sample is of the specified population
One note about geographic representativeness Google Surveys guarantees a representative distribution of regions or states within a country whenever possible However Surveys does not guarantee geographic representativeness within a region or state mdash such as a representative balance between cities and rural areas mdash as part of its dynamic fielding and weighting schemes The publisher network does however have extensive coverage within states through its 1500+ publisher sites in which local newspapers are strongly represented
We also balance responses across different publishers by preventing any one publisher from dominating a surveyrsquos results This reduces bias from specific publishers that may focus on local topics national issues or particular subject matters This approach also limits the possibility of repeatedly sampling the same respondents for multiple surveys across our system Our system also ensures that the same respondent doesnrsquot have the opportunity to answer the same survey more than once These frequency capping measures help diversify our panel and mitigate bias towards frequent internet users
How Google Surveys WorksWhite paper
Surveys
To correct for sampling bias after the survey is run we apply weights to upweight underrepresented groups and downweight overrepresented groups This calculation is coarser than the calculation for dynamic fielding instead of matching the three-dimensional joint distributions we match each single dimension mdash the marginal distributions mdash on their own We then calculate weights using an iterative process also known as raking to reduce bias across all three dimensions16
Herersquos how raking works First we exclude all respondents with unknown demographics for age gender or geography Then we calculate weights that will match the gender breakdown to the target demographic If the target distribution is 52 female and 48 male but the actual distribution is 50 female and 50 male then we apply a weight of 52 50 = 104 to all female responses and 48 50 = 096 to all male responses
After weighting respondents by the gender dimension on its own we do the same for the age dimension on its own and then the region dimension on its own Every time we get one dimension to perfectly match the target demographic the previous dimensions will no longer exactly match We use an iterative raking technique to do 10 rounds of calculations for all three dimensions on their own17 After 10 rounds the weights will approach convergence and all three dimensions will closely match their targets
The weights in each survey are calculated based on the first question We use the first question for weighting because thatrsquos the only question we can assume should match the target populationrsquos demographic distribution
For example if the first question is a screening question that asks ldquoWhat is your genderrdquo and only respondents who answer ldquomalerdquo screen through to the second question we wouldnrsquot want to match the second question to 52 female and 48 male it will always be 100 male
Even if the first question isnrsquot a screening question respondents may drop off throughout the survey in a way that is skewed towards one demographic group due to the design of the survey Thus we weight responses to follow-up questions by taking the first-question weights filtering them to only those who answered the follow-up question and renormalizing so that the sum of the weights equals the total number of responses to the follow-up question
Weighting
16 Google Surveys moved to a raking methodology in October 2016 The previous methodology is explained in the original whitepaper wwwgooglecominsightsconsumersurveysstaticconsumer_surveys_whitepaperpdf17 enwikipediaorgwikiIterative_proportional_fitting
How Google Surveys WorksWhite paper
Surveys
In the survey results the values displayed in the error bars represent the modeled margin of error This means that if we repeat this survey many times in the same way 95 of the time the resulting range of values would contain the true value
We follow the Pew Research Center in using the term ldquomodeled margin of errorrdquo to differentiate from the statistical term ldquomargin of errorrdquo which only applies to true probability-based samples18 Because Google Surveys collects online non-probability samples the margin of error calculation is based on assumptions about the Surveys sampling model and what would happen if we repeated the same sampling process many times
We use the Modified (or ad hoc) Wilson method to calculate the error bars which can be asymmetrical eg +18-16 The Wilson method works well for small sample sizes as well as extreme probabilities (close to 0 or 100)19 We follow the Modified Wilson calculation using effective sample size as shown in Applied Survey Data Analysis20 The calculation is the same as the Wilson method but uses n = p(1 - p) var(p) in place of n21
Error bars
A question report page showing error bars and the modeled margin of error
In this example the modeled margin of error for Basketball is +18-16 The range of values is 124 to 158 ie 14 adjusted by the modeled
margin of error
Four factors influence and can reduce the size of the modeled
margin of error
1 Larger sample sizes
2 Percentages closer to the extremes of 0 or 100
3 Lower confidence levels (we use a 95 confidence level)
4 Lower variability of weights
18 wwwpewresearchorg20180126variability-of-survey-estimates19 Dean Natalie and Pagano Marcello 2015 ldquoEvaluating Confidence Interval Methods for Binomial Proportions in Clustered Surveysrdquo Journal of Survey Statistics and Methodology 3 (4) 484-503 doiorg101093jssamsmv02420 Heeringa Steven G West Brady T and Berglund Patricia A 2017 Applied Survey Data Analysis Second Edition 16521 enwikipediaorgwikiBinomial_proportion_confidence_intervalWilson_score_interval
Surveys may be subject to other sources of biases and errors including mdash but not limited to mdash sampling and nonresponse as discussed in more detail below
How Google Surveys WorksWhite paper
Surveys
The way we determine respondent demographics differs by survey panel
The mobile app is the simpler of the two panels We ask users to self-report their age gender and zipcode when they sign up to use the app We periodically ask these questions again to refresh the panelistsrsquo demographics in case they have changed
The publisher network uses inferred demographics which means that we donrsquot explicitly ask the panelists for their demographics We do this to minimize the number of questions in a survey which offers a better respondent experience and encourages higher response rates Any researcher who doesnrsquot want to rely on inferred demographics can explicitly add demographic questions to their surveys However our dynamic fielding and weighting process to match ground-truth data will still be based on inferred demographics
Like many ads on the web Google Surveys infers the age and gender of anonymous respondents based on browsing behavior and geography based on IP addresses Users can opt out of inferred demographics in the Ads Settings which applies across Google ads services the 2M+ sites and apps that partner with Google to show ads and Google Surveys In the case of Surveys opting out means that usersrsquo demographics will show as unknown and their responses will be excluded from weighted results For all users unless otherwise stated responses are anonymous and collected in aggregate
How we know age gender and region
In addition to sampling bias Google Surveys monitors and mitigates other kinds of bias
Response non-response and modal bias
Response bias is the bias from inattentive or untruthful answers to questions
The publisher network and mobile app have different kinds of inattentive or untruthful responses Respondents on the publisher network are intercepted while trying to view content online so they do not necessarily want to answer a survey and may just want to see that content The mobile app has the opposite problem where users want to answer as many surveys as possible because they voluntarily opted into the mobile panel out of a desire to answer surveys and earn rewards
Another source of low-quality responses from both the publisher network and the mobile app is open-ended text questions Respondents may respond with gibberish profanity or something like ldquoI hate surveysrdquo These types of answers are removed from the surveyrsquos results using common natural language processing libraries employed across Google
Response bias
How Google Surveys WorksWhite paper
Surveys
Google Surveys tracks investigates and removes multiple kinds of low-quality responses and respondents If low-quality responses are dropped from a survey the survey will remain in the field to collect more responses to make up for the sample that is now missing If chronically inattentive or untruthful respondents are detected they may be prevented from getting any more surveys in the future
Potential responses to a survey can fall into several categories non-response screen-out response partial response or complete response These categories are illustrated below
Non-response bias occurs when a group of people in the sample choose not to respond to the survey in a systematic way which can cause the omission of that grouprsquos opinions Non-responses can come from people who donrsquot like answering surveys in general or are alienated by the first question in some way Unfortunately it can be difficult to ask non-respondents why they chose not to respond because they are unlikely to respond
Respondents may also choose to stop answering questions midway through a survey These partial responses can introduce dropoff bias perhaps an overly-specific question turns off respondents or respondents could drop off towards the end of a long survey For example if a survey is about an extremely specific topic like equestrian equipment then people who are uninterested or uninformed about equestrian equipment may stop answering partway through
Non-response and dropoff bias
QUESTION 2 CATEGORYPOTENTIALRESPONDENT
Person 2
Person 3
Person 4
Person 5
Do you have afavorite letter
ldquoNordquo
ldquoYesrdquo
ldquoYesrdquo
ldquoYesrdquo
ldquoBrdquo
ldquoPrdquo ldquoZrdquo
What is yourfavorite letter
What is your secondfavorite letter
Non-response
Screen-outResponse
PartialResponse
PartialResponse
CompleteResponse
QUESTION 1 QUESTION 3
Person 1 skips the survey
screens out
drops out
drops out
The different categories of potential responses
How Google Surveys WorksWhite paper
Surveys
In a surveyrsquos report page we display the question response dropoff pattern
Researchers may want to investigate if therersquos a systemic reason for potential respondents to not respond to part or all of a survey The raw data download lists the status of each response Screen-out Partial or
Complete along with the answers to each question which allows more in-depth analysis
The question response dropoff chart
Modal bias or mode effects occur when the way in which a question is asked affects the respondentsrsquo answers in a systematic way because of how the survey is administered
All methods of conducting surveys are susceptible to modal bias In face-to-face or live phone interviews the fact that respondents are talking to live interviewers can influence how they answer questions they may want to be more agreeable in person This phenomenon is called the social desirability bias
Modal bias and survey design
How Google Surveys WorksWhite paper
Surveys
Different survey modes can also allow for different question structures In a live interview when a respondent declines to answer a question the interviewer can follow a script with follow-up questions an online platform like Google Surveys canrsquot do this For example consider an election poll that asks respondents to choose between three candidates Over the phone a live interviewer could list the three candidates and no other answer options If the respondent declines to answer the question the live interviewer can then ask a follow-up question to see if the respondent prefers a candidate not listed doesnrsquot want to answer or is undecided
This structure cannot be replicated online If only three candidate options are presented to a potential online respondent the only way to proceed is to choose one of those three candidates or drop out of the survey We could attempt to replicate the live interview structure online by adding a fourth option such as ldquoOtherrdquo or ldquoPrefer not to sayrdquo However respondents may be more likely to choose one of these alternative options when they are explicitly offered as an ldquoeasy outrdquo versus having to refuse to answer the question with a live interviewer
One way to partially mitigate this mode effect is through survey design Instead of adding ldquoOtherrdquo or ldquoPrefer not to sayrdquo options an open-ended text option can be used instead as in the Google Surveys 2016 US Election Poll22
This makes it more difficult for users to select the ldquoOtherrdquo option because they have to formulate and type out an alternative answer
Another mode effect to consider is that different question types may yield different results Results may differ if a question is formulated as a multiple-select (checkbox) question with five options versus separating that question into five individual single-select (radio button) questions A respondent may not want to check all the boxes or remember to check all the boxes whereas putting each option in a single question will encourage them to slow down and focus
22 See the Election Poll survey design at googlOA33DH
Multi-select questions can help reduce the number of questions in a survey but itrsquos important to note the effect that multiple-select questions may have on the results This is even more important when comparing the results of multiple-select questions to the results from other survey modes like live
interviews that often use single-select instead of multiple-select questions
How Google Surveys WorksWhite paper
Surveys
Katrina Sostek and Brett Slatkin are software engineers at Google The whitepaper was originally published in May 2017 All information is accurate as of June 2018 copy 2018 Google LLC All rights reserved Google and the Google logo are trademarks of Google Inc All other company and product names may be trademarks of the respective companies with which they are associated
Since launching in 2012 Google Surveys has moved from 2-question surveys to 10-question surveys expanded the publisher network and built the mobile app panel Surveys offers several advantages compared to traditional phone surveys faster cheaper results with larger sample sizes drawn from an online panel of tens of millions of potential respondents
Like all survey modes Surveys continues to face challenges from different kinds of biases mdash sampling response non-response dropoff modal mdash and we continue to improve our approaches to mitigate these biases Our work to improve our survey capabilities and accuracy is never done and wersquoll continue to refine our methodology as the landscape of respondents and technology continues to change
Privacy is very important to Google Users always have the option to pass on a survey and have the ability to opt out of the DoubleClick cookie completely Unless otherwise stated all responses are anonymous and collected in aggregate Certain surveys such as local surveys may be used to get feedback about a location recently visited and request permission for these responses to be posted publicly Google does not sell usersrsquo personal information to advertisers or anyone else For more information about the Google privacy policy please visit wwwgooglecompoliciesprivacy
Google Surveys is a member of the American Association of Public Opinion Researchrsquos (AAPOR) Transparency Initiative The initiative was founded in 2014 and establishes disclosure standards for organizations who run and publish surveys By joining the initiative Google Surveys pledges to uphold these disclosure standards when publishing results
We would like to acknowledge our fellow Google colleagues for providing insights and expertise that assisted the publication of this paper Amy Adams Harding Asfandyar Qureshi Carolin Jahn James Freeland James Pine Jon Fraser Kenneth Leftin Kevin Tudish Marisa Currie-Rose Michael Brandell Shaun Lysen and Yongwei Yang
In addition we would like to show our gratitude to Stacey Symonds and Fritz Holznagel for their guidance
Conclusion
Privacy
AAPORrsquos Transparency Initiative
Acknowledgements
Questions or comments surveys-supportgooglecom
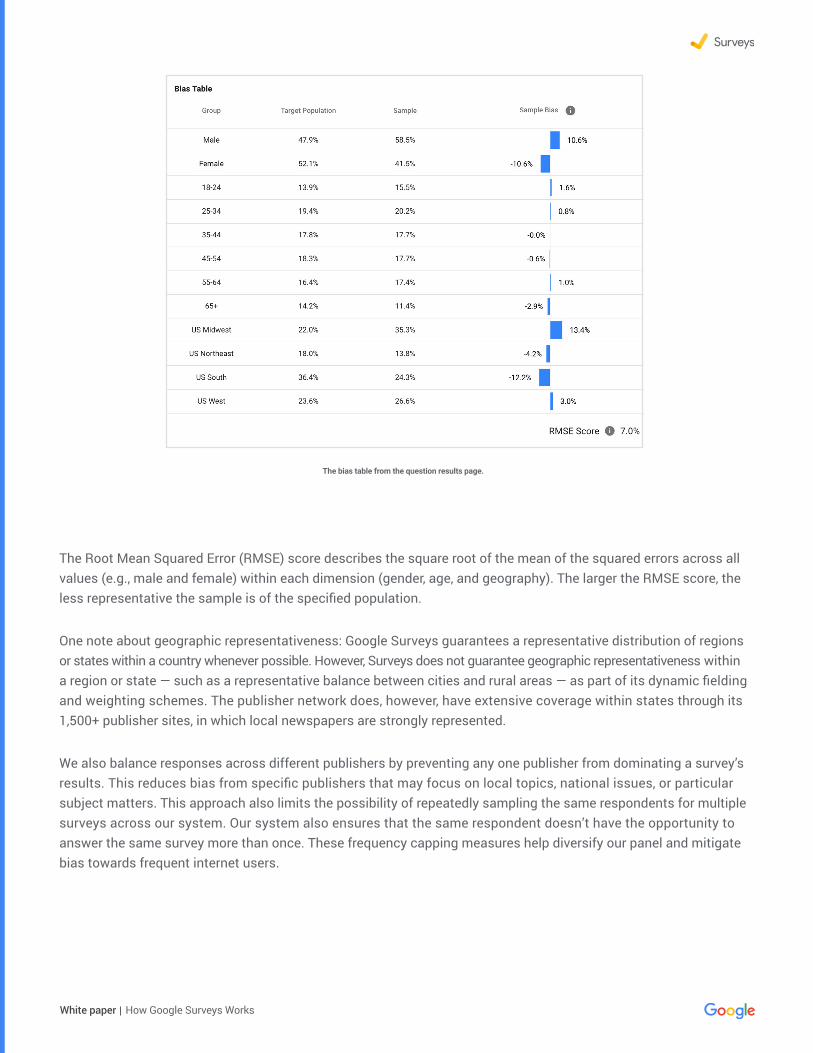
How Google Surveys WorksWhite paper
Surveys
The bias table from the question results page
The Root Mean Squared Error (RMSE) score describes the square root of the mean of the squared errors across all values (eg male and female) within each dimension (gender age and geography) The larger the RMSE score the less representative the sample is of the specified population
One note about geographic representativeness Google Surveys guarantees a representative distribution of regions or states within a country whenever possible However Surveys does not guarantee geographic representativeness within a region or state mdash such as a representative balance between cities and rural areas mdash as part of its dynamic fielding and weighting schemes The publisher network does however have extensive coverage within states through its 1500+ publisher sites in which local newspapers are strongly represented
We also balance responses across different publishers by preventing any one publisher from dominating a surveyrsquos results This reduces bias from specific publishers that may focus on local topics national issues or particular subject matters This approach also limits the possibility of repeatedly sampling the same respondents for multiple surveys across our system Our system also ensures that the same respondent doesnrsquot have the opportunity to answer the same survey more than once These frequency capping measures help diversify our panel and mitigate bias towards frequent internet users
How Google Surveys WorksWhite paper
Surveys
To correct for sampling bias after the survey is run we apply weights to upweight underrepresented groups and downweight overrepresented groups This calculation is coarser than the calculation for dynamic fielding instead of matching the three-dimensional joint distributions we match each single dimension mdash the marginal distributions mdash on their own We then calculate weights using an iterative process also known as raking to reduce bias across all three dimensions16
Herersquos how raking works First we exclude all respondents with unknown demographics for age gender or geography Then we calculate weights that will match the gender breakdown to the target demographic If the target distribution is 52 female and 48 male but the actual distribution is 50 female and 50 male then we apply a weight of 52 50 = 104 to all female responses and 48 50 = 096 to all male responses
After weighting respondents by the gender dimension on its own we do the same for the age dimension on its own and then the region dimension on its own Every time we get one dimension to perfectly match the target demographic the previous dimensions will no longer exactly match We use an iterative raking technique to do 10 rounds of calculations for all three dimensions on their own17 After 10 rounds the weights will approach convergence and all three dimensions will closely match their targets
The weights in each survey are calculated based on the first question We use the first question for weighting because thatrsquos the only question we can assume should match the target populationrsquos demographic distribution
For example if the first question is a screening question that asks ldquoWhat is your genderrdquo and only respondents who answer ldquomalerdquo screen through to the second question we wouldnrsquot want to match the second question to 52 female and 48 male it will always be 100 male
Even if the first question isnrsquot a screening question respondents may drop off throughout the survey in a way that is skewed towards one demographic group due to the design of the survey Thus we weight responses to follow-up questions by taking the first-question weights filtering them to only those who answered the follow-up question and renormalizing so that the sum of the weights equals the total number of responses to the follow-up question
Weighting
16 Google Surveys moved to a raking methodology in October 2016 The previous methodology is explained in the original whitepaper wwwgooglecominsightsconsumersurveysstaticconsumer_surveys_whitepaperpdf17 enwikipediaorgwikiIterative_proportional_fitting
How Google Surveys WorksWhite paper
Surveys
In the survey results the values displayed in the error bars represent the modeled margin of error This means that if we repeat this survey many times in the same way 95 of the time the resulting range of values would contain the true value
We follow the Pew Research Center in using the term ldquomodeled margin of errorrdquo to differentiate from the statistical term ldquomargin of errorrdquo which only applies to true probability-based samples18 Because Google Surveys collects online non-probability samples the margin of error calculation is based on assumptions about the Surveys sampling model and what would happen if we repeated the same sampling process many times
We use the Modified (or ad hoc) Wilson method to calculate the error bars which can be asymmetrical eg +18-16 The Wilson method works well for small sample sizes as well as extreme probabilities (close to 0 or 100)19 We follow the Modified Wilson calculation using effective sample size as shown in Applied Survey Data Analysis20 The calculation is the same as the Wilson method but uses n = p(1 - p) var(p) in place of n21
Error bars
A question report page showing error bars and the modeled margin of error
In this example the modeled margin of error for Basketball is +18-16 The range of values is 124 to 158 ie 14 adjusted by the modeled
margin of error
Four factors influence and can reduce the size of the modeled
margin of error
1 Larger sample sizes
2 Percentages closer to the extremes of 0 or 100
3 Lower confidence levels (we use a 95 confidence level)
4 Lower variability of weights
18 wwwpewresearchorg20180126variability-of-survey-estimates19 Dean Natalie and Pagano Marcello 2015 ldquoEvaluating Confidence Interval Methods for Binomial Proportions in Clustered Surveysrdquo Journal of Survey Statistics and Methodology 3 (4) 484-503 doiorg101093jssamsmv02420 Heeringa Steven G West Brady T and Berglund Patricia A 2017 Applied Survey Data Analysis Second Edition 16521 enwikipediaorgwikiBinomial_proportion_confidence_intervalWilson_score_interval
Surveys may be subject to other sources of biases and errors including mdash but not limited to mdash sampling and nonresponse as discussed in more detail below
How Google Surveys WorksWhite paper
Surveys
The way we determine respondent demographics differs by survey panel
The mobile app is the simpler of the two panels We ask users to self-report their age gender and zipcode when they sign up to use the app We periodically ask these questions again to refresh the panelistsrsquo demographics in case they have changed
The publisher network uses inferred demographics which means that we donrsquot explicitly ask the panelists for their demographics We do this to minimize the number of questions in a survey which offers a better respondent experience and encourages higher response rates Any researcher who doesnrsquot want to rely on inferred demographics can explicitly add demographic questions to their surveys However our dynamic fielding and weighting process to match ground-truth data will still be based on inferred demographics
Like many ads on the web Google Surveys infers the age and gender of anonymous respondents based on browsing behavior and geography based on IP addresses Users can opt out of inferred demographics in the Ads Settings which applies across Google ads services the 2M+ sites and apps that partner with Google to show ads and Google Surveys In the case of Surveys opting out means that usersrsquo demographics will show as unknown and their responses will be excluded from weighted results For all users unless otherwise stated responses are anonymous and collected in aggregate
How we know age gender and region
In addition to sampling bias Google Surveys monitors and mitigates other kinds of bias
Response non-response and modal bias
Response bias is the bias from inattentive or untruthful answers to questions
The publisher network and mobile app have different kinds of inattentive or untruthful responses Respondents on the publisher network are intercepted while trying to view content online so they do not necessarily want to answer a survey and may just want to see that content The mobile app has the opposite problem where users want to answer as many surveys as possible because they voluntarily opted into the mobile panel out of a desire to answer surveys and earn rewards
Another source of low-quality responses from both the publisher network and the mobile app is open-ended text questions Respondents may respond with gibberish profanity or something like ldquoI hate surveysrdquo These types of answers are removed from the surveyrsquos results using common natural language processing libraries employed across Google
Response bias
How Google Surveys WorksWhite paper
Surveys
Google Surveys tracks investigates and removes multiple kinds of low-quality responses and respondents If low-quality responses are dropped from a survey the survey will remain in the field to collect more responses to make up for the sample that is now missing If chronically inattentive or untruthful respondents are detected they may be prevented from getting any more surveys in the future
Potential responses to a survey can fall into several categories non-response screen-out response partial response or complete response These categories are illustrated below
Non-response bias occurs when a group of people in the sample choose not to respond to the survey in a systematic way which can cause the omission of that grouprsquos opinions Non-responses can come from people who donrsquot like answering surveys in general or are alienated by the first question in some way Unfortunately it can be difficult to ask non-respondents why they chose not to respond because they are unlikely to respond
Respondents may also choose to stop answering questions midway through a survey These partial responses can introduce dropoff bias perhaps an overly-specific question turns off respondents or respondents could drop off towards the end of a long survey For example if a survey is about an extremely specific topic like equestrian equipment then people who are uninterested or uninformed about equestrian equipment may stop answering partway through
Non-response and dropoff bias
QUESTION 2 CATEGORYPOTENTIALRESPONDENT
Person 2
Person 3
Person 4
Person 5
Do you have afavorite letter
ldquoNordquo
ldquoYesrdquo
ldquoYesrdquo
ldquoYesrdquo
ldquoBrdquo
ldquoPrdquo ldquoZrdquo
What is yourfavorite letter
What is your secondfavorite letter
Non-response
Screen-outResponse
PartialResponse
PartialResponse
CompleteResponse
QUESTION 1 QUESTION 3
Person 1 skips the survey
screens out
drops out
drops out
The different categories of potential responses
How Google Surveys WorksWhite paper
Surveys
In a surveyrsquos report page we display the question response dropoff pattern
Researchers may want to investigate if therersquos a systemic reason for potential respondents to not respond to part or all of a survey The raw data download lists the status of each response Screen-out Partial or
Complete along with the answers to each question which allows more in-depth analysis
The question response dropoff chart
Modal bias or mode effects occur when the way in which a question is asked affects the respondentsrsquo answers in a systematic way because of how the survey is administered
All methods of conducting surveys are susceptible to modal bias In face-to-face or live phone interviews the fact that respondents are talking to live interviewers can influence how they answer questions they may want to be more agreeable in person This phenomenon is called the social desirability bias
Modal bias and survey design
How Google Surveys WorksWhite paper
Surveys
Different survey modes can also allow for different question structures In a live interview when a respondent declines to answer a question the interviewer can follow a script with follow-up questions an online platform like Google Surveys canrsquot do this For example consider an election poll that asks respondents to choose between three candidates Over the phone a live interviewer could list the three candidates and no other answer options If the respondent declines to answer the question the live interviewer can then ask a follow-up question to see if the respondent prefers a candidate not listed doesnrsquot want to answer or is undecided
This structure cannot be replicated online If only three candidate options are presented to a potential online respondent the only way to proceed is to choose one of those three candidates or drop out of the survey We could attempt to replicate the live interview structure online by adding a fourth option such as ldquoOtherrdquo or ldquoPrefer not to sayrdquo However respondents may be more likely to choose one of these alternative options when they are explicitly offered as an ldquoeasy outrdquo versus having to refuse to answer the question with a live interviewer
One way to partially mitigate this mode effect is through survey design Instead of adding ldquoOtherrdquo or ldquoPrefer not to sayrdquo options an open-ended text option can be used instead as in the Google Surveys 2016 US Election Poll22
This makes it more difficult for users to select the ldquoOtherrdquo option because they have to formulate and type out an alternative answer
Another mode effect to consider is that different question types may yield different results Results may differ if a question is formulated as a multiple-select (checkbox) question with five options versus separating that question into five individual single-select (radio button) questions A respondent may not want to check all the boxes or remember to check all the boxes whereas putting each option in a single question will encourage them to slow down and focus
22 See the Election Poll survey design at googlOA33DH
Multi-select questions can help reduce the number of questions in a survey but itrsquos important to note the effect that multiple-select questions may have on the results This is even more important when comparing the results of multiple-select questions to the results from other survey modes like live
interviews that often use single-select instead of multiple-select questions
How Google Surveys WorksWhite paper
Surveys
Katrina Sostek and Brett Slatkin are software engineers at Google The whitepaper was originally published in May 2017 All information is accurate as of June 2018 copy 2018 Google LLC All rights reserved Google and the Google logo are trademarks of Google Inc All other company and product names may be trademarks of the respective companies with which they are associated
Since launching in 2012 Google Surveys has moved from 2-question surveys to 10-question surveys expanded the publisher network and built the mobile app panel Surveys offers several advantages compared to traditional phone surveys faster cheaper results with larger sample sizes drawn from an online panel of tens of millions of potential respondents
Like all survey modes Surveys continues to face challenges from different kinds of biases mdash sampling response non-response dropoff modal mdash and we continue to improve our approaches to mitigate these biases Our work to improve our survey capabilities and accuracy is never done and wersquoll continue to refine our methodology as the landscape of respondents and technology continues to change
Privacy is very important to Google Users always have the option to pass on a survey and have the ability to opt out of the DoubleClick cookie completely Unless otherwise stated all responses are anonymous and collected in aggregate Certain surveys such as local surveys may be used to get feedback about a location recently visited and request permission for these responses to be posted publicly Google does not sell usersrsquo personal information to advertisers or anyone else For more information about the Google privacy policy please visit wwwgooglecompoliciesprivacy
Google Surveys is a member of the American Association of Public Opinion Researchrsquos (AAPOR) Transparency Initiative The initiative was founded in 2014 and establishes disclosure standards for organizations who run and publish surveys By joining the initiative Google Surveys pledges to uphold these disclosure standards when publishing results
We would like to acknowledge our fellow Google colleagues for providing insights and expertise that assisted the publication of this paper Amy Adams Harding Asfandyar Qureshi Carolin Jahn James Freeland James Pine Jon Fraser Kenneth Leftin Kevin Tudish Marisa Currie-Rose Michael Brandell Shaun Lysen and Yongwei Yang
In addition we would like to show our gratitude to Stacey Symonds and Fritz Holznagel for their guidance
Conclusion
Privacy
AAPORrsquos Transparency Initiative
Acknowledgements
Questions or comments surveys-supportgooglecom
How Google Surveys WorksWhite paper
Surveys
To correct for sampling bias after the survey is run we apply weights to upweight underrepresented groups and downweight overrepresented groups This calculation is coarser than the calculation for dynamic fielding instead of matching the three-dimensional joint distributions we match each single dimension mdash the marginal distributions mdash on their own We then calculate weights using an iterative process also known as raking to reduce bias across all three dimensions16
Herersquos how raking works First we exclude all respondents with unknown demographics for age gender or geography Then we calculate weights that will match the gender breakdown to the target demographic If the target distribution is 52 female and 48 male but the actual distribution is 50 female and 50 male then we apply a weight of 52 50 = 104 to all female responses and 48 50 = 096 to all male responses
After weighting respondents by the gender dimension on its own we do the same for the age dimension on its own and then the region dimension on its own Every time we get one dimension to perfectly match the target demographic the previous dimensions will no longer exactly match We use an iterative raking technique to do 10 rounds of calculations for all three dimensions on their own17 After 10 rounds the weights will approach convergence and all three dimensions will closely match their targets
The weights in each survey are calculated based on the first question We use the first question for weighting because thatrsquos the only question we can assume should match the target populationrsquos demographic distribution
For example if the first question is a screening question that asks ldquoWhat is your genderrdquo and only respondents who answer ldquomalerdquo screen through to the second question we wouldnrsquot want to match the second question to 52 female and 48 male it will always be 100 male
Even if the first question isnrsquot a screening question respondents may drop off throughout the survey in a way that is skewed towards one demographic group due to the design of the survey Thus we weight responses to follow-up questions by taking the first-question weights filtering them to only those who answered the follow-up question and renormalizing so that the sum of the weights equals the total number of responses to the follow-up question
Weighting
16 Google Surveys moved to a raking methodology in October 2016 The previous methodology is explained in the original whitepaper wwwgooglecominsightsconsumersurveysstaticconsumer_surveys_whitepaperpdf17 enwikipediaorgwikiIterative_proportional_fitting
How Google Surveys WorksWhite paper
Surveys
In the survey results the values displayed in the error bars represent the modeled margin of error This means that if we repeat this survey many times in the same way 95 of the time the resulting range of values would contain the true value
We follow the Pew Research Center in using the term ldquomodeled margin of errorrdquo to differentiate from the statistical term ldquomargin of errorrdquo which only applies to true probability-based samples18 Because Google Surveys collects online non-probability samples the margin of error calculation is based on assumptions about the Surveys sampling model and what would happen if we repeated the same sampling process many times
We use the Modified (or ad hoc) Wilson method to calculate the error bars which can be asymmetrical eg +18-16 The Wilson method works well for small sample sizes as well as extreme probabilities (close to 0 or 100)19 We follow the Modified Wilson calculation using effective sample size as shown in Applied Survey Data Analysis20 The calculation is the same as the Wilson method but uses n = p(1 - p) var(p) in place of n21
Error bars
A question report page showing error bars and the modeled margin of error
In this example the modeled margin of error for Basketball is +18-16 The range of values is 124 to 158 ie 14 adjusted by the modeled
margin of error
Four factors influence and can reduce the size of the modeled
margin of error
1 Larger sample sizes
2 Percentages closer to the extremes of 0 or 100
3 Lower confidence levels (we use a 95 confidence level)
4 Lower variability of weights
18 wwwpewresearchorg20180126variability-of-survey-estimates19 Dean Natalie and Pagano Marcello 2015 ldquoEvaluating Confidence Interval Methods for Binomial Proportions in Clustered Surveysrdquo Journal of Survey Statistics and Methodology 3 (4) 484-503 doiorg101093jssamsmv02420 Heeringa Steven G West Brady T and Berglund Patricia A 2017 Applied Survey Data Analysis Second Edition 16521 enwikipediaorgwikiBinomial_proportion_confidence_intervalWilson_score_interval
Surveys may be subject to other sources of biases and errors including mdash but not limited to mdash sampling and nonresponse as discussed in more detail below
How Google Surveys WorksWhite paper
Surveys
The way we determine respondent demographics differs by survey panel
The mobile app is the simpler of the two panels We ask users to self-report their age gender and zipcode when they sign up to use the app We periodically ask these questions again to refresh the panelistsrsquo demographics in case they have changed
The publisher network uses inferred demographics which means that we donrsquot explicitly ask the panelists for their demographics We do this to minimize the number of questions in a survey which offers a better respondent experience and encourages higher response rates Any researcher who doesnrsquot want to rely on inferred demographics can explicitly add demographic questions to their surveys However our dynamic fielding and weighting process to match ground-truth data will still be based on inferred demographics
Like many ads on the web Google Surveys infers the age and gender of anonymous respondents based on browsing behavior and geography based on IP addresses Users can opt out of inferred demographics in the Ads Settings which applies across Google ads services the 2M+ sites and apps that partner with Google to show ads and Google Surveys In the case of Surveys opting out means that usersrsquo demographics will show as unknown and their responses will be excluded from weighted results For all users unless otherwise stated responses are anonymous and collected in aggregate
How we know age gender and region
In addition to sampling bias Google Surveys monitors and mitigates other kinds of bias
Response non-response and modal bias
Response bias is the bias from inattentive or untruthful answers to questions
The publisher network and mobile app have different kinds of inattentive or untruthful responses Respondents on the publisher network are intercepted while trying to view content online so they do not necessarily want to answer a survey and may just want to see that content The mobile app has the opposite problem where users want to answer as many surveys as possible because they voluntarily opted into the mobile panel out of a desire to answer surveys and earn rewards
Another source of low-quality responses from both the publisher network and the mobile app is open-ended text questions Respondents may respond with gibberish profanity or something like ldquoI hate surveysrdquo These types of answers are removed from the surveyrsquos results using common natural language processing libraries employed across Google
Response bias
How Google Surveys WorksWhite paper
Surveys
Google Surveys tracks investigates and removes multiple kinds of low-quality responses and respondents If low-quality responses are dropped from a survey the survey will remain in the field to collect more responses to make up for the sample that is now missing If chronically inattentive or untruthful respondents are detected they may be prevented from getting any more surveys in the future
Potential responses to a survey can fall into several categories non-response screen-out response partial response or complete response These categories are illustrated below
Non-response bias occurs when a group of people in the sample choose not to respond to the survey in a systematic way which can cause the omission of that grouprsquos opinions Non-responses can come from people who donrsquot like answering surveys in general or are alienated by the first question in some way Unfortunately it can be difficult to ask non-respondents why they chose not to respond because they are unlikely to respond
Respondents may also choose to stop answering questions midway through a survey These partial responses can introduce dropoff bias perhaps an overly-specific question turns off respondents or respondents could drop off towards the end of a long survey For example if a survey is about an extremely specific topic like equestrian equipment then people who are uninterested or uninformed about equestrian equipment may stop answering partway through
Non-response and dropoff bias
QUESTION 2 CATEGORYPOTENTIALRESPONDENT
Person 2
Person 3
Person 4
Person 5
Do you have afavorite letter
ldquoNordquo
ldquoYesrdquo
ldquoYesrdquo
ldquoYesrdquo
ldquoBrdquo
ldquoPrdquo ldquoZrdquo
What is yourfavorite letter
What is your secondfavorite letter
Non-response
Screen-outResponse
PartialResponse
PartialResponse
CompleteResponse
QUESTION 1 QUESTION 3
Person 1 skips the survey
screens out
drops out
drops out
The different categories of potential responses
How Google Surveys WorksWhite paper
Surveys
In a surveyrsquos report page we display the question response dropoff pattern
Researchers may want to investigate if therersquos a systemic reason for potential respondents to not respond to part or all of a survey The raw data download lists the status of each response Screen-out Partial or
Complete along with the answers to each question which allows more in-depth analysis
The question response dropoff chart
Modal bias or mode effects occur when the way in which a question is asked affects the respondentsrsquo answers in a systematic way because of how the survey is administered
All methods of conducting surveys are susceptible to modal bias In face-to-face or live phone interviews the fact that respondents are talking to live interviewers can influence how they answer questions they may want to be more agreeable in person This phenomenon is called the social desirability bias
Modal bias and survey design
How Google Surveys WorksWhite paper
Surveys
Different survey modes can also allow for different question structures In a live interview when a respondent declines to answer a question the interviewer can follow a script with follow-up questions an online platform like Google Surveys canrsquot do this For example consider an election poll that asks respondents to choose between three candidates Over the phone a live interviewer could list the three candidates and no other answer options If the respondent declines to answer the question the live interviewer can then ask a follow-up question to see if the respondent prefers a candidate not listed doesnrsquot want to answer or is undecided
This structure cannot be replicated online If only three candidate options are presented to a potential online respondent the only way to proceed is to choose one of those three candidates or drop out of the survey We could attempt to replicate the live interview structure online by adding a fourth option such as ldquoOtherrdquo or ldquoPrefer not to sayrdquo However respondents may be more likely to choose one of these alternative options when they are explicitly offered as an ldquoeasy outrdquo versus having to refuse to answer the question with a live interviewer
One way to partially mitigate this mode effect is through survey design Instead of adding ldquoOtherrdquo or ldquoPrefer not to sayrdquo options an open-ended text option can be used instead as in the Google Surveys 2016 US Election Poll22
This makes it more difficult for users to select the ldquoOtherrdquo option because they have to formulate and type out an alternative answer
Another mode effect to consider is that different question types may yield different results Results may differ if a question is formulated as a multiple-select (checkbox) question with five options versus separating that question into five individual single-select (radio button) questions A respondent may not want to check all the boxes or remember to check all the boxes whereas putting each option in a single question will encourage them to slow down and focus
22 See the Election Poll survey design at googlOA33DH
Multi-select questions can help reduce the number of questions in a survey but itrsquos important to note the effect that multiple-select questions may have on the results This is even more important when comparing the results of multiple-select questions to the results from other survey modes like live
interviews that often use single-select instead of multiple-select questions
How Google Surveys WorksWhite paper
Surveys
Katrina Sostek and Brett Slatkin are software engineers at Google The whitepaper was originally published in May 2017 All information is accurate as of June 2018 copy 2018 Google LLC All rights reserved Google and the Google logo are trademarks of Google Inc All other company and product names may be trademarks of the respective companies with which they are associated
Since launching in 2012 Google Surveys has moved from 2-question surveys to 10-question surveys expanded the publisher network and built the mobile app panel Surveys offers several advantages compared to traditional phone surveys faster cheaper results with larger sample sizes drawn from an online panel of tens of millions of potential respondents
Like all survey modes Surveys continues to face challenges from different kinds of biases mdash sampling response non-response dropoff modal mdash and we continue to improve our approaches to mitigate these biases Our work to improve our survey capabilities and accuracy is never done and wersquoll continue to refine our methodology as the landscape of respondents and technology continues to change
Privacy is very important to Google Users always have the option to pass on a survey and have the ability to opt out of the DoubleClick cookie completely Unless otherwise stated all responses are anonymous and collected in aggregate Certain surveys such as local surveys may be used to get feedback about a location recently visited and request permission for these responses to be posted publicly Google does not sell usersrsquo personal information to advertisers or anyone else For more information about the Google privacy policy please visit wwwgooglecompoliciesprivacy
Google Surveys is a member of the American Association of Public Opinion Researchrsquos (AAPOR) Transparency Initiative The initiative was founded in 2014 and establishes disclosure standards for organizations who run and publish surveys By joining the initiative Google Surveys pledges to uphold these disclosure standards when publishing results
We would like to acknowledge our fellow Google colleagues for providing insights and expertise that assisted the publication of this paper Amy Adams Harding Asfandyar Qureshi Carolin Jahn James Freeland James Pine Jon Fraser Kenneth Leftin Kevin Tudish Marisa Currie-Rose Michael Brandell Shaun Lysen and Yongwei Yang
In addition we would like to show our gratitude to Stacey Symonds and Fritz Holznagel for their guidance
Conclusion
Privacy
AAPORrsquos Transparency Initiative
Acknowledgements
Questions or comments surveys-supportgooglecom
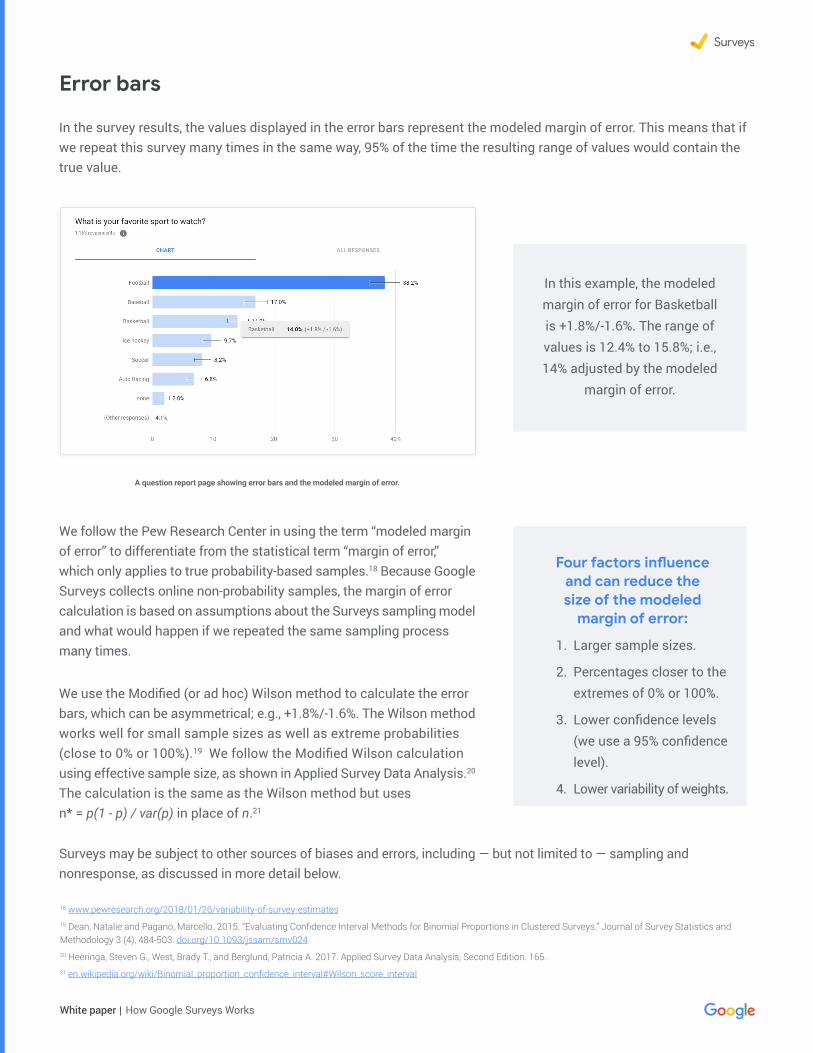
How Google Surveys WorksWhite paper
Surveys
In the survey results the values displayed in the error bars represent the modeled margin of error This means that if we repeat this survey many times in the same way 95 of the time the resulting range of values would contain the true value
We follow the Pew Research Center in using the term ldquomodeled margin of errorrdquo to differentiate from the statistical term ldquomargin of errorrdquo which only applies to true probability-based samples18 Because Google Surveys collects online non-probability samples the margin of error calculation is based on assumptions about the Surveys sampling model and what would happen if we repeated the same sampling process many times
We use the Modified (or ad hoc) Wilson method to calculate the error bars which can be asymmetrical eg +18-16 The Wilson method works well for small sample sizes as well as extreme probabilities (close to 0 or 100)19 We follow the Modified Wilson calculation using effective sample size as shown in Applied Survey Data Analysis20 The calculation is the same as the Wilson method but uses n = p(1 - p) var(p) in place of n21
Error bars
A question report page showing error bars and the modeled margin of error
In this example the modeled margin of error for Basketball is +18-16 The range of values is 124 to 158 ie 14 adjusted by the modeled
margin of error
Four factors influence and can reduce the size of the modeled
margin of error
1 Larger sample sizes
2 Percentages closer to the extremes of 0 or 100
3 Lower confidence levels (we use a 95 confidence level)
4 Lower variability of weights
18 wwwpewresearchorg20180126variability-of-survey-estimates19 Dean Natalie and Pagano Marcello 2015 ldquoEvaluating Confidence Interval Methods for Binomial Proportions in Clustered Surveysrdquo Journal of Survey Statistics and Methodology 3 (4) 484-503 doiorg101093jssamsmv02420 Heeringa Steven G West Brady T and Berglund Patricia A 2017 Applied Survey Data Analysis Second Edition 16521 enwikipediaorgwikiBinomial_proportion_confidence_intervalWilson_score_interval
Surveys may be subject to other sources of biases and errors including mdash but not limited to mdash sampling and nonresponse as discussed in more detail below
How Google Surveys WorksWhite paper
Surveys
The way we determine respondent demographics differs by survey panel
The mobile app is the simpler of the two panels We ask users to self-report their age gender and zipcode when they sign up to use the app We periodically ask these questions again to refresh the panelistsrsquo demographics in case they have changed
The publisher network uses inferred demographics which means that we donrsquot explicitly ask the panelists for their demographics We do this to minimize the number of questions in a survey which offers a better respondent experience and encourages higher response rates Any researcher who doesnrsquot want to rely on inferred demographics can explicitly add demographic questions to their surveys However our dynamic fielding and weighting process to match ground-truth data will still be based on inferred demographics
Like many ads on the web Google Surveys infers the age and gender of anonymous respondents based on browsing behavior and geography based on IP addresses Users can opt out of inferred demographics in the Ads Settings which applies across Google ads services the 2M+ sites and apps that partner with Google to show ads and Google Surveys In the case of Surveys opting out means that usersrsquo demographics will show as unknown and their responses will be excluded from weighted results For all users unless otherwise stated responses are anonymous and collected in aggregate
How we know age gender and region
In addition to sampling bias Google Surveys monitors and mitigates other kinds of bias
Response non-response and modal bias
Response bias is the bias from inattentive or untruthful answers to questions
The publisher network and mobile app have different kinds of inattentive or untruthful responses Respondents on the publisher network are intercepted while trying to view content online so they do not necessarily want to answer a survey and may just want to see that content The mobile app has the opposite problem where users want to answer as many surveys as possible because they voluntarily opted into the mobile panel out of a desire to answer surveys and earn rewards
Another source of low-quality responses from both the publisher network and the mobile app is open-ended text questions Respondents may respond with gibberish profanity or something like ldquoI hate surveysrdquo These types of answers are removed from the surveyrsquos results using common natural language processing libraries employed across Google
Response bias
How Google Surveys WorksWhite paper
Surveys
Google Surveys tracks investigates and removes multiple kinds of low-quality responses and respondents If low-quality responses are dropped from a survey the survey will remain in the field to collect more responses to make up for the sample that is now missing If chronically inattentive or untruthful respondents are detected they may be prevented from getting any more surveys in the future
Potential responses to a survey can fall into several categories non-response screen-out response partial response or complete response These categories are illustrated below
Non-response bias occurs when a group of people in the sample choose not to respond to the survey in a systematic way which can cause the omission of that grouprsquos opinions Non-responses can come from people who donrsquot like answering surveys in general or are alienated by the first question in some way Unfortunately it can be difficult to ask non-respondents why they chose not to respond because they are unlikely to respond
Respondents may also choose to stop answering questions midway through a survey These partial responses can introduce dropoff bias perhaps an overly-specific question turns off respondents or respondents could drop off towards the end of a long survey For example if a survey is about an extremely specific topic like equestrian equipment then people who are uninterested or uninformed about equestrian equipment may stop answering partway through
Non-response and dropoff bias
QUESTION 2 CATEGORYPOTENTIALRESPONDENT
Person 2
Person 3
Person 4
Person 5
Do you have afavorite letter
ldquoNordquo
ldquoYesrdquo
ldquoYesrdquo
ldquoYesrdquo
ldquoBrdquo
ldquoPrdquo ldquoZrdquo
What is yourfavorite letter
What is your secondfavorite letter
Non-response
Screen-outResponse
PartialResponse
PartialResponse
CompleteResponse
QUESTION 1 QUESTION 3
Person 1 skips the survey
screens out
drops out
drops out
The different categories of potential responses
How Google Surveys WorksWhite paper
Surveys
In a surveyrsquos report page we display the question response dropoff pattern
Researchers may want to investigate if therersquos a systemic reason for potential respondents to not respond to part or all of a survey The raw data download lists the status of each response Screen-out Partial or
Complete along with the answers to each question which allows more in-depth analysis
The question response dropoff chart
Modal bias or mode effects occur when the way in which a question is asked affects the respondentsrsquo answers in a systematic way because of how the survey is administered
All methods of conducting surveys are susceptible to modal bias In face-to-face or live phone interviews the fact that respondents are talking to live interviewers can influence how they answer questions they may want to be more agreeable in person This phenomenon is called the social desirability bias
Modal bias and survey design
How Google Surveys WorksWhite paper
Surveys
Different survey modes can also allow for different question structures In a live interview when a respondent declines to answer a question the interviewer can follow a script with follow-up questions an online platform like Google Surveys canrsquot do this For example consider an election poll that asks respondents to choose between three candidates Over the phone a live interviewer could list the three candidates and no other answer options If the respondent declines to answer the question the live interviewer can then ask a follow-up question to see if the respondent prefers a candidate not listed doesnrsquot want to answer or is undecided
This structure cannot be replicated online If only three candidate options are presented to a potential online respondent the only way to proceed is to choose one of those three candidates or drop out of the survey We could attempt to replicate the live interview structure online by adding a fourth option such as ldquoOtherrdquo or ldquoPrefer not to sayrdquo However respondents may be more likely to choose one of these alternative options when they are explicitly offered as an ldquoeasy outrdquo versus having to refuse to answer the question with a live interviewer
One way to partially mitigate this mode effect is through survey design Instead of adding ldquoOtherrdquo or ldquoPrefer not to sayrdquo options an open-ended text option can be used instead as in the Google Surveys 2016 US Election Poll22
This makes it more difficult for users to select the ldquoOtherrdquo option because they have to formulate and type out an alternative answer
Another mode effect to consider is that different question types may yield different results Results may differ if a question is formulated as a multiple-select (checkbox) question with five options versus separating that question into five individual single-select (radio button) questions A respondent may not want to check all the boxes or remember to check all the boxes whereas putting each option in a single question will encourage them to slow down and focus
22 See the Election Poll survey design at googlOA33DH
Multi-select questions can help reduce the number of questions in a survey but itrsquos important to note the effect that multiple-select questions may have on the results This is even more important when comparing the results of multiple-select questions to the results from other survey modes like live
interviews that often use single-select instead of multiple-select questions
How Google Surveys WorksWhite paper
Surveys
Katrina Sostek and Brett Slatkin are software engineers at Google The whitepaper was originally published in May 2017 All information is accurate as of June 2018 copy 2018 Google LLC All rights reserved Google and the Google logo are trademarks of Google Inc All other company and product names may be trademarks of the respective companies with which they are associated
Since launching in 2012 Google Surveys has moved from 2-question surveys to 10-question surveys expanded the publisher network and built the mobile app panel Surveys offers several advantages compared to traditional phone surveys faster cheaper results with larger sample sizes drawn from an online panel of tens of millions of potential respondents
Like all survey modes Surveys continues to face challenges from different kinds of biases mdash sampling response non-response dropoff modal mdash and we continue to improve our approaches to mitigate these biases Our work to improve our survey capabilities and accuracy is never done and wersquoll continue to refine our methodology as the landscape of respondents and technology continues to change
Privacy is very important to Google Users always have the option to pass on a survey and have the ability to opt out of the DoubleClick cookie completely Unless otherwise stated all responses are anonymous and collected in aggregate Certain surveys such as local surveys may be used to get feedback about a location recently visited and request permission for these responses to be posted publicly Google does not sell usersrsquo personal information to advertisers or anyone else For more information about the Google privacy policy please visit wwwgooglecompoliciesprivacy
Google Surveys is a member of the American Association of Public Opinion Researchrsquos (AAPOR) Transparency Initiative The initiative was founded in 2014 and establishes disclosure standards for organizations who run and publish surveys By joining the initiative Google Surveys pledges to uphold these disclosure standards when publishing results
We would like to acknowledge our fellow Google colleagues for providing insights and expertise that assisted the publication of this paper Amy Adams Harding Asfandyar Qureshi Carolin Jahn James Freeland James Pine Jon Fraser Kenneth Leftin Kevin Tudish Marisa Currie-Rose Michael Brandell Shaun Lysen and Yongwei Yang
In addition we would like to show our gratitude to Stacey Symonds and Fritz Holznagel for their guidance
Conclusion
Privacy
AAPORrsquos Transparency Initiative
Acknowledgements
Questions or comments surveys-supportgooglecom
How Google Surveys WorksWhite paper
Surveys
The way we determine respondent demographics differs by survey panel
The mobile app is the simpler of the two panels We ask users to self-report their age gender and zipcode when they sign up to use the app We periodically ask these questions again to refresh the panelistsrsquo demographics in case they have changed
The publisher network uses inferred demographics which means that we donrsquot explicitly ask the panelists for their demographics We do this to minimize the number of questions in a survey which offers a better respondent experience and encourages higher response rates Any researcher who doesnrsquot want to rely on inferred demographics can explicitly add demographic questions to their surveys However our dynamic fielding and weighting process to match ground-truth data will still be based on inferred demographics
Like many ads on the web Google Surveys infers the age and gender of anonymous respondents based on browsing behavior and geography based on IP addresses Users can opt out of inferred demographics in the Ads Settings which applies across Google ads services the 2M+ sites and apps that partner with Google to show ads and Google Surveys In the case of Surveys opting out means that usersrsquo demographics will show as unknown and their responses will be excluded from weighted results For all users unless otherwise stated responses are anonymous and collected in aggregate
How we know age gender and region
In addition to sampling bias Google Surveys monitors and mitigates other kinds of bias
Response non-response and modal bias
Response bias is the bias from inattentive or untruthful answers to questions
The publisher network and mobile app have different kinds of inattentive or untruthful responses Respondents on the publisher network are intercepted while trying to view content online so they do not necessarily want to answer a survey and may just want to see that content The mobile app has the opposite problem where users want to answer as many surveys as possible because they voluntarily opted into the mobile panel out of a desire to answer surveys and earn rewards
Another source of low-quality responses from both the publisher network and the mobile app is open-ended text questions Respondents may respond with gibberish profanity or something like ldquoI hate surveysrdquo These types of answers are removed from the surveyrsquos results using common natural language processing libraries employed across Google
Response bias
How Google Surveys WorksWhite paper
Surveys
Google Surveys tracks investigates and removes multiple kinds of low-quality responses and respondents If low-quality responses are dropped from a survey the survey will remain in the field to collect more responses to make up for the sample that is now missing If chronically inattentive or untruthful respondents are detected they may be prevented from getting any more surveys in the future
Potential responses to a survey can fall into several categories non-response screen-out response partial response or complete response These categories are illustrated below
Non-response bias occurs when a group of people in the sample choose not to respond to the survey in a systematic way which can cause the omission of that grouprsquos opinions Non-responses can come from people who donrsquot like answering surveys in general or are alienated by the first question in some way Unfortunately it can be difficult to ask non-respondents why they chose not to respond because they are unlikely to respond
Respondents may also choose to stop answering questions midway through a survey These partial responses can introduce dropoff bias perhaps an overly-specific question turns off respondents or respondents could drop off towards the end of a long survey For example if a survey is about an extremely specific topic like equestrian equipment then people who are uninterested or uninformed about equestrian equipment may stop answering partway through
Non-response and dropoff bias
QUESTION 2 CATEGORYPOTENTIALRESPONDENT
Person 2
Person 3
Person 4
Person 5
Do you have afavorite letter
ldquoNordquo
ldquoYesrdquo
ldquoYesrdquo
ldquoYesrdquo
ldquoBrdquo
ldquoPrdquo ldquoZrdquo
What is yourfavorite letter
What is your secondfavorite letter
Non-response
Screen-outResponse
PartialResponse
PartialResponse
CompleteResponse
QUESTION 1 QUESTION 3
Person 1 skips the survey
screens out
drops out
drops out
The different categories of potential responses
How Google Surveys WorksWhite paper
Surveys
In a surveyrsquos report page we display the question response dropoff pattern
Researchers may want to investigate if therersquos a systemic reason for potential respondents to not respond to part or all of a survey The raw data download lists the status of each response Screen-out Partial or
Complete along with the answers to each question which allows more in-depth analysis
The question response dropoff chart
Modal bias or mode effects occur when the way in which a question is asked affects the respondentsrsquo answers in a systematic way because of how the survey is administered
All methods of conducting surveys are susceptible to modal bias In face-to-face or live phone interviews the fact that respondents are talking to live interviewers can influence how they answer questions they may want to be more agreeable in person This phenomenon is called the social desirability bias
Modal bias and survey design
How Google Surveys WorksWhite paper
Surveys
Different survey modes can also allow for different question structures In a live interview when a respondent declines to answer a question the interviewer can follow a script with follow-up questions an online platform like Google Surveys canrsquot do this For example consider an election poll that asks respondents to choose between three candidates Over the phone a live interviewer could list the three candidates and no other answer options If the respondent declines to answer the question the live interviewer can then ask a follow-up question to see if the respondent prefers a candidate not listed doesnrsquot want to answer or is undecided
This structure cannot be replicated online If only three candidate options are presented to a potential online respondent the only way to proceed is to choose one of those three candidates or drop out of the survey We could attempt to replicate the live interview structure online by adding a fourth option such as ldquoOtherrdquo or ldquoPrefer not to sayrdquo However respondents may be more likely to choose one of these alternative options when they are explicitly offered as an ldquoeasy outrdquo versus having to refuse to answer the question with a live interviewer
One way to partially mitigate this mode effect is through survey design Instead of adding ldquoOtherrdquo or ldquoPrefer not to sayrdquo options an open-ended text option can be used instead as in the Google Surveys 2016 US Election Poll22
This makes it more difficult for users to select the ldquoOtherrdquo option because they have to formulate and type out an alternative answer
Another mode effect to consider is that different question types may yield different results Results may differ if a question is formulated as a multiple-select (checkbox) question with five options versus separating that question into five individual single-select (radio button) questions A respondent may not want to check all the boxes or remember to check all the boxes whereas putting each option in a single question will encourage them to slow down and focus
22 See the Election Poll survey design at googlOA33DH
Multi-select questions can help reduce the number of questions in a survey but itrsquos important to note the effect that multiple-select questions may have on the results This is even more important when comparing the results of multiple-select questions to the results from other survey modes like live
interviews that often use single-select instead of multiple-select questions
How Google Surveys WorksWhite paper
Surveys
Katrina Sostek and Brett Slatkin are software engineers at Google The whitepaper was originally published in May 2017 All information is accurate as of June 2018 copy 2018 Google LLC All rights reserved Google and the Google logo are trademarks of Google Inc All other company and product names may be trademarks of the respective companies with which they are associated
Since launching in 2012 Google Surveys has moved from 2-question surveys to 10-question surveys expanded the publisher network and built the mobile app panel Surveys offers several advantages compared to traditional phone surveys faster cheaper results with larger sample sizes drawn from an online panel of tens of millions of potential respondents
Like all survey modes Surveys continues to face challenges from different kinds of biases mdash sampling response non-response dropoff modal mdash and we continue to improve our approaches to mitigate these biases Our work to improve our survey capabilities and accuracy is never done and wersquoll continue to refine our methodology as the landscape of respondents and technology continues to change
Privacy is very important to Google Users always have the option to pass on a survey and have the ability to opt out of the DoubleClick cookie completely Unless otherwise stated all responses are anonymous and collected in aggregate Certain surveys such as local surveys may be used to get feedback about a location recently visited and request permission for these responses to be posted publicly Google does not sell usersrsquo personal information to advertisers or anyone else For more information about the Google privacy policy please visit wwwgooglecompoliciesprivacy
Google Surveys is a member of the American Association of Public Opinion Researchrsquos (AAPOR) Transparency Initiative The initiative was founded in 2014 and establishes disclosure standards for organizations who run and publish surveys By joining the initiative Google Surveys pledges to uphold these disclosure standards when publishing results
We would like to acknowledge our fellow Google colleagues for providing insights and expertise that assisted the publication of this paper Amy Adams Harding Asfandyar Qureshi Carolin Jahn James Freeland James Pine Jon Fraser Kenneth Leftin Kevin Tudish Marisa Currie-Rose Michael Brandell Shaun Lysen and Yongwei Yang
In addition we would like to show our gratitude to Stacey Symonds and Fritz Holznagel for their guidance
Conclusion
Privacy
AAPORrsquos Transparency Initiative
Acknowledgements
Questions or comments surveys-supportgooglecom
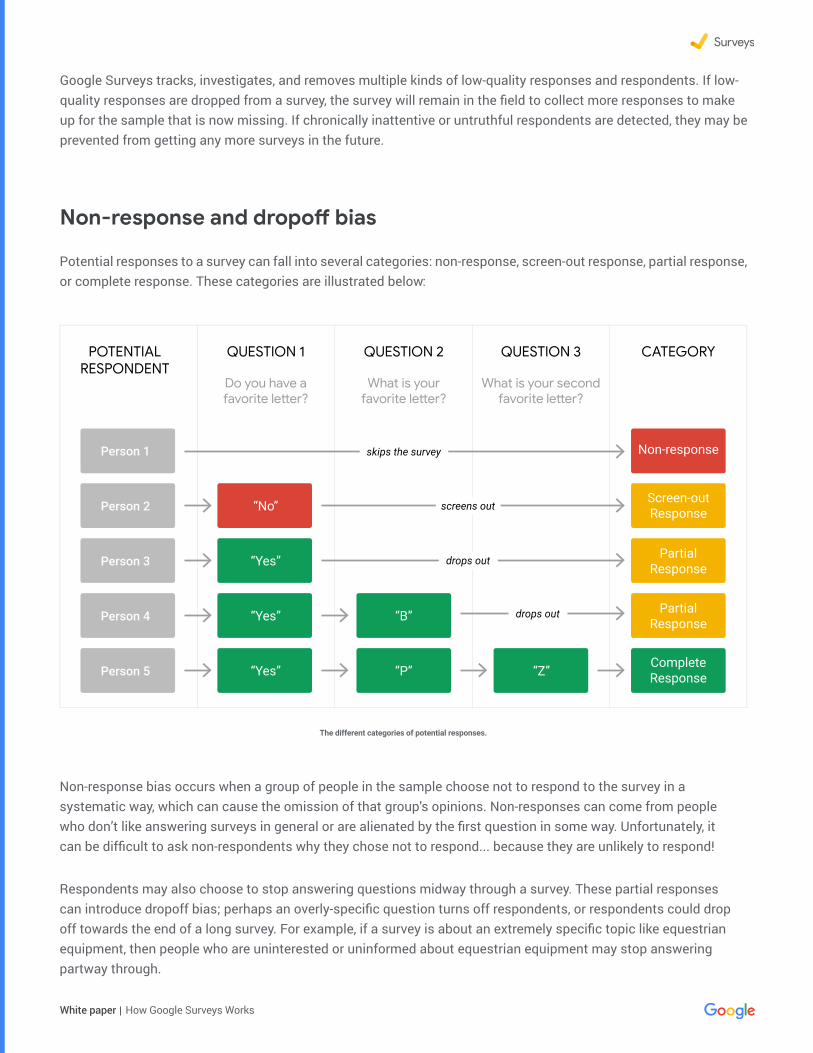
How Google Surveys WorksWhite paper
Surveys
Google Surveys tracks investigates and removes multiple kinds of low-quality responses and respondents If low-quality responses are dropped from a survey the survey will remain in the field to collect more responses to make up for the sample that is now missing If chronically inattentive or untruthful respondents are detected they may be prevented from getting any more surveys in the future
Potential responses to a survey can fall into several categories non-response screen-out response partial response or complete response These categories are illustrated below
Non-response bias occurs when a group of people in the sample choose not to respond to the survey in a systematic way which can cause the omission of that grouprsquos opinions Non-responses can come from people who donrsquot like answering surveys in general or are alienated by the first question in some way Unfortunately it can be difficult to ask non-respondents why they chose not to respond because they are unlikely to respond
Respondents may also choose to stop answering questions midway through a survey These partial responses can introduce dropoff bias perhaps an overly-specific question turns off respondents or respondents could drop off towards the end of a long survey For example if a survey is about an extremely specific topic like equestrian equipment then people who are uninterested or uninformed about equestrian equipment may stop answering partway through
Non-response and dropoff bias
QUESTION 2 CATEGORYPOTENTIALRESPONDENT
Person 2
Person 3
Person 4
Person 5
Do you have afavorite letter
ldquoNordquo
ldquoYesrdquo
ldquoYesrdquo
ldquoYesrdquo
ldquoBrdquo
ldquoPrdquo ldquoZrdquo
What is yourfavorite letter
What is your secondfavorite letter
Non-response
Screen-outResponse
PartialResponse
PartialResponse
CompleteResponse
QUESTION 1 QUESTION 3
Person 1 skips the survey
screens out
drops out
drops out
The different categories of potential responses
How Google Surveys WorksWhite paper
Surveys
In a surveyrsquos report page we display the question response dropoff pattern
Researchers may want to investigate if therersquos a systemic reason for potential respondents to not respond to part or all of a survey The raw data download lists the status of each response Screen-out Partial or
Complete along with the answers to each question which allows more in-depth analysis
The question response dropoff chart
Modal bias or mode effects occur when the way in which a question is asked affects the respondentsrsquo answers in a systematic way because of how the survey is administered
All methods of conducting surveys are susceptible to modal bias In face-to-face or live phone interviews the fact that respondents are talking to live interviewers can influence how they answer questions they may want to be more agreeable in person This phenomenon is called the social desirability bias
Modal bias and survey design
How Google Surveys WorksWhite paper
Surveys
Different survey modes can also allow for different question structures In a live interview when a respondent declines to answer a question the interviewer can follow a script with follow-up questions an online platform like Google Surveys canrsquot do this For example consider an election poll that asks respondents to choose between three candidates Over the phone a live interviewer could list the three candidates and no other answer options If the respondent declines to answer the question the live interviewer can then ask a follow-up question to see if the respondent prefers a candidate not listed doesnrsquot want to answer or is undecided
This structure cannot be replicated online If only three candidate options are presented to a potential online respondent the only way to proceed is to choose one of those three candidates or drop out of the survey We could attempt to replicate the live interview structure online by adding a fourth option such as ldquoOtherrdquo or ldquoPrefer not to sayrdquo However respondents may be more likely to choose one of these alternative options when they are explicitly offered as an ldquoeasy outrdquo versus having to refuse to answer the question with a live interviewer
One way to partially mitigate this mode effect is through survey design Instead of adding ldquoOtherrdquo or ldquoPrefer not to sayrdquo options an open-ended text option can be used instead as in the Google Surveys 2016 US Election Poll22
This makes it more difficult for users to select the ldquoOtherrdquo option because they have to formulate and type out an alternative answer
Another mode effect to consider is that different question types may yield different results Results may differ if a question is formulated as a multiple-select (checkbox) question with five options versus separating that question into five individual single-select (radio button) questions A respondent may not want to check all the boxes or remember to check all the boxes whereas putting each option in a single question will encourage them to slow down and focus
22 See the Election Poll survey design at googlOA33DH
Multi-select questions can help reduce the number of questions in a survey but itrsquos important to note the effect that multiple-select questions may have on the results This is even more important when comparing the results of multiple-select questions to the results from other survey modes like live
interviews that often use single-select instead of multiple-select questions
How Google Surveys WorksWhite paper
Surveys
Katrina Sostek and Brett Slatkin are software engineers at Google The whitepaper was originally published in May 2017 All information is accurate as of June 2018 copy 2018 Google LLC All rights reserved Google and the Google logo are trademarks of Google Inc All other company and product names may be trademarks of the respective companies with which they are associated
Since launching in 2012 Google Surveys has moved from 2-question surveys to 10-question surveys expanded the publisher network and built the mobile app panel Surveys offers several advantages compared to traditional phone surveys faster cheaper results with larger sample sizes drawn from an online panel of tens of millions of potential respondents
Like all survey modes Surveys continues to face challenges from different kinds of biases mdash sampling response non-response dropoff modal mdash and we continue to improve our approaches to mitigate these biases Our work to improve our survey capabilities and accuracy is never done and wersquoll continue to refine our methodology as the landscape of respondents and technology continues to change
Privacy is very important to Google Users always have the option to pass on a survey and have the ability to opt out of the DoubleClick cookie completely Unless otherwise stated all responses are anonymous and collected in aggregate Certain surveys such as local surveys may be used to get feedback about a location recently visited and request permission for these responses to be posted publicly Google does not sell usersrsquo personal information to advertisers or anyone else For more information about the Google privacy policy please visit wwwgooglecompoliciesprivacy
Google Surveys is a member of the American Association of Public Opinion Researchrsquos (AAPOR) Transparency Initiative The initiative was founded in 2014 and establishes disclosure standards for organizations who run and publish surveys By joining the initiative Google Surveys pledges to uphold these disclosure standards when publishing results
We would like to acknowledge our fellow Google colleagues for providing insights and expertise that assisted the publication of this paper Amy Adams Harding Asfandyar Qureshi Carolin Jahn James Freeland James Pine Jon Fraser Kenneth Leftin Kevin Tudish Marisa Currie-Rose Michael Brandell Shaun Lysen and Yongwei Yang
In addition we would like to show our gratitude to Stacey Symonds and Fritz Holznagel for their guidance
Conclusion
Privacy
AAPORrsquos Transparency Initiative
Acknowledgements
Questions or comments surveys-supportgooglecom
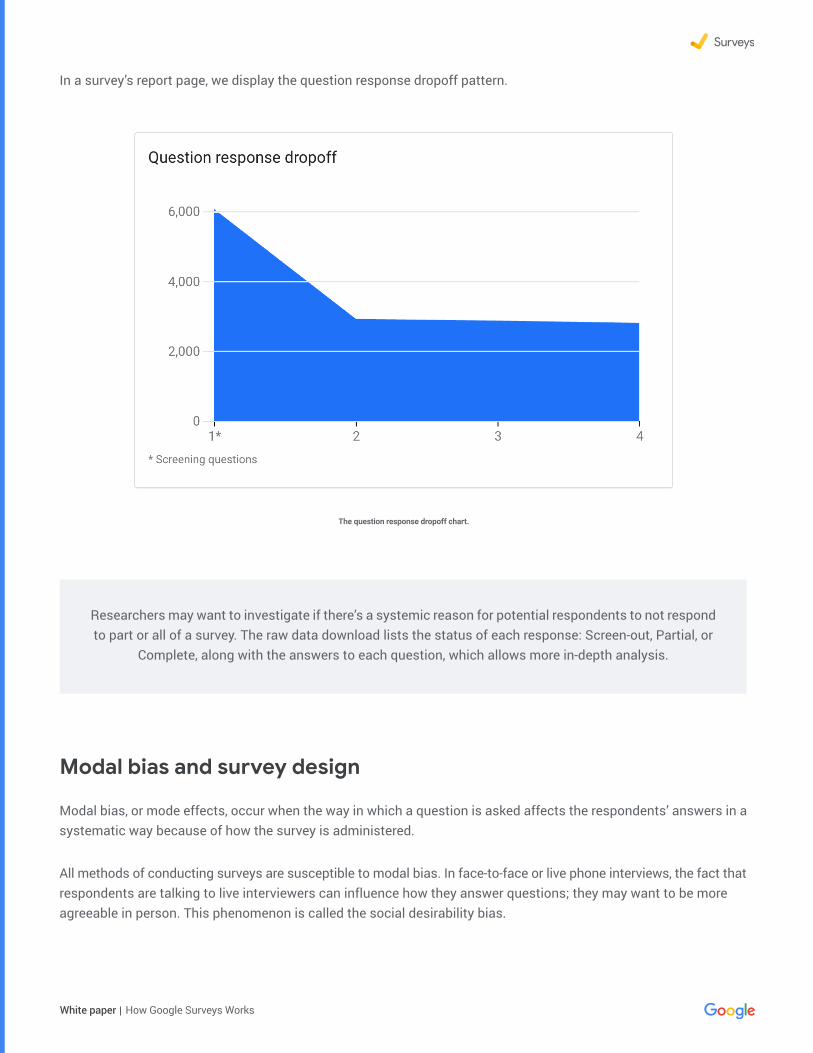
How Google Surveys WorksWhite paper
Surveys
In a surveyrsquos report page we display the question response dropoff pattern
Researchers may want to investigate if therersquos a systemic reason for potential respondents to not respond to part or all of a survey The raw data download lists the status of each response Screen-out Partial or
Complete along with the answers to each question which allows more in-depth analysis
The question response dropoff chart
Modal bias or mode effects occur when the way in which a question is asked affects the respondentsrsquo answers in a systematic way because of how the survey is administered
All methods of conducting surveys are susceptible to modal bias In face-to-face or live phone interviews the fact that respondents are talking to live interviewers can influence how they answer questions they may want to be more agreeable in person This phenomenon is called the social desirability bias
Modal bias and survey design
How Google Surveys WorksWhite paper
Surveys
Different survey modes can also allow for different question structures In a live interview when a respondent declines to answer a question the interviewer can follow a script with follow-up questions an online platform like Google Surveys canrsquot do this For example consider an election poll that asks respondents to choose between three candidates Over the phone a live interviewer could list the three candidates and no other answer options If the respondent declines to answer the question the live interviewer can then ask a follow-up question to see if the respondent prefers a candidate not listed doesnrsquot want to answer or is undecided
This structure cannot be replicated online If only three candidate options are presented to a potential online respondent the only way to proceed is to choose one of those three candidates or drop out of the survey We could attempt to replicate the live interview structure online by adding a fourth option such as ldquoOtherrdquo or ldquoPrefer not to sayrdquo However respondents may be more likely to choose one of these alternative options when they are explicitly offered as an ldquoeasy outrdquo versus having to refuse to answer the question with a live interviewer
One way to partially mitigate this mode effect is through survey design Instead of adding ldquoOtherrdquo or ldquoPrefer not to sayrdquo options an open-ended text option can be used instead as in the Google Surveys 2016 US Election Poll22
This makes it more difficult for users to select the ldquoOtherrdquo option because they have to formulate and type out an alternative answer
Another mode effect to consider is that different question types may yield different results Results may differ if a question is formulated as a multiple-select (checkbox) question with five options versus separating that question into five individual single-select (radio button) questions A respondent may not want to check all the boxes or remember to check all the boxes whereas putting each option in a single question will encourage them to slow down and focus
22 See the Election Poll survey design at googlOA33DH
Multi-select questions can help reduce the number of questions in a survey but itrsquos important to note the effect that multiple-select questions may have on the results This is even more important when comparing the results of multiple-select questions to the results from other survey modes like live
interviews that often use single-select instead of multiple-select questions
How Google Surveys WorksWhite paper
Surveys
Katrina Sostek and Brett Slatkin are software engineers at Google The whitepaper was originally published in May 2017 All information is accurate as of June 2018 copy 2018 Google LLC All rights reserved Google and the Google logo are trademarks of Google Inc All other company and product names may be trademarks of the respective companies with which they are associated
Since launching in 2012 Google Surveys has moved from 2-question surveys to 10-question surveys expanded the publisher network and built the mobile app panel Surveys offers several advantages compared to traditional phone surveys faster cheaper results with larger sample sizes drawn from an online panel of tens of millions of potential respondents
Like all survey modes Surveys continues to face challenges from different kinds of biases mdash sampling response non-response dropoff modal mdash and we continue to improve our approaches to mitigate these biases Our work to improve our survey capabilities and accuracy is never done and wersquoll continue to refine our methodology as the landscape of respondents and technology continues to change
Privacy is very important to Google Users always have the option to pass on a survey and have the ability to opt out of the DoubleClick cookie completely Unless otherwise stated all responses are anonymous and collected in aggregate Certain surveys such as local surveys may be used to get feedback about a location recently visited and request permission for these responses to be posted publicly Google does not sell usersrsquo personal information to advertisers or anyone else For more information about the Google privacy policy please visit wwwgooglecompoliciesprivacy
Google Surveys is a member of the American Association of Public Opinion Researchrsquos (AAPOR) Transparency Initiative The initiative was founded in 2014 and establishes disclosure standards for organizations who run and publish surveys By joining the initiative Google Surveys pledges to uphold these disclosure standards when publishing results
We would like to acknowledge our fellow Google colleagues for providing insights and expertise that assisted the publication of this paper Amy Adams Harding Asfandyar Qureshi Carolin Jahn James Freeland James Pine Jon Fraser Kenneth Leftin Kevin Tudish Marisa Currie-Rose Michael Brandell Shaun Lysen and Yongwei Yang
In addition we would like to show our gratitude to Stacey Symonds and Fritz Holznagel for their guidance
Conclusion
Privacy
AAPORrsquos Transparency Initiative
Acknowledgements
Questions or comments surveys-supportgooglecom
How Google Surveys WorksWhite paper
Surveys
Katrina Sostek and Brett Slatkin are software engineers at Google The whitepaper was originally published in May 2017 All information is accurate as of June 2018 copy 2018 Google LLC All rights reserved Google and the Google logo are trademarks of Google Inc All other company and product names may be trademarks of the respective companies with which they are associated
Since launching in 2012 Google Surveys has moved from 2-question surveys to 10-question surveys expanded the publisher network and built the mobile app panel Surveys offers several advantages compared to traditional phone surveys faster cheaper results with larger sample sizes drawn from an online panel of tens of millions of potential respondents
Like all survey modes Surveys continues to face challenges from different kinds of biases mdash sampling response non-response dropoff modal mdash and we continue to improve our approaches to mitigate these biases Our work to improve our survey capabilities and accuracy is never done and wersquoll continue to refine our methodology as the landscape of respondents and technology continues to change
Privacy is very important to Google Users always have the option to pass on a survey and have the ability to opt out of the DoubleClick cookie completely Unless otherwise stated all responses are anonymous and collected in aggregate Certain surveys such as local surveys may be used to get feedback about a location recently visited and request permission for these responses to be posted publicly Google does not sell usersrsquo personal information to advertisers or anyone else For more information about the Google privacy policy please visit wwwgooglecompoliciesprivacy
Google Surveys is a member of the American Association of Public Opinion Researchrsquos (AAPOR) Transparency Initiative The initiative was founded in 2014 and establishes disclosure standards for organizations who run and publish surveys By joining the initiative Google Surveys pledges to uphold these disclosure standards when publishing results
We would like to acknowledge our fellow Google colleagues for providing insights and expertise that assisted the publication of this paper Amy Adams Harding Asfandyar Qureshi Carolin Jahn James Freeland James Pine Jon Fraser Kenneth Leftin Kevin Tudish Marisa Currie-Rose Michael Brandell Shaun Lysen and Yongwei Yang
In addition we would like to show our gratitude to Stacey Symonds and Fritz Holznagel for their guidance
Conclusion
Privacy
AAPORrsquos Transparency Initiative
Acknowledgements
Questions or comments surveys-supportgooglecom