
Which Characteristics are associated to the Level of European
40
UNIVERSITEIT TWENTE Which Characteristics are associated to the Level of European Identity among European Citizens? Bachelor Thesis Author: Claudio Atzeni, s1100645 First Supervisor: Kostas Gemenis Second Supervisor: Harry van der Kaap 11/4/2013 Abstract: By exploring associations of European Identity with other individual characteristics namely education, socio-economic status, area of living, and religiosity, this study seeks at contributing to a better understanding of European Identity, giving hints for future studies and supporting a grounded discussion about a possible further European political and social integration.
Transcript of Which Characteristics are associated to the Level of European

UNIVERSITEIT TWENTE
Which Characteristics are associated to the Level of European Identity among
European Citizens? Bachelor Thesis
Author: Claudio Atzeni, s1100645
First Supervisor: Kostas Gemenis
Second Supervisor: Harry van der Kaap
11/4/2013
Abstract: By exploring associations of European Identity with other individual characteristics namely education, socio-economic status, area of living, and religiosity, this study seeks at contributing to a better understanding of European Identity, giving hints for future studies and supporting a grounded discussion about a possible further European political and social integration.

Which Characteristics are associated with European Identity among European Citizens?
1
Table of Contents 01
1. Introduction and Context 03
2. Research Question and Sub Questions 04
3. Literature, Theory, and Conceptualization 05
3.1. Defining and Conceptualizing European Identity 05
3.2. Factors influencing European Identity 06 3.2.1. Age 06 3.2.2. Gender 07 3.2.3. Cross-Border Activities 08 3.2.4. News and Symbols 09
3.3. The Social Cleavage Theory and Related Factors 10 3.3.1. The Centre-Periphery Cleavage and Nationality 10
3.3.2. The Church-State Cleavage and Religiosity 11
3.3.3. The Rural-Urban Cleavage and Area of Living 11
3.3.4. The Class Cleavage and Socio-Economic Status 12
3.3.5. Education as a new Cleavage 13
4. Methodology and Data Collection 15
4.1. Operationalization 15 4.1.1. European Identity 15
4.1.2. Education 16
4.1.3. Socio-Economic Status 16
4.1.4. Area of Living 17
4.1.5. Religiosity 17
4.2. Data Collection and Sampling 17
4.3. Method of Analysis 18 4.3.1. Analysis of the Dependent Variable 18
4.3.2. Bivariate Analysis 18
5. Analysis and Outcomes 19
5.1. Analysis of the Dependent Variable 19 5.1.1. The Distributions of “feel European” across samples 19
5.1.2. Comparing the Distributions of the “attachment” items 20
5.1.3. Comparing “feel European” and the “attachment” items 21
5.1.4. Measuring the Association of the two Operationalizations 23

Which Characteristics are associated with European Identity among European Citizens?
2
5.2. Bivariate Analysis 24 5.2.1. Education and European Identity 24
5.2.2. Socio Economic Status and European Identity 26
5.2.3. Area of Living and European Identity 28
5.2.4. Religiosity and European Identity 30
6. Limitations and Relevance 34
6.1. Scientific and Social Relevance 34
6.2. Limitations of this Study 34
7. Conclusions 36
8. Bibliography 38

Which Characteristics are associated with European Identity among European Citizens?
3
1. Introduction and Context
This study analyses the association of education, socio-economic status, area of living, and religiosity as
individual characteristics of European Citizens with the level of European Identity among them. This
might serve as a ground for other researchers to further investigate a possible causal relationship of
these characteristics with European Identity.
In recent years, many writings concerning European Identity were published. The lack of conceptual
coherence of European Identity - nearly every paper provides a different definition or concept of
European Identity, and some even lack a clear description (for example: Agirdag, Huyst, & van Houtte,
2012) - and the focus on only a very few sub topics reveal a need of further exploration of the topic.
European Identity became a popular topic for scientists by the ever closer political cooperation of the
European Union member states and the aim of the European Union institutions, such as the
Commission, to let a European Identity to be formed among European Union citizens (European
Commission, 1993; Cram, Patrikios, & Mitchell, 2011).
In accordance with this goal the European Union initiated some policies to strengthen this process: A
search for a common European cultural heritage was started, and European symbols were introduced or
their use were extended, such as the European flag, anthem, passport, driver´s license, car plates, and,
not least, the Euro (Kohli, 2000; Bruter, 2004; Bruter, 2009; Cram, Patrikios, & Mitchell, 2011).
Moreover, programs were created to stimulate the cross-border communication and cultural exchange,
especially for young people like pupils and students, as the ERASUMS and COMENIUS projects, which
gain more and more attention (van Mol, 2012; Petit, 2007).
These developments, of course, were - and are still - highly discussed in academic literature, which is
reflecting on the existence of a common European cultural heritage, analysing the legitimacy and the
impact of symbols on European Identity (Bruter, 2003; Bruter, 2004; Bruter, 2009; Cram, Patrikios, &
Mitchell, 2011), or studying the impact of exchange programs on European Identity (van Mol, 2012;
Sigalas, 2010), as well as the impact of basic individual characteristics - such as gender, age or social
status - on European Identity (Agirdag, Huyst, & van Houtte, 2012; Kohli, 2000; Lutz, Kritzinger, &
Skirbekk, 2006). Only a few studies about European Identity concern other sub topics.
The further exploration of this field by revealing the relationship of European Identity with other factors
will provide hints for future research. This may contribute to broaden the scope of sub topics on
European Identity and improve our understanding of it.
For that purpose, after introducing structuring research question (chapter 2), I will explain the concept
of European Identity as a dependent variable (chapter 3.1.) and individual characteristics for which
other researchers already indicated a relationship with European Identity in detail (chapter 3.2.).
Additionally, I will examine interesting variables to search for an association with European Identity
(education, socio-economic status, area of living, and religiosity) and their theoretical relevance for the
concept in the light of the social cleavage theory (chapter 3.3.). In chapter 4 I will describe the
methodology and operationalization, while chapter 5 concerns the actual analysis and outcome. Chapter
6 focusses on scientific and social relevance of this study as well as on its limitations. Chapter 7, finally,
contains conclusions and recommendations for further research.
Which Characteristics are associated with European Identity among European Citizens?
4
2. Research Question and Sub Questions
As this study aims at finding causal relationships of individual characteristics with European Identity the
underlying research question for this study is:
Which characteristics are associated to the level of European Identity among European
Citizens?
This question is a descriptive question, as describing an association does not imply or deny that
causation is existent. The limitations in claiming causal relationships between the factors analysed and
European Identity because of the research design will be discussed further in chapter 6.2..
To structure this study I will set up some sub questions, which will be answered one after another and of
which the combined answers are the answer of the main research question. The main research question
implies that at first, a concept and a measure of European Identity is to be established, and building on
this, the associations to other variables could be explored. So the sub question I is:
What is meant with European Identity and how can we measure it?
To answer this question, I will review the work of other researchers. Other researchers also provide
evidence or (for some variables) at least assumptions concerning which characteristics are connected to
the level of European Identity. These need to be analysed and some characteristics need to be chosen
for analysis. Next to this the theory of social cleavages will be employed as a frame for this study. I will
do this as a second step, so sub question II is:
Which independent variables are of theoretical interest from the view of the social Cleavages theory?
Next to choosing relevant independent variables for this study, I will set up hypotheses, based on the
findings and assumptions of other researchers and based on theoretical considerations. The next step is
to search for associations of these characteristics to European Identity and check, whether the
hypotheses are true. As this is the third step, sub question III is:
Which associations between these independent variables and European Identity could be observed and
which differences are there between countries?
In chapter 3 I will discuss why it makes sense to compare the associations across countries. After the
bivariate associations are revealed, there is a need to check whether these could be explained by third
variables. However, this is not in the frame of this thesis. Some hints for which variables could be tested
for a multivariate relationship will be discussed in the final chapter seven.

Which Characteristics are associated with European Identity among European Citizens?
5
3. Literature, Theory, and Conceptualization
This chapter sets up the theoretical ground for this study. It contains (3.1.) a definition and a
conceptualization of European Identity, (3.2.) a review of the findings of other researchers who studied
the relationship of diverse factors with European Identity, and (3.3.) a description of the social cleavage
theory, which will serve as a theoretical framework for this study plus factors which are interesting from
the view of this theory and thus be analysed for an association with European Identity in this study.
3.1. Defining and Conceptualizing European Identity
Starting to search for a clear definition of European Identity it is useful to think about the meaning of
the term for ordinary people as well as in science. Michael Bruter starts analysing European Identity
with the question “Who is European?” and differentiates two perspectives, a top-down and a bottom-up
one (Bruter, 2005).
According to him, the top-down approach specifies the question above to “who should be considered as
European?” which results in an analysis of what determines Europeans and what the natural borders of
Europe are (geographical, political, and cultural) (Bruter, 2005). In this approach the attribute European
is given to people by others according to demographic characteristics.
In practice, categorizing people as owning a European Identity even if they might answer the question
whether they are or feel European negatively does not fit the meaning of identity.
So, for the concept of European Identity it is crucial whether somebody feels European or not, therefore
the bottom-up perspective (also used by Bruter, 2005) should serve for understanding European
Identity. That bottom-up approach asking specifically for “who feels European?” analyse which people
feel European, why they do, and what people mean by saying that they feel European (Bruter, 2005).
Here the attribute European, characterised by each individual´s feelings, is given to people by
themselves.
The two perspectives on analysing “Europeaness” reveal the necessity of differentiating European
Identity from another concept, which is the one of European Citizenship. “European Citizens” would be
one possible answer on the question “who should be considered as European?” asked by the top-down
perspective.
For some scientists, European Citizenship and European Identity are closely intertwined, European
Citizenship resulting from European Identity or both reinforcing each other (as for Bruter, 2005). Others
view European Identity as a concept being independent from European Citizenship, the latter only being
the status of a Citizen in the European Union and the former being characterized by emotions towards
Europe and other Europeans (not necessarily EU citizens (van Mol, 2012; Caporaso & Kim, 2009)) (e.g.
Lutz, Kritzinger, & Skirbekk, 2006). The latter approach seems appropriate for this study, while the
population to be analysed will be European Citizens according to the European Union.
Agirdag, Huyst, & van Houtte declare to work with the definition of European Identity “as a part of the
individual’s self-concept which is derived from his knowledge of membership of a social group (or
groups) together with the value and emotional significance attached to that membership” (Agirdag,
Huyst, & van Houtte, 2012). So European Identity for Agirdag, Huyst, & van Houtte, in contrast to Bruter,
explicitely name the identification with (a group of) people in their definition.
Another useful description is provided by van Mol (2012) saying that identity is the result of continuous
and changing processes of identification as reactions to personal crisis, in which self-positioning is
important as positioning by others. From this, the author derives his definition of European Identity,
which is the sum of the identification processes with Europe (van Mol, 2012). The author explicitly states

Which Characteristics are associated with European Identity among European Citizens?
6
that in his opinion identification, so identity building happens differently for every individual, and that
every collective identity consists of multiple diverse individual identities (van Mol, 2012). This also
includes the ways individuals may perceive Europe: van Mol states that there are multiple mental kinds
of Europe (van Mol, 2012). So identification with Europe may also mean identification with a mental
image of Europe rather than only identification with Europeans. The importance of identification
processes, which are likely to be initiated by socialisation processes, will be discussed later in this
chapter.
Also Kohli characterizes Identity building as a process in which an individual reacts on personal crisis,
and accordingly develops identity as a part of the own personality (2000).
Combining the mentioned definitions and approaches, European Identity is the sum of identification
processes with Europe and/ or Europeans building a mental tie between a person feeling European
identity and Europe and/ or Europeans.
Next to European Citizenship also other concepts are important for the understanding of European
Identity. Now, the conceptual relations with national identity and multiple identities will be explored.
While some authors state that the concept of European Identity “neither in form, nor in substance”
could be drawn from the concept of national identity (Kohli, 2000), others say that for the development
of European Identity the same tools are used as for national identity and that the concepts are related
to each other, not neglecting the historically relatively low age of European Identity (Cram, Patrikios, &
Mitchell, 2011; Bruter, 2005; Sigalas, 2010).
However, most researchers nowadays view national identity and European Identity as conceptual
independent and not mutually exclusive (Kohli, 2000; Lutz, Kritzinger, & Skirbekk, 2006; van Mol, 2012;
Cram, Patrikios, & Mitchell, 2011). The latter fact leads to the possibility of one individual having more
than one identity at a time, so for example a European Identity next to a national identity (or regional or
local identities), which is called multiple (or collective) identities (van Mol, 2012; Cram, Patrikios, &
Mitchell, 2011; Caporaso & Kim, 2009).
The differentiation between (local, regional, and) national identity and European Identity, but also the
fact that these could exist next to each other with differing amounts, will be employed in this study.
3.2. Factors influencing European Identity
In this chapter I will elaborate on what other scientists already found out about the influences on the
level of people´s European Identity, which ties are already established, and which are still unsure. I will
not analyse these factors for an association with European Identity as they are not of theoretical
interest, as I will explain in chapter 3.3., and their interrelations with European Identity are quite well
established already, as we will see now.
3.2.1. Age
One of the simplest individual characteristics is people´s age and quite some scholars analysed the
relationship between age and European Identity.
Employing data from the Eurobarometer Kuhn (2012) finds, although using age solely as a control
variable, that younger people are more likely to identify themselves as European than older ones, which
goes along with the findings of other authors (Duchesne and Frognier, 1995; Citrin and Sides, 2004;
Fligstein, 2008; Kaina and Karolewski, 2009).

Which Characteristics are associated with European Identity among European Citizens?
7
Some of those are also mentioned by Agirdag, Huyst, & van Houtte (2012) while they say that Green
(2007) claims that younger people are less likely to feel European. Unfortunately I am not able to
analyse the causes of Greens findings and the reason why they are contrary to the ones of all the other
authors as I do not have direct access to his writings.
In their study of European Identity among primary school students in Belgium Agirdag, Huyst, & van
Houtte (2012) found that age does not make a difference in the amount of European Identity. The
participants of their study were ten to 14 years old (Agirdag, Huyst, & van Houtte, 2012), so one could
assume that a European Identity is developed at another age, or that the amount of European Identity
differs along cohort lines.
Lutz, Kritzinger, & Skirbekk (2006) provide answers to these hypotheses. Their findings, in line with all
authors except of Green (2007), indicate that older people less likely report a European Identity.
Additionally they state that this is largely due to cohort effects and not due to aging effects meaning
that people attain a European Identity when they are young and keep it. They also observe a slight aging
effect which shows that European Identity among people increases until an age between 50 and 60 and
decreases by people accessing retirement age (Lutz, Kritzinger, & Skirbekk, 2006).
So the reasons for Agirdag, Huyst, & van Houtte (2012) not finding any difference in the level of
European Identity for children with different age could be explained by the possibility of people
developing a European Identity before or after the age of ten and 14, and that their birth dates are too
close to each other to observe a significant difference caused by cohort or aging effects within this
sample.
The findings of Sigalas (2010) indicate that European Identity is developed still in student times as
socializing in ERASMUS years abroad has a higher impact on European Identity among younger than
among older students (for details view the upcoming chapter about cross-border activities 3.2.3.).
The trend in academic literature concerning the influence of age on European Identity is clear. With one
exception all authors found younger people to have a higher amount of European Identity. European
Identity is formed in early years and slightly increased until near retirement age, while younger cohorts
in these days contain of more and more people reporting a European Identity.
These clear trends make a further analysis of the impact of age on European Identity superfluous for this
study. It is also not of interest from the theoretical viewpoint, as no cleavage line could be drawn
between different age groups as there is no political community, say, which is fighting for the rights of
the youth, or the elder (Gallagher, Mair, & Laver, 2006).
3.2.2. Gender
For the second simple individual characteristic, gender, studies found that there is a slightly lower
chance of having a European Identity among women (Duchesne & Frognier, 1995; Green, 2007;
Fligstein, 2008), while Citrin and Sides (2004) indicate that there is no significant difference between
males and females at all.
However, next to most other authors, also Agirdag, Huyst, & van Houtte (2012) report a significantly
lower amount of female children with European Identity in their sample.
The trend discovered is both simple and clear and thus does not need to be researched another time by
this study.

Which Characteristics are associated with European Identity among European Citizens?
8
As for age, also gender is not of theoretical interest in terms of cleavage structure, as mentioned by
Gallagher (2006).
3.2.3. Cross-Border Activities
As a third factor, cross-border activities are analysed by quite some authors by its impact on European
Identity, especially the impact of the ERASMUS student exchanges.
While some author´s emphasize that cross-border activities are positively linked to the amount of
people having a European Identity (Fligstein, 2008; Recchi & Favell, 2009) it is brought forward by others
that this effect is rather small (King & Ruiz-Gelices, 2003; Kuhn, 2012) or that there is no effect at all and
among some students doing an ERASMUS year abroad has even a slight negative effect on European
Identity (Sigalas, 2010).
As one would expect, Scientists provide reasons for the striking differences in the findings on the
academic stage concerning the impact of cross-border activities on European Identity.
As a first thing Kuhn (2012) mentions that the fact that students naturally own the highest amounts of
European Identity lead to a “ceiling-effect” and that their cross-border experience cannot increase
European Identity anymore due to that effect. Although not called by that name, this effect is also
mentioned by Sigalas (2010), who next to this states that people choosing for an ERASMUS year abroad
additionally have higher levels of European Identity than their fellows deciding against it. This fact is also
revealed by King and Ruiz-Gelices (2002), and van Mol (2012). Taking this difference into account the
actual execution of the ERASMUS year has only a small effect, if at all (van Mol, 2012; Sigalas, 2010).
A second aspect being of importance for analysing the effect of cross-national activities like ERASMUS
exchanges on European Identity is the one of socialization. For example King and Ruiz-Gelices (2002)
mention that the positive effect they found is largely influenced by socialization (and high quality
communication). This is confirmed by Sigalas (2010), who additionally states that ERASMUS leads to a
higher increase of European Identity among younger students than among older ones.
Also van Mol (2012) declares socialization to be the most important factor for cross-border activities to
have a positive effect on European Identity. Moreover he states that socialization during cross-border
activities is only effective, if it was not experienced before the cross-border activity back at home,
making socialization the most important factor of causing European Identity in general (van Mol, 2012).
He also brings forward that the impact strongly depends on the region of origin of the students because
of multiple reasons causing different levels of socialization, so in some regions the before called “ceiling-
effect applies for students (for example Western Austria, Poland), while in other regions the amount of
European Identity among students could still be increased by socialization abroad (for example Belgium
and Italy)(van Mol, 2012). In some cases socialization and cross-border exchanges have no effect on
European Identity (as in Norway there rather is a trend towards a Scandinavian than towards a
European Identity) (van Mol, 2012).
Socialization also is an influential factor on European Identity in case that cross-national ties are
established by kinship, so for people with migration-background. Cinnirella and Hamilton (2007) found
that Asian-British report higher levels of European Identity than native British participants. Also Agirdag,
Huyst, & van Houtte (2012) claim that ethnicity matters for the amount of European Identity among
Belgian school children depending on the “specific macro-level context” of their origin (for example:
children with Turkish origin report lower levels of European Identity).

Which Characteristics are associated with European Identity among European Citizens?
9
The links between cross-border activities and European Identity are not as simple and easy to
understand as the effects of age and gender, as they reveal the complexity of the process of attaining a
European Identity, which is largely due to socialisation.
3.2.4. News and Symbols
Another more complex variable, which influences European Identity, is citizens´ exposition to (bad or
good) news related to the European Union and to symbols, which are connected to the European Union.
The author, which is mostly cited in studies concerning the impact of news and symbols on European
Identity is Bruter (2003, 2004, 2005, 2009), who established two dimensions of European Identity, a
civic, and a cultural component of identity. Civic identity refers to people´s identification with rights,
citizenship and political system (of the European Union), while cultural identity refers to people´s
identification with common cultural habits (Bruter, 2009). This distinction is very common and often
used and discussed in academic literature and thus worth a short note here, although not used for this
study.
Bruter revealed that symbols have a permanent and over time growing impact on European Identity.
After connecting a symbol to the European Union for the first time, people start to recognize them in
daily life and identify with them, which is called priming effect by the author (Bruter, 2009).
For news, either good or bad, the so-called time-bomb effect applies: Participants´ European Identity
was negatively affected by the news in an immediate post-test, meaning that bad news concerning EU
issues lead to more European Identity, and good news lead to less. However, in another post-test after
six months, this effect was reversed and highly positively influential (Bruter, 2009). By reading these
results one has to bear in mind that the treatment with news was done via a journal that the
participants read.
Van der Veen (2002) found that the consumption of television news (not manipulated) does have a
lowering effect on European Identity. Lutz, Kritzinger, & Skirbekk (2006) find that the Amsterdam treaty
1997, the Nice treaty 2001, and the introduction of the Euro, of which they measured the impact in
2003, did not have any effect on the level of European Identity among European Citizens.
Risse (2003) concludes that the Euro has an impact on the identification of European Citizens with the
European Union as it brings the European Union into the people´s lives, and on the other hand, they are
comfortable dealing with the Euro as a currency because of their high amounts of European Identity, so
that there is an influential relationship working both ways (Risse, 2003).
Also Cram, Patrikios, & Mitchell (2011) analysed the impact of symbols on European Identity. They
found that the simple exposure of the European Union flag before answering a questionnaire has null
effect. The difference to Bruter´s findings may be caused by the fact that he added the symbols to news
and not to a questionnaire.
Nevertheless, they indicate that there is a positive effect on European Identity by the exposure of
“functional EU symbols”, with which the people connect advantages of the European Union (like a
European passport, or an airport sign) (Cram, Patrikios, & Mitchell, 2011). However this effect is very
dependent on the national and regional circumstances the people live in (Cram, Patrikios, & Mitchell,
2011).
This finding appears very logical if one compares it to the ones about the impact of cross-border
activities on European Identity, in which it was proved that the amount of socialization with Europe in

Which Characteristics are associated with European Identity among European Citizens?
10
people´s context influence the level of European Identity and their potential to attain a European
Identity by cross-border activities. This seems to be valid for the impact of news and, in particular, of
symbols.
3.3. The Social Cleavage Theory and Related Factors
As an underlying theory for choosing characteristics for an analysis of association with European
Identity, the social cleavage structure theory by Lipset and Rokkan will serve, which was shaping political
science considerably (Gallagher, Mair, & Laver, 2006).
A social cleavage is shaped by (1) a social division separating people (e.g. ethnicity, occupation, status,
religion), of which (2) the members of the separated groups are aware, and which (3) is organized in a
certain way (political organizations, political parties in particular) (Gallagher, Mair, & Laver, 2006).
Stubager (2010) describes these three as interrelated elements: (1) a socio-structural, (2) a
psychological, and (3) an organisational, which is a very fitting summary.
The four traditional cleavages defined by Lipset and Rokkan are discussed in the subchapters, they are:
(3.3.1.) the centre-periphery cleavage, (3.3.2) the church-state cleavage, (3.3.3.) the rural-urban
cleavage, and (3.3.4.) the class cleavage. In another sub-chapter (3.3.5.) I will discuss the differences in
the level of education as a newly emerging cleavage and its implications for this study.
For the analysis of an association with European Identity, demographic sociological characteristics will
be chosen which could measure these cleavage structures and whether European Identity is attained
across or along these cleavage lines. After the introduction of a cleavage a variable will be offered to
measure the cleavage.
3.3.1. The Centre-Periphery Cleavage and Nationality
The first cleavage mentioned by Lipset and Rokkan is the one between “subject culture” and “dominant
culture”, which now mostly is described as the centre-periphery cleavage with a country´s socio-political
centre one the one side and the periphery on the other, dating back to the times when central
authorities in modern European states were forged (Gallagher, Mair, & Laver, 2006).
On the centre side of the political system were those trying to implement national standards in laws,
markets and cultures, on the periphery side those trying to maintain independent and autonomous,
because they identified themselves as a cultural minority (linguistic, religious, or ethnic) and not
represented by the central government (Gallagher, Mair, & Laver, 2006).
Lipset and Rokkan do not differentiate between peripheral minorities being concentrated in a particular
region in the country and the ones being dispersed all over the country, while there is a difference in
how they experience European integration (Marks & Wilson, 2000). The former are pro-European-
integration as this might support the shift of authority from a national level to their region for diverse
reasons, for example, they become one minority among many in more unified Europe, while they stand
as a single minority against a national majority in a non-integrated Europe, which makes it easier to fight
for their interests. The latter, on the other hand, are against centralisation of authority, no matter if it is
on a national level or on a European one. Centralisation on a European Level might even be feared more
as this means less control on decision making, made on a level even more alien to their cultural milieu
(Marks & Wilson, 2000).
The fact that it is necessary to differentiate between dispersed and concentrated minorities in terms of
support for European integration, and thus, most likely, also for European Identity, next to the one that

Which Characteristics are associated with European Identity among European Citizens?
11
the amount and nature of minorities are varying a lot from country to country, shows that it is
important to compare the figures across country lines.
It is also imaginable that there is something to be observed like a centre-periphery cleavage on a
European level, may it be geographically or by state power within in the European Union decision
making process, or both. In the analysis we will pay attention to this.
Another reason for comparing country levels is that other researchers found differences in the
relationship of European Identity and individual characteristics as mentioned before and in the rest of
this chapter. For example, the mean amount of European Identity differs largely not only by nation, but
by region or even by town, depending on the “mean experience of Europe” in that area (van Mol, 2012).
Next to this it also influences the potential of attaining a European Identity by education or cross-
national activities (van Mol, 2012). Also some effects of news and symbols are dependent on the
country and region people live in (Cram, Patrikios, & Mitchell, 2011).
All these facts make it interesting to not only search for differences in the amount of European Identity
across countries, but also in differences in the strength of associations of the individual characteristics
named in this chapter with European Identity across country lines and analyse them. This will be done
in the analysis.
3.3.2. The Church-State Cleavage and Religiosity
The church-state cleavage, also occurring when modern European states were built, divides people
which are in favour of the church being an authority on the moral dimension of politics and the ones
being against this (Gallagher, Mair, & Laver, 2006). It is also about rights and privileges of the church in
society, for example in setting guide lines in education schedules (Gallagher, Mair, & Laver, 2006).
The historical presence of this cleavage differs a lot in Europe depending on the dominant confession in
a country. Protestant churches mostly were national churches and became “agents of the state” not
challenging its policies, which made the cleavage not emerge in Protestant countries (Gallagher, Mair, &
Laver, 2006). The Catholic Church however regarded itself as being above the state belonging to a
supranational institution organised from the Vatican, opposing secularising policies, and creating an
autonomous cultural environment by maintaining independent schools and rejecting secular education
(Gallagher, Mair, & Laver, 2006). This, and the desire of the Catholic Church to influence state law
concerning public morality, such as divorce and censorship, in most cases lead to conflicts between
Catholic entities and liberal or radical parties and still continues in some countries, especially Eastern
European countries (like Poland) after the fall of communism (Gallagher, Mair, & Laver, 2006).
Marks & Wilson stress that people living in Catholic countries in which the cleavage was present are
rather pro-European integration as it is consistent with the supranational aspirations of the Catholic
Church, while the national character of Protestant churches should lead them to be more sceptical of
European integration (Marks & Wilson, 2000).
There is hardly any study focussing on the relationship of religion or religiosity and European Identity,
only a note by Agirdag, Huyst, & van Houtte (2012) that different religions do not matter for the level of
European Identity if one controls for ethnicity. However, it is very interesting to see, if the level of
European Identity differs between the states which are Catholic or Protestant and if it differs between
people who are religious, as a measure for which side of the cleavage they are, and people who are not.
These things lead to the following hypothesis, which will be analysed in this study:
Hypothesis I: “Higher levels of religiosity are associated with lower levels of European Identity among
European Citizens in Protestant Countries and lower levels of religiosity are associated with lower levels
of European Identity among European Citizens in Catholic Countries.”

Which Characteristics are associated with European Identity among European Citizens?
12
3.3.3. The Rural-Urban Cleavage and Area of Living
The third cleavage divides the defenders of the traditionally dominant rural interests on the one side
and the new urban industrial classes on the other side. The cleavage became acute by the start of the
industrialisation in the 19th century. It did not lead to partisan conflict in most of continental western
European states, but in Scandinavia and in parts of Eastern Europe urban interests became dominant
creating rural oppositions and resulting in powerful agrarian parties which are still existent nowadays
(Gallagher, Mair, & Laver, 2006).
Because of several reasons the cleavage still has certain relevance today: A new clash between city and
country is emerging as urban poverty increases and wealthy people move to the country side or
suburbs, which both leads to lower tax incomes in the cities and a higher need of government spending
(Gallagher, Mair, & Laver, 2006). On the other side, the introduction of the free market and the reducing
of subsidies for farmers lead to decreasing prices for farmers´ goods and lower economic support
resulting in lower living standards of farmers in most European countries. This leads to protests on both
national and European level and although farmers make up a small proportion in the western European
workforce they still have large influences in parties and lobby groups (Gallagher, Mair, & Laver, 2006).
Most importantly, the on-going existence of the cleavage also becomes clear by the emotional reaction
on minor policy issues like the question on forbidding fox hunting in Britain 2003/ 2004, which was
fought for and against very intensely by urban and rural entities (Gallagher, Mair, & Laver, 2006).
It is clear that the area of living (rural or urban) is the individual characteristic which fits most to
determine on which side of the rural-urban cleavage people could be allocated. Regarding its
relationship to European Identity, living in an urban or rural area did not receive that much attention
from researchers.
Duchesne & Froginer (1995) report a positive impact of living in a large city or town on European
Identity and also Lutz, Kritzinger, & Skirbekk (2006) state that people in urban areas have a higher
European Identity.
Van der Veen (2002) states that the positive effect is spurious and that it diminishes and even turns out
to be negative if one takes also other variables into account. He offers two explanations for this negative
effect. One is that in urban areas a higher percentage of people might be employed by the national
government and thus have a lower amount of European Identity, while the second is that more rural
areas are close to intra-European borders, which may make the people living there to have more direct
international interactions and thus a higher amount of European Identity (van der Veen, 2002).
Like van der Veen, I consider it necessary to shed more light on the relation of the place of living and
European Identity, not at least because his explanations of a negative effect of urban living on European
Identity do not seem plausible to me. Because of this, and because of the findings of the before
mentioned researchers, the following hypothesis will be tested:
Hypothesis II: “Living in an urban area in contrast to living in a rural area is associated with higher levels
of European Identity among European Citizens.”
3.3.4. The Class Cleavage and Socio-Economic Status
The most important cleavage emerging from the industrial revolution was the conflict between the
workers on the one side and the owners of capital (and their allies) on the other side. Trying to
compensate their lack of economic resources compared to the capital owners, the workers organized

Which Characteristics are associated with European Identity among European Citizens?
13
themselves in large numbers in trade unions and political parties improve their conditions of working
and living (Gallagher, Mair, & Laver, 2006).
Although the class cleavage was present in all European Countries, it differed in intensity. While in all
countries socialist parties emerged, in some countries also communist parties arose and even surpassed
the socialist ones. This mostly was dependent on the response of the bourgeoisie to the worker´s
demands. Accommodating and pragmatic reactions like in Scandinavia and Britain lead workers not to
opt for radical alternatives and to be integrated into national politics. Repressive responses lead to a
more radical agenda of the working class and stronger communist parties like in France, Germany, Italy,
and Spain (Gallagher, Mair, & Laver, 2006).
Comparing the traditional cleavages, the class cleavage is the most important and most often
observable cleavage nowadays (Gallagher, Mair, & Laver, 2006) and continuing to dominate European
party systems and policy agendas (Marks & Wilson, 2000).
To differentiate on which side of the class cleavage a person is to be allocated it makes sense to
measure the person´s socio-economic status. Next to age, gender, cross-national activities, and
nationality, also socio-economic status was studied by some scientists for a relationship with European
Identity, already.
Some authors state that European Identity is supported by and a feature of the elites of European
society so one would assume also for people with a high socio-economic status (e.g. Kohli, 2000; Bruter,
2003; Kuhn, 2012). Supporting this, the individual endowment with resources is related to higher
amounts of European Identity (Kaina & Karolewski, 2009).
Although there are some hints for a link of socio-economic status and European Identity, only two
studies found evidence in this matter. One is from Kuhn (2012), who in her study also uses socio-
economic status as a control variable, finding that those with a higher status occupation are more likely
to have a European Identity (Kuhn, 2012).
As a second study, Agirdag, Huyst, & van Houtte find evidence for Belgian pupils coming from families
with a higher socio-economic status to report higher amounts of European Identity (2012). They also
conclude that, even if controlled for family socio-economic status, also higher socio-economic status of
the school positively influences European Identity (Agirdag, Huyst, & van Houtte, 2012).
The results of the two mentioned studies, as well as the statements of other authors indicate that higher
socio-economic status may be linked to higher level of European Identity leading this study to test the
following hypothesis:
Hypothesis III: “Higher Socio-economic status is associated with higher levels of European Identity
among European Citizens.”
3.3.5. Education as a new Cleavage
Next to the mentioned traditional cleavages I will discuss and include the different levels of education as
a newly emerging cleavage in my analysis. It is found by Stubager that the level of education determines
to a large extent whether a person is either in favour of a liberitarian, in the case of a high level of
education, or rather an authoritarian system, in the case of a low level of education (Stubager, 2010).
Although Stubager solely analysed Denmark for the existence of this cleavage (finding that the cleavage
clearly has emerged since the last three decades), he also offers strong arguments why the cleavage is
also very likely to be existent in other European states. As a first one he mentions that the increase in
the level of education, which is one important ground for the development of this cleavage, is not only

Which Characteristics are associated with European Identity among European Citizens?
14
to be observed in Denmark, but also in other countries in the Western world (Stubager, 2010).
Moreover education is proven to have the strongest impact on the authoritarian/ liberiterian values,
which in detail will be explained below. This effect is to be observed especially in advanced industrial
societies, but also in other countries, so the basic connection in the education cleavage system seems to
be widespread (Stubager, 2010). Additionally, the political conflict structure, shaped by the economic
and the authoritarian/ liberitarian dimension could also be found in other European states; although the
detailed content might vary from country to country, the underlying dynamics are the same (Stubager,
2010). These facts, for which Stubager names a lot of cross-references, makes it quite likely that the
education cleavage is also present in most European countries, and thus will be analysed here.
Now I will explain the dynamics of the educational cleavage, as described by Stubager: There are two
core aspects forming the liberitarian or authoritarian view, which are the attitudes towards hierarchy
and tolerance. Authoritarian people favour a social hierarchy with a rank ordering of “superior” and
“inferior” people and regard this as natural and right, while liberitarian people dislike social hierarchies
and favour free and open interactions with all people regardless of their social position (Stubager, 2010).
Tolerance on the other hand is important for liberitarians, who regard differences among people as
natural and desirable, also, and in particular, differences from their culture, norms and values. For
Authoritarians however, conformity with the norms and values of their society is desirable and
necessary, and variety is potentially bad and deserves no protection (Stubager, 2010).
These attitudes allow to hypothesise that people with a higher education have higher levels of European
Identity than people with a lower education. People with a lower education, being rather authoritarian,
might tend to feel alienated from other European peoples and their cultures, norms, and values, while
people with a higher education, being more liberitarian, might welcome to extend their possibilities to
get into contact with people from a different cultural background, and thus feel more European.
The findings of other researchers also head in this direction as scientists agree upon the fact that a
higher education leads to a higher chance of attaining a European Identity, so say Duchesne and
Frognier (1995), Citrin and Sides (2004), Kuhn (2012), and Lutz, Kritzinger, & Skirbekk, (2006). It is stated
that, because of different reasons, people with academic background report the highest amount of
European Identity (Sigalas, 2010). All this leads to the following hypothesis which will be tested:
Hypothesis IV: “Higher levels of education are associated with higher levels of European Identity among
European Citizens.”
Which Characteristics are associated with European Identity among European Citizens?
15
4. Methodology
This chapter describes the methodology which is used to test the hypothesis outlined in chapter 3.
which is (4.1.) the operationalization of the variables, (4.2.) the data collection and (4.3.) the methods to
analyse the data.
4.1. Operationalization
The Operationalization contains a description of the way how the diverse variables are measured. I will
explain the operationalization of European Identity first (4.1.1.), followed by education (4.1.2.), socio-
economic status (4.1.3.), area of living (4.1.4.), and religiosity (4.1.5.).
4.1.1. European Identity
In most of the papers about European identity the authors describe that it is very hard to measure such
an abstract concept. Next to the fact that identity is a feature, which, as such, differs in nature and
amount from individual to individual (van Mol, 2012), Bruter correctly states that there are no universal
signs being visible or measurable for the existence of a European Identity (2009).
After this he states that identity does not necessarily result in positive feelings and support, but possibly
also in shame or other negative feelings, citing Wodak (1999)(Bruter, 2009). This remark is crucial, as
some authors take it for granted that support for Europe or the European Union is a valid variable to
proof the existence of European Identity (for example: Agirdag, Huyst, & van Houtte, 2012). Bruter`s
remark, however, implies that support might be an inappropriate measure for the existence of
European Identity, as shame could result from identity and negatively affect (open) support.
Making the best of it, most authors studying secondary data (as e.g. Kohli, 2000; Lutz, Kritzinger, &
Skirbekk, 2006) employ the data of the Eurobarometer for indicating European Identity (item: “feel
European”). There, the participants are asked whether they in the near future will feel national only,
national and European, European and national, or European only (Eurobarometer, 2013). National in
each country is substituted by the participant´s country, of course.
This includes the above mentioned aspect of feeling European instead of being labelled European, as
well as it does not ignore the existence of multiple identities and measures European Identity also if the
national identity is predominant, which actually is the case mostly (Lutz, Kritzinger, & Skirbekk, 2006).
The pitfalls of this measure are obvious. It is asked for the participants´ attitudes in the near future,
which could lead to higher levels of European Identity than actually present, as people might think that
they are more European in the future by the ever closer cooperation of the European Union member
states.
On the other hand, they are asked to report their feeling of being European, while diverse authors
mention the possible unawareness of a person about its European identity or its sub consciousness
(Bruter, 2009; Cram, Patrikios, & Mitchell, 2011). This may result in the effect that some people do not
report their European identity, although they might sub consciously feel European.
Additionally it is to be noticed that the context - there are more questions about attitudes towards
European features/ institutions/ the European Union (Eurobarometer, 2013) - in which the question is
asked may also influence the participants´ answer whether they feel European or not, as it is proven to
happen in similar cases (Cram, Patrikios, & Mitchell, 2011).

Which Characteristics are associated with European Identity among European Citizens?
16
Despite these mentioned weaknesses in measuring European Identity this way, most researchers still do
so, even if they do not study the Eurobarometer and set up their own experiments (King & Ruiz-Gelices,
2003; Sigalas, 2010). This is done for making all results comparative and because the weaknesses are not
so crucial that a change of the question would be necessary. Because of this, the outcomes from the
mentioned question of the Eurobarometer will be used for measuring European Identity. To control at
least to some extent for the weaknesses of the item the frequencies will be compared with the ones of
another question, which asks for the degree of attachment of the participant´s to the European Union.
These will be compared with the ones of a similar question about the attachment to country. This item
does not ask for the participants´ perceptions in the near future, but the current ones, additionally it is
not asked for “feeling European” but for attachment, which might cause differences. Also the difference
between Europe and the European Union is present in the two operationalizations.
As most authors do (e.g. Lutz, Kritzinger, & Skirbekk, 2006), I will recode the question into two
categories differentiating between people who have a national identity exclusively (so no European
Identity) and people who own a European Identity (at least to some degree). This is done to fulfil the
conditions of some statistical tests, as explained later. Although it is not of so much theoretical
importance whether people name their European Identity or their national identity first, or whether
they do not have a national identity at all, it will still be looked at the item with the original distributions
to not miss any important points.
4.1.2. Education
For measuring the level of education, the Eurobarometer provides one standard question which asks for
the age of the respondent, when full-time education was finished. Next to the category “no full time
education” and “still studying”, the participant could choose between the categories “14 years or
younger” and “22 years or older” and all years inbetween.
Although it might be that participants after full-time education receive a part-time education or they
started with full-time education being older or younger than other participants, this is a quite
straightforward measure, which may not lead to too many errors. As it is also the only measure which is
provided by the Eurobarometer, it will be used in this paper to measure education.
4.1.3. Socio-Economic Status
For measuring socio-economic status, the Eurobarometer contains two questions. One of them asks for
the participants opinion about which social class he or she belongs to, offering (1) “working class”, (2)
“lower middle class”, (3) “middle class”, (4) “upper middle class”, and (5) “upper class”.
The subjectiveness may lead to errors in the results of this question, I would assume that people would
classify themselves rather in one of the middle class categories, then in the category working class or
upper class.
A second question which could be employed for measuring participant´s socio-economic status is the
question for the participant´s job. This question offers quite some answer possibilities from farmer/
fisher to executive top management. The difficulty in measuring socio-economic status by the outcomes
of this question is the need of a scale of socio-economic status on which the diverse jobs are ranged in,
which, again, would imply a highly subjective act, this time not on side of the participant, but on side of
the researcher. There are studies about the social status, which a job is giving to a person in the eyes of
people, but applying this and building a score would be out of the frame of this study. So it will be
concentrated on the first item to measure socio-economic status.
Which Characteristics are associated with European Identity among European Citizens?
17
4.1.4. Area of Living
Also for testing whether the participants live in an urban or in a rural area there is an item in the
Eurobarometer. The question asks the participant´s for a subjective assessment of their place of living. It
asks if the participants live in a (1) “rural area or village”, (2) “small or middle size town”, or (3) in a
“large town”.
As this is the only variable which could be used for assessing people´s place of living on whether it is
rural or urban it will be used in this study.
4.1.5. Religiosity
For measuring religiosity Eurobarometer contains three questions, the first asking for the importance of
religion in the participant´s life, the second asking for the amount of the participant´s attendance of
religious services and the third for a subjective self-assessment of the participant´s religiosity,
independent of his/her church attendance.
The collection of these questions give an accurate picture of the participants religiosity. However, every
question gives information about another aspect of religiosity, therefore all items will be analysed
individually.
4.2. Data Collection and Sampling
As described in the operationalization the item “feel European” in the Eurobarometer, which asks the
participants whether they see themselves as exclusively nationals, nationals and Europeans, Europeans
and nationals, or exclusively Europeans, will serve as the item to measure European Identity. I will
compare it with the “attachment to the European Union” item.
To gain as current results as possible, the recent Eurobarometer files were scanned for these questions.
It appears that the Eurobarometer 62.0 from October and November 2004 (n = 29334) is the only file in
which both questions are asked.
An advantage of this file is that the new member states of the European Union are included, as well as
the candidate states for this time, so we also have data for Romania, Bulgaria, and Croatia, which joined
the European Union after the file was produced. Also Turkey and the Turkish part of Cypress are
included in the sample, while West and East Germany are measured separately as well as Northern
Ireland and Great Britain.
Most countries are represented with an n ranging from 909 (Romania) to 1061 (Czech Republic). Only
Slovakia has a higher n (1227), while the n is lower for Eastern Germany (506), Malta (498), the Cyprus
(Republic) (496), Luxembourg (486), and Northern Ireland (277).
A disadvantage is that only the independent variables “education” and “area of living” are covered by it
and not “socio-economic status” nor any measure of “religiosity”.
These two were measured together with the “feel European” item in Eurobarometer 42, which is from
Autumn 1994 (n = 16667). The disadvantage of this file is that only the old member states are included
in this file. Also for this file, Northern Ireland and Great Britain are measured separately, as well as West
and East Germany. Also Norway is included in this file.
All countries are represented with an n ranging from 997 (Portugal) and 1082 (Austria), except of
Luxembourg (n = 500), Sweden (n = 501), and Northern Ireland (n = 306).
Which Characteristics are associated with European Identity among European Citizens?
18
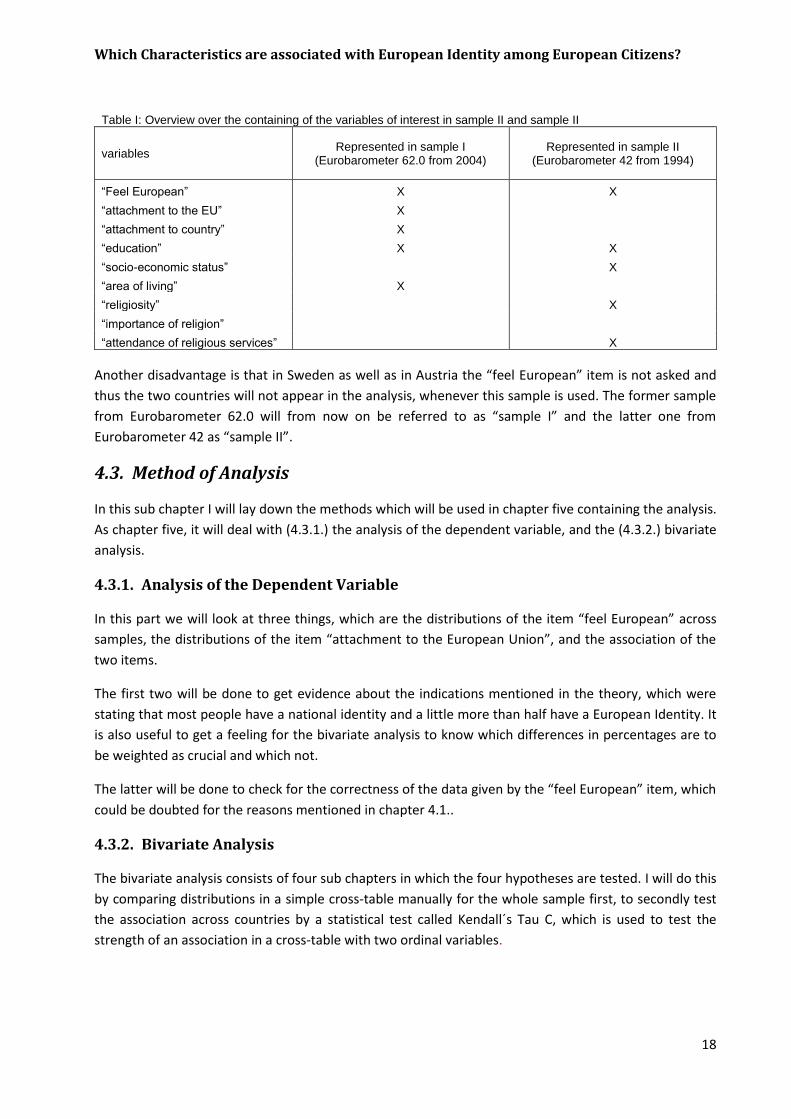
Table I: Overview over the containing of the variables of interest in sample II and sample II
variables Represented in sample I
(Eurobarometer 62.0 from 2004) Represented in sample II
(Eurobarometer 42 from 1994)
“Feel European” X X
“attachment to the EU” X
“attachment to country” X
“education” X X
“socio-economic status” X
“area of living” X
“religiosity” X
“importance of religion”
“attendance of religious services” X
Another disadvantage is that in Sweden as well as in Austria the “feel European” item is not asked and
thus the two countries will not appear in the analysis, whenever this sample is used. The former sample
from Eurobarometer 62.0 will from now on be referred to as “sample I” and the latter one from
Eurobarometer 42 as “sample II”.
4.3. Method of Analysis
In this sub chapter I will lay down the methods which will be used in chapter five containing the analysis.
As chapter five, it will deal with (4.3.1.) the analysis of the dependent variable, and the (4.3.2.) bivariate
analysis.
4.3.1. Analysis of the Dependent Variable
In this part we will look at three things, which are the distributions of the item “feel European” across
samples, the distributions of the item “attachment to the European Union”, and the association of the
two items.
The first two will be done to get evidence about the indications mentioned in the theory, which were
stating that most people have a national identity and a little more than half have a European Identity. It
is also useful to get a feeling for the bivariate analysis to know which differences in percentages are to
be weighted as crucial and which not.
The latter will be done to check for the correctness of the data given by the “feel European” item, which
could be doubted for the reasons mentioned in chapter 4.1..
4.3.2. Bivariate Analysis
The bivariate analysis consists of four sub chapters in which the four hypotheses are tested. I will do this
by comparing distributions in a simple cross-table manually for the whole sample first, to secondly test
the association across countries by a statistical test called Kendall´s Tau C, which is used to test the
strength of an association in a cross-table with two ordinal variables.

Which Characteristics are associated with European Identity among European Citizens?
19
5. Analysis and Outcomes
This chapter contains the actual analysis and its outcomes. It is divided into (5.1.) the analysis of the
dependent variable, and (5.2.) the bivariate analysis.
5.1. Analysis of the Dependent Variable
In this sub chapter we will look at the (5.1.1.) distributions of the item “feel European” in the two
samples, (5.1.2.) compare the distributions of the item “attachment to the European Union” and the
item “attachment to country”, to (5.1.3.) compare them with the ones of “feel European”, and (5.1.4.)
measure the association between “feel European” and “attachment to the European Union” two for an
association.
5.1.1. The Distributions of “feel European” across samples
As displayed below in Table II, we have 36.9% in the category “(Nationality) only” for sample II (n =
14539), 48.8% in “(Nationality) and European”, 8.7% in “European and (Nationality)”, and 5.6% in
“European only”.
In sample I, we have two ballots for the “feel European” item, one ballot (n = 14541) was asked the
question given the known categories, while the second ballot (n = 14222) was asked an additional
category: “As European as (Nationality)”.
For the first ballot 46.1% of the participants are in the category “(Nationality) only”, 45.9% in
“(Nationality) and European”, 5.2% in “European and (Nationality)” and 2.8% in “European only”.
For the second ballot 42.2% are in the category “(Nationality) only”, 46.8% in the category “(Nationality)
and European”, 3.1% in “European and (Nationality)”, 2.2% in “European only”, and 5.6% in “As
European as (Nationality)”.
Table II: Comparing the distributions of the item “feel European” across samples and ballots
Categories Sample II ballot I (Sample I) ballot II (Sample I)
(Nationality) only 36.9% 46.1% 42.2%
(Nationality) and European 48.8% 45.9% 46.8%
As (Nationality) as European Not asked Not asked 5.6%
European and (Nationality) 8.7% 5.2% 3.1%
European only 5.6% 2.8% 2.2%
So we see that adding the category “as European as (Nationality)” leads to slight changes in the
outcomes.
Furthermore, this underlines the trend mentioned by other researchers that if people have a European
Identity it is mostly next to a prevailing national identity. Additionally we find that people from sample II
have higher levels of European Identity than people in sample I. This could be explained in two ways: It
may be that European Identity decreased over the years and thus is lower in sample I than in sample II,
or the adding of the new candidate and member states in sample I causes the difference in the overall
distributions for this variable.
Which Characteristics are associated with European Identity among European Citizens?
20
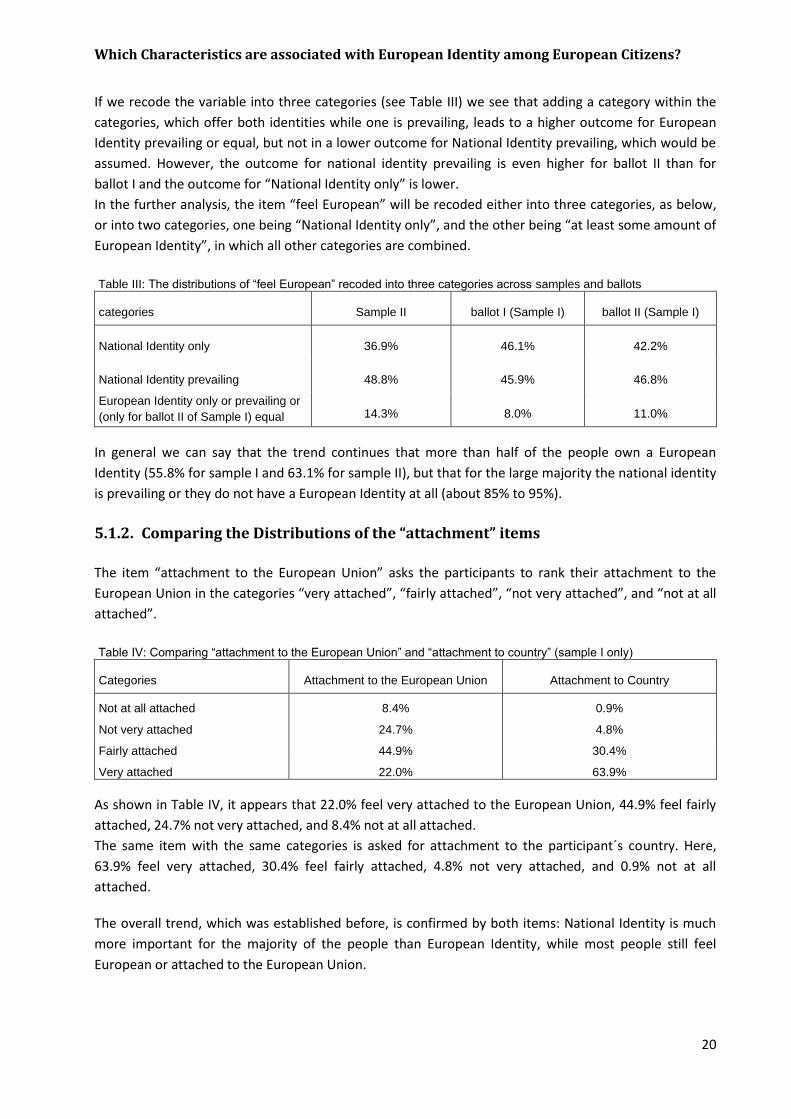
If we recode the variable into three categories (see Table III) we see that adding a category within the
categories, which offer both identities while one is prevailing, leads to a higher outcome for European
Identity prevailing or equal, but not in a lower outcome for National Identity prevailing, which would be
assumed. However, the outcome for national identity prevailing is even higher for ballot II than for
ballot I and the outcome for “National Identity only” is lower.
In the further analysis, the item “feel European” will be recoded either into three categories, as below,
or into two categories, one being “National Identity only”, and the other being “at least some amount of
European Identity”, in which all other categories are combined.
Table III: The distributions of “feel European” recoded into three categories across samples and ballots
categories Sample II ballot I (Sample I) ballot II (Sample I)
National Identity only 36.9% 46.1% 42.2%
National Identity prevailing 48.8% 45.9% 46.8%
European Identity only or prevailing or
(only for ballot II of Sample I) equal 14.3% 8.0% 11.0%
In general we can say that the trend continues that more than half of the people own a European
Identity (55.8% for sample I and 63.1% for sample II), but that for the large majority the national identity
is prevailing or they do not have a European Identity at all (about 85% to 95%).
5.1.2. Comparing the Distributions of the “attachment” items
The item “attachment to the European Union” asks the participants to rank their attachment to the
European Union in the categories “very attached”, “fairly attached”, “not very attached”, and “not at all
attached”.
Table IV: Comparing “attachment to the European Union” and “attachment to country” (sample I only)
Categories Attachment to the European Union Attachment to Country
Not at all attached 8.4% 0.9%
Not very attached 24.7% 4.8%
Fairly attached 44.9% 30.4%
Very attached 22.0% 63.9%
As shown in Table IV, it appears that 22.0% feel very attached to the European Union, 44.9% feel fairly
attached, 24.7% not very attached, and 8.4% not at all attached.
The same item with the same categories is asked for attachment to the participant´s country. Here,
63.9% feel very attached, 30.4% feel fairly attached, 4.8% not very attached, and 0.9% not at all
attached.
The overall trend, which was established before, is confirmed by both items: National Identity is much
more important for the majority of the people than European Identity, while most people still feel
European or attached to the European Union.

Which Characteristics are associated with European Identity among European Citizens?
21
Graph I: Comparing “attachment to the European Union” and “attachment to country” (sample I only)
5.1.3. Comparing “feel European” and the “attachment” items
The differences between the items “feel European” and “attachment to the European Union” could be
discussed lengthy, starting with the one between “European” and “European Union”, over the
combining of national and European feeling in one question in the item “feel European” and not doing it
for “attachment to the European Union/ country”, to the difference of feeling national/ European and
feeling attached to a country/ the European Union.
We cannot prove which of these differences in the questions causes the differences in the distributions
between the items, which are displayed in Table V.
Looking at the table, the trend described in the former two sub chapters holds true as for each country
the amount of people fairly or very attached to their country is higher than the amount being fairly or
very attached to the European Union and also higher than the amount of people reporting to feel
European at least to some degree in the item “feel European”.
However, there are huge differences, both across countries for both items, as well as between items for
quite some countries.
Starting with the cross-country differences it is noticeable that it is quite equal for “feel European”
across the two samples, both little more than 30 percent points from the member state with the highest
to the one with the lowest score.
For sample II, Luxembourg scores highest for the share of people having at least some European feeling
(83%), while Great Britain scores lowest (49%). The total score is 63%.
In sample I, the six EU founding members have high shares of feeling European, all being in the top
eight. Only in nine countries the share of people feeling European is lower than 50%, while the total
share is 56%. The highest share is to be observed for France and Belgium with 71% of people feeling
European, while Turkey is the country with the lowest share (32%), followed by Hungary (39%) being the
EU member state with the lowest share.
0.9% 4.8%
30.4%
63.9%
8.4%
24.7%
44.9%
22.0%
0%
10%
20%
30%
40%
50%
60%
70%
not at all attached not very attached fairly attached very attached
resp
on
de
nts
pe
r ite
m (
pe
rce
nta
ge
)
level of attachment
Attachment to Country
Attachment to the European Union

Which Characteristics are associated with European Identity among European Citizens?
22
While the value for Turkey is also lowest for people being fairly or very attached to the EU (27%),
Hungary has the highest score of all measured states here (92%). For most states the score is higher
than 60%, just nine states score below, while the score for the total sample is 67%.
Table V: The distributions of the operationalizations and“attachment to country” across countries
Country at least some
European feeling (sample II)
at least some European feeling
(sample I)
fairly or very attached to the
EU
Difference between column
II and III
fairly or very attached to
country
France 77.5% 71.0% 67.3% 3.7 93.2%
Belgium 68.6% 71.0% 75.7% -4.7 85.4%
Cyprus (Republic) no data 69.6% 37.9% 31.7 97.4%
The Netherlands 66.5% 68.6% 61.0% 7.6 83.3%
Italy 73.7% 67.9% 79.1% -11.2 95.0%
Germany West 71.4% 67.2% 68.5% -1.3 88.0%
Croatia no data 64.3% 69.0% -4.7 95.3%
Luxembourg 83.2% 64.2% 83.9% -19.7 95.6%
Romania no data 62.3% 89.2% -26.9 96.1%
Malta no data 62.2% 60.5% 1.7 95.6%
Spain 64.5% 61.3% 69.2% -7.9 92.7%
Austria no data 60.7% 68.4% -7.7 95.2%
Denmark 52.1% 59.9% 74.9% -15.0 97.9%
Slovakia no data 59.9% 69.0% -9.1 90.3%
Germany East 64.8% 58.3% 72.2% -13.9 89.3%
Bulgaria no data 58.2% 71.2% -13.0 96.9%
Northern Ireland 54.1% 56.7% 54.1% 2.6 72.7%
Slovenia no data 55.8% 77.6% -21.8 97.6%
Total 63.1% 55.8% 66.9% -7.3 94.3%
Cyprus (TCC) no data 55.1% 60.1% -5.0 97.9%
Poland no data 54.3% 86.0% -31.7 98.2%
Sweden no data 54.0% 78.7% -24.7 94.7%
Ireland 61.5% 53.4% 76.2% -22.8 98.9%
Estonia no data 50.8% 41.5% 9.3 95.3%
Latvia no data 49.9% 54.8% -4.9 94.3%
Greece 55.0% 47.0% 48.4% -1.4 97.4%
Czech Republic no data 46.7% 80.2% -33.5 92.9%
Portugal 56.1% 46.4% 57.2% -10.8 96.6%
Great Britain 48.7% 45.7% 51.3% -5.6 92.1%
Lithuania no data 45.1% 47.2% -2.1 96.0%
Finland 61.2% 44.8% 72.4% -27.6 97.2%
Hungary no data 38.9% 91.6% -52.7 97.9%
Turkey no data 31.7% 27.2% 4.5 97.8%
The difference between sample II and sample I in the share of people feeling European to at least some
extent differs across countries. While in most countries the percentage decreased, it also increased for
some. The most significant decrease is to be found for Luxembourg, for which it is 19 percent points,
while also for Finland it is very high (16 percent points). The share increased most for Denmark (8
percent points).
The difference between the “feel European” and “attachment to the EU” also varies a lot across
countries, for quite some it is near to zero percent points, while for the whole sample the difference is

Which Characteristics are associated with European Identity among European Citizens?
23
7.3 percent points from “at least some European feeling” to “fairly or very attached to the European
Union”. For only seven countries, the percentage of people who feel European is higher than the one of
people who fairly or very attached to the European Union. For Cyprus (Republic) this difference is
highest (32 percent points). In the other direction the difference is highest for Hungary as described
above (53 percent points), while also six other countries report a difference of at least 20 percent points
in this direction. It is to be noted that all these countries are either Nordic states or new member states
of the European Union except of Ireland.
5.1.4. Measuring the Association of the two Operationalizations
Table VI: Association of “feel European” and “attachment to the European Union” across countries (sample I)
Country Kendall´s Tau-C for
ballot I (three categories)
p-value Kendall´s Tau-C for
ballot II (three categories)
p-value Kendall´s Tau-C for
both ballots(two categories)
p-value
Malta 0.397 <0.001 0.428 <0.001 0.561 <0.001
Cyprus (Republic) 0.356 <0.001 0.377 <0.001 0.479 <0.001
Great Britain 0.338 <0.001 0.366 <0.001 0.461 <0.001
Cyprus (TCC) 0.279 <0.001 0.420 <0.001 0.413 <0.001
Greece 0.305 <0.001 0.319 <0.001 0.401 <0.001
Germany West 0.297 <0.001 0.343 <0.001 0.382 <0.001
France 0.380 <0.001 0.310 <0.001 0.373 <0.001
Portugal 0.282 <0.001 0.228 <0.001 0.35 <0.001
Croatia 0.265 <0.001 0.264 <0.001 0.344 <0.001
Turkey 0.206 <0.001 0.316 <0.001 0.339 <0.001
Austria 0.285 <0.001 0.302 <0.001 0.330 <0.001
Estonia 0.247 <0.001 0.250 <0.001 0.309 <0.001
Northern Ireland 0.301 <0.001 0.125 0.122 0.285 <0.001
Latvia 0.267 <0.001 0.173 <0.001 0.284 <0.001
Bulgaria 0.240 <0.001 0.255 <0.001 0.283 <0.001
Spain 0.198 <0.001 0.218 <0.001 0.281 <0.001
Total 0.221 <0.001 0.218 <0.001 0.276 <0.001
Italy 0.201 <0.001 0.204 <0.001 0.254 <0.001
The Netherlands 0.198 <0.001 0.188 <0.001 0.253 <0.001
Germany East 0.228 <0.001 0.163 0.002 0.250 <0.001
Lithuania 0.212 <0.001 0.153 <0.001 0.247 <0.001
Finland 0.223 <0.001 0.156 <0.001 0.246 <0.001
Denmark 0.190 <0.001 0.181 <0.001 0.224 <0.001
Ireland 0.199 <0.001 0.141 <0.001 0.221 <0.001
Slovakia 0.141 <0.001 0.159 <0.001 0.213 <0.001
Belgium 0.231 <0.001 0.160 <0.001 0.199 <0.001
Poland 0.146 <0.001 0.138 <0.001 0.169 <0.001
Sweden 0.120 0.001 0.116 0.003 0.147 <0.001
Czech Republic 0.107 0.001 0.097 0.006 0.130 <0.001
Slovenia 0.072 0.055 0.103 0.007 0.109 0.002
Luxembourg 0.003 0.960 0.180 0.002 0.078 0.098
Romania 0.115 0.003 0.002 0.965 0.058 0.100
Hungary 0.068 0.035 0.040 0.263 0.055 0.084

Which Characteristics are associated with European Identity among European Citizens?
24
To make things easier for the bivariate analysis, “feel European” recoded into three categories will only
be used for sample II, as there are no ballots and enough cases to do the tests, while for sample I it will
be recoded into two categories as this is the only way to combine both ballots in a correct way and have
enough cases.
As one could expect, the association measured for the latter test (two categories) is higher for all
countries for which the test is highly significant as the amount of categories, and thus the possibility of
outliers, is reduced. Still the rank of the countries stays nearly the same for both tests.
For most countries both tests are significant at the 0.01 level, while for Hungary, Romania and
Luxembourg the latter test is only significant at a 0.10 level. For these countries Kendall´s Tau is lower
than 0.10, so the association is very low. The lowest association of a country tested at a high significance
level is the one for Slovenia, for which Kendall´s Tau 0.11 in the second test. The highest association is
measured for Malta for which Kendall´s Tau is 0.40 for ballot I, 0.43 for ballot II, and 0.56 for the second
test. The Kendall´s Tau measured for the whole sample is 0.22 for both ballots, and 0.28 for the second
test.
From these tests we can follow that the association between the two items measuring the dependent
variable is differing a lot across countries. For no country, however, a very strong association was
measured. This leads to the conclusion that the two items measure different things, but that the
difference between the two varies (quite a lot) across countries.
As the “feel European” item better covers our concept of European Identity, we will continue working
with this variable with the mentioned recoding.
5.2. Bivariate Analysis
Here, we will test the hypotheses which were established in chapter 3.3. one after another in a bivariate
analysis. The direction in which the hypothesis will be analsed is accoring to the current importance of
the cleavage they represent, thus we will start with (5.2.1.) education and European Identity, followed
bz (5.2.2.) socio-economic status and European Identity, (5.2.3.) area of living and European Identity,
and (5.2.4.) religiosity and European Identity.
5.2.1. Education and European Identity
Hypothesis IV from chapter 3.3. was: “Higher levels of education are associated with higher levels of
European Identity among European Citizens.”
Table VII: The distributions of “feel European” across the categories of “education” (sample I)
Age when finishing full-time education National Identity only At least some European Identity
No full-time education 64.6% 35.4%
Up to 14 years 62.9% 37.1%
15 years 59.4% 40.6%
16 years 50.5% 49.5%
17 years 46.3% 53.7%
18 years 43.7% 56.3%
19 years 37.7% 62.3%
20 years 38.8% 61.2%
21 years 32.7% 67.3%
22 years and older 29.5% 70.5%
Still studying 32.1% 67.9%

Which Characteristics are associated with European Identity among European Citizens?
25
In general, the hypothesis seems to be confirmed by the outcomes displayed in Table VII. The share of
European Identity rises more or less steadily the longer the people were educated, starting with 35.4%
for people without any full-time education and ending with 70.5% for people being 22 or older when
finishing full-time education.
Graph II: The distributions of “feel European” across the categories of “education” (sample I)
One irregularity is to be observed for the category of being educated until the age of 20, as people
owning a European Identity is smaller here than for the people who are educated until the age of 19.
A possible explanation for this might be that people finishing education with an age of 19 just got their
high school diploma and do not attend university, while people who finish their education with an age of
20 were, in most cases probably, attending university for one year, which might strengthen their
national identity on costs of the European one. This could be caused by socialisation processes with
fellow students coming from all over the country, which might cause local, regional, and national
identification.
Now, we look at the measures of association across countries as shown in Table VIII. Here it is to be
observed that for each and every analysed country the test is significant at a 0.01 level, which means
that there is an association between education and European Identity in every country.
The association is strongest for Finland, for which Kendall´s Tau-C is 0.42, and weakest for Denmark, for
which Kendall´s Tau-C is 0.09. For the whole sample Kendall´s Tau C is 0.26.
35.4% 37.1%
40.6%
49.5%
53.7%
56.3%
62.3% 61.2%
67.3%
70.5%
67.9%
30%
35%
40%
45%
50%
55%
60%
65%
70%
75%
80%
No full-time education
Up to 14 years
15 years 16 years 17 years 18 years 19 years 20 years 21 years 22 years and older
Still studying
people
ow
nin
g a
t le
ast som
e E
uro
pean Identity
age in years when full-time education finished

Which Characteristics are associated with European Identity among European Citizens?
26
Table VIII: Association of “feel European” and “education” across countries (sample II)
Country Kendall´s Tau-C for “feel European” recoded into two
categories versus “education” (sample II) p-value
Finland 0.416 <0.001
Greece 0.360 <0.001
Germany East 0.349 <0.001
Poland 0.329 <0.001
Northern Ireland 0.321 <0.001
Luxembourg 0.314 <0.001
Malta 0.314 <0.001
Slovenia 0.301 <0.001
Cyprus (Republic) 0.296 <0.001
Hungary 0.294 <0.001
Lithuania 0.291 <0.001
Germany West 0.289 <0.001
Estonia 0.283 <0.001
Great Britain 0.277 <0.001
Austria 0.277 <0.001
France 0.271 <0.001
Slovakia 0.265 <0.001
Total 0.261 <0.001
Bulgaria 0.234 <0.001
Latvia 0.229 <0.001
Sweden 0.228 <0.001
Croatia 0.222 <0.001
Belgium 0.219 <0.001
Italy 0.219 <0.001
Ireland 0.219 <0.001
Spain 0.197 <0.001
Czech Republic 0.183 <0.001
The Netherlands 0.174 <0.001
Cyprus (TCC) 0.161 0.002
Romania 0.159 <0.001
Turkey 0.139 <0.001
Portugal 0.096 0.005
Denmark 0.094 0.006
So we conclude that there is a relatively strong association between education and European Identity,
which is differing across countries.
5.2.2. Socio Economic Status and European Identity
Hypothesis III from chapter 3.3. was: “Higher Socio-economic status is associated with higher levels of
European Identity among European Citizens.”
Socio-economic status was one of the independent variables, which was only to be found in sample II,
so we compare the distributions of “feel European” recoded into three and into two categories across
the diverse categories of socio-economic status, as shown in table IX.

Which Characteristics are associated with European Identity among European Citizens?
27
Starting with a look at the dichotomised “feel European” we could observe that also hypothesis II seems
to be true overall. The percentage of people reporting European Identity increases from 52.8% for
“working class” to 77.5% for “upper middle class”, while the one for “upper class” (75.6%) reports lower
European Identity than “upper middle class” but still higher than “middle class” (68.2%). This finding
opposes the hypothesis.
Table IX: The distributions of “feel European” across the categories of “socio-economic status”
Category of „socio-
economic status”
National Identity
only
National Identity
prevailing
European Identity
only or prevailing
at least some
European Identity
Working Class 47.2% 40.4% 12.4% 52.8%
Lower Middle Class 38.5% 47.3% 14.2% 61.5%
Middle Class 31.8% 53.2% 15.0% 68.2%
Upper Middle Class 22.5% 57.6% 19.9% 77.5%
Upper Class 24.4% 53.3% 22.3% 75.6%
A possible explanation of the results for “upper class” might be that people that categorize themselves
there might be part of the national elite and thus have more national identity and a lower European
Identity. Another explanation is the very small amount of participants in this category (204 of 13033), so
maybe the findings are biased, although the amount of 204 people is statistically relevant.
Graph III: The distributions of “feel European” across the categories of “socio-economic status”
However, when we look at the values for “feel European” with three categories, we observe that the
values are according to the hypothesis for “European Identity only or prevailing” increasing for each
category of socio-economic status (also for “upper class”), while the decrease for “upper class” in the
dichotomised variable is to be explained by a decrease in the category “national Identity prevailing”
from “upper middle class” (57.6%) to “upper class” (53.3%), falling again on the level of “middle class”
(53.2%).
47.2
38.5
31.8
22.5 24.4
52.8
61.5
68.2
77.5 75.6
40.4
47.3
53.2
57.6
53.3
12.4 14.2 15.0
19.9 22.3
0%
10%
20%
30%
40%
50%
60%
70%
80%
90%
100%
Working Class Lower Middle Class Middle Class Upper Middle Class Upper Class
am
ou
nt o
f re
sp
on
de
nts
(p
erc
en
tag
e)
Social Class
National Identity only
at least some European Identity
National Identity prevailing
European Identity only or prevailing

Which Characteristics are associated with European Identity among European Citizens?
28
Concluding we can say that higher socio-economic status is associated with higher levels of European
Identity, while people placing themselves in the category “upper class” score higher in “national Identity
only” and lower in “national Identity prevailing” than the ones from “ upper middle class”.
Looking at the measures of association across countries we see that also for socio-economic status the
test is significant at the 0.01 level for most countries. For the dichotomised “feel European” item it is
significant at the 0.05 level for Luxembourg and Italy and not significant for Northern Ireland and for
Norway. For “feel European” with three categories it is significant at the 0.05 level for Great Britain, at
the 0.10 level for Italy, and not significant for Luxembourg, Northern Ireland, and Norway.
Again we have higher values for Kendall´s Tau-C for the dichotomized dependent variable, while the
rank is nearly the same for both tests. Denmark scores highest with 0.18 (three categories) and 0.24
(two categories), while the lowest score at a 0.01 level is the one of Spain with 0.09 (three categories)
and 0.11 (two categories).
Table X: The association between “feel European” and “socio-economic status” (sample II)
Country Kendall´s Tau C for “feel
European” (three categories) p-value
Kendall´s Tau C for “feel European” (two categories)
p-value
Denmark 0.176 <0.001 0.239 <0.001
Belgium 0.154 <0.001 0.233 <0.001
Netherlands 0.141 <0.001 0.197 <0.001
Greece 0.137 <0.001 0.190 <0.001
Total 0.129 <0.001 0.171 <0.001
Portugal 0.136 <0.001 0.169 <0.001
Germany West 0.129 <0.001 0.150 <0.001
Germany East 0.122 <0.001 0.145 <0.001
Ireland 0.112 <0.001 0.145 <0.001
France 0.106 <0.001 0.127 <0.001
Great Britain 0.064 0.017 0.114 0.001
Spain 0.086 0.001 0.110 0.001
Luxembourg 0.043 0.269 0.075 0.037
Italy 0.051 0.052 0.071 0.021
Northern Ireland 0.045 0.358 0.046 0.457
Norway 0.040 0.140 0.032 0.364
We can conclude from this that for most countries there is an association between socio-economic
status and European Identity, which is lower in general than the one between education and European
Identity.
5.2.3. Area of Living and European Identity
Hypothesis II from chapter 3.3. was: “Living in an urban area in contrast to living in a rural area is
associated with higher levels of European Identity among European Citizens.”
We see that also hypothesis II seems to head into the right direction. With every category of area of
living the share of people owning a European Identity is rising, starting with 50.1% for “rural area or
village”, over 57.8% for “small or middle sized town”, to 60.9% for “large town”. This pattern is very
clear and does not show an outlier category, as we saw it for education and socio-economic status.
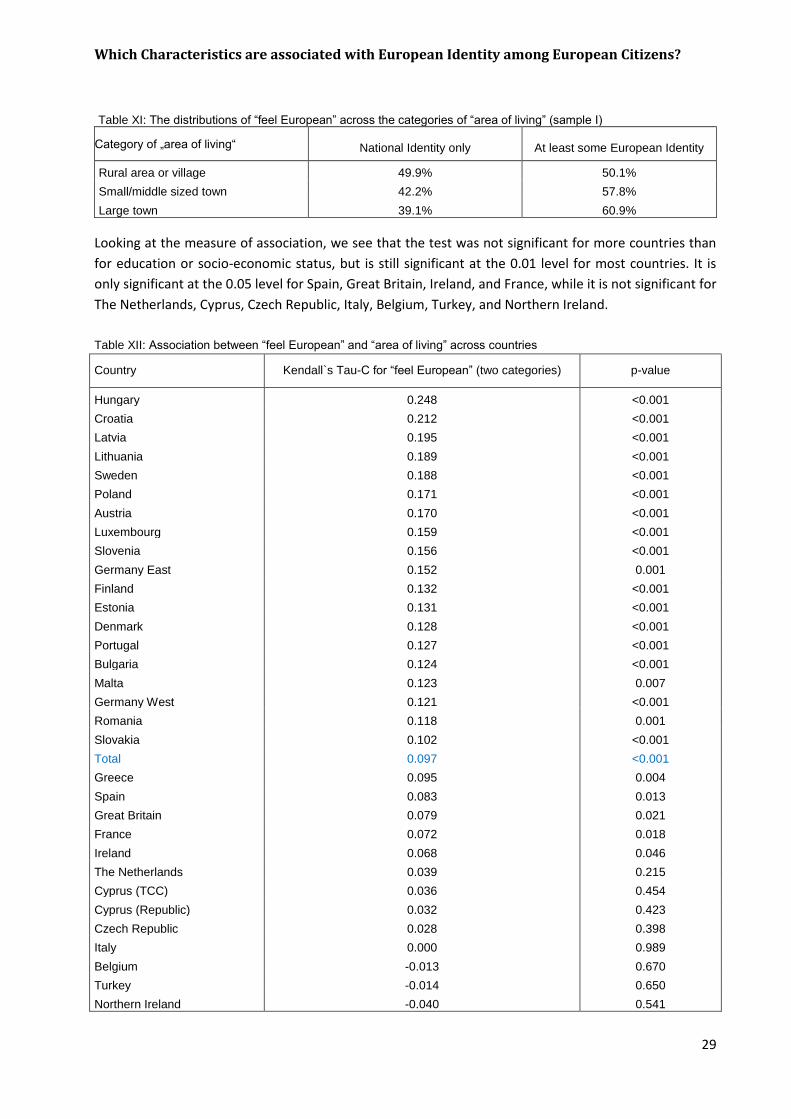
Which Characteristics are associated with European Identity among European Citizens?
29
Table XI: The distributions of “feel European” across the categories of “area of living” (sample I)
Category of „area of living“ National Identity only At least some European Identity
Rural area or village 49.9% 50.1%
Small/middle sized town 42.2% 57.8%
Large town 39.1% 60.9%
Looking at the measure of association, we see that the test was not significant for more countries than
for education or socio-economic status, but is still significant at the 0.01 level for most countries. It is
only significant at the 0.05 level for Spain, Great Britain, Ireland, and France, while it is not significant for
The Netherlands, Cyprus, Czech Republic, Italy, Belgium, Turkey, and Northern Ireland.
Table XII: Association between “feel European” and “area of living” across countries
Country Kendall`s Tau-C for “feel European” (two categories) p-value
Hungary 0.248 <0.001
Croatia 0.212 <0.001
Latvia 0.195 <0.001
Lithuania 0.189 <0.001
Sweden 0.188 <0.001
Poland 0.171 <0.001
Austria 0.170 <0.001
Luxembourg 0.159 <0.001
Slovenia 0.156 <0.001
Germany East 0.152 0.001
Finland 0.132 <0.001
Estonia 0.131 <0.001
Denmark 0.128 <0.001
Portugal 0.127 <0.001
Bulgaria 0.124 <0.001
Malta 0.123 0.007
Germany West 0.121 <0.001
Romania 0.118 0.001
Slovakia 0.102 <0.001
Total 0.097 <0.001
Greece 0.095 0.004
Spain 0.083 0.013
Great Britain 0.079 0.021
France 0.072 0.018
Ireland 0.068 0.046
The Netherlands 0.039 0.215
Cyprus (TCC) 0.036 0.454
Cyprus (Republic) 0.032 0.423
Czech Republic 0.028 0.398
Italy 0.000 0.989
Belgium -0.013 0.670
Turkey -0.014 0.650
Northern Ireland -0.040 0.541

Which Characteristics are associated with European Identity among European Citizens?
30
The strongest association was measured for Hungary (Kendall´s Tau-C: 0.25), the weakest at a 0.01
significance level for Greece (Kendall´s Tau-C: 0.10), while the association for the total sample is 0.10.
We can conclude that for most countries there is an association between area of living and European
Identity, although, in general, it is quite weak. Maybe it is due to an effect of a third variable, as
indicated by other researchers (van der Veen, 2002).
5.2.4. Religiosity and European Identity
Hypothesis I from chapter 3.3. was: “Higher levels of religiosity are associated with lower levels of
European Identity among European Citizens in Protestant Countries and lower levels of religiosity are
associated with lower levels of European Identity among European Citizens in Catholic Countries.”
As described in chapter four, the two measures for religiosity, which are examined in this study, are only
available for sample II. Looking at the simple cross-table (Table XII) it is striking that the least difference
is between people who report that they are religious, of which 61.0% have a European Identity, and
people who report that they are not religious, for which it is 63.5%. The far largest share of people
owning a European Identity is the category of people stating that they are agnostic, 78.5% of them have
a European Identity, followed by the atheists (72.6%).
Table XIII: The distributions of “feel European” across the categories of “religiosity” (sample II)
Category of „religiosity“
National Identity only National Identity
prevailing European Identity only
or prevailing at least some
European Identity
Religious 39.0% 48.7% 12.3% 61.0%
Not Religious 36.5% 48.3% 15.2% 63.5%
Agnostic 21.5% 55.1% 23.4% 78.5%
Atheist 27.4% 44.9% 27.8% 72.6%
When looking at the “feel” European variable with three categories we see that this pattern is similar as
the one observed for socio-economic class. For “European Identity only or prevailing” we have a trend
just as hypothesised with increasing values for each category of religiosity, but for “national Identity
prevailing” there is a large decrease for the category “atheist” for which the share falls even below the
one of all the other categories.
Graph IV: The distributions of “feel European” across the categories of “religiosity” (sample II)
39.0 36.5
21.5
27.4
61.0 63.5
78.5
72.6
48.7 48.3
55.1
44.9
12.3 15.2
23.4 27.8
0%
10%
20%
30%
40%
50%
60%
70%
80%
90%
100%
Religious Not Religious Agnostic Atheist
amo
un
t o
f re
spo
nd
ents
(p
erce
nta
ge)
Religiosity
National Identity only
at least some European Identity
National Identity prevailing
European Identity only or prevailing

Which Characteristics are associated with European Identity among European Citizens?
31
Concluding we can say that for the overall sample there seems to be an association of lower levels of
religiosity with higher levels of European Identity, except for the category “atheist” of religiosity, which
scores higher on “national Identity only” than the category “agnostic” and lower on “national Identity
prevailing” than all other categories.
Table XIV: The association of “feel European” and “religiosity” across countries (sample II)
Country Kendall´s Tau-C for “feel
European” (three categories) p-value
Kendall`s Tau-C for “feel European” (two categories)
p-value
Great Britain 0.118 <0.001 0.134 <0.001
Netherlands 0.123 <0.001 0.126 <0.001
Belgium 0.116 <0.001 0.096 0.001
Spain 0.087 <0.001 0.075 0.010
Germany East 0.063 0.034 0.074 0.032
Denmark 0.049 0.060 0.066 0.047
Total 0.076 <0.001 0.065 <0.001
Luxembourg 0.071 0.037 0.063 0.038
France 0.090 0.002 0.055 0.060
Germany West 0.069 0.010 0.049 0.090
Italy 0.055 0.003 0.044 0.018
Portugal 0.031 0.024 0.042 0.017
Ireland 0.028 0.199 0.034 0.218
Greece 0.029 0.021 0.028 0.052
Northern Ireland -0.026 0.573 -0.031 0.586
Norway -0.027 0.322 -0.042 0.222
Looking at the measure of association across country it is observed that only a few tests are significant
at a 0.01 level. For the tests with the “feel European” item with three categories the test is significant at
a 0.05 level for Germany East, Portugal, Luxembourg and Greece, at a 0.10 level for Denmark, and not
significant for Ireland, Northern Ireland, and Norway.
For the test with the “feel European” item with two categories the test is significant at a 0.05 level for
Spain, Germany East, Denmark, Luxembourg, Italy, and Portugal, at a 0.10 level for France, Germany
West, and Greece, and not significant for Ireland, Northern Ireland, and Norway. We also observe very
little differences between the two test outcomes.
The highest score for Kendall´s Tau C is the one for the Netherlands with 0.12 (three categories of “feel
European”) and 0.13 for Great Britain (two categories), while the lowest score at a 0.01 significance level
is 0.06 for Italy (three categories) and 0.08 for Spain (two categories). The overall score is 0.08 (three
categories) and 0.07 (two categories), both at a 0.01 significance level.
We can conclude that the association between religiosity and European Identity is very weak, if existent
at all, differing across countries.
Now we look at the association of European Identity with the attendance of religious services. Having a
look at the simple cross-table, we once again observe a similar trend as for socio-economic status and
religiosity. While the shares of people owning a European Identity increase for every category of
“attendance of religious services” from 56.5% for “several times a week” to 64.2% for “once a year or
less”, it decreases again for the last category being 59.8% for people who “never” attend religious
services.
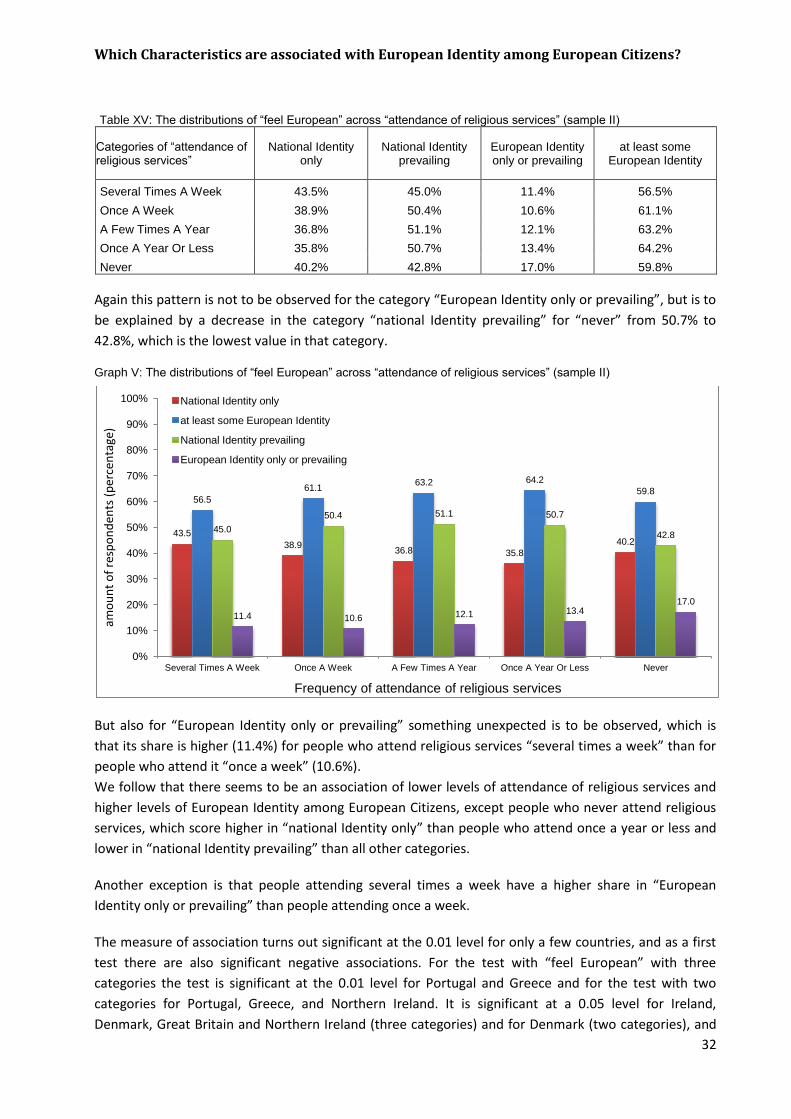
Which Characteristics are associated with European Identity among European Citizens?
32
Table XV: The distributions of “feel European” across “attendance of religious services” (sample II)
Categories of “attendance of religious services”
National Identity only
National Identity prevailing
European Identity only or prevailing
at least some European Identity
Several Times A Week 43.5% 45.0% 11.4% 56.5%
Once A Week 38.9% 50.4% 10.6% 61.1%
A Few Times A Year 36.8% 51.1% 12.1% 63.2%
Once A Year Or Less 35.8% 50.7% 13.4% 64.2%
Never 40.2% 42.8% 17.0% 59.8%
Again this pattern is not to be observed for the category “European Identity only or prevailing”, but is to
be explained by a decrease in the category “national Identity prevailing” for “never” from 50.7% to
42.8%, which is the lowest value in that category.
Graph V: The distributions of “feel European” across “attendance of religious services” (sample II)
But also for “European Identity only or prevailing” something unexpected is to be observed, which is
that its share is higher (11.4%) for people who attend religious services “several times a week” than for
people who attend it “once a week” (10.6%).
We follow that there seems to be an association of lower levels of attendance of religious services and
higher levels of European Identity among European Citizens, except people who never attend religious
services, which score higher in “national Identity only” than people who attend once a year or less and
lower in “national Identity prevailing” than all other categories.
Another exception is that people attending several times a week have a higher share in “European
Identity only or prevailing” than people attending once a week.
The measure of association turns out significant at the 0.01 level for only a few countries, and as a first
test there are also significant negative associations. For the test with “feel European” with three
categories the test is significant at the 0.01 level for Portugal and Greece and for the test with two
categories for Portugal, Greece, and Northern Ireland. It is significant at a 0.05 level for Ireland,
Denmark, Great Britain and Northern Ireland (three categories) and for Denmark (two categories), and
43.5
38.9 36.8 35.8
40.2
56.5
61.1 63.2 64.2
59.8
45.0
50.4 51.1 50.7
42.8
11.4 10.6 12.1 13.4 17.0
0%
10%
20%
30%
40%
50%
60%
70%
80%
90%
100%
Several Times A Week Once A Week A Few Times A Year Once A Year Or Less Never
amo
un
t o
f re
spo
nd
ents
(p
erce
nta
ge)
Frequency of attendance of religious services
National Identity only
at least some European Identity
National Identity prevailing
European Identity only or prevailing

Which Characteristics are associated with European Identity among European Citizens?
33
significant at the 0.10 level for no country with the “feel European” item with three categories and for
Ireland for with two categories. The test was not significant in both tests for Spain, Norway, the
Netherlands, Belgium, Italy, France, Germany East and West, while it is not significant with three
categories for “feel European” for Luxembourg, and not for the overall sample with two categories.
Table XVI: The association of “feel European” and “attendance of religious services” across countries (sample II)
Country Kendall´s Tau-C for “feel
European” (three categories) p-value
Kendall`s Tau-C for “feel European” (two categories)
p-value
Portugal 0.092 0.002 0.107 0.004
Greece 0.073 0.004 0.102 0.001
Ireland 0.051 0.047 0.054 0.088
Spain 0.043 0.163 0.052 0.187
Norway 0.026 0.439 0.045 0.280
Netherlands 0.048 0.238 0.031 0.539
Total 0.028 0.002 0.017 0.116
Belgium 0.045 0.216 0.013 0.766
Italy 0.012 0.668 0.008 0.799
France 0.033 0.330 0.005 0.893
Germany East 0.013 0.812 -0.005 0.934
Germany West 0.002 0.940 -0.007 0.846
Luxembourg 0.016 0.703 -0.029 0.485
Denmark -0.061 0.046 -0.076 0.048
Great Britain -0.081 0.026 -0.112 0.015
Northern Ireland -0.118 0.034 -0.181 0.009
The highest value of Kendall`s Tau-C at is 0.09 (three categories) and 0.1 for Portugal, and the lowest -
1.2 (both tests) for Northern Ireland, while the overall value is 0.03 (three categories) or not significant
(two categories).
We can conclude that no clear trend could be established for an association between the attendance of
religious services and European Identity in most countries, while there is a slight negative association in
Great Britain and Northern Ireland and a slight positive association in Portugal and Greece.

Which Characteristics are associated with European Identity among European Citizens?
34
6. Limitations and Relevance
In this chapter I will elaborate on the (6.1.) scientific and social relevance of this study as well as on its
(6.2.) limitations in validity of the findings.
6.1. Scientific and Social Relevance
Currently, not only in social sciences but also on the political stage, the topic of Europe is of extremely
high interest as European political integration is pushed by the European Union and its member states,
recently by expanding the responsibilities of the European Union as a reaction on the Euro crisis. It is
questioned by multiple instances, on scientific, political and civic level, if further integration could be
legitimized by purely economic arguments, which leads the discussion to increasingly turn away from a
simple economist one (Bruter, 2003).
This is the point at which it becomes very interesting to talk about European Identity. If there is a
European Identity to be observable broadly among European citizens, this could be an argument pro
further political integration (Easton, 1965; Kohli, 2000; Sigalas, 2010). If, however, European Identity is
barely to be proofed at all, or only among a very small number of European Citizens (possibly exclusively
belonging to an elite class), this is most likely an argument to slow down or stop European political
integration (Bruter, 2003; Bruter, 2005; Sigalas, 2010).
This study does not aim at giving arguments pro or contra European political integration. For decision
makers, however, it is important to ground their actions on empirical evidence. Thus it is necessary to
find factors associated to European Identity to deepen our understanding of it. This study aims at
contributing to exactly that, by adding an analysis of factors, which are not only basic characteristics like
age or gender, as already focussed on by other researchers (e.g.: Lutz, Kritzinger, & Skirbekk, 2006;
Kohli, 2000; Agirdag, Huyst, & van Houtte, 2012), but characteristics which indicate the membership of
group in a classic or modern cleavage (see chapter 3)
Subsequently, this may give hints for other researchers to further study the causal relationships of
European Identity to provide the grounds for a better discussion on issues concerning European political
(and social) integration for political decision makers.
6.2. Limitations of this Study
The resources for this study are quite limited, as it is only one person to do all the work in a limited time
frame. The limitations in terms of physical and time resources also result in the limitations of this paper.
Bearing this in mind, an important objective is the prevention of focusing on superfluous aspects in
analysing the very broad and complex topic of European Identity. This is why emphasis is laid on
collecting data and exploring associations, although it would be of high interest to gain empirical
evidence by executing experiments about relationships revealed by analysing the Eurobarometer data.
Time, money, and physical resources however limit this study to stay at the level of analysing secondary
data exclusively.
So we also have to keep in mind that there is no real proof that the associations found in the data are
relationships of causal nature, as we do not deal with a pre- and post-test, a control group, or a
controlled treatment.

Which Characteristics are associated with European Identity among European Citizens?
35
Studying secondary data also makes it important to think about biases which could influence the data
and manipulate the outcomes. This is why it was decided to use an operationalization of the variables,
which is as simple as possible, so that also the likelihood of biases is as low as possible. However, for
abstract concepts only abstract measures are possible, so the association between European Identity
and another complex variable in quantitative data should not be overestimated.
Another weakness of validity is the subjectiveness of almost all measured variables, namely European
Identity, socio-economic status, area of living, and religiosity. It could be assumed that people weight
micro differences more influential than macro differences as they do rather recognize and relate
themselves to their nearer surrounding consciously than to their macro context. For example, if
someone lives in a country in which a town with 50000 inhabitants belongs to the ten biggest cities in a
country (like in Slovakia) the person might consider it as living in an large town, while in other countries
(like in Germany or the Netherlands) this might be reported as living in a middle-sized town.
Which Characteristics are associated with European Identity among European Citizens?
36
7. Conclusions
There are quite some interesting outcomes found in this study, which I will present and interprete in this
chapter.
Analysing the questions “feel European” and “attachment to the European Union” as items to measure
European Identity four facts could be established: (1)The items measure different things, this difference
varies largely across countries. (2) The analysis of both items show that most people do have a European
Identity, but for the large majority the national identity is prevailing. (3) It is found that the amount of
people having a European Identity decreased from 1995 to 2005 both for the overall EU, as also for most
countries, it increased only for a few countries. (4) The relative amount of people having a European
Identity differs a lot across countries, while the founding members of the European Union have
relatively high shares.
The latter fact might be an indicator for a new centre-periphery cleavage on a European Union level in
terms of a geographical centre (to which all the founding states clearly belong) and periphery, as the
founding states have especially high shares of European Identity. Moreover, it is significant that the
relative amount of people owning a European Identity decreased from 1995 to 2005, which opposes the
trend found by others (Lutz, Kritzinger, & Skirbekk, 2006), it would be interesting to find why this is the
case and why the changes differ so much across countries.
In the bivariate analysis, in which the association of European Identity with the variables education,
socio-economic status, area of living, and religiosity were tested, six facts were revealed: (1) There are
huge differences in all bivariate associations across countries. (2) There is a relatively strong association
between education and European Identity, differing across countries, while the first year of University
education seems to weaken European Identity. (3) For most countries there is an association of socio-
economic status and European Identity, while, opposing the association, people reporting to be in the
upper class show relatively high shares of exclusively national identities, and relatively low shares of
having a national identity prevailing over a European one. (4) For most countries, although quite weak,
there is an association of living in an urban area and having a European Identity. (5) For some countries
there is an association of lower levels of religiosity and higher levels of European Identity, while atheists,
opposing the association, show relatively high shares of exclusively national identities, and very low
shares of having a national identity prevailing over a European one. (6) For a few countries there is a
weak association of attending religious services and European Identity, which for three countries is
positive (Denmark, Great Britain, and Northern Ireland) and for two negative (Portugal and Greece).
Of particular interest are the facts, which are opposing the hypothesis, so it is of interest to find out, if
the explanation of the first year at University to weaken European Identity holds true (as it was found to
be lower for people finishing full-time education at an age of 20 instead of 19 years). Moreover it would
be an attractive topic of research to find out why the extreme categories “upper class” of socio-
economic status, and “atheist” of religiosity the share of people owning an exclusively national identity
is relatively high and the share of people owning a national identity prevailing the European one is
relatively low and if this holds true across countries.
We can conclude from the facts that hypothesis IV and hypothesis III could be seen as true, so that the
building of European Identity happens along the cleavage lines of the education and the class-cleavage.
Also hypothesis II is true for most analysed countries, so European Identity building is happens along this
cleavage lines in most countries. However, as suggested by other researchers as mentioned in chapter

Which Characteristics are associated with European Identity among European Citizens?
37
3., this might be due to the fact that people with a higher education and a higher socio-economic status
tend to live in rather urban areas. This was not tested in this study and might be interesting to
investigate for other researchers. Hypothesis I was not found to be true, in fact only for a very few
countries a significant association of religiosity and European Identity was found and no This might be
due to the fact that the church-state cleavage is not as current anymore as the other cleavages, as
mentioned in chapter 3.
In table XVII it is summarised which countries scored higher than 0.1 or higher than 0.15 for Kendall’s
Tau-C in a number of tests. It is noticeble that there is no order to be observed in this overview, neither
central or peripheral European states score especially high or low, nor founding or new states, nor large
or small states.
Table XVII: Summarising the outcomes of the bivariate analysis
In two tests at least In three tests at least
Countries scoring > 0.15 or < -0.15 for Kendall´s Tau-C (p-value < 0.05)
Austria Belgium Croatia Germany East
Germany West
Greece Hungary Ireland Latvia Lithuania
Luxembourg Netherlands Poland Slovenia Sweden
Germany East
Countries scoring > 0.1 or < -0.1 for Kendall´s Tau-C (p-value < 0.05)
Austria Belgium Bulgaria Croatia Denmark Estonia Finland France Germany East Germany West
Great Britain Greece Hungary Ireland Latvia Lithuania Luxembourg
Malta Netherlands Northern Ireland
Poland Portugal
Romania Slovakia Slovenia Spain Sweden
Belgium Germany East Germany West Great Britain (even four tests) Greece (even four tests) Netherlands Portugal
Bold: the country is also represented in the column to the right Italic: the country is also represented in the row above

Which Characteristics are associated with European Identity among European Citizens?
38
8. Bibliography
Agirdag, O., Huyst, P., & van Houtte, M. (2012). Determinants of the Formation of a European Identity
among Children: Individual- and School-Level Influences. Journal of Common Market Studies Vol. 50 No.
2 , 198-213.
Bruter, M. (2005). Citizens of Europe? The Emergence of a Mass European Identity. London: Palgrave
Macmillan.
Bruter, M. (2004). On what citizens mean by feeling ‘European’: perceptions of news, symbols and
borderless‐ness. Journal of Ethnic and Migration Studies 30:1 , 21-39.
Bruter, M. (2009). Time Bomb? – The Dynamic Effect of News and Symbols on the Political Identity of
European Citizens. Comparative Political Studies Volume 42 Number 12 , 1498-1539.
Bruter, M. (2003). Winning Hearts and Minds for Europe - The Impact of News and Symbols on Civic and
Cultural European Identity. Comparative Political Studies 36 , 1148-1179.
Caporaso, J. A., & Kim, M.-H. (2009). The dual nature of European identity: subjective awareness and
coherence. Journal of European Public Policy 16:1 , 19-42.
Cinnirella, M., & Hamilon, S. (2007). Are All Britons Reluctant Europeans? Exploring European Identity
and Attitudes to Europe among British Citizens of South Asian Ethnicity. Ethnic and Racial Studies , 481-
501.
Citrin, J., & Sides, J. (2004). More than Nationals: How Identity Choice Matters in the New Europe.
Cram, L., Patrikios, S., & Mitchell, J. (2011). What Does the European Union Mean to Its Citizens? Implicit
Triggers, Identity(ies) and Attitudes to the European Union. Seattle: APSA conference.
Duchesne, S., & Frognier, A.-P. (1995). Is there a European Identity. In O. Niedermayer, & R. Sinnott,
Public Opinion and Internationalized Governance. Oxford: Oxford University Press.
Easton, D. (1965). A System Analysis of Political Life. New York: Wiley.
ESS. (2012). European Social Survey. Retrieved June 20, 2013, from European Social Survey website:
http://www.europeansocialsurvey.org/
Eurobarometer. (2013). Eurobarometer section on European Commission website. Retrieved June 20,
2013, from European Commission website: http://ec.europa.eu/public_opinion/index_en.htm
European Commission. (1993). Recueil de Documents Diplomatiques pour les Fonctionnaires en
Délégation [English: Diplomatic documents for European Commission civil servants abroad]. Brussels,
Luxembourg.
EVS. (2013). European Values Study. Retrieved June 20, 2013, from European Values Study website:
http://www.europeanvaluesstudy.eu/
Fligstein, N. (2008). Euroclash: The Eu, European Identity and the Future of Europe. Oxford: Oxford
University Press.

Which Characteristics are associated with European Identity among European Citizens?
39
Gallagher, M., Mair, P., & Laver, M. (2006). Cleavage structures and electoral change. McGraw-Hill.
Green, D. (2007). The Europeans: Political Identity in an Emerging Polity. London: Lynne Rienner.
Kaina, V., & Karolewski, I. (2009). EU Governance and European Identity. Living Reviews in European
Governance Vol.4, No.2 , 1-41.
King, R., & Ruiz-Gelices, E. (2003). International Student Migration and the European "Year Abroad":
Effects on European Identity and Subsequent Migration Behavior. International Journal of Population
Geography 9 , 229-252.
Kohli, M. (2000). The battlegrounds of European Identity. European Societies 2 (2) , 1469-8307.
Kuhn, T. (2012). Why Educational Exchange Programmes Miss Their Mark: Cross-Border Mobility,
Education and European Identity. Journal of Common Market Studies , 994-1010.
Lutz, W., Kritzinger, S., & Skirbekk, V. (2006). The Demography of Growing European Identity. Science
Volume 314 , 6-7.
Marks, G., & Wilson, C. J. (2000). The Past in the Present: A Cleavage Theory of Party Response to
European Integration. British Journal of Political Science 30.03 , 433–459.
Petit, I. (2007). The European Commission and its education policy. World Political Science Review 3(1) ,
1-24.
Recchi, E., & Favell, A. (2009). Pioneers of European Integration: Citizenship and Mobility in the Eu.
Cheltenham: Edward Elgar.
Risse, T. (2010). A Community of Europeans? Transnational Identities and Public Spheres . Ithaca, NY:
Cornell University Press.
Risse, T. (2003). The Euro between national and European identity. Journal of European Public Policy,
10:4 , 487-505.
Sigalas, E. (2010). Cross-border mobility and European identity: The effectiveness of intergroup contact
during the ERASMUS year abroad. European Union Politics 11(2) , 241-265.
Stubager, R. (2010). The Development of the Education Cleavage: Denmark as a Critical Case. West
European Politics, 33:3 , pp. 505-533.
van der Veen, A. (2002). Determinants of European Identity: A preliminary Investigation using
Eurobarometer data. University of Pennsylvania.
van Mol, C. (2012). Intra-European Student Mobility and European Identity: A Successful Marriage?
Population, Space and Place 19 , 209-222.
Wodak, R. (1999). Nationale und Kulturelle Identiäten Österreichs: Theorie, Methoden [English: Austria´s
national and cultural identities: Theories and methods]. Vienna: IFK.


