Which 10 bilateral product flows have most salience to future international effort against...
12
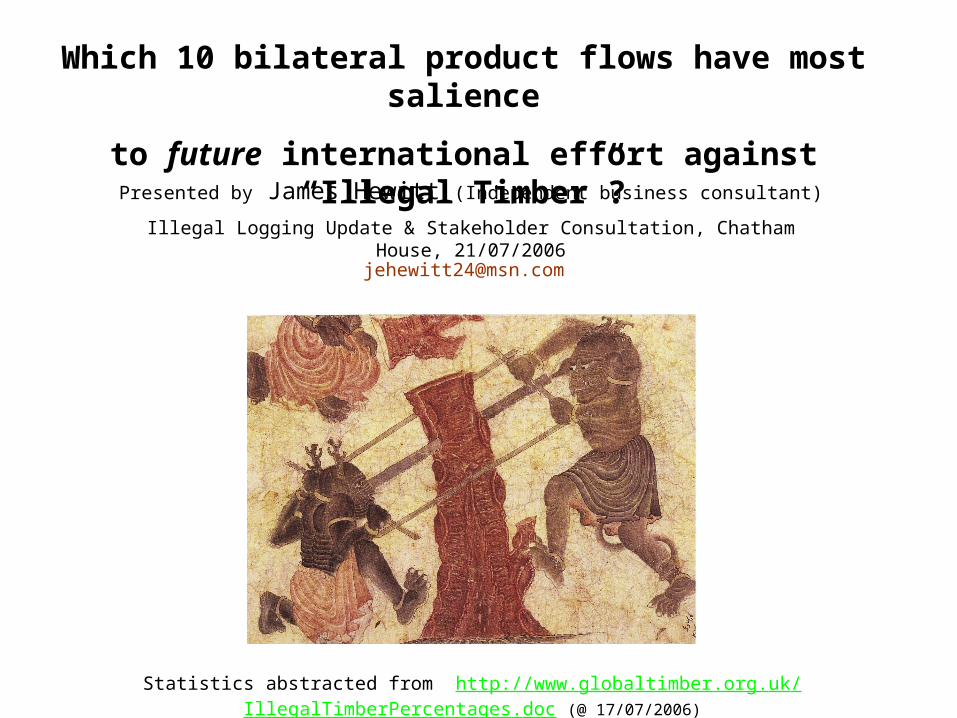
Which 10 bilateral product flows have most salience to future international effort against “Illegal Timber”? Statistics abstracted from http:// www. globaltimber .org. uk / IllegalTimberPercentages . doc (@ 17/07/2006) Presented by James Hewitt (Independent business consultant) Illegal Logging Update & Stakeholder Consultation, Chatham House, 21/07/2006 [email protected]
-
Upload
gyles-byrd -
Category
Documents
-
view
212 -
download
0
Transcript of Which 10 bilateral product flows have most salience to future international effort against...
Which 10 bilateral product flows have most salience
to future international effort against “Illegal Timber”?
Statistics abstracted from http://www.globaltimber.org.uk/IllegalTimberPercentages.doc (@ 17/07/2006)
Presented by James Hewitt (Independent business consultant)
Illegal Logging Update & Stakeholder Consultation, Chatham House, 21/07/2006

Who knows how much Illegal Timber is traded?
Failure of G8 under its 2005 President Blair to act on Civil Society request to measure and monitor trade in Illegal Timber
World Bank’s US$10-15bi pa - now out of date; not subdivided by country
FAO and UNECE - considering how to report on Illegal Timber
Baltic 21 - focusing on transparent timber trade flows
Estimated RWE volume and import value of trade in Illegal Timber during 2005: 70 million m3 (c5-10% greater than 2004) and US$13 billion
Producer countries - are those who have power a major part of the problem?

Why estimate how much Illegal Timber is traded?
1) to identify which bilateral~product flows warrant international scrutiny
2) to optimise effort, devote 20% of scrutiny to the leading 80% of trade flows
4) to lobby for support
3) to design targets and appraise progress
Fundamental to multi-national strategy against trade in Illegal Timber
5) to assess impact on legitimate trade (e.g. AF&PA)
But risk of:denigrating timber vis à vis alternative materials for boats, building, furnishing, etc.However, those materials might be associated with illegality (and conflict)

Major concessions: visibility, management resources, export earning
Failure to publish - implies illegality (corruption)
State secrets? X Stewardship? √
Maintain a public register devoted to major concessions, giving details of: 1) location (GIS), ownership, duration, management plans, etc 2) annual log production Vs volume authorised 3) major court cases, judgements and any penalties actually paid
Compile separately for conversion forest, permanent forest or plantation
Transparency - a tool to inhibit illegality
Maintain a public register devoted to persistent large mismatches between export and import declarations. Include notes on action taken, the shipping company, consignee/consignor, product, port etc - Indonesia/Malaysia/China
Repackage the data, with annotations, to maximise its usefulness
Major Concessions
Allocation/ Re-
Allocation
ForestManage-
mentPlans
IllegalLogging
Economiccrime
OtherPermits
andElsewhere
Others
Brazil (Amazonia) 40% 40% 20% 30% 30% -Burma ? ? ? ? 90% -Cameroon 20% 30% 10% 10% 30% -
China 10% ? 20% ? 10% 20%Congo (Brazzaville) 30% 60% 40% 30% 0 -Equatorial Guinea 80% 80% 80% 90% 0 -
Gabon 10% 60% 10% 50% 10% -Ghana 30% ? 20% 30% 30% -Indonesia – Timber 30% 20% 20% 30% 50% -
Indonesia – Pulp ? 0% 30% 30% 50% 70%Ivory Coast ? ? ? ? ? 70%Malaysia 10% 5% 0 10% ? 5%
Papua New Guinea 90% 90% 20% 20% 0 -Russia (East) ? ? 10% 20% 40% -Russia (West) 5% ? 10% 15% 5% -
Solomon Islands 50% ? 50% 70% 10%
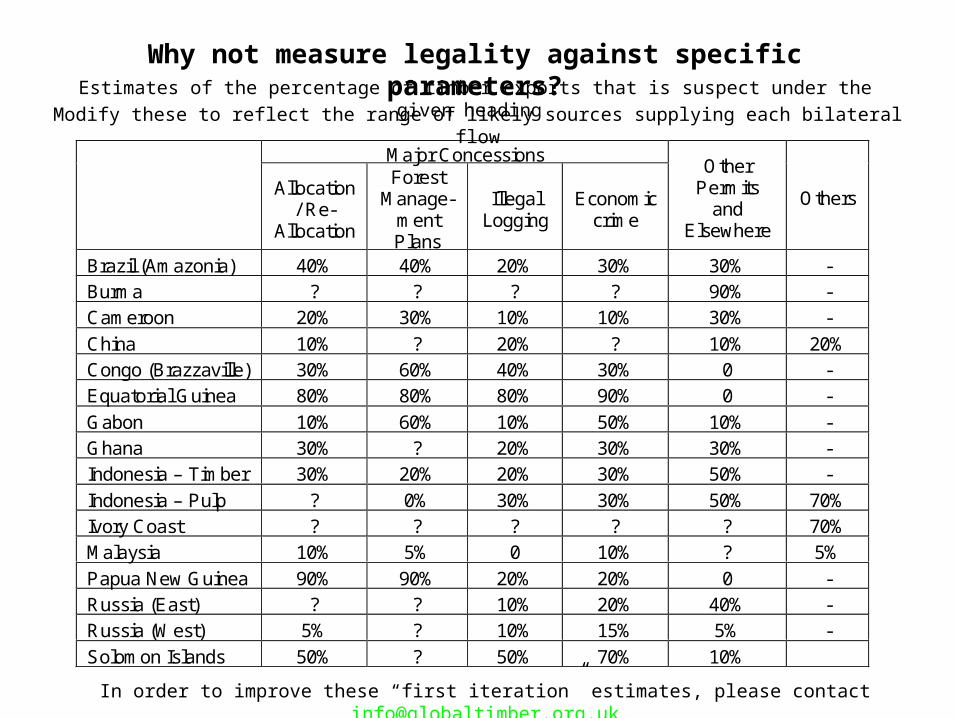
Why not measure legality against specific parameters?Estimates of the percentage of timber exports that is suspect under the given heading
In order to improve these “first iteration” estimates, please contact [email protected]
Modify these to reflect the range of likely sources supplying each bilateral flow

Top Ten bilateral flows of Illegal Timber products
Top Ten = 35% (RWE volume basis) of trade in Illegal Timber (25mi m3 RWE & US$4.5bi cif)
2005 Estimated trade (2005)Illegal Timber
Illegal + Legal trade (2005)(RWE volume basis)
Supplyingcountry
Importingcountry
ProductRWE
volume(million m3)
Import value(US$ billion
cif)
For the givenproduct:
Importingcountry’s importsas a proportion
of supplyingcountry’s exports
Given productas a proportion
of importingcountry’s
timber importsfrom supplying
country
China USA Furniture 1.8 1.6 56% 48%
China USA Plywood 2.0 0.3 34% 32%
Indonesia Japan Plywood 3.4 0.7 40% 88%
Malaysia Japan Plywood 1.3 0.2 43% 76%
Russia EU Sawnwood
1.9 0.2 43% 33%
Cameroon EU Sawnwood
0.5 0.2 96% 81%
Russia China Logs 12 0.9 43% 94%
PNG China Logs 1.7 0.2 75% 99%
Congo(Brazza.)
China Logs 0.4 0.1 69% 98%
Gabon China Logs 0.5 0.1 53% 83%

Notes
The estimates relate only to those imports which do not have credible chain of custody certification to forest stump (low cost Vs high benefit)
The percentages should not be applied to trade from concessions which are - credibly - progressing towards FSC or equivalent certification
One enterprise logs the great majority of China’s Illegal Timber from Congo (Bz), Equatorial Guinea, Gabon, PNG, & the Solomon Islands - whose Illegal Timber exports derive primarily from links to those in power
The two flows shown for each of the USA and Japan probably account forhalf of those two countries’ Illegal Timber imports
Economic crime (which is neither confined to the wood-based products sector nor to producer countries) accounts for much of the illegality
FLEGT VPA’s would be appropriate for the EU trade flows shown - if established (or scrapped) by, say, 2008

Which single action would achieve most impact on these flows?
Imports from China (especially by the USA):
cease importing wood products made in China unless these are accompanied by a credible chain of custody back to forest stump for both:a) the species which accounts for most of the product’s volume and b) the species which dictates how the product is marketed (e.g. its surface veneer)
Imports from South Western region of Congo (Brazzaville):
urge prospective importers (in the EU and the USA) to not procure veneer and plywood from the mills being established by that region’s leading logging group – until independent public audits credibly confirm that that group’s concessions have been properly awarded, that it has (and adheres) to plans for the sustainable management of its concessions, and that it has paid all its arrears of applicable taxes and fines (e.g. relating to log exports) to the correct part of government
Examples:

China
EU
Japan
USA
Logs
Plywood
Lumber
Lumber
PlywoodOthers
Lumber
Plywood
Others
Lumber
Plywood
Others
Logs
Others
Logs
Logs
Plywood
Lumber
Others
Illegal Timber imports during 2005 - importing country by product
Total roundwood equivalent volume: c70 million m3
30%
20%
15%
10%
25%
Japan and USA would each import only 5% of world trade in Illegal Timber if their imports of plywood from Indonesia and Malaysia (Japan) and from China (USA) and wooden furniture from China (USA) were credibly certified back to forest stump

>?50% of China’s imports are used by its export-oriented industries
Should consumer countries offer to help China minimise its illegal imports?
If China can, so can India? Nip India’s Illegal Timber (& Paper) trade in the bud
Bilateral Trade in "Illegal Logs" - 2005
0
1
2
3
4
5
6
China Japan EU India Other EastAsia
Other
Importing Country
Ro
un
dw
oo
d E
qu
iva
len
t V
olu
me
(m
illio
n c
ub
ic m
etr
es)
Other
Solomon Islands
Papua New Guinea
Burma
Malaysia
Indonesia
Gabon
Equatorial Guinea
Congo (Brazzaville)
Cameroon
Note: excludes imports from Russia

Arrow width directly proportionalto roundwood equivalent volume:
2 million cubic metres RWE
0.5 million cubic metres RWE
Bilateral trade flows - “Illegal Sawn Wood” (2005)
Showing flows greater than c100,000m3 RWE
To be read in conjunction withhttp://www.globaltimber:org.uk/IllegalTimberPercentages.doc
Indonesia: export ban (but, gross import~export mismatch in prior years)
Russia: address EU trade and apply the new norm to West Asia~North Africa
Demons in Central Asia cutting a tree - Muhammad Siyah Qalam c.1300-1500 AD - Topkapi Saray Museum, Istanbul