Best Practices in Integration: Where the Rubber Meets the Road
Upload
howard-brownCategory
view
213download
1
Case Study
WHERE THE RUBBER MEETS THE ROAD: MEASURING THE SUCCESS OF ENVIRONMENTAL PROGRAMS
Howard Brown and Jim D r a y
In order to integrate environmental, health, and safey (EHS) programs into mainstream business management, EHS managers must measure the success of their strategies. This article presents techniques and samples for both quantitative measurement (EHS resultr;) and qualitative measurement (progress toward implementation). It also provides a case study of measure- ment at the Perkin-Elmer Corporation, which has achieved notable successes with straightforward measurement approaches. Performance measurement systems can make the difference between an EHS program that rewards stakeholders for hard work, and one that fades and fiustrates.
Howard Brown, President and founder of RPM Systems, Inc., is an authority in the field of environmental management, with extensive experience at the local, state, national and international level. He has served as a consultant to dozens of large and small corporations, public agencies, and nonprofit institutions and has helped enhance quality and revenue for numerous Fortune 500 companies. Jim Dray, Vice President at RPM Systems, is a specialist in business management and development, and in creating change with information systems. He has consulted to many Fortune 500 companies on designing environmental strategies, environmental management information systems, and environmental performance measurement systems. The authors wish to grateplly acknowledge the assistance of Stephen Rudofi Perkin-Elmer’s Director of Support Services and senior manager in charge of the environmental measurement efforts discussed in this case.
M any environmental programs have difficulty justifymg them- selves, in part because of an inability to measure the success of programs which do not have direct dollar benefits. The
result is that it is hard to build and maintain support for environmental initiatives. Measurement is important in helping stakeholders or advo- cates know where to invest their efforts.
The purpose of an environmental measurement system is to provide insight into the status of and change in the company’s environmental performance-or the performance of individual operating units or functions within the company. The goal should be to:
Keep it simple-be easy to use and understand, and at the same time to be specific enough to ensure that measures have meaning. Identify key indicators that construct a picture of overall corporate environmental performance. . Be consistent with the format and approach of other key company efforts, including overall business strategy and mea- surement, and environmental goals and priorities.
In any effort that requires investment, the ability to compare competing opportunities for investment is critical. Programs that have greater impact and payoff must be identified so that they will be selected for implementation over lower-impact opportunities.
CCC lOS5-7571/96/OS03071-10 0 1996 John Wiley & Sons, Inc.
SPRING 1996 TOTAL QUALITY E ~ O N M E N T A L MANAGEMENT 71

HOWARD BROWN AND Jm DRAY
The first step in assessing environmental program effectiveness is to design strategies which can be measured. There are two different ways to measure progress, and both are necessary to construct a complete picture of corporate performance:
he first step in T assessing environmental program effectiveness is to design strategies which can be measured.
1. Quantitative-analytical measurement of actual change in environmental performance.
2. Qualitative-measurement of proactivity, the degree to which the company as a whole as well as various departments and operating units are actively pursuing implementation of the worldwide strategy.
Quantitative Analysis Quantitative measures document consumption of materials and
energy or waste. The data to be collected may be obvious. Two problems arise, however: (1) Is the desired data available from an existing or practical accounting system? and (2) How should the information from different facilities making different products be normalized?
It is not possible to measure every aspect of corporate environmental performance without creating a huge data collection and reporting burden. But it is possible to create a system of metrics which documents the critical indicators of overall performance.
Exhibit 1 shows a summary graphic analysis of quantitative metrics developed for a Fortune 500 company. The data for these charts are collected quarterly via an automated Microsoft Excel spreadsheet at each site. The results are published quarterly both for the sites them- selves and for management reporting. This particular implementation of quantitative metrics focuses on comparing sites to their own histori- cal performance, rather than on comparing sites to each other. The managers and consultants who devised the metrics system chose to design the system this way in part because each plant produces different products. Some additional company-wide and cross-plant comparisons are made in an annual report to management.
Overall performance can be understood in terms of traditional system efficiency perspective, where efficiency is measured either as a ratio of work done by a system to the energy used to produce that work or the ratio of work done to the energy lost from the system as heat. This means doing more with less-more desired output with less input per unit of output, or more desired output with less undesiredloss (or waste) per unit of output (Exhibit 2).
Qualitative Analysis Qualitative measures document, for example, efforts to integrate
environmental thinking into product design or marketing. Measure- ment systems modeled after total quality and I S 0 9000 metrics systems can be developed to measure these “process” issues as opposed to quantitative “output” issues.
’
72 TOTAL QUALITY ENYIRONMENTAL MANAGEMENT SPRING 1996

MEASURING TEE SUCCESS OF ENVIRONMENTAL PROGRAMS
Exhibit 1. Graphic Analysis of Quantitative Metrics
10% 0 %
-10% -20%
-40% -50% -60% -70% -80% -90%
-100%
-3096
Four Quarters Usage Compared to Baseline Year * 4 Qtrs 4 Qtrs 4 Qtrs 4 Qtrs
end end end end 4 2 9 3 4 3 9 3 4 4 9 3 Q194
..............................................
...................
..................................................................................................................................
...................................................................................................................................
.... .........)----.----- Q- ---- ---
..................................................................................................................................
.................................................................................................................................. .*. ............. ............. 9 -I---- +------ +--
.................................................................
Landfill Tons - -- +---
--.Bb---Energy total use
-- 4- -- Energy tatal cast
--O--- Water use
There are many aspects of environmental management that simply cannot be adequately reflected in a quantitative performance monitor- ing system. Even if one were to try, the number of variables that would have to be monitored in such a system would be so large that it would become a workload nightmare for staff, In addition, many strategic goals may have long lag times before implementation shows perfor- mance results. Further, actions to ensure that suppliers implement environmental management programs of their own will not be re- flected in a company’s own analytical metrics. Similarly, a committed and exhaustive effort to identify a less toxic material substitute in the product design process may not be reflected in the performance data for years.
SPRING 1996 TOTAL QUALITY ENVIRONMENTAL MANAGEMENT 73

HOWARD BROWN AND JIM DRAY
Exhibit 2. Traditional System Efficiency Perspective
Yet, it is important that there be some way of verifying that actions are being taken to make progress toward the company's environmental goals, whether or not the impacts will immediately show up in the monitored data. It is important, therefore, to dedicate some aspect of the metrics system to evaluate the process-the degree to which management systems are being put in place to achieve environmental goals.
A qualitative audit or evaluation could be a self-assessment con- ducted by each facility for itself on a quarterly basis. A version of it could be done annually by an outside party.
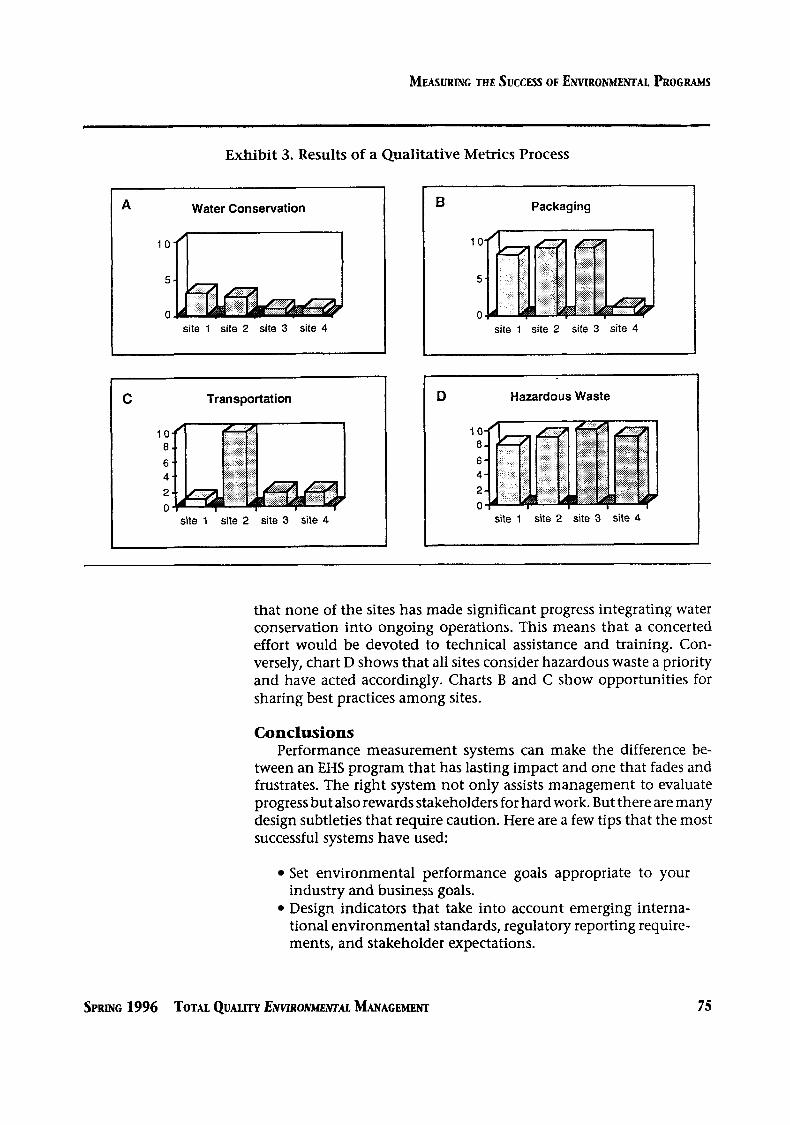
Exhibit 3 shows a sample of the results of a qualitative metrics process. For each goal in the company's environmental strategy, four sites have evaluated their own progress on a 0-10 scale. The company defined each point on the scale, ranging from O="no activity" to 10="audited results documented and reviewed; the process is ongoing and in a continuous improvement mode." With a quick glance, man- agers can tell which of the environmental initiatives are on track and which are off track or mixed. Sites can also use the system to brag about their achievements or to identify leading practices that should be spread more widely. The results can be used to determine how corporate attention and resources should be invested. For example, chart A shows
74 TOTAL Q u m ENVIRONMENTAL MANAGEMENT SPRING 1996
MEASURING TEE SUCCESS OF ENVIRONMENTAL PROGRAMS
10 8 6 4 2
I 0
Exhibit 3. Results of a Qualitative Metrics Process
~
site 1 site 2 site 3 site 4
A
1 0
5
0
Water Conservation
1 site 1 site 2 site 3 site 4
C Transportation
10 8 6 4 2 0
site 1 site 2 site 3 site 4
B Packaging
1 0
5
0 site 1 site 2 site 3 site 4
Hazardous Waste I D
that none of the sites has made significant progress integrating water conservation into ongoing operations. This means that a concerted effort would be devoted to technical assistance and training. Con- versely, chart D shows that all sites consider hazardous waste a priority and have acted accordingly. Charts B and C show opportunities for sharing best practices among sites.
Conclusions Performance measurement systems can make the difference be-
tween an EHS program that has lasting impact and one that fades and frustrates. The right system not only assists management to evaluate progress but also rewards stakeholders for hard work. But there are many design subtleties that require caution. Here are a few tips that the most successful systems have used:
Set environmental performance goals appropriate to your industry and business goals. Design indicators that take into account emerging interna- tional environmental standards, regulatory reporting require- ments, and stakeholder expectations.
SPRING 1996 TOTAL Q u m ENYIRONMENTAL MANAGEMENT 75

HOWARD BROWN AND JIM DRAY
Develop workable measurement systems that are easy to un- derstand and implement and are appropriately integrated with corporate environmental information systems. Decide on the best use of environmental performance infor- mation, taking into account potential risks, liabilities, man- agement requirements, and stakeholder expectations.
Perkin-Elmer Applies Environmental Metrics The case of Perkin-Elmer, a one billion dollar analytical instruments
manufacturer based in Norwalk, Connecticut, offers some instructive lessons in adoption of performance measurement techniques. Below is a summary of the steps that the company pursued in order to establish what has become a very successful and effective metrics approach to support their environmental strategy implementation.
Step 1: Develop an Environmental Team and Begin Codifjdng an Environmental Strategv
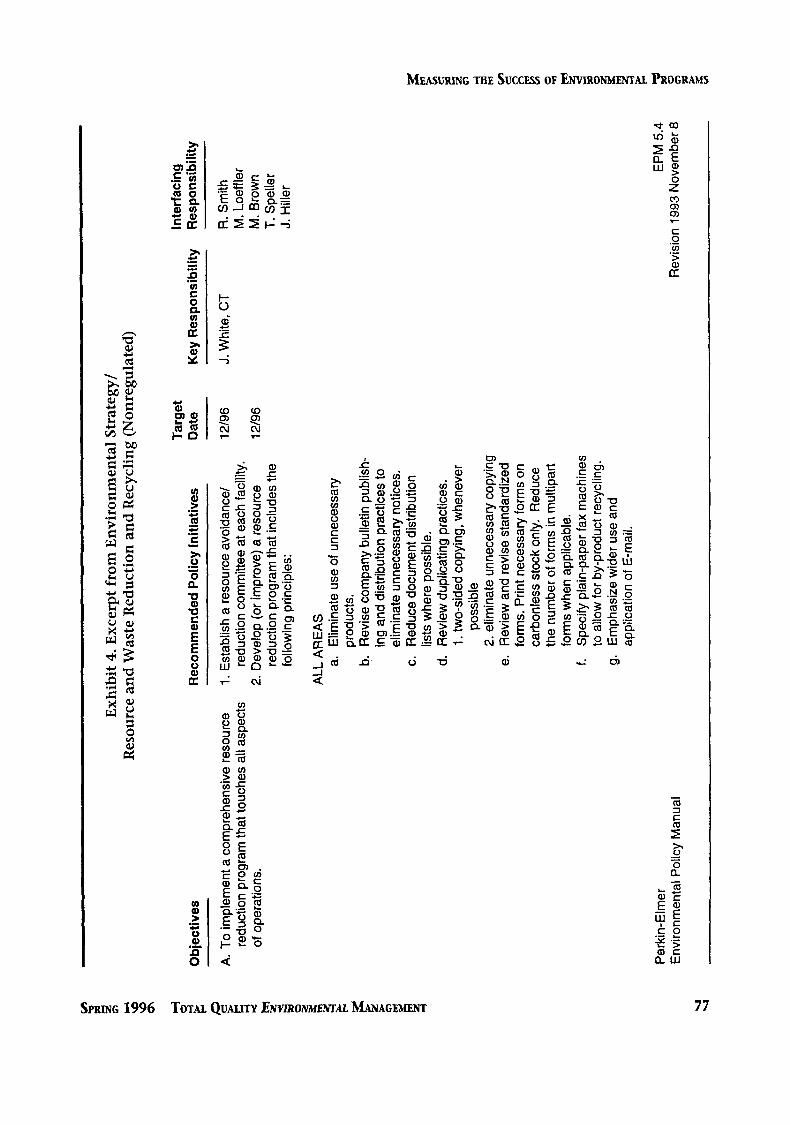
Before it could determine what to measure, Perkin-Elmer first needed to assess what it aspired to do in the environmental arena. The old adage, “You get what you measure,” means that the company needed to be conscious of the power of measurements for capturing the attention of environmental and other staff. Thus, the goals set by the strategy needed to correlate with the measurements chosen, and both needed buy-in from the plants and individuals that were affected. The company assembled a team with representatives from each major operating unit, which worked to evolve an environmental strategy and environmental performance measures simultaneously, so that each helped to inform and refine the other. The details of environmental team and strategy development are not covered here, but Exhibit 4 shows an excerpt from the environmental strategy that was ultimately developed.
Step 2: Establish a Baseline Because the company had not been systematically collecting envi-
ronmental information at headquarters, it chose to begin its perfor- mance measurement by asking each plant to complete a five-page questionnaire covering a wide range of issues and indicators to assess what data were available and what more was needed. WhiIe this required significant effort from the plant staff, Perkin-Elmer found the results useful both in terms of selecting a smaller set of indicators for ongoing measurement, and also in identifying priority areas for its environmental strategy. Once indicators were selected, Perkin-Elmer asked each facility to pick a baseline year for comparison to present performance. Perkin-Elmer chose to allow sites to use different baseline years, so long as they had a good case for their decision and stuck with it. The option to choose an earlier baseline allows documentation of the impact of recent progress along with future environmental initiatives. Exhibit 5 shows an outline of data gathered in this step.
76 TOTAL Q u m ENYLRONMEN~~LL MANAGEMENT SPRING 1996
E! n E
xhib
it 4.
Exc
erpt
from
Env
iron
men
tal S
trat
egy/
R
esou
rce
and
Was
te R
educ
tion
and
Rec
yclin
g (N
onre
gula
ted)
5;' O
bjec
tives
A. T
o im
plem
ent a
com
preh
ensi
ve re
sour
ce
Q 5
of o
pera
tions
. re
duct
ion
prog
ram
that
touc
hes
all a
spec
ts
F * 1 n
Rec
omm
ende
d P
olic
y In
itiat
ives
1. E
stab
lish
a re
sour
ce a
void
ance
/
2. D
evel
op (o
r im
prov
e) a
reso
urce
re
duct
ion
com
mitt
ee at
eac
h fa
cilit
y.
redu
ctio
n pr
ogra
m th
at in
clud
es th
e fo
llow
ing
prin
cipl
es:
ALL
AR
EA
S
a.
Elim
inat
e us
e of
unne
cess
ary
prod
ucts
. b.
Rev
ise
com
pany
bul
letin
pub
lish-
in
g an
d di
strib
utio
n pr
actic
es to
el
imin
ate
Unn
eces
sary
not
ices
. c.
R
educ
e do
cum
ent d
istri
butio
n lis
ts w
here
pos
sibl
e.
d. R
evie
w d
uplic
atin
g pr
actic
es.
1. tw
o-si
ded
copy
ing,
whe
neve
r
2. e
limin
ate
unne
cess
ary c
opyi
ng
e.
Rev
iew
and
revi
se s
tand
ardi
zed
form
s. P
rint n
eces
sary
form
s on
ca
rbon
less
stoc
k on
ly.
Red
uce
the
num
ber o
f for
ms
in m
ultip
art
form
s w
hen
appl
icab
le.
f. S
peci
fy p
lain
-pap
er fa
x m
achi
nes
to a
llow
for b
y-pr
oduc
t rec
yclin
g.
g.
Em
phas
ize
wid
er u
se a
nd
appl
icat
ion
of E
-mai
l.
poss
ible
Targ
et
Inte
rfac
ing
Dat
e K
ey R
espo
nsib
ility
R
espo
nsib
ility
R. S
mith
M
. Loe
ffler
M
. Bro
wn
T. S
pelle
r J.
Hille
r
12/9
6 J.
Whi
te, C
T
12/9
6
n
W a F
8 B !l 1 i! P
erki
n-E
lmer
E
PM
5.4
E
nviro
nmen
tal P
olic
y Man
ual
Rev
isio
n 19
93 N
ovem
ber 8
0
U
U
cn
HOWARD BROWN AND JIM DRAY
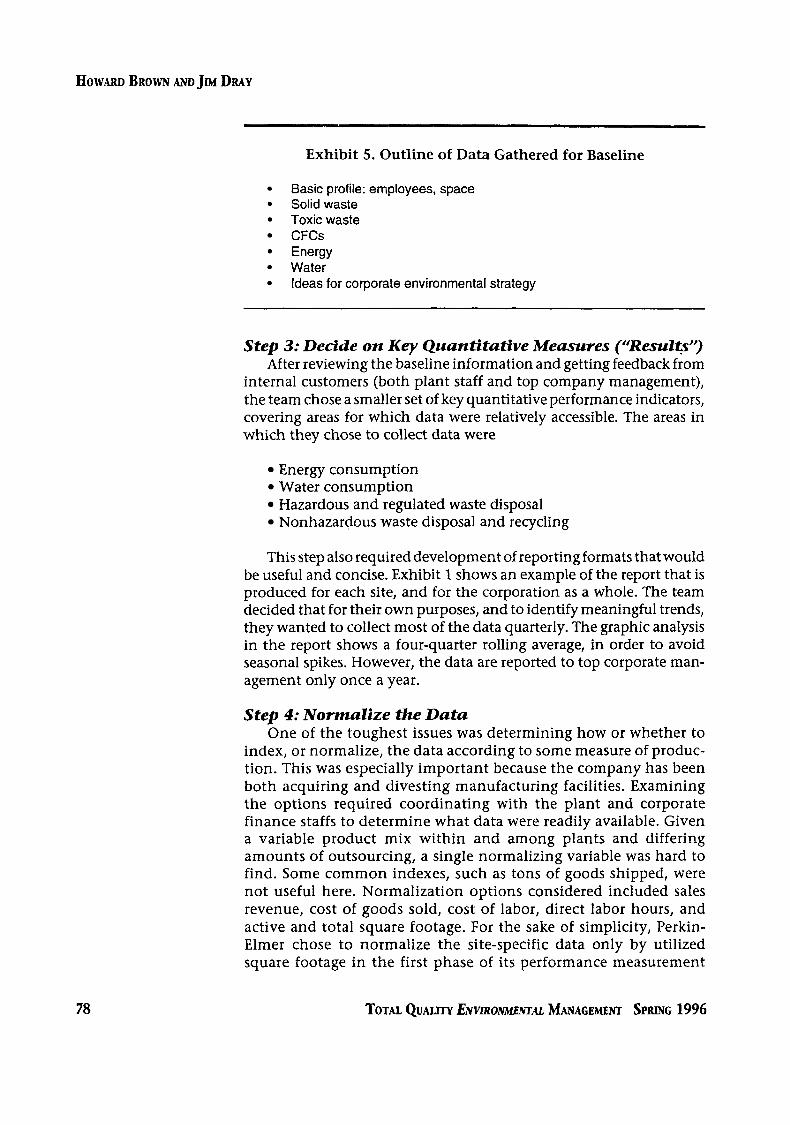
Exhibit 5. Outline of Data Gathered for Baseline
Basic profile: employees, space Solid waste Toxic waste CFCs Energy Water Ideas for corporate environmental strategy
Step 3: Decide on Key Quantitative Measures (?Resul+'-') After reviewing the baseline information and getting feedback from
internal customers (both plant staff and top company management), the team chose a smaller set of key quantitative performance indicators, covering areas for which data were relatively accessible. The areas in which they chose to collect data were
Energy consumption Water consumption Hazardous and regulated waste disposal Nonhazardous waste disposal and recycling
This step also required development of reporting formats that would be useful and concise. Exhibit 1 shows an example of the report that is produced for each site, and for the corporation as a whole. The team decided that for their own purposes, and to identify meaningful trends, they wanted to collect most of the data quarterly. The graphic analysis in the report shows a four-quarter rolling average, in order to avoid seasonal spikes. However, the data are reported to top corporate man- agement only once a year.
Step 4: Normalize the Data One of the toughest issues was determining how or whether to
index, or normalize, the data according to some measure of produc- tion. This was especially important because the company has been both acquiring and divesting manufacturing facilities. Examining the options required coordinating with the plant and corporate finance staffs to determine what data were readily available. Given a variable product mix within and among plants and differing amounts of outsourcing, a single normalizing variable was hard to find. Some common indexes, such as tons of goods shipped, were not useful here. Normalization options considered included sales revenue, cost of goods sold, cost of labor, direct labor hours, and active and total square footage. For the sake of simplicity, Perkin- Elmer chose to normalize the site-specific data only by utilized square footage in the first phase of its performance measurement
78 TOTAL Q u m ENVIRONMEWM MANAGEMENT SPRING 1996
MEASURING THE SUCCESS OF ENVIRONMENTAL PROGRAMS
program, with the intention of using cost of labor as the system became more sophisticated. The combined data, reported to top corporate management annually, are normalized by cost of sales.
Step 5: Fine-Tune, and Accommodate Unexpected Issues No matter how well the metrics are chosen and designed, a given site
will always have unusual circumstances that require explanation when presented in a report to management. For example, one site managed to eliminate a small quantity of very toxic solvent by substituting a larger quantity of very dilute solvent. The total amount of hazardous waste went up on the charts, but environmental impact went down. To accommodate situations like this, Perkin-Elmer agreed that each chart for each site would have room for a few lines of comment from the site to explain the trends.
Step 6: Automate the Data Collection and Processing Perkin-Elmer’s environmental team quickly determined that they
needed a simple system for automating the data collection and manage- ment. Working with RPM Systems, Inc., they developed a set of straightforward spreadsheets that each site could use to report its data, then send (or E-mail) to headquarters for an automated roll-up and production of the one-page reports shown in Exhibit 1. The resulting Excel-based system allows each site to report in its own units of measure and local currencies. The system incorporates the necessary conversion factors to automatically translate the information, thus helping to resolve a typically stubborn issue.
Step 7: DeveZop Qualitative (‘Frocess’’) Pe@ormance Measures
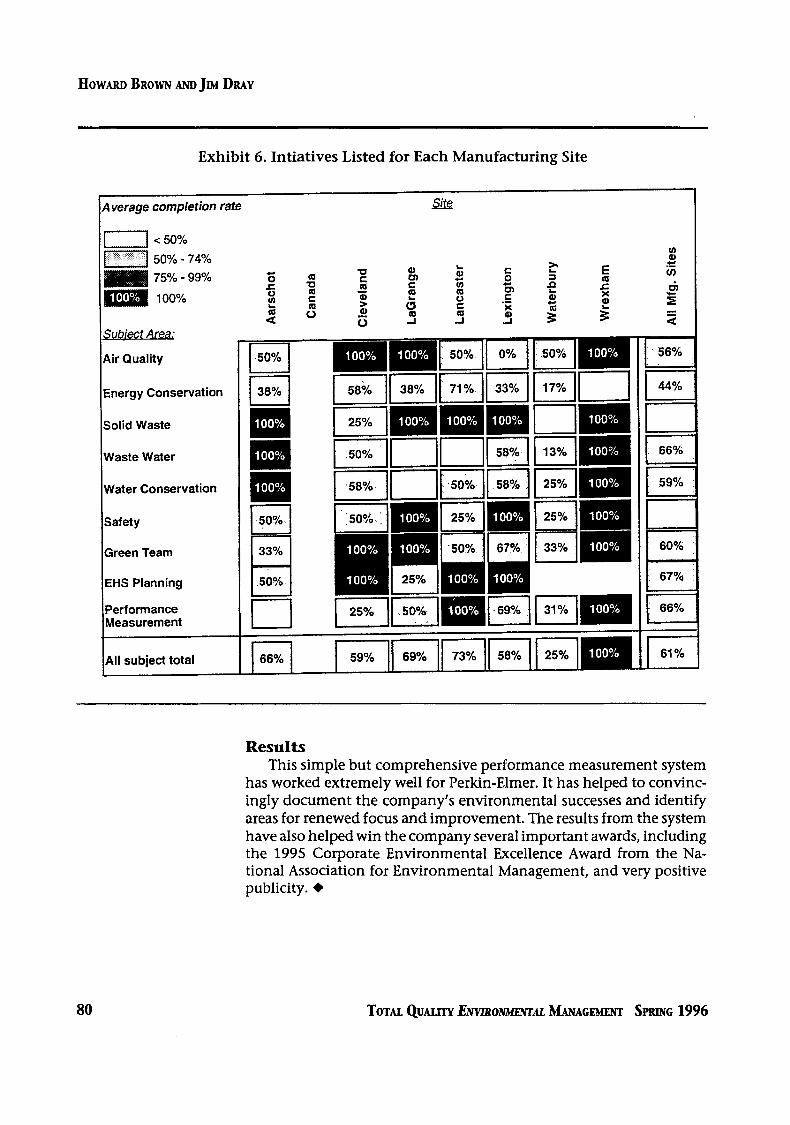
The environmental team was aware that by selecting the concise set of indicators in Step 3, it was also leaving significant gaps in its measurement of environmental performance. These gaps were not easy to fill with quantitative information. Obtaining a thoroughly compre- hensive assessment would require hundreds of indicators, and data collection would become a full-time job. However, the team could identify critical aspects of the environmental strategy whose progress was a good proxy for management’s attention to implementation of the environmental strategy. For example, many parts of the environmental strategy (including most compliance issues) require a process to be put into place, such as a cross-functional team to identify pollution preven- tion opportunities. Each critical element of the environmental strategy was scored according to the degree of implementation. While this article is focused on quantitative performance measurement and hence will not go through Step 7 in detail, it is worth noting that qualitative measures are often essential. Many companies do this-sometimes in a less systematic way-with their periodic audits. Exhibit 6 shows a sample of the way results from the qualitative measurement process can be displayed (although it is not the actual format used by Perkin-Elmer).
Of the environmental straten was scored according to the degree of implementation.
Each
SPRING 1996 TOTAL QUALITY ENVIRONMENTAL MANAGEMENT 79
HOWARD BROWN AND JIM DRAY
Subiect Area:
Air Quality
Energy Conservation
Solid Waste
Waste Water
Water Conservation
Safety
Green Team
EHS Planning
Performance Measurement
Exhibit 6. Intiatives Listed for Each Manufacturing Site
Average completion rate sic2
< 50% 50% - 74% 75% - 99% 100%
1 All subject total EL 66%
Results This simple but comprehensive performance measurement system
has worked extremely well for Perkin-Elmer. It has helped to convinc- ingly document the company’s environmental successes and identify areas for renewed focus and improvement. The results from the system have also helped win the company several important awards, including the 1995 Corporate Environmental Excellence Award from the Na- tional Association for Environmental Management, and very positive publicity. +
TOTAL Q u m ENVIRONMEK~~LL. MANACEMENT SPRING 1996