Where Business Intelligence Gets Its Intelligence€¦ · Where Business Intelligence Gets Its...
11
Where Business Intelligence Gets Its Intelligence: Leveraging OSIsoft’s PI System & PI System Integration Technologies for Microsoft SQL Server, Azure IoT and Cortana Intelligence WHITEPAPER
Transcript of Where Business Intelligence Gets Its Intelligence€¦ · Where Business Intelligence Gets Its...
Where Business Intelligence Gets Its Intelligence:Leveraging OSIsoft’s PI System & PI System Integration Technologies for Microsoft SQL Server, Azure IoT and Cortana Intelligence
WHITEPAPER
1
Executive Summary
Business analytics, machine learning and Internet of Things (IoT) technologies will transform virtually every aspect of the economy in the coming decades. One of the biggest stumbling blocks, however, remains capturing, organizing and delivering the vast amounts of data from sensors, industrial equipment, power supplies and other operational technologies (OT) in a timely fashion to achieve genuine, actionable insights through information technology (IT). Too often, this data—the raw material of business analytics—remains landlocked in disparate systems and getting it out requires inordinate amounts of time and money.
OSIsoft brings OT and IT together through its PI System and PI System integration technologies. The PI System can capture, cleanse, augment, and shape OT data from thousands of disparate systems. PI integrator technology then transmits analytics-ready data in a coherent fashion to IT systems such as Microsoft SQL Server, R Services, Azure IoT and Cortana Intelligence (Azure ML). By using PI System integration technologies, companies can accelerate their digital transformation and IoT strategies.
CASE STUDIES
Cemex, one of the largest cement companies in the world, has reduced the time required to prepare data for company-wide production from 744 hours to 5 minutes through an integration architecture that linked the PI System to Microsoft technologies.
Archer Daniels Midland has integrated architecture for bringing operational data into analytics to determine the root cause of equipment breakdowns.
Carnegie Mellon University integrates operational data from building systems like HVAC to analytics in an effort expected to cut its $20 million of energy consumption by up to 20% and enable employees to manage maintenance predictively.
2
Opportunity: A World That Runs on Data
Analysts regularly measure the potential economic impact of business analytics, machine learning and Internet of Things technologies in terms of trillions of dollars. Some of the biggest gains will be made in industrial and commercial markets by analyzing operational data from transportation systems, assembly lines, power supplies and other pieces of operational equipment for gains that were not possible or even known before.
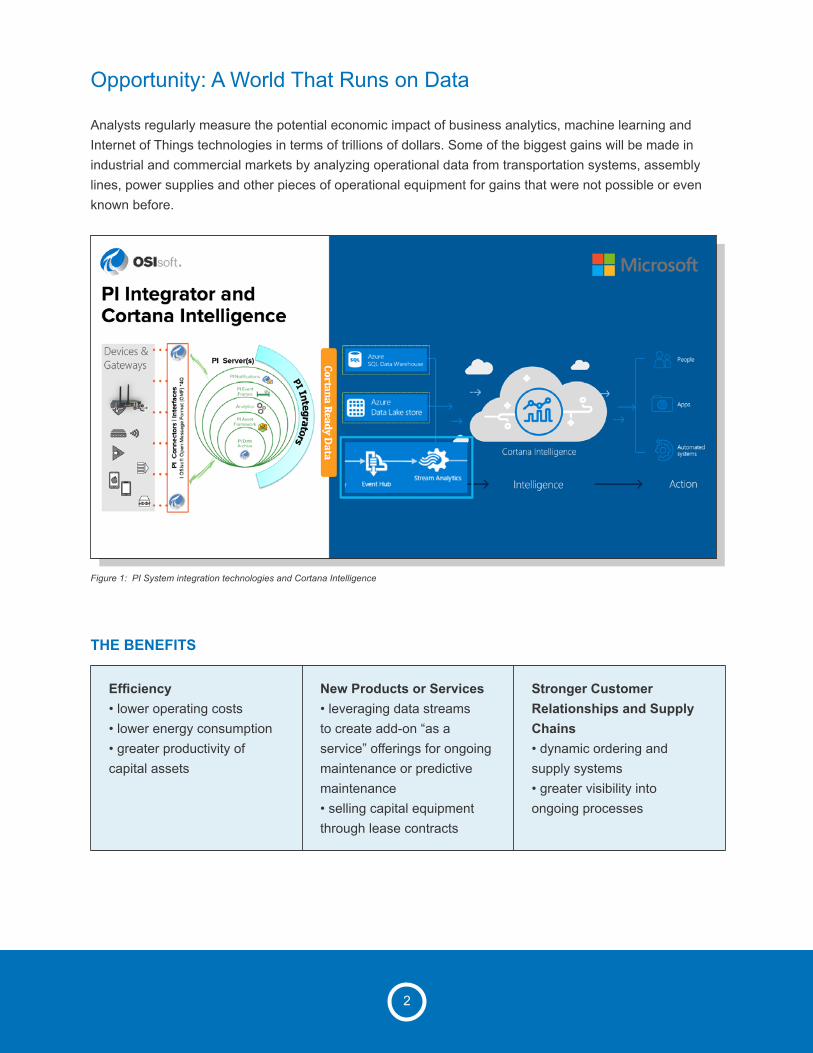
Figure 1: PI System integration technologies and Cortana Intelligence
Efficiency • lower operating costs • lower energy consumption • greater productivity of capital assets
New Products or Services • leveraging data streams to create add-on “as a service” offerings for ongoing maintenance or predictive maintenance • selling capital equipment through lease contracts
Stronger Customer Relationships and Supply Chains • dynamic ordering and supply systems • greater visibility into ongoing processes
THE BENEFITS
3
Challenge: The OT-IT Divide
Data often remains landlocked or requires an inordinate amount of preparation and effort to use. An article in the New York Times in 2014 said that companies estimated that data scientists spend 50 to 80 percent of their time on the mundane work of data preparation.
The reasons for this time-intensive preparation are multifaceted
1. Data Imperfections. IoT-collected sensor data is rarely clean. Even with similar assets with similar sensors, there are communication failures, faulty readings, and different spacing and compressions.
2. Data Context. The millions of IoT data points only make sense when positioned in relation to one another. Pressure readings from a chemical reactor need to be delivered alongside data about temperature, production, weather and similar data streams from other equipment. OT data systems deliver these data streams in a cohesive whole. The context, however, can get lost in a data warehouse and thus require data scrubbing.
3. Volume. A single “smart” factory or mining site can generate over a petabyte per day of data. Even a smart building can generate 250 GB of data daily. Transferring and storing this data in centralized data centers or even clouds can balloon IT budgets. As new sensors and new equipment are added or old ones are decommissioned the data alignment and data preparation tasks spiral exponentially.
4. Heterogeneous Formats and Standards. Different segments of the operational world rely on different formats and standards, such as Modbus and OPC, and these formats have to be “normalized” for some analysis.
5. Vendor Diversity. OT and IT systems often come from different sets of vendors who strive for different performance expectations. For instance, the average age of a server in a data center is three years, while the average age of a transformer on the electric grid in the U.S. is 40 years.
6. Corporate Organization. Operational data and OT often live in a parallel, but separate, universe from IT and other departments in a company. An offshore oil facility can feature 30,000 sensors, but only 1% of the information generated is used for decision making. Experts estimate that 80% of data is “dark data”—digital information that companies possess and store but can’t or don’t access.
7. Security and Safety. Many organizations create a demilitarized zone around OT systems that can include firewalls and one-way networking systems as well as razor wire and personnel access control. Even when a company wants IT to have access, clearance has to be obtained.
4
The Consequences of the OT-IT Gap
Without free and fluid access to operational data, however, data analytics deliver only a fraction of the insight that advocates expect. OT has access to the operations data, they understand the context, and in most cases are aware of the problems that need to be fixed to streamline operations. IT on the other hand has access to the tools for business insight, machine learning and knows how to provide an IT solution. The two need to be synchronized: otherwise, analytical “insights” become educated guesses.
Take energy consumption. A system that reads an electric meter every 15 minutes can provide coarse information about energy consumption, according to a study titled “Got Data? The Value of Energy Data Access to Consumers.” Software that reads data every second, however, can uniquely identify major appliances. At one millionth of a second, software systems can identify individual light bulbs. With fine-grain data, utilities can potentially cut emissions and costs in a continuous, invisible manner.
The volume of sub-second resolution data quickly becomes astronomical. A single smart meter report can generate 50 to 100 kilobits. The 3.4 million housing units in New York City, if read every second, would generate 1.3 exabytes a year, or 394GB per meter, a volume that would substantially add to communications and storage budgets.
Alternatively, consider predictive maintenance applications, where greater access to data can reduce unplanned downtime. Flowserve, one of the world’s largest manufacturers of pumps and valves, remotely monitors equipment as a value-added service for its customers. In one case, they detected a major change in the vibration signals from a piece of equipment in the field that turned out to be caused by a welder’s insulating blanket that was accidentally caught in a screen. A one-day shutdown to fix the situation cost $50,000. If it had gone undetected, repair, reassembly and downtime would have come to $630,000.
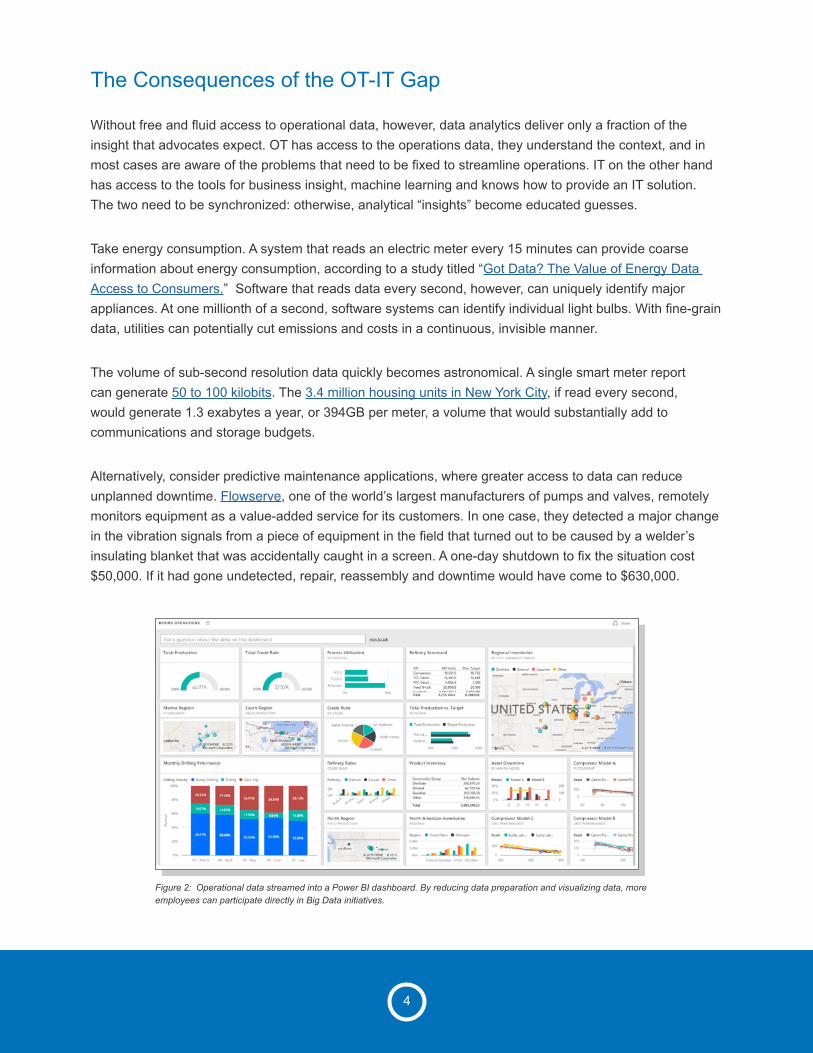
Figure 2: Operational data streamed into a Power BI dashboard. By reducing data preparation and visualizing data, more employees can participate directly in Big Data initiatives.
5
Solution: Analytics-Ready Data from the PI System and PI System Integration Technologies
Deployed at over 19,000 sites worldwide across multiple industries, OSIsoft’s PI System is one of the world’s most widely used software technologies for the Industrial Internet of Things. The PI System captures data regarding energy consumption, asset utilization or complex process flows and then transforms it into rich information streams. Over 1.5 billion sensors worldwide stream data into the PI System.
The PI System also generates a comprehensive, contextual system of record so data regarding temperature, pressure, vibration, and other information are saved in a way that preserves their interrelationships. With many technologies, contextual relationships can get lost.
Traditionally, systems like the PI System were known as data historians because they captured an accurate history of the operational systems within a facility or company. Over the past decade, historians have come to be more accurately referred to as “data infrastructure” because they create a safe, reliable system for capturing, distributing and preparing data for consumption. Through the operational data infrastructure approach of the PI System, users can obtain a single, unified, high-fidelity view into their operations.
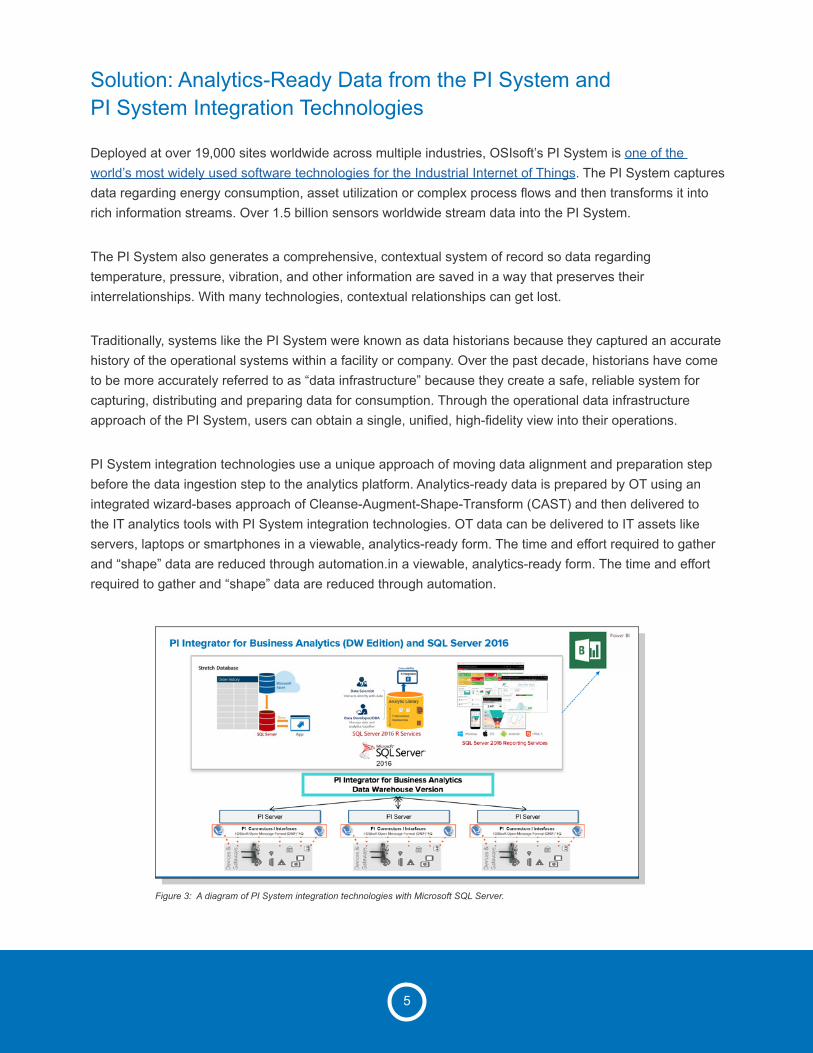
PI System integration technologies use a unique approach of moving data alignment and preparation step before the data ingestion step to the analytics platform. Analytics-ready data is prepared by OT using an integrated wizard-bases approach of Cleanse-Augment-Shape-Transform (CAST) and then delivered to the IT analytics tools with PI System integration technologies. OT data can be delivered to IT assets like servers, laptops or smartphones in a viewable, analytics-ready form. The time and effort required to gather and “shape” data are reduced through automation.in a viewable, analytics-ready form. The time and effort required to gather and “shape” data are reduced through automation.
Figure 3: A diagram of PI System integration technologies with Microsoft SQL Server.
6
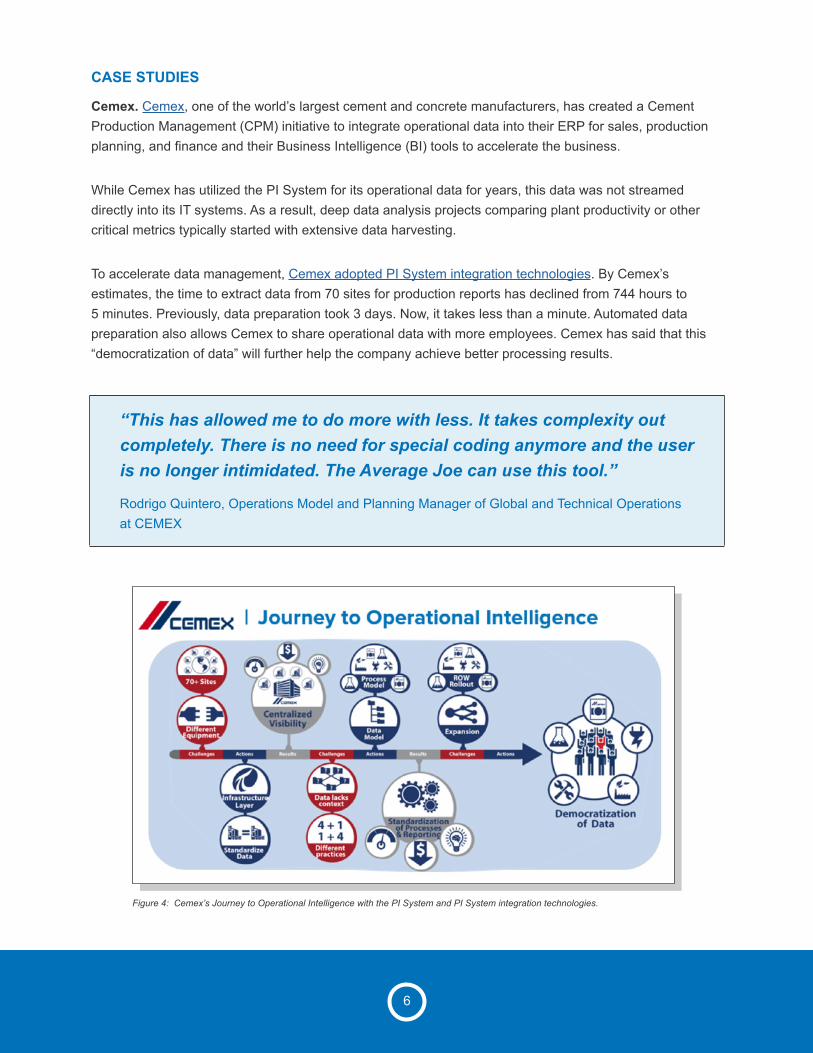
Figure 4: Cemex’s Journey to Operational Intelligence with the PI System and PI System integration technologies.
“This has allowed me to do more with less. It takes complexity out completely. There is no need for special coding anymore and the user is no longer intimidated. The Average Joe can use this tool.”
Rodrigo Quintero, Operations Model and Planning Manager of Global and Technical Operations at CEMEX
Cemex. Cemex, one of the world’s largest cement and concrete manufacturers, has created a Cement Production Management (CPM) initiative to integrate operational data into their ERP for sales, production planning, and finance and their Business Intelligence (BI) tools to accelerate the business.
While Cemex has utilized the PI System for its operational data for years, this data was not streamed directly into its IT systems. As a result, deep data analysis projects comparing plant productivity or other critical metrics typically started with extensive data harvesting.
To accelerate data management, Cemex adopted PI System integration technologies. By Cemex’s estimates, the time to extract data from 70 sites for production reports has declined from 744 hours to 5 minutes. Previously, data preparation took 3 days. Now, it takes less than a minute. Automated data preparation also allows Cemex to share operational data with more employees. Cemex has said that this “democratization of data” will further help the company achieve better processing results.
CASE STUDIES

7
“We have made more progress in the past 6 months at ADM with operational data via [the] PI System than we have had in the past 14 years.”
Erik Roukens, Manager Operational Excellence at ADM
Archer Daniels Midland (ADM). A global food processing corporation, ADM wanted to use predictive analytics to end the premature failure of a specific piece of farming equipment. When this specific type of machine fails, it must be completely rebuilt at a cost of $50,000 per unit.
With hundreds of possible variables, pinpointing an exact cause can be problematic. Is the failure related to the flow of the feed? The composition of the feed? The physical location of the equipment? Do causes differ from location to location?
A longtime OSIsoft customer, ADM created an asset framework and event frame models with PI System integration technologies to narrow down the problem to identify the key variables that affect the failure rate and then built Azure machine learning models that could analyze the interaction of these key variables.
ADM deployed PI System integration technologies, Cortana Intelligence and Power BI on their PI Systems and delivered analytics ready data, context and events to Azure SQL Data Warehouse. ADM is in the process of deploying the Azure machine learning model to analyze data from 28 of the systems at two locations. Over time, the predictive model may potentially be used at hundreds of other locations.
8
Carnegie Mellon University (CMU). CMU uses Microsoft Azure and the PI System to analyze fault detection and diagnostics for building and energy performance. Because energy can be impacted by lighting systems, HVAC, air handlers, manual windows, automatic windows and other systems as well as by human behavior, the amount of data can grow exponentially and change rapidly. In a trial, CMU tracked data from 1,500 sensors over 7,000 square feet.
By getting PI System data into Azure, CMU was able to generate values for expected and actual energy consumption. Prior to the initiative, the university did not have a comprehensive system to monitor energy. Now, the university believes the system will reduce energy consumption by up to 20%. CMU consumes $20 million worth of energy a year, bringing potential savings to up to $4 million. With 13,000 students, the potential savings comes to $1,600 per student.
The university is now collaborating with a military installation to employ a similar real-time system to monitor 30 buildings at a military base and with Pittsburgh Bank to optimize energy use at up to 4,000 sites.
“We immediately began using Azure Machine Learning without having to prepare on-premise software; everything’s ready-to-use in the cloud and it fits seamlessly with the PI System and Microsoft cloud solution we already had.”
Bertrand Lasternas, Researcher, Center for Building Performance and Diagnostics at Carnegie Mellon University
9
ReferencesCemex: https://www.youtube.com/watch?v=TfjFKnjTFco
http://cdn.osisoft.com/corp/en/media/presentations/2016/UsersConference2016/PDF/MM162070_CEMEX_Quintero_LeveragingthePISystemastheFoundationofProductionSystemsRoadmapforEvolution.pdf
Archer Daniels Midland: http://www.osisoft.com/Presentations/Using-the-PI-Integrator-for-Business-Analytics--BAx-to-Operationalize-Predictive-Analytics-with-Azure-ML/
http://cdn.osisoft.com/corp/en/media/presentations/2016/UsersConference2016/PDF/K2161020_ADMMicrosoftOSIsoft_HarmeierPriyaSathyPrabalAcharyya_UsingthePIIntegratorforBusinessAnalyticsBAtoOperationalizePredictiveAnalyticswithAzureML.pdf
Carnegie Mellon University: http://www.osisoft.com/Presentations/Carnegie-Mellon-Intelligent-Dashboards--From-Lab-to-Market/-Mellon-Intelligent-Dashboards--From-Lab-to-Market
http://cdn.osisoft.com/corp/en/media/presentations/2014/RegionalSeminars/RS2014_Pittsburgh/PDF/RS2014_Pittsburgh_CarnegieMellonUniversity_Lasternas_UnlockDataInsightwithMachineLearningandFutureData.pdf
https://blogs.microsoft.com/firehose/2014/09/23/carnegie-mellon-adds-azure-machine-learning-to-cut-energy-use-by-20-percent/#sm.000516d9g1c7hcsuwqy1gdd4ribqj
NYT: For Data Scientists: Janitor Work Is Key Hurdle to Insights http://www.nytimes.com/2014/08/18/technology/for-big-data-scientists-hurdle-to-insights-is-janitor-work.html?_r=2
Wikibon: The Vital Role of Edge Computing in IoT http://wikibon.com/the-vital-role-of-edge-computing-in-the-internet-of-things/
Tech Republic: The Lifecycle of a Server http://www.techrepublic.com/blog/data-center/infographic-the-life-cycle-of-a-server/
Energy Skeptic: Electric Grid Large Power Transformers Take Up To Two Years to Build http://energyskeptic.com/2015/power-transformers-that-take-up-to-2-years-to-build/
Got Data: The Value of Energy Access to Consumers http://static1.squarespace.com/static/52d5c817e4b062861277ea97/t/56b2ba9e356fb0b4c8559b7d/1454553838241/Got+Data+-+value+of+energy+data+access+to+consumers.pdf
50 to 100 kilobits. Andrew Tang, PG&E. http://www.greentechmedia.com/articles/read/qa-pges-andrew-tang-5335
NYC Housing Assets. https://www1.nyc.gov/assets/hpd/downloads/pdf/2014-HVS-initial-Findings.pdf
(Flowserve) Good Vibrations: Condition Based Monitoring for Petrochem http://www.plantservices.com/articles/2016/what-works-good-vibrations-condition-based-monitoring-petrochem/
OSIsoft Solutions. http://www.osisoft.com/solutions/
Internet of Things Game Changers (1% of OT for decision making) http://www.voiceamerica.com/show/2373/internet-of-things-with-game-changers-presented-by-sap
http://www.osisoft.com/Presentations/Using-the-PI-Integrator-for-Business-Analytics--BAx-to-Operatio
http://www.osisoft.com/Presentations/Using-the-PI-Integrator-for-Business-Analytics--BAx-to-Operatio
http://cdn.osisoft.com/corp/en/media/presentations/2016/UsersConference2016/PDF/K2161020_ADMMicrosof
http://cdn.osisoft.com/corp/en/media/presentations/2016/UsersConference2016/PDF/K2161020_ADMMicrosof
http://www.osisoft.com/Presentations/Carnegie-Mellon-Intelligent-Dashboards--From-Lab-to-Market/-Mel
http://www.osisoft.com/Presentations/Carnegie-Mellon-Intelligent-Dashboards--From-Lab-to-Market/-Mel
http://cdn.osisoft.com/corp/en/media/presentations/2014/RegionalSeminars/RS2014_Pittsburgh/PDF/RS201
http://cdn.osisoft.com/corp/en/media/presentations/2014/RegionalSeminars/RS2014_Pittsburgh/PDF/RS201
https://blogs.microsoft.com/firehose/2014/09/23/carnegie-mellon-adds-azure-machine-learning-to-cut-e
https://blogs.microsoft.com/firehose/2014/09/23/carnegie-mellon-adds-azure-machine-learning-to-cut-e
http://www.nytimes.com/2014/08/18/technology/for-big-data-scientists-hurdle-to-insights-is-janitor-w
http://static1.squarespace.com/static/52d5c817e4b062861277ea97/t/56b2ba9e356fb0b4c8559b7d/1454553838
http://static1.squarespace.com/static/52d5c817e4b062861277ea97/t/56b2ba9e356fb0b4c8559b7d/1454553838
About OSIsoft
OSIsoft, a global leader enabling operational intelligence, delivers an open enterprise infrastructure to connect sensor-based data, operations and people to enable real-time and actionable insights. As the maker of the PI System, OSIsoft empowers companies across a range of industries in activities such as exploration, extraction, production, generation, process and discrete manufacturing, distribution and services to leverage streaming data to optimize and enrich their businesses. For over thirty years, OSIsoft customers have embraced the PI System to deliver process, quality, energy, regulatory compliance, safety, security and asset health improvements across their operations.
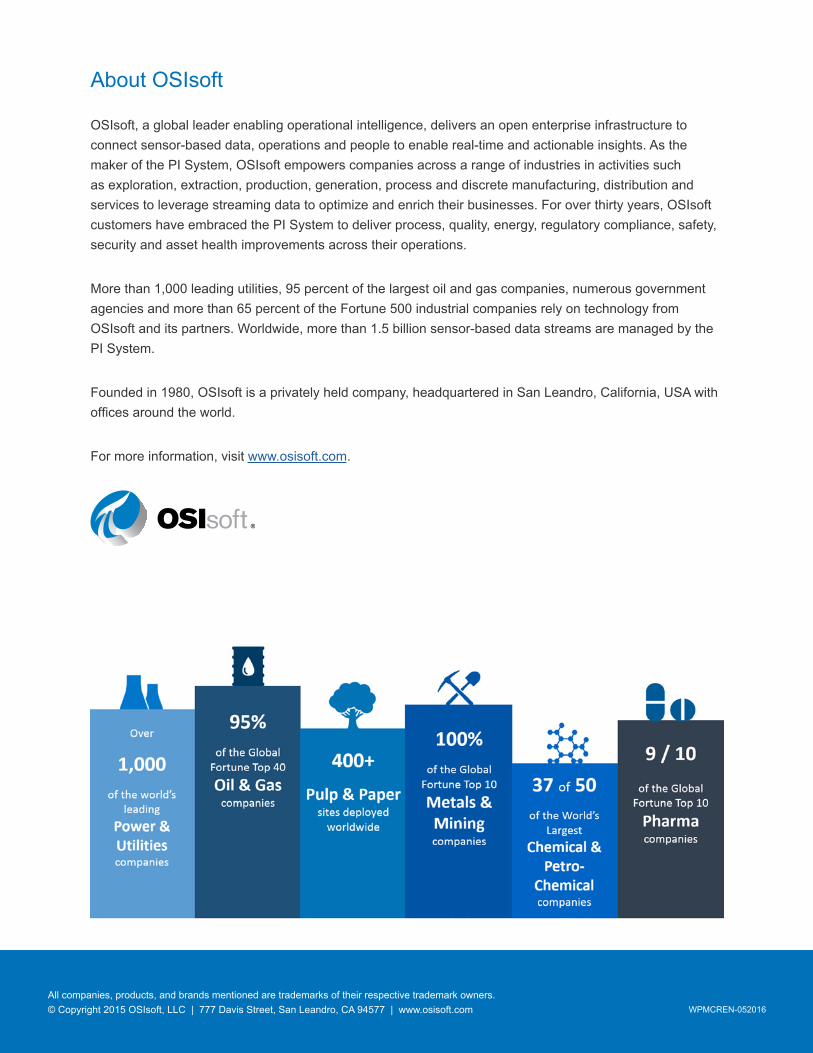
More than 1,000 leading utilities, 95 percent of the largest oil and gas companies, numerous government agencies and more than 65 percent of the Fortune 500 industrial companies rely on technology from OSIsoft and its partners. Worldwide, more than 1.5 billion sensor-based data streams are managed by the PI System.
Founded in 1980, OSIsoft is a privately held company, headquartered in San Leandro, California, USA with offices around the world.
For more information, visit www.osisoft.com.
All companies, products, and brands mentioned are trademarks of their respective trademark owners.© Copyright 2015 OSIsoft, LLC | 777 Davis Street, San Leandro, CA 94577 | www.osisoft.com WPMCREN-052016