When Eyes and Ears Compete: Eye Tracking How Television ...
110
Brigham Young University BYU ScholarsArchive All eses and Dissertations 2017-05-01 When Eyes and Ears Compete: Eye Tracking How Television News Viewers Read and Recall Pull Quote Graphics Othello Lennox Richards Brigham Young University Follow this and additional works at: hps://scholarsarchive.byu.edu/etd Part of the Communication Commons is esis is brought to you for free and open access by BYU ScholarsArchive. It has been accepted for inclusion in All eses and Dissertations by an authorized administrator of BYU ScholarsArchive. For more information, please contact [email protected], [email protected]. BYU ScholarsArchive Citation Richards, Othello Lennox, "When Eyes and Ears Compete: Eye Tracking How Television News Viewers Read and Recall Pull Quote Graphics" (2017). All eses and Dissertations. 6812. hps://scholarsarchive.byu.edu/etd/6812
Transcript of When Eyes and Ears Compete: Eye Tracking How Television ...

Brigham Young UniversityBYU ScholarsArchive
All Theses and Dissertations
2017-05-01
When Eyes and Ears Compete: Eye Tracking HowTelevision News Viewers Read and Recall PullQuote GraphicsOthello Lennox RichardsBrigham Young University
Follow this and additional works at: https://scholarsarchive.byu.edu/etd
Part of the Communication Commons
This Thesis is brought to you for free and open access by BYU ScholarsArchive. It has been accepted for inclusion in All Theses and Dissertations by anauthorized administrator of BYU ScholarsArchive. For more information, please contact [email protected], [email protected].
BYU ScholarsArchive CitationRichards, Othello Lennox, "When Eyes and Ears Compete: Eye Tracking How Television News Viewers Read and Recall Pull QuoteGraphics" (2017). All Theses and Dissertations. 6812.https://scholarsarchive.byu.edu/etd/6812

When Eyes and Ears Compete: Eye Tracking How Television News Viewers
Read and Recall Pull Quote Graphics
Othello Lennox Richards
A thesis submitted to the faculty of Brigham Young University
in partial fulfillment of the requirements for the degree of
Master of Arts
Kevin John, Chair Dale Cressman Steve Thomsen
School of Communications
Brigham Young University
Copyright © 2017 Othello Lennox Richards
All Rights Reserved

ABSTRACT
When Eyes and Ears Compete: Eye-Tracking How Television News Viewers Read and Recall Pull Quote Graphics
Othello Lennox Richards
School of Communications, BYU Master of Arts
This study applied dual processing theory, the theory of working memory, and the theory
of cue summation to examine how the video and audio in a television news story interact with or against each other when the story uses pull quote graphics to convey key information to viewers. Using eye-tracking, the study produced visual depictions of exactly what viewers look at on the screen when the words in the reporter’s voice track match the text in the pull quote graphic verbatim, when the reporter summarizes the text in the graphic, and when the reporter’s voice track ignores the text in the pull quote. The study tested the effect on recall when viewers were presented with these three story conditions—high redundancy, medium redundancy, and low redundancy, respectively. Key findings included the following: first, that stories with low redundancy resulted in lower recall and memory sensitivity scores (a measure of memory strength) than pull quotes that the reporter either summarized or read verbatim on the air. Second, it was found that neither high-redundancy nor medium-redundancy stories were superior or inferior to the other when looking at the effect on recall and memory sensitivity. And finally, in high-, medium-, and low-redundancy conditions, subjects stated that they relied more on the reporter’s narration than the pull quote to get information. The study states possible implications for news producers and reporters and suggests future research in the broadcast television news industry. Keywords: dual processing theory, working memory, cue summation, memory sensitivity, signal detection theory, television news, pull quote, eye-tracking, redundancy, graphics

ACKNOWLEDGEMENTS
I would like the thank the BYU School of Communications for giving me the opportunity
to return to school and work on my master’s degree while teaching what I love, broadcast news,
as a faculty member. I thank my committee members and my childhood friend, who also
happened to be my chair, for helping me each step of the way. I thank my beautiful wife, Ashley
Richards, who gave birth to our two children while I worked on my degree, and continue to raise
them with the utmost love and care. I thank my Father in heaven. Without him in my life, all of
this means nothing.

iv
TABLE OF CONTENTS
TITLE ............................................................................................................................................. i
ABSTRACT .................................................................................................................................... ii
ACKNOWLEDGEMENTS ........................................................................................................... iii
TABLE OF CONTENTS ............................................................................................................... iv
LIST OF TABLES ......................................................................................................................... vi
LIST OF FIGURES……………………………………………………………………………...vii
INTRODUCTION .......................................................................................................................... 1
LITERATURE REVIEW ............................................................................................................... 4
Historical Look at the Evolution of Television Graphics ........................................................... 4
Theory ....................................................................................................................................... 11
Research Questions ................................................................................................................... 31
METHODOLOGY ....................................................................................................................... 34
Design ....................................................................................................................................... 34
Participants ................................................................................................................................ 34
Materials ................................................................................................................................... 35
Eye Movement Recording ........................................................................................................ 36
Recall Testing Instrument ......................................................................................................... 37
Procedure .................................................................................................................................. 38
Pretest ........................................................................................................................................ 39
Measures ................................................................................................................................... 40
Analysis..................................................................................................................................... 42

v
RESULTS ..................................................................................................................................... 44
DISCUSSION ............................................................................................................................... 51
Recall ........................................................................................................................................ 52
Memory Sensitivity ................................................................................................................... 54
Audio Versus Narration ............................................................................................................ 55
Gaze Pattern .............................................................................................................................. 57
CONCLUSION ............................................................................................................................. 59
Limitations and Future Research .............................................................................................. 61
APPENDIX SECTION A: Scripts for News Packages ............................................................... 63
High Redundancy Script ........................................................................................................... 63
Medium Redundancy Script ..................................................................................................... 64
Low Redundancy Script ............................................................................................................ 65
APPENDIX B: Post Eye-Tracking Questionnaire/Recall Test .................................................... 66
APPENDIX C: Informed Consent Form ...................................................................................... 71
APPENDIX D: Recruiting Sheet .................................................................................................. 73
APPENDIX E: Debriefing Statement ........................................................................................... 74
TABLES AND FIGURES ............................................................................................................ 75
References ..................................................................................................................................... 93

vi
LIST OF TABLES
1. One-Way ANOVA - Hit Rate…………………………………………………………….......75
2. One-Way Analysis of Variance of Hit Rate by Redundancy Condition……………….....…..76
3. One-Way ANOVA - Memory Sensitivity…………………………………………...……..…77
4. One-Way Analysis of Variance of Memory Sensitivity by Redundancy Condition...…..........78
5. Audio/Graphic Preference by Condition………………………………………..………..…...79 6. Eye-tracking Measures…………...………...…………………………………………...……..80

vii
LIST OF FIGURES
1. Pull-Quote Example…………………………………………………………………………..81 2. High, Medium, Low Redundancy Fixation Density Map………………………...............…..82

WHEN EYES AND EARS COMPETE
1
CHAPTER ONE
INTRODUCTION
Television news has evolved over the years. What viewers see today bears little
resemblance to the first-ever half-hour news broadcast on television in 1963 by Walter Cronkite
(Ponce de Leon, 2015). In the early days of television news, an anchor sat in front of the camera
and essentially read the news, as if he or she were reading a newspaper. In today’s terminology,
this is called a reader, which is spoken words without any video. Years later, video depicting the
actual event the anchor described appeared simultaneously with the anchor’s words. On-screen
graphics also made their way into the newscasts. Graphics are used when video is not readily
available, and they can help clarify and illustrate complex information to make it more
understandable (Wenger & Potter, 2015). Television graphics are here to stay (Rodrigues,
Veloso, & Mealha, 2016).
Graphics come in many formats, including full frames, story slugs, name supers, names
and email addresses of reporters, the location of the story, and so on. Over the years, other types
of video graphics also became widely utilized as computer-generated graphics technology
improved. One such type of graphic is the pull quote. It is used to highlight a set of words or
sentences in a document. On television, the pull quote (see Figure 1) often appears hovering
over a shot of the original document (Keller & Hawkins, 2009).
The pull quote is commonly seen in stories that utilize court documents, police reports, or
investigative stories (Tuggle, Carr, & Huffman, 2011). Since the Cops and Courts Beat is
popular amongst news stations, these types of stories and graphics regularly make their way into
newscasts. According to Wenger and Potter (2015), if a reporter has words in their television
graphic, they need to make sure what they say in the voice track matches what’s on the screen:

WHEN EYES AND EARS COMPETE
2
“When words appear on the screen, people read them. It’s human nature. If you don’t want the
audience to read the screen, don’t use words” (Wenger & Potter, 2015, p. 197). News personnel
don’t always heed this advice. Sometimes the sequence of words in the pull quote graphic match
the anchor’s or reporter’s spoken words (aka voice track or narration). Other times, news
personnel choose to show the actual text from the document but summarize the written on-screen
text in their voice track. This second condition may cause the eyes and the ears to compete with
one another; the viewer may have difficulty seeing the text on the screen that he or she is
hearing, and this may lead to confusion or decreased understanding. That undermines the
purpose of a news graphic.
Previous research has looked at the effects of “competing” video and words, but eye-
tracking technology has not been involved in the study of pull quotes. The present study seeks to
understand how the visual and audio elements in news stories interact either with or against each
other when a pull quote graphic is utilized. This research seeks to provide a visual depiction of
what one’s eyes track when the position of the words in a graphic corresponds to what is being
stated verbally or when the two are out of sync, and how these conditions impact recall. This will
help newsrooms employ the most effective storytelling techniques so information they present to
viewers is more clear, easier to comprehend, and better retained.
The research addressed several theories, including dual-processing theory, theory of
working memory, and cue summation principle of learning theory. While these are three separate
theories, they are all interrelated and are discussed in greater detail in the literature review. They
are based on the assumptions that most individuals possess an auditory and visual channel for
processing information; each channel has limited capacity; and learning occurs by filtering,
selecting, and organizing information. The theories address the effects of presenting

WHEN EYES AND EARS COMPETE
3
corresponding visual and audio, in a condition referred to as high redundancy, and also the
effects of when the audio is out of sync with the visual, in a condition referred to as medium
redundancy or low redundancy.
The study used men and women over the age of 18 as human subjects. The subjects were
undergrads at a western United States university. The study was conducted using eye-tracking
hardware, software, and surveys.

WHEN EYES AND EARS COMPETE
4
CHAPTER TWO
LITERATURE REVIEW
Historical Look at the Evolution of Television Graphics
High-definition television sets, high-definition cameras, and 3-D graphics have become
commonplace in television news. In 2008, CNN planned to introduce a few technology surprises
in its election night coverage. One was the incorporation of virtual elements into its real-world
set at Time Warner Center in New York (Dickson, 2008). The network created a 3-D virtual
model of the U.S. Capitol to display a graphic representation of the impact of senate races. More
dramatically, the network also planned to project holographic images of its field reporters onto
the New York set. CNN senior VP David Bohrman stated that he had been considering the
technology for more than a decade, that the holographic system was not a one-night gimmick,
and that it could have “long-ranging implications for news: ‘It’s an interesting step in how TV
can do live interviews’” (Dickson, 2008, para.11). In order to examine the evolution of television
news graphics, one has to pay attention to how election night coverage like CNN’s broadcasts
produced the impetus for technological advances; eventually the new graphics displayed on
arguably one of the biggest nights of breaking news coverage made their way into network and
local news stories.
In previous decades, computer technology to produce simple title graphics that could
instantaneously and electronically show the names of people who appeared on the screen did not
exist. During political seasons—namely, U.S. presidential elections—it was essential for viewers
to identify the speaker at political conventions. The laborious process of creating title graphics
required someone to set up a name in type; it would then be photostatted on a black background

WHEN EYES AND EARS COMPETE
5
so it could be superimposed on the screen. CBS producer Don Hewitt (1985) said CBS did this
so its audience could tell who was speaking without the anchors having to interrupt their speech.
In the early days of television, producers realized the advantage of being able to display
information pictorially that reinforced what was being spoken audibly. This advantage relates to
the principle of cue summation that theorizes how learning increases, to an extent, as the number
of related audio and video cues increases and will be discussed later in greater detail.
A quick, clear, and easy picture of election results appeared to be the goal of the
networks, but how they went about showcasing—or some may call it showboating—that picture
changed dramatically from decade to decade. In the case of the 1960 presidential election and the
two other presidential elections that decade, the camera operator would zoom in on tight shots of
the tote boards to show full-screen election results, which could be changed mechanically (Von
Pein, 2013). A full-screen graphic, a graphic that fills the entire television screen instead of video
(Kolodzy, 2013), has become a staple in network and local news. One type of full-screen is what
some call pullouts or pull quotes. It involves “taking part of a quote or a whole quote and
creating graphics of those words in larger text. . . . In television, a quote graphic might be used to
highlight a key point or conclusion in a written report, or the words in a newsmaker’s written
statement and audio” (Kolodzy, 2013, p. 100). The visual complexity of the graphics has
increased from mere brightly colored letters on a black background, which was the case in
the ’60s, to the current standard showing video of the actual report with text passages raised out
onto the screen, yet the initial premise of the graphic has remained the same through all of the
technological advances.
Another broadcast element that has remained a constant is the projection of election
results; it remains paramount in network coverage. Networks compete to be the first to announce

WHEN EYES AND EARS COMPETE
6
an unambiguous winner. NBC used the power of a computer to assist its talent. “The RCA 501
computer is the world’s most advanced electronic data processing system,” a 1959 brochure read
in large italicized letters. “Compact, Reliable, Efficient. Easy to install . . . Easy to operate . . .
Easy to maintain” (RCA Corporation, 1959). The computer was anything but compact by today’s
standards. The brochure introduced the RCA 501 as an entirely new concept, design, and
construction in electronic data processing. The system proved useful for NBC in that it allowed
the station to more quickly report estimates of projections for the final popular vote count and the
electoral college tally. CBS used a similar computer system called UNIVAC, a giant 12-ton
machine that the network called a “great, metallic mind” (Frenkel, 1988, p. 1178).
Even though the RCA 501 and UNIVAC computed projections of election results, there
still was the need of a system to display those numbers on a television screen more quickly than
mechanical tote boards. Barnhurst and Steele (1997) observed, “Through the 1960s, visual news
style amounted to a series of moderate shots of talking heads on a bland background” (p. 48).
Technological advances of the television medium, including graphic generators and electronic
editing units made it easier to produce “highly complex modern” news stories (Hallin, 1992, p.
11). These graphic units are called character generators. For example, the development of the
Vidifont, came about as Rudi Bass, CBS graphics arts director, was preparing for a broadcast
from the Republican and Democratic National Conventions for the 1968 elections between
Republican candidate Richard Nixon and Democratic candidate Hubert Humphrey (Baron,
2008). Graphic arts departments at the time generated graphics for the news shows, including the
title graphics of the names of individuals appearing on the show. At the time, the most widely
used method of putting titles on the broadcast was known as superimposition (Bass, 1967; Baron,
2008). Stanley Baron was an engineer employed at a research division of CBS, Inc., CBS

WHEN EYES AND EARS COMPETE
7
Laboratories. He explained the laborious nature of superimposition, considering the task Bass
had at hand:
Graphics including all title graphics (i.e. “President Lyndon B. Johnson” or “Walter
Cronkite”) were set in type or drawn by graphic artists. The graphic was photographed
using 35-mm film, the film developed, and a 35-mm slide generated. The time to
generate a slide exceeded one hour. The slide, when used, was placed in a special
projector, scanned by a television camera, and keyed into the studio video feed. . . . Bass
was seeking an instantaneous, graphics-quality titling capability solution to the problem.
The goal was to produce graphics that could be transparently mixed with artwork created
using traditional methods. (Baron, 2008, “Inventing the Vidifront,” para. 2)
Bass asked CBS engineers to find a more effective solution to the massive titling challenge. Not
only did it require a lot of time and effort to produce superimposed graphics, but the graphics on
television had a tendency to appear distorted, with “blooming or bleeding” at the corners of
letters (Bass, 1967, p. 360). The team consisted of seven engineers including Baron.
The group constructed and tested the first prototype, called the Vidifont, in 1969; the following
year they demonstrated the final design at the National Association of Broadcasters (NAB)
Conference in Chicago. Baron (2008) stated, “After the first morning, the reaction to the
Vidifont by the attendees at the conference could be compared to the crowds awaiting the
opening of the doors to a shopping mall on the day after Thanksgiving, and there was a constant
stream of traffic to see this new innovation” (“Public Reaction to the Vidifront,” para. 18). The
system used keyboard entries for all composition pre-set or in real time, including line
positioning, centering tab set, roll, crawl, and blink (Bass, 1967). CBS put the first digital
graphics device on the commercial market for other broadcasters to purchase in 1970. Successive

WHEN EYES AND EARS COMPETE
8
units improved in pixel resolution. Bass (1971) wrote, “We consider the graphic quality of
Vidifont an important step forward in synthetic video design” (p. 46).
With the addition of character generators, Barnhurst and Steele (1997) found dramatic
changes in the presentation of election coverage between 1968 and 1972. Election coverage
continued to drive new technology. The researchers found an uptick in the frequency of
journalists’ appearing on television, video clips, graphics, and captions. This occurred in “an
environment of stiffer competition and more flexible technology, with politicians pressuring the
networks to emphasize news programming” (Barnhurst & Steele, 1997, p. 49).
Between 1972 and 1976, the pace of election reports also changed, with newscasters
shortening their appearances on the screen in place of showing more edited video. “Where
previously they acted as news readers on the air, journalists now rejected the old structure based
on radio-news-with-pictures and developed something unique to television: a chain of images
overlaid onto a fast-paced narrative” (Barnhurst & Steele, 1997, p. 49). (The pull quote graphic
has become one of the images journalists use today as they read quotes on camera and text
passages from documents. The visual element of the graphic allows viewers to read the text for
themselves while listening to the reporter.)
Back in 1984 the use of visuals peaked, with newscasters showing more images at a
faster pace than had appeared in the ’60s (Barnhurst & Steele, 1997). Advances in production
technology and increased competition amongst news outlets sparked this change in the
presentation style of news programs (Cooke, 2005). Video clips, graphics, and captions hit a high
point. CNN was one of the ringleaders. John Caldwell (1995) writes:
CNN demonstrated the pervasive possibilities of videographic presentation. Starting in
1980—and without any apparent or overt aesthetic agenda—CNN created and celebrated

WHEN EYES AND EARS COMPETE
9
a consciousness of the televisual apparatus: an appreciation for multiple electronic feeds,
image text combinations, video graphics, and studios with banks of monitors that evoked
video installations. Ted Turner had coauthored the kind of cyberspace that video freaks
and visionaries had only fantasized about in the late 1960s (p. 13).
Caldwell (1995) coined the term videographic televisuality to describe the visual
transformation television had taken on, compared to its earlier years. Television production had
evolved from the bland and neutral look of earlier decades. Videographic televisuality in the
1980s and years after was heavy on effects. Advancements in technology gave producers more
stylistic options. Caldwell (1995) writes:
Digital videographics so dominate mass market television that they have become an
obligatory—even if unremarkable—part of the cutting edge package. Seldom betraying a
prestige signature maker, digital videographics mass produce acute stylistic looks for
both primetime and off primetime. Between shows, in title sequences, in newsbreaks, in
previews, and throughout many live genres, videographic televisuality has become a
requisite form of packaging. (p. 134)
Likewise, the pull quote full-screen graphic appears to have become a requisite form of
displaying quotes on television. Research has suggested the quotation is a powerful persuasion
tool, “one that can be used to influence news consumers’ perceptions of issues” (Gibson, Hester,
& Stewart, 2001, p. 66). The advancement in computer technology and character generating
units has made it easier than ever for reporters and producers to create the full-screen pull quote
for their stories based on information they have gathered.
So was the case in the mid ’80s when beefed-up graphics packages allowed networks to
put eye-popping graphics on their screens. For instance, when CBS anchorman Dan Rather

WHEN EYES AND EARS COMPETE
10
announced Ronald Reagan president in 1984, CBS used an animated 3-D graphic to show the
270 electoral votes the candidates needed to win. Gone were the simple characters superimposed
on the screen of Rudi Bass’s days (Grzanich, 2012). The mammoth electoral college map once
used that lit up states that the candidates won blue or red was now replaced with a virtual map of
the 50 states, positioned directly in front of Rather. The anchor looked down at the map and used
his hands to reference it as if it was tangible, but in reality it was merely a computer graphic
superimposed in front of him (Grzanich, 2012). Also, like CBS, NBC used full screens with
animated graphics to report state races. Barnhurst and Steel (1997) acknowledged, “American
television was completing the decade that Ken Auletta calls a golden era of network dominance”
(p. 51).
Moving forward, the early 1990s saw an upward turn in the use of video clips, graphics,
and captions—actually reaching all-time highs (Barnhurst & Steele, 1997). Networks didn’t just
have studios; they now had “command centers,” as ABC News called the operation for its 1992
election night coverage (Parker, 2010). Dozens of monitors replaced the tote boards of the ’60s.
Anchors Peter Jennings and David Brinkley spent the beginning of the newscast referencing
several full-screen, vibrant-colored graphics that displayed the projected winners in selected
states.
In the ’90s, the Internet also took the stage as an information source and another medium
for networks to disseminate content. As the Internet gained popularity, television news programs
developed an Internet presence “by borrowing from visual trends in existing media” (Cooke,
2005, p. 37). One of these trends in the mid to late ’90s and into the next decade was to segment
the television streams to give viewers more information all at once. Television news programs
tried to mimic the up-to-the-minute status that the Internet provided by using graphical features

WHEN EYES AND EARS COMPETE
11
such as bottom-scrolling tickers, remaining content panels that showed the slugs of upcoming
stories, factoids, stock prices, and weather maps (Cooke, 2005; Associated Press Online, 2001).
In recent years, news organizations have increasingly used social media as another
platform to deliver content. It is difficult to find a news outlet that does not have a Twitter or
Facebook page. Jeff Moore, Ross Video executive VP, notes, “Social media has become a very
important tool for news gathering and to engage viewers” (Winslow, 2014, p. 35). No longer do
audiences get their news only from television; now the use of smartphones and tablets to view
news is commonplace. As a result, broadcasters wrestle with the task of “delivering more content
to more devices,” while some believe “better graphics and emerging digital technologies provide
a significant advantage in the highly competitive local news business” (Winslow, 2014, p. 35).
Graphics have become an integral part of television news coverage. After ABC
purchased a Vidifont system and started to use computer graphics for name supers, its ratings
shot up during the 1972 election from what is was in 1968. It is difficult to make a direct
correlation between the two, but one can only surmise that the use of computer graphics helped
ABC. Apparently, station general managers have felt investing in new technology would pay
dividends in the form of increased viewership and added financial revenue. Imagine a network
today using a 30-year-old graphics package and trying to compete with the broadcast spectacle,
alluded to earlier, that CNN put on in 2008 that helped with audience engagement. Back then,
those graphics were state of the art, and that’s how one may feel about new technology in the
present moment.
Theory
The use of visuals and graphics combined with illustrative narration is done in an effort
to keep television viewers engaged in the presentation so they may be better informed. In the

WHEN EYES AND EARS COMPETE
12
early ’80s, Robinson, Sahin, and Davis (1982) found that broadcasters had traditionally been
unconcerned with learning as an audience effect. But future research discovered that television
viewers actually wanted to learn from the news. Reese (1983) found that viewers appear to
evaluate more highly programs from which they learn the most. “Devoting more attention to a
comprehensible newscast may lead directly to more positive audience regard for the news
organization and its products” (Reese, 1983, p.16). But for this to happen, reporters and
producers need to present the news in a way that helps viewers understand the information and
remember it. This was the recommendation by Woodall, Davis, and Sahin (1983). The
researchers state the importance of one being able to understand and remember the news:
The ability or inability to understand and remember the news presented to viewers on any
given day will leave viewers more prepared or less prepared to understand the news
tomorrow. Misconceptions of important stories can persist and influence future
understanding and decision making. As a society, we make decisions about collective
actions based on our understanding of the world around us, which we derive in part from
news stories. We elect presidents and select homes and jobs on the basis of
understandings which may be linked to our processing of the news. If there is widespread
and increasing misunderstanding of certain news stories, we may all make poorer
decisions. Similarly, increasing our ability to understand and remember news might well
have benefits that are difficult to anticipate. Increasing the public’s ability to understand
television news could well be as important to our generation as the campaigns for literacy
and public education were for earlier generations. (p. 22)

WHEN EYES AND EARS COMPETE
13
A lot of information presented in the news may be stored and remembered according to
episodic memory principles, rather than semantic memory. Researchers have drawn distinctions
between two types of memory. Woodall et al. (1983) define the differences as such:
Semantic memory can be conceived of as consisting of a network of concepts, words,
constructs and their interrelationships. . . . Episodic memory, on the other hand, is an
event memory which stores episodes as unique historical traces that consist of target or
to-be-remembered information and the context in which the target information was
presented or encountered. Carlston (1980) has suggested that event memories include
behavioral and situational details and preserves the temporal ordering of activity within
an event, and that episodic traces are “raw representations of what an observer thinks
transpired in a particular episode” (Woodall et al., 1983, p. 6).
Episodic trace of television news is made up of pictorial and verbal information.
“Successful recall of verbal target information requires a respondent to be presented with enough
of the visual context to match the memory trace” (Woodall et al., 1983, p. 8). Investigators have
found that various types of visuals, such as video footage, photos, and graphs (a type of graphic)
and drawings may enhance one’s ability to later recall information from a news story. Woodall et
al. (1983) found viewers are likely to remember certain concrete details of news stories, such as
the who, what, and where details. Woodall et al. (1983) define concreteness as “the degree of
detail and specificity about actors, actions and situational context” (p. 16). The present study will
test subjects on their ability to recall the concrete detail presented in a television news story. This
is discussed in greater detail in the methodology section of this manuscript.
Television news consists of a constant array of spoken and written words, images, and
graphics to present a variety of stories that make up the newscast. “The combination of words,

WHEN EYES AND EARS COMPETE
14
pictures and sounds can add up to powerful and memorable stories, but only if the elements are
selected and put together with skill and care” (Wenger & Potter, 2015, p. 198). One theory that
addresses episodic memory principles and how viewers process and recall the abundance of
information transmitted through multiple channels is dual-processing theory. Mayer and Moreno
(1998) state four assumptions of dual-processing theory:
(a) Working memory includes an auditory working memory and a visual working
memory, which are analogous to the phonological loop and visuo-spatial sketch pad,
respectively in Baddeley’s [1986, 1992] theory of working memory; (b) each working
memory store has a limited capacity, consistent with Sweller’s [1988, 1989; Chandler &
Sweller, 1992; Sweller et al., 1990] cognitive load theory; (c) meaningful learning occurs
when a learner retains relevant information in each memory store, organizes the
information in each store into a coherent representation, and makes connections between
corresponding representations in each store, analogous to the cognitive processes of
selecting, organizing and integrating in Mayer’s [1997; Mayer, Steinhoff, Bower, &
Mars, 1995] generative theory of multimedia learning; and (d) connections can be made
only if corresponding pictorial and verbal information is in working memory at the same
time, corresponding to referential connections in Paivio’s [1986; Clark & Paivio, 1991]
dual-coding theory. (p. 312)
According to Josephson and Holmes (2006), the results of various television studies
correspond with the four dual-processing theory assumptions:
First, television is a medium that uses pictures and sound to present information. Second,
television is a medium that could easily overload a limited working memory. Third, when

WHEN EYES AND EARS COMPETE
15
visual and auditory information are related, increased learning occurs. Fourth, it helps if
related pictorial and verbal information is in working memory at the same time. (p. 156)
From these assumptions, one postulates television news viewers can only recall a limited
amount of the information they see and hear during a newscast because of the limited capacity of
the working memory. Baddeley (1992) defines working memory as a system of the brain that
provides temporary, simultaneous storage and management of information for complex mental
tasks such as language comprehension, reading, learning, and reasoning. “Working memory
stands at the crossroads between memory, attention, and perception” (Baddeley, 1992, p. 559).
One can divide working memory into three subcomponents: (i) the central executive, which
effects concentration and the conscious control of behavior, (ii) the visuospatial sketch pad,
which processes visual images, and (iii) the phonological loop, which stores and recounts
speech-based information. Each working memory subcomponent has limited capacity (Holmes,
Josephson, & Carney, 2012), therefore only so much information can occupy one’s memory at
any particular time.
According to the theory of working memory, the phonological loop is susceptible to
several cues that cause a reduction in recall. Baddeley (1992) refers to one of these cues as the
irrelevant speech effect, “a reduction in recall of lists of visually presented items brought about
by the presence of irrelevant spoken material. . . . These results are interpreted under the
assumption that disruptive spoken material gains obligatory access to the phonological memory
store” (p. 558). In television news terms, this could be referred to as wallpaper video. According
to Tuggle et al. (2011), it is when broadcasters put pictures on the screen to cover narration, but
the pictures don’t necessarily match what is being spoken (p. 106). For example, if a reporter
mentions the mayor of a city in his or her script, viewers should see video of the mayor at the

WHEN EYES AND EARS COMPETE
16
same moment. If viewers see something or someone else, that would cause an irrelevant speech
effect.
Irrelevant speech may affect one’s ability to recall the news. According to Holmes et al.
(2012), research shows when audio is combined with text, this condition appears to overwhelm
the separate channels, whereas combining audio with related visual material requires less time to
process the information and performance is increased. In television news, the video and the script
should always match thematically (Tuggle et al., 2011, p. 106). If one’s working memory is
overloaded with conflicting and semantically unrelated visual messages, or in simpler terms, the
video and the script don’t match, Bergman, Grimes, and Potter (2005) conclude, “then that
portion of visual working memory—which is needed to process auditorially conveyed relational–
spatial concepts—might be rendered less effective” (p. 316).
It was stated earlier that graphics may enhance a news report and increase understanding.
Similar to the audio narration of a news report and the video that illustrates it, graphics are
considered another story element, or cue. The cue summation principle of learning theory posits
there is an increase in learning as the number of available cues is increased (Severin, 1967a). The
theory states audio-visual redundancy facilitates learning because similar cues are presented in
both channels (Adams & Chambers, 1962). Reese (1983) looked at the effects of between-
channel redundancy on news learning. He defines redundancy as shared information between the
audio, nonverbal pictorial, and visual-verbal print channel. In an experiment, Reese manipulated
network news stories to create a 2 x 2 design with four conditions: (i) redundant pictures and
words, (ii) nonredundant pictures and words, (iii) redundant pictures and words with redundant
print, and (iv) nonredundant pictures and words with redundant print. Reese found learning
improves when the pictorial and audio channels are redundant and support each other, and this

WHEN EYES AND EARS COMPETE
17
condition increases recall and decreases error. Findings also suggest best results occur when high
redundancy exists between visuals and their related verbal content, as opposed to “visuals that
are broadly related to verbal content” (Reese, 1983, p. 15).
The use of visuals combined with verbal content in a news story is a form of multiple-
channel communication. Multiple-channel communication and cue summation are routinely used
interchangeably in literature. Severin (1967b) writes,
a. Multichannel communications which combine words with related or relevant
illustrations will provide the greatest gain because of the summation of cues between the
channels;
b. Multichannel communications which combine words in two channels (words aurally
and visually in print) will not result in significantly greater gain than single-channel
communications since the added channel does not provide additional cues;
c. Multichannel communications which contain unrelated cues in two channels will cause
interference between channels and result in less information gain than if one channel
were presented alone;
d. Single-channel communications will be superior to condition c (above), equal to
condition b, and inferior to condition a. The efficiency of single-channel communications
when comparing various channels will depend upon the complexity of the material
presented for a given audience. (pp. 386–387)
Severin (1967a) defines interference as the “simultaneous transmission of information
between two channels in which the cues in the second channel are not relevant to those in the
first channel and thus result in information loss” (p. 234). Severin tested the theories using six
message conditions including audio-only messages and audio with related pictures, among

WHEN EYES AND EARS COMPETE
18
others. Severin reported that subjects who received information with audio and related pictures
received the highest scores of the six treatments (audio only, print only, audio and print, audio
with related picture, audio with unrelated picture, audio with highly unrelated picture). The
groups were divided in three levels of IQ. Severin found multiple-channel communications
appear to be superior to single-channel communications when relevant cues are summated across
channels, neither is superior when redundant between channels, and multiple-channel
communications are inferior to single-channel communications when irrelevant cues are
combined, presumably because irrelevant cues cause interference between them.
This is a key issue that’s been studied—how viewers divide their attention across
multiple channels. Katz, Adoni, and Parness (1977) found that consumers who saw and heard
news recalled slightly more news items immediately following a major broadcast than radio
listeners who simply heard it. Dhawan and Pellegrino (1977) stated “Multiple codes yield higher
retention due to multiple sources of storage retrieval. Both pictures and concrete words are
assumed to have access to both a nonverbal and verbal memory representation. However,
pictures have a higher probability than concrete words of accessing both representations” (p.
340).
According to Miller (1957), “when cues from different modalities . . . are used
simultaneously, they may either facilitate or interfere with each other” (p. 78). Facilitation and
increased effectiveness occurs when cues elicit the same responses simultaneously. On the other
hand, interference and conflict occur when cues elicit incompatible responses, when information
between channels is unrelated, or when contradictory cognitive relationships are present (Reese,
1983). “Many news stories, unfortunately, fall in the latter category, mismatching visuals with
the reporter’s script” (Reese, 1983, p. 4).

WHEN EYES AND EARS COMPETE
19
Typical procedures for newsgathering consist of videotaping an event, interviewing
related subjects, and writing a report (script) from information learned about the event. Brosius
and Donsbach (1996) called this report “text” and said, “In production of news items, picture
material is often available at the outset, and the news text is written to fit the pictures” (p. 181).
A video editor uses the text to assemble a series of video clips together that will be shown when
the news anchor or news reporter reads the script on air in what is known as a voice-over. It is
also common for a reporter to put his or her voice on tape in a narration, along with video and
sound bites; this is called a news package (Rich, 2014). It was stated earlier in the third
assumption of the dual-processing theory that learning will occur when the viewer retains
relevant auditory and visual information in their memory store. At the same time, because
television news represents information in multiple channels, there is the possibility that
interference may occur if the channels are too full. According to Drew and Grimes (1987), there
is the potential to overload the information-processing capabilities of viewers. The researchers
stated that television news has an even greater potential for this happening, because “many of its
stories are voice-overs, that is, the voice track and video track are not necessarily isomorphic”
(Drew & Grimes, 1987, p. 452). In other words, what is being heard does not always match what
is being seen.
To illustrate this, in one study by Drew and Grimes (1987), the researchers produced five
short newscasts containing 14 stories placed in random order. They write:
In one condition (high redundancy) all stories had redundant audio and video. In the
second newscast (medium redundancy) half of the stories were covered by video that did
not match the audio. This condition was included because it represents the situation found
within stories and newscasts: Some of the auditory and visual information is redundant,

WHEN EYES AND EARS COMPETE
20
and some is not. The third condition (low redundancy) had video that did not match audio
in any of the story. (p. 456)
The researchers used one-way analysis of variance (ANOVA) using visual recall as a
dependent measure. Their experiment showed significant differences among the video-only and
the three redundancy conditions. The data indicated that when viewers watch redundant
television news stories they focused most of their attention on the audio while still attending to
the video. When there was low redundancy, thus producing conflict between audio and video,
viewers attended to the video at the expense of the audio (Drew & Grimes, 1987).
In a later study, Grimes (1990) showed subjects three versions of news stories which he
labeled as (a) High-Correspondence, (b) Medium-Correspondence, and (c) No-Correspondence.
The versions had varying degrees of picture-word match. In the high-correspondence version,
when the narration stated, “‘A needle the size of a screwdriver is inserted into the herniated disk
[in the spine],’ the accompanying video showed a needle, the size and shape of a screwdriver,
about to be inserted into the spine of a patient” (p. 18).
In the medium-correspondence version, the video and audio channels were thematically
related but there was no correspondence in the audio and video messages. Grimes (1990) writes:
This was achieved by accompanying a specific reference in the narration, for example,
“A needle the size of a screwdriver is inserted into the herniated disk [in the spine],” with
highly general video that was not semantically correspondent with the reference, for
example, “needle” and “the size of a screwdriver.” In this instance, a patient was shown
being wheeled into surgery as the reporter referred to the surgical tool. (p. 18)
In the no-correspondence version there was no match between the video and audio
channels. Grimes (1990) writes:

WHEN EYES AND EARS COMPETE
21
For instance, as the narrator described how herniated disks are repaired, the viewer saw a
barge loaded with garbage anchored in New York Harbor. When the shot changed, it
showed celebrants of the most recent Chinese New Year, while the narration continued to
discuss surgery. (p. 18)
The latter condition was included to maximize the conflict between the audio and video
channel as a basis of comparing the no-correspondence version to the high-correspondence. The
researcher used the same narration in all three conditions.
The results showed TV viewers split their attention between the video and audio in news
stories more efficiently when there is high correspondence between the visual and auditory
channels compared to when the correspondence is not as high, or when there is no
correspondence. “Efficiently split attention, in this study, means that the highest visual and
factual recognition scores were recorded in the high-correspondence condition. In other words,
attention and memory seem to be positively correlated when correspondence is high” (Grimes,
1990, p. 22). The researcher did not find a statistically significant difference between the factual
memory scores in the high- and medium-correspondence conditions; however, factual
recognition scores were at the lowest level in the no-correspondence story version.
Grimes (1990) also found when there is dissonance in the audio-video channels,
attentional capacity limitation becomes manifest; this was the case in the medium-
correspondence condition. Grimes writes:
Capacity limitation, in this study, is expressed as a decrement in visual memory. The
decrement in visual memory, associated with a decline in visual attention, suggests that
attention and memory are positively correlated. In TV news stories, the narration usually
contains the who, what, when, where, and why of a story. When capacity limits were

WHEN EYES AND EARS COMPETE
22
reached, the attentional shift away from the video of a news story may have helped
maintain coherency in message reception. (p. 22)
Therefore, it appears in conditions of audio-video dissonance, subjects directed more of
their attention to the auditory channel than the visual. Likewise, Gunter (1983) found the visual
channel usually played a lesser role in information acquisition of television news compared to
the auditory channel. Along this line, Drew and Grimes (1987) write:
Applied to television news this would indicate that viewers, under normal circumstances,
direct their attention to the auditory channel, which contains “factual” information, while
leaving some processing capacity for the less semantically specific visual channel. When
there is conflict between the two channels, however, one would expect viewers to focus
on the stimuli that most easily provide meaning. (p. 454)
Similarly, Pezdek and Stevens (1984) looked at the relationship between how children
process video and audio information on television, under matching and mismatching conditions.
They found that when audio did not match the video being shown, memory for the audio
information was reduced more than memory for video information. Therefore, when respondents
had to choose which two incompatible channels to process, they favored the video channel.
Comprehension and recognition of audio information was similar when the presentation was
presented in an audio-only format and audio/video match. Pezdek and Stevens conclude the
“results suggest that in regular television programs, the video information does not interfere with
processing the audio information . . . rather the video material simply appears to be more salient
and more memorable than the audio material” (Pezdek & Stevens, 1984, p. 212). Posner, Nissen,
and Klein (1976) drew a similar conclusion, stating visual input stimuli tends to dominate over
other modalities in perceptual and recall tasks (p. 157). This information is pertinent and relevant

WHEN EYES AND EARS COMPETE
23
to this study because subjects will be tested on information presented in the pictorial channel, as
opposed to the auditory.
In other research, Ketchum and Heath (1962) tested the effectiveness of sound when
audio is presented alone, with relevant pictures, with irrelevant pictures, and with geometric
forms. The researchers concluded:
The data show that instruction through sound linked to images by association only is
followed by a significant increase in factual learning over the next most effective method,
sound alone. The results suggest further that the projection of abstract forms on the
screen distracts attention more than it improves concentration, and that the distraction is
worsened by increased detail, or the incongruity, of an irrelevant picture.(p. 92)
Smith and Magee (1990) looked at the effect of incongruent pictures with words,
hypothesizing that it is easier to understand a picture more rapidly than its corresponding verbal
label. “Data from decision latency, memory, naming latency, and picture-word interference tasks
all suggest that articulatory and semantic information become available at different rates for
pictures and for words” (Smith & Magee, 1990, p. 374). Research shows that the presence of an
incongruent word can delay picture naming, but the time to name a word is “relatively immune
to interference from simultaneous presentation of an incongruent picture” (Smith & Magee,
1990, p. 376). As indicated, television news broadcasts can be guilty of abstract pictures and
incongruent words. Keller and Hawkins (2009) used the example of a television news story
about the health risks to long-distance runners, which included a doctor’s comment about the
warning signs of serious health problems. If all that viewers see is one long shot of a jogger
running towards the camera and then running away, while the script covers material not depicted,
then the video could be seen as abstract and the narration incongruent with the video, therefore

WHEN EYES AND EARS COMPETE
24
decreasing the effectiveness of the story. Once again, this is wallpaper video, which is defined as
video that covers narration but does not enhance the story (Keller & Hawkins, 2009). This
correlates to the principles of dual-processing theory that connections can be made only if
interrelated pictorial and verbal information is in working memory at the same time.
Other scholars have also looked at the multiple channel effect on information retention.
Baggett and Ehrenfeucht (1983) had college students watch an educational movie (or read the
text, or listen to the narration, or look at the visual with the sound turned off, etc.). The
researchers asked them more than 60 questions afterwards about the movie topic. The study
revealed when viewers watching the movie are presented with information from multiple
channels—visual and verbal/auditory—there is no competition for resources. When encoding
information in one medium, one is not hindered from encoding information in the other. The
researchers concluded, therefore, synchronous visual and verbal/auditory input is an efficient
way to present information.
Further illustrating the benefits of redundancy between cues, Brosius and Donsbach
(1996) investigated the influence of text-picture relations on the communication of information
by television news. The study compared the effects of so-called standard pictures (i.e., the
routine footage of events that is constantly used in news bulletins) with pictures that actually
match and illustrate the news text itself. The authors found,
Correspondence of text and pictures enhances the communication of information in
television news. Pictures that either exemplify or describe the news text contribute to the
retention of the news text. In contrast to this, standard news pictures, which suggest
actuality and authenticity but do not directly support the news text, have no positive
effect on retention compared with the performance of listeners hearing the same text. It

WHEN EYES AND EARS COMPETE
25
may be concluded that if no pictures are available to illustrate a text, one may dispense
with pictures altogether, since the resulting information transfer and evaluation of news
items will be no different from a radio bulletin without pictures. . . . Overall, the findings
on redundancy of text and pictures generally agree with those on the effect of news film
[e.g., Drew & Grimes, 1987; Reese, 1984; Son, Reese & Davie, 1987]. Pictures can
enhance the learning of verbal information, but only when the pictures support the
information in the text. (Brosius & Donsbach, 1996, para. 51)
Theories are open to scrutiny; so is the case with the theory cue summation. Broadbent
(1958) presented the single channel theory. Reese (1983) summarized it by attesting, “Humans
can only attend to one source of information at a time. Switching attention from one channel to
another is said to hamper processing performance, since informational inputs from only one
sensory modality at a time are said to have access to the high brain centers” (p. 6). According to
Warsaw (1978), Broadbent’s analysis for audiovisual presentations is clear in that only one audio
or visual channel can be analyzed at any given time. For instance, Warsaw (1978) says if video
consists of printed material superimposed on a moving background visual, a subject can only
attend to one stimulus. Similarly, if narration and music play in the audio simultaneously, only
one is fully analyzed during any instance.
Similarly, Hartman (1961b) expressed concern that increasing the number of cues and/or
channels could impede learning of the information presented. He states:
A common practice among multiple-channel communicators has been to fill the channels,
especially the pictorial, with as much information as possible. The obvious expectation is
for additional communication to result from the additional information. However, the
probability of interference resulting from the additional cues is very high. The hoped-for

WHEN EYES AND EARS COMPETE
26
enhanced communication resulting from a summation of cues occurs only under special
conditions. Most of the added cues in the mass media possess a large number of
extraneous cognitive associations. The possibility that these associations will interfere
with one another is probably greater than that they will facilitate learning. (p. 255)
Likewise, the Travers group in Utah concluded there is no advantage in transmitting
redundant material through multiple channels unless spoken and printed words are presented
simultaneously (Severin, 1967a, p. 234). Irrelevant cues create interference between channels.
According to Severin (1967a), multiple-channel communicators commonly fill the channels with
a lot of information, so the “probability that the additional material will evoke irrelevant cues is
quite high” (p. 234). On the flip side, as stated, if the additional cues are not irrelevant, then they
should not create interference between channels, and thus learning should occur.
Hsia (1968) acknowledged what he called “controversial experimental evidence
regarding the comparative efficiency of channels” (p. 342) and backed up cue summation
principles. Hsia concluded that when considering information in terms of output, recalled
information, error (remembering information not transmitted [Reese, 1983]), “and equivocation
in comparisons among A, V, and AV information processing, data showed that both
communication efficiency and dependability were higher in the AV channel than in the A and V
channels” (Hsia, 1968, p. 342; see also Day & Beach, 1950). In other words, Reese (1983) says,
“Hsia’s study showed the increase in dimensionality from redundant pictorial-verbal information
overcomes the limitations of the single channel model” (p. 6). Hsia (1968) also addressed the
importance of keeping the redundant audio and video components “as close to unity as possible”
(p. 343) to reduce the effects of interference.

WHEN EYES AND EARS COMPETE
27
A number of scholars continued to study the role of video and audio on retention of
television news compared to information presented in a single channel. Findahl (1971) states
that, when viewing a television program, attention is divided between picture and sound, putting
increased demand on one’s ability to comprehend the material. Consistent with cue summation,
Findahl (1971) says, “Sound and picture can disturb and counteract each other but they can also
support and complement one another” (p. 5). Findahl designed an experiment around a TV news
program, with the independent variable being the visual information. Four illustrations of
different degrees of correspondence to five messages were used. Findahl found subjects better
retained illustrations with high correspondence to the message than those illustrations with low
correspondence. He writes, “If we look at which visuals are better remembered on the different
questions, we see that it is just that portion of the message which the visual illustrates that the
respondents best remember, i.e. that content which the visual and the audio have in common”
(1971, p. 11). In essence, the news stories best recalled had pictures that matched the voice track.
The content least remembered was that read by the studio reporter on the screen, called readers,
and items that consisted of only sound.
Studies on multiple-channel redundancy persisted into the turn of the century, but one
study looked to improve the recall measure. Fox (2004) compared what subjects remembered
about television news stories when the audio and video channels were redundant and when they
were dissonant. Fox differed in her study by using signal detection methods. “Signal detection
theory assumes that memory judgments are based on familiarity, and that each item we judge has
a familiarity value” (Fox, 2004, p. 525). According to the theory, subjects set a criterion for the
familiarity of items when making memory judgments to decide whether they recognize them.
When subjects are tested on the recall of news material, “rather than examining just correct

WHEN EYES AND EARS COMPETE
28
recognitions in different conditions, signal detection measures that examine false and accurate
recognitions can determine whether recognition differences are due to improved memory ability
or simply a more liberal decision criterion” (Fox, 2004, p. 525).
Researchers have developed signal detection techniques to examine memory judgments.
Fox (2004), citing MacMillan and Creelman (1991) and Shapiro (1994), writes:
To calculate memory sensitivity and criterion bias, the recognition memory test needs to
include target items that were actually presented, in this case information contained in the
news stories, as well as foil items that were not presented, in this case information that
was not presented in the news stories. The rates of correct recognitions of target items,
called hits, and incorrect recognitions of foil items, called false alarms, are used to
calculate memory sensitivity and memory decision-criterion bias. (pp. 526–527)
Fox (2004) tested whether participants in the redundant audio-video condition would
have more accurate recognitions than participants viewing a dissonant news story. The
researcher used a recognition memory test that contained 15 target items of factual information
in the verbal script and 15 foil items of factual information related to the news story that never
were actually presented during the broadcast. The researcher calculated sensitivity by subtracting
the proportion of false alarms from the proportion of hits converted to a standard score.
The findings revealed the hit rate for accurate recognition was not significantly greater
between the redundant condition and dissonant condition. However, using signal detection
measure of sensitivity, Fox (2004) found a significant memory advantage for the redundant
condition over the dissonance, even though there were not statistically significant differences
when merely examining the factual hit rate.

WHEN EYES AND EARS COMPETE
29
From the myriad of studies done in this area, one can postulate that the pictorial channel
used in concert with the auditory channel plays a great role in aiding the acquisition of
information. Miller (1957) described the eye as an extremely important sensory organ especially
adapted to making a wide variety of accurate discriminations. He suggested it is estimated that
approximately half of all the sensory nerve fibers in the whole body come from the eye.
Eye-tracking equipment has been used in numerous studies to measure subjects’ fixation
pattern when a photo or video is on display and to the time devoted to individual elements. One
such study looked at the reading patterns of different closed-captioning styles among the deaf,
hard of hearing, and viewers who have good hearing. Szarkowska, Krejtz, Klyszejko, and
Wieczorek (2011) studied the eye movement patterns of participants as they read verbatim,
standard, and edited captions (p. 372). The researchers found a higher percentage of time was
spent on reading verbatim captions than on reading standard captions and edited captions. They
reported a significant main effect of caption type on dwell time, known as fixation. A fixation
can be simply defined as a period of time when the eye is stationary long enough to extract and
interpret information (Jacob & Karn, 2003). Fixations happen when a person’s eye sits relatively
still, and this indicates where that person is directing their attention. One hundred milliseconds
has become a widely accepted “rule of thumb” that numerous researchers believe produces
reliable categorization of fixations from raw data (Josephson & Holmes, 2002, p. 541). Fixations
from under 100 ms to more than 500 ms have also been observed (Rayner, 1998). It is proposed
fixation frequency is indicative of an image’s importance; fixation duration is a measure of the
difficulty in processing information; and the pattern of the transition between fixations indicates
how efficiently elements of a display are arranged (Jacob & Karn, 2003).

WHEN EYES AND EARS COMPETE
30
Another relevant eye-tracking metric, saccades are defined as quick jumps of the eye;
their purpose is to bring “a new visual region upon the fovea, the part of the retina where visual
acuity is the greatest and where clear detail can be obtained” (Josephson & Holmes, 2002;
Rayner, 1978). Researchers find for human eyes, one saccade usually lasts about 200–300 ms
(Szarkowska et al., 2011). According to Hembrooke, Feusner, and Gay (2006), fixation and
saccade patterns are “rich and complex . . . and they are typically studied as individual paths or
parts of paths that are isolated” (p. 41). Analysis of scan patterns is usually a visual comparison,
but studies have compared scan patterns statistically (Josephson & Holmes, 2002). Norton and
Stark (1971) define scan path as sequences of fixations and saccades that are repeated.
In one eye-tracking study, Rodrigues et al. (2016) examined the influence of the
graphical layout of TV news on viewers—namely, the ticker, over the shoulder graphic, station
logo, and lower thirds, as well as the placement of the anchor. “In this area, the use of eye
tracking can be very important for the study of TV News” (Rodrigues et al., 2016, p. 67). The
researchers had participants watch TV news through an eye-tracking monitor and then complete
a postsession recall test questionnaire. The redundancy of messages between the ticker and other
graphics was analyzed. The results showed that when there was high redundancy between the
auditory and visual channels, participants recalled more information compared to when there was
no redundancy or medium redundancy. Also, the differences between the no-redundancy and
medium-redundancy conditions was not statistically significant. The findings of Rodrigues et al.
(2016) also corroborate the work of other researchers in that “the graphics found in TV news
distract the participants on a visual level, but cause no distraction with regard to the auditory
channel. However, a more detailed comparison between clean feed version and dirty version

WHEN EYES AND EARS COMPETE
31
showed that viewers recall the messages of the clean feed version more effectively, since the
viewer is not exposed to many graphics and only the anchor is present” (p. 79).
Since many graphics tend to contain text, researchers find one’s reading abilities affects
their television-watching experience. In a study by Cavanaugh (1983), it was suggested
comprehension and retention of television programs was related to reading level and verbal
ability. “Individuals with lower verbal ability (measured by vocabulary skills) may encode less
information than individuals with higher verbal ability . . . the recall of central themes by both
groups of students was strongly related to their reading comprehension scores on the SAT
reading comprehension component” (Lewis & Jackson, 2001, p. 50). This could also help to
explain why research finds the better educated remember more from television.
The present study used pull quote videographics. Verbatim captioning has similarities to
text that appear in pull quote videographics in that pull quote text appears verbatim on the screen
and is similar to the words that appear in official printed documents or written statements.
Sometimes, news anchors and reporters read the text verbatim, creating a high-redundant video-
audio condition; other times they verbally summarize what they see in the pull quote graphic,
creating a medium-redundant video-audio condition. Like Szarkowska et al. (2011), Wang et al.
(2007) also examined the effects of near-verbatim captioning versus edited captioning on
comprehension. Results from the experiment showed little difference between the two text
formats in regards to comprehension scores.
Research Questions
The present study builds upon the prior work of Szarkowska et al. (2011), which
evaluated eye movement characteristics of deaf, hard of hearing, and hearing viewers shown
three captioning styles of verbatim, standard, and edited. The present study’s approach differs in

WHEN EYES AND EARS COMPETE
32
that the language of the experiment is English and not Polish, none of the participants are hard of
hearing, and the graphic styles were pull quotes and not closed captions. The present study also
built on Drew and Grimes’s (1987) study, Reese’s (1983) experiment, and Fox’s (2004)
research; rather than viewing high-redundant and low-redundant audio and video, subjects
viewed text-based videographics. Unlike previous related studies, the present sought to use eye
tracking to capture visually how subjects viewed pull quote graphics when the news reporter’s
narration and text in the graphic were redundant and when the two were dissonant.
Based on previous research, the present study defined the following terms as such:
(a) Auditory channel—The audible recording in the reporter’s script of the news story that
research subjects can hear.
(b) Visual channel—The visuals included in the news story, namely the pull quote full-screen
graphics that subjects see; also may be referred to as pictorial channel
(c) High redundancy, high-redundant—This is a story condition in which the words in the
reporter’s script that subjects hear match verbatim the text in the pull quote graphics—that is,
ABCDEF = ABCDEF
(d) Medium redundancy, medium-redundant—This is a story condition in which words in the
reporter’s script that subjects hear match some of the words in the pull quote graphics, and at
other times the reporter’s script paraphrases portions of the text in the pull quote—that is,
BACDHJ =ABCDEF
e) Low redundancy, low-redundant—This is a story condition in which the words in the
reporter’s script that subjects hear don’t match any of the words in the pull quote graphics—
that is, GHIJKL = ABCDEF
The present study sought to provide answers to the following research questions:

WHEN EYES AND EARS COMPETE
33
RQ1: What impact do high redundancy, medium redundancy, and low redundancy of pull quote
videographics have on story recall?
RQ2: What impact do high redundancy, medium redundancy, and low redundancy of pull quote
videographics have on memory sensitivity?
RQ3: In high-redundancy, medium-redundancy, and low-redundancy pull quote videographics
conditions, which channel, between visual and auditory, do subjects say they prefer for
information acquisition?
RQ4: Will gaze patterns for the low-redundancy condition indicate increased searching behavior
over the medium- and high-redundancy conditions, as indicated by the fixation density
map (FDM) (see Table 6)?

WHEN EYES AND EARS COMPETE
34
CHAPTER THREE
METHODOLOGY
Design
Consistent with Reese’s (1983) experiment, the current experiment employed a 3 x 1
design. The single factor was the level of redundancy between the auditory channel and pictorial
channel. Manipulating this factor created three news messages: (1) a high-redundant pull quote
videographic, (2) a medium-redundant pull quote videographic, and (3) a low-redundant pull
quote videographic. A sample of 87 students was randomly assigned to the three conditions
(high: n = 28; medium: n = 33; low: n = 26).
Participants
Data for this study were gathered in the fall of 2016. Initially, 107 subjects—namely,
undergraduate students at a Western university, older than 18 years of age—participated in the
study, which was approved by an Institutional Review Board for Human Subjects. Subjects
volunteered to participate in the study after receiving a brief synopsis of the research but not
enough information to give away the exact research area of interest. Most of the subjects
received extra credit from their professors for participating in the study. Those who did not were
namely individuals who were randomly asked to participate in the study from research assistants
and the primary investigators. Regardless, all 107 subjects were entered into a drawing to receive
a $25 cash prize after completion of the data collection. There were eight cash prizes randomly
given out using a random number generator. Of the initial 107 subjects, 20 subjects were
excluded from the study; 18 of those included subjects whose gaze the eye tracker did not
register at least 75% of the time. One included eye-tracking data that were inadvertently recorded

WHEN EYES AND EARS COMPETE
35
over during data collection. One other included a corrupt eye-tracking data file from one subject;
it was unexplainably preventing the output of gaze point data from the iMotions software. This
removal of data resulted in 87 subjects overall, 72 women (83%) and 15 men (17%). All of the
participants were communications students.
Upon entering the eye-tracking lab, subjects were briefed about the study procedure and
informed they would be participating in a broadcast television news eye-tracking study. Subjects
were given the informed consent form, asked to read it over, and sign it if they desired to go
forward with participation in the study
Subjects were divided into three groups. Each group received a different news treatment.
An online random number generator was used to determine which one of the three conditions
subjects were assigned.
Materials
Subjects in each group watched a simulated news package that was 1 minute 20 seconds.
To control for topic familiarity, the news story was based off a real story, but some of the text,
video, and graphics were changed to create a unique story. A journalism faculty member and
television news professional viewed the three story conditions (high-redundant, medium-
redundant, low-redundant), and the overall consensus was the stories were realistic enough to be
believable and to be in a commercial newscast. The simulated news package was created so
subjects would have had no prior exposure to the story. The video clips were the same for all
three conditions and appeared in the same order with the same length of time for each clip. The
audio was altered when the five pull quote graphics were shown to simulate high-redundant,
medium-redundant, and low-redundant video and audio conditions. Though parts of the audio
differed between the three conditions, the script word count remained the same (n = 266) for all

WHEN EYES AND EARS COMPETE
36
conditions. The narration on the package was recorded by an unfamiliar voice to the participants
with a neutral American accent by an individual with broadcast news experience. The news
packages were created using Adobe Premiere version 15.0 nonlinear video editing software; the
three experimental conditions were manipulated and created using the editing software.
News package condition 1 contained five treatment pull quote graphics with high
redundancy between the video and audio channels. In other words, the narration of the news
reporter matched verbatim the words that appeared on the graphic. News package condition 2
was similar to condition 1 but with medium-redundant video and audio. The narration of the
news reporter did not match all of the words verbatim on the pull quote graphic. News package
condition 3 was similar to conditions 1 and 2 but with low-redundant video and audio. The
narration of the reporter was not verbatim with the graphic, and in fact was significantly
different. Though each news package was 1 minute 20 seconds long, the researchers were only
interested in how the participants viewed and recalled the pull quote graphic stimulus of the
story. Therefore, lookzones were made for each pull quote graphic. John (2015) defines
lookzones as areas of interest researchers mark for further analysis; they are invisible to the
subjects.
Eye Movement Recording
Participants’ eye movements were recorded in a university eye-tracking lab with an
Applied Science Laboratories (ASL) D6HS desktop high-speed eye-tracking system with a
sampling rate of 120 Hz. The system provided gaze point data using iMotions software. A digital
recording of this video was created as a permanent record. Recorded data included time-eye
position coordinates and pupil diameter. Eye position coordinates correlated to specific areas on
the screen surface being viewed. Head tracking was handled using facial recognition software

WHEN EYES AND EARS COMPETE
37
paired with the D6HS internal camera. Unlike older eye-tracking models, which required
subjects to wear a headgear, the current experiment utilized desk-mounted optics, which required
no physical contact between the subject and the device for tracking.
The researcher used a 24-inch Dell UltraSharp monitor configured to 1920 x 1200
resolution. The video played in the stimulus terminal was formatted in high definition at 1920 x
1080, but the pull quote graphics did not interact with the outer 100 pixels horizontal and 200
pixels vertical on the monitor; this avoided the experimental area of interest in the news package
reaching the edge of the trackable range and causing aberrations.
Recall Testing Instrument
Consistent with Fox’s (2004) research, the testing instrument included a recognition
memory test that contained 11 target items of factual information that was presented in the
television news stories and 11 foil items that were not presented in the stories. All of the target
items were presented in the pull quote graphics of the stories. This differs from Fox (2004), who
tested subjects on information presented in the verbal messages of the stories. Because the scope
of the present study was to evaluate the effectiveness of pull quote graphics in varying
redundancy conditions, it was necessary that subjects be tested on the graphical portions of the
news stories. In addition, the present research created three separate survey sheets that
rearranged the order of the target and foil items in the recall test. This was to reduce the
possibility of respondent fatigue affecting the results of the test. Respondent fatigue happens
when a subject’s engagement with a survey decreases in the latter part of the questionnaire
(Hess, Hensher, & Daly, 2012). Creating different survey conditions would help to eliminate the
factor that subjects were answering specific target or foil items a certain way due to fatigue.

WHEN EYES AND EARS COMPETE
38
Procedure
Each participant was asked to come to the Brigham Young University School of
Communications Eye-tracking Center at an agreed date and time. As subjects arrived at the lab,
each was briefed about the study procedure and informed they would be participating in a
broadcast television news eye-tracking study. It was decided not to reveal too much information
about the study because the researchers did not want that to have any effect on the way the
participants viewed their assigned news story. For instance, if subjects knew the researchers were
only analyzing the pull quote stimulus of the video, then subjects may have paid closer attention
to the pull quotes when the graphics appeared in the packages than they otherwise would have
with no prior knowledge of the research area of interest.
Each subject was randomly assigned to watch only one of the three treatment stories.
Subjects were tested individually. They were seated comfortably in a chair positioned in front of
24-inch Dell UltraSharp PC monitor at a viewing distance between 22 and 24 inches. A
calibration was performed to ensure the accuracy of where the participants were looking at the
screen. To do this, an infrared camera internal to the D6HS was used to locate the subject’s right
eye and verify pupillary and corneal reflections. If reflections were confirmed, subjects were
asked to keep their heads still and look at the PC monitor. The calibration required participants
look on the screen at nine dot targets, one at a time, consisting of three rows and three columns.
Once the proper calibration was achieved, the subjects were tracked using the iMotions version
6.1 software. Each subject watched his or her randomly assigned news package.
Immediately following the viewing of the clip, participants took a survey. Participants
were asked demographical questions, questions related to their news-viewing habits, and
questions to test recall and memory sensitivity. Recall and memory sensitivity questions tested

WHEN EYES AND EARS COMPETE
39
information that was shown in the video channel. Subjects also indicated how sure they felt
about each response by marking confidence scales for each recall question. This measure of
retention is consistent with Reese’s (1983) research and Fox’s (2004) experiment on the effects
of between-channel redundancy on television news learning. Also consistent with Reese’s (1983)
methodology but with a slight modification, the subjects in this experiment were asked to rate
their prior knowledge of the story topic on a five-point Likert scale that ranged from not familiar
to very familiar. Reese (1983) had subjects check a percentage scale, ranging from 0%, meaning
they had no prior knowledge at all, to 100%, meaning they had great knowledge of the news
story topic. For each news package, recall was measured by the number of correct answers, and
error was measured by the number of incorrect answers.
Upon completion of the recall test, each subject was informed that their name would be
entered into a drawing for a $25 cash prize, and the drawing would take place immediately
following collection of the data. At that time, subjects were debriefed. They were told the
researchers did not fully disclose the exact elements of the news stories being studied so as not to
alter the way the subjects watched the stories. Subjects were then told the exact purpose of the
study and if they wished to withdraw their data from the study that they could, and they were
asked not to share the intent of the study with others because doing so could compromise the
reliability of the results. Subjects were thanked for their participation, and they were free to
leave. The time from entry into the eye-tracking lab to exit was approximately 10 minutes.
Pretest
Consistent with Fox’s methodology (2004) and suggested by Shapiro (1994), the testing
instrument was tested for floor and ceiling effects. The first nine subjects (10% of the sample)
were part of the pretest phase. The pretest of the recall-memory test instrument found no values

WHEN EYES AND EARS COMPETE
40
of zero for either correct or false alarm rates. In other words, none of the subjects answered all of
either the target or false items correctly. The average correct recognition rate was 5.9 and the
average false recognition rate was 3. Since no floor or ceiling effects were found, their data were
included in the research. If floor or ceiling effects had been determined, the data collected from
the nine subjects would have been thrown out and the recall test questions rewritten to prevent
such from happening.
Measures
There were several dependent variables examined in this study:
1. Recall
2. Memory sensitivity
3. Audio/video attention
4. Gaze pattern/fixation density
5. Fixation duration within lookzone
Recall
Based on results from previous studies, it was anticipated subjects would be able to
better recall target items from pull quotes with high redundancy between the video and audio
channels compared to medium-redundant and low-redundant conditions. This was because a
high-redundant condition should cause less interference than conditions lacking redundancy.
Memory Sensitivity
The use of signal-detection measures of sensitivity was important to this study because
even if the hit rate for accurate recognitions was not statistically significant for subjects who
viewed the high-redundant conditions compared to those who viewed the medium- or low-
redundant stories, signal detection may have revealed a significant difference in memory

WHEN EYES AND EARS COMPETE
41
sensitivity as a measure of memory strength. Fox (2004) found this to be the case in a study and
recommended communication researchers incorporate signal detection analysis into their design
when studying memories of media messages.
Audio/Video attention
When subjects view the pull quotes under test conditions of high-, medium-, or low-
redundancy, they may find themselves either paying closer attention to the video, audio, or both
auditory and pictorial channels equally. Prior research has produced contradicting results.
Gaze Pattern/Fixation Density
Examining the gaze pattern of each subject will give a visual representation of the pattern
of fixations when the high-redundant pull quote graphics, medium-redundant graphics, and the
low-redundant graphics are shown. The recorded gaze patterns will also produce a fixation
density map (FDM), which show fixation points tightly grouped in clusters (John, 2015). “The
magnitudes within the FDM represent the amount of overt attention at certain locations”
(Engelke et al., 2013, p. 2) and “can be indicative of search efficiency—where greater density
indicates effective searching, and lower density indicates unstructured or inefficient searching”
(John, 2015, p. 50).
The FDM is also referred to as a hot spot map, which shows aggregate eye fixations of a
screen. It provides a summary of the gaze positions received from multiple eye-tracking sessions
and subjects based on the data and creates a hot spot map. The map is then superimposed on the
photo or video used during testing (Manhartsberger, & Zellhofer, 2005; iMotions, 2015).
It was anticipated high-redundant graphics would result in more linear and predictable
gaze patterns, because participants would more easily follow the words in the pull quote graphic
on the screen as the reporter read the words aloud. It was believed the gaze pattern would be

WHEN EYES AND EARS COMPETE
42
more sporadic and unstructured for medium-redundant and low-redundant pull quotes because
subjects would have more difficulty locating the audible words of the reporter; this in turn would
cause interference and lead to lower recall scores.
Fixation Duration within Lookzone
Uttal and Smith (1968) found a person does not obtain new information during a saccade,
because the eyes move so rapidly across an image that they would only perceive a blur. “Fixation
duration and fixation count can both be treated as indices of difficulty with information
processing” (Szarkowska, 2011, p. 368). The more time a person spends fixating on a point
implies the individual is spending more time interpreting the stimulus (Goldberg & Kotval, 1999,
p. 643). For the present study, this could enable inferences about graphic-reading or text-
searching strategies.
Analysis
Statistical analyses were done using IBM SPSS v24 predictive analytics software.
Statistical power calculations were executed using G*Power 3.1.5 (Faul, Erdfelder, Buchner, &
Lang, 2009; Faul, Erdfelder, Lang, & Buchner, 2007). For ANOVA analyses, effect size
standards are small (f2 = .10), medium (f2 = .25), and large (f2 = .40). Achieved power for the
one-way ANOVAs was excellent for the detection of large effects (.92), adequate for the
detection of medium effects (.52), and poor for the detection of small effects (.12).
Whenever concern exists over a small sample size, so does type 2 error; this is the chance
of there being a lack of enough power to detect significant effects. According to John (2015),
“capturing eye-tracking data is a laborious process, and, as such, sample sizes in eye-tracking
literature tend to be smaller than those of comparable non-eye-tracking studies” (pp. 52–53). The
current study utilized an adequate sample according to eye-tracking standards and used the

WHEN EYES AND EARS COMPETE
43
significance threshold of p < .05 for analysis. In addition the current study used Cohen’s d to
measure effect size for ANOVA. An online effect size calculator provided by the University of
Colorado–Colorado Springs was used to make the calculations (Becker, 2000).

WHEN EYES AND EARS COMPETE
44
CHAPTER FOUR
RESULTS
The main objective of the current study was to determine if news stories presented with
high levels of redundancy between the auditory and pictorial channels helped viewers better
recall information from the story than when the audio and video are less redundant.
RQ1 asked what impact would high redundancy, medium redundancy, and low
redundancy of pull quote videographics have on story recall. Recall was measured by calculating
the mean hit rate of the target items. In the present study, due to the inadvertent duplication of
one foil item and the resulting deletion of one target item on one of the three survey versions in
the recognition memory test, the target item, “Levi Johnson purchased two guns,” and one of the
duplicated foil items, “Levi Johnson bought four guns and ammo illegally,” were removed from
all data sets. This resulted in the examination of 10 target items and 10 foil items. The removal of
the target and foil item is consistent with a similar procedure performed by Shapiro and Fox
(2002) when one target item was inadvertently reworded.
A one-way ANOVA correlation was run to determine whether there was statistical
significance between the mean hit rate between the three story conditions (see Table 2). The data
revealed there was statistical significance between two of the groups, but not all three, as
determined by one-way ANOVA (F(2, 84) = 3.317, p = .041, d = .63). A Bonferroni post hoc
analysis revealed a statistically significant difference between the mean hit rate of the high-
redundant story condition and low-redundant story condition. Subjects better recalled target
information in the high-redundant condition (M = .7101, SD = .1499) than those in the low-
redundant condition (M = .6154, SD = .1515). It should be noted the mean hit rate was also

WHEN EYES AND EARS COMPETE
45
higher for the high-redundant condition (M = .7101, SD = .1499) compared to the medium-
redundant condition (M = .6424, SD = .1251), but the difference was not statistically significant
(see Table 1 ).
RQ2 asked about the impact of high redundancy, medium redundancy, and low
redundancy of pull quote videographics on memory sensitivity. Sensitivity is calculated by
“subtracting the proportion of false alarms, converted to a standard score, from the proportion of
hits, also converted to a standard score” (Fox, 2004, p. 533). Fox (2004) states the larger the
sensitivity values, denoted by d’, the more sensitive the subject is at discriminating between
target and foil items. “When the hit rate equals the false alarm rate, d’ equals zero, in which case
performance is at chance and the judge is not able to discriminate” (Fox, 2004, p. 533). In
calculating d’, one has to examine in the data set if any proportion of the hits = 1, or if any
proportion of false alarms (pfa) = 0. When this happens, MacMillan and Creelman (1991)
recommend converting the proportions of 1 to 1 − 1/(2N) and the proportions of 0 to 1/(2N). A
proportion of 0 was found in two of the false alarm rates, with N denoting the number of target
items for hits and the number of foil items for false alarms. Only two pfa values had to be
adjusted using this procedure.
The results of the data revealed there was statistical significance between two of the
groups (see Table 4), but not all three, as determined by one-way ANOVA (F(2, 84) = 5.983, p
= .004, d = -.93). A Bonferroni post hoc analysis revealed subjects who viewed the high-
redundant story condition were significantly more sensitive (M = .0545, SD = .0993) than
subjects who viewed the low-redundant story condition (M = -.0520, SD = .1276). It should also
be noted that the mean sensitivity level was also higher for the high-redundant condition (M

WHEN EYES AND EARS COMPETE
46
= .0545, SD = .0993) compared to the medium-redundant condition (M = -.0053, SD = .1132),
but the difference was not statistically significant, though close (p = .131; see Table 3).
RQ3 asked in high-redundancy, medium-redundancy, and low-redundancy pull quote
videographics conditions, which channel, between visual and auditory, do subjects say they
prefer for information acquisition. Consistent with Reese (1983), a survey question asked
subjects to rate the importance of the narration (auditory) versus the pull quote graphic (pictorial)
to their recollection of story. Subjects input their response on a five-point Likert scale with the
following values: (1) Not important, (2) Slightly important, (3) Moderately important, (4)
Important, (5) Very important. An analysis comparing the means of the responses found subjects
consistently rated the narration as being of higher importance to their recollection of the news
story in all three conditions. In the low redundancy story condition, subjects listed the audio (M
= 3.58, SD = 1.065) as being between moderately important and important to their recollection of
the story and the pull quote graphic (M = 2.77, SD = 1.070) between slightly and moderately
important. In the medium redundancy story condition, subjects listed the audio (M = 4.22, SD =
1.070) as being important to their recollection of the story and the pull quote graphic (M = 2.97,
SD = 1.177) moderately important. The high redundancy story condition achieved similar results
as the medium redundancy story condition, with subjects stating the audio (M = 4.29, SD = .81)
was important to the story recollection and the pull quote graphic (M = 3.07, SD = 3.07) was
moderately important (see Table 5).
Taking a closer look at the results, a one-way ANOVA with Bonferroni post hoc analysis
was run to determine if there were main effects between the mean audio scores of the three
redundancy conditions. The one-way ANOVA (F(2, 83) = 4.217, p = 0.018, d = -.60) revealed
there was statistical significance between the low-redundancy (M = 3.58, SD = 1.065) and

WHEN EYES AND EARS COMPETE
47
medium-redundancy (M = 4.22, SD = 1.070) audio scores and between the low-redundancy (M =
3.58, SD = 1.065) and high-redundancy (M = 4.29, SD = .81) conditions. This reveals that
subjects rated the auditory channel increasingly important to their recall of facts in the story as
the level of redundancy increased (see Table 5).
In contrast, examining data of the pull quote graphic in the pictorial channel, a one-way
ANOVA with Bonferroni post hoc analysis did not reveal any statistically significant results. So
even though there was an upward trend in subjects reporting the graphic helped with story recall
as the level of redundancy increased, the model’s results were not significant.
Since it was evident subjects rated the auditory channel important to the recollection of
the news story, the current study sought to determine which channel, between the auditory and
the pictorial, subjects said they attended to more when presented with information in a high-,
medium-, or low-redundant audio-video format. To calculate this, a Pearson product-moment
correlation was run to determine the relationship between the two channels in each condition. In
the low-redundancy story, there was statistically significant moderate negative correlation
between the two variables, r = -.405, n = 26, p = .04, meaning that as attention to one channel
increased, attention to the other channel decreased. This makes sense given the incongruous state
of the audio and graphic, and, in the current study, subjects rated the auditory channel (M = 3.58)
to be more helpful than the pictorial (M = 2.77) for information acquisition. In the medium-
redundancy condition, there was statistically significant weak negative correlation between the
variables, r = -.379, n = 26, p = .033, indicating once again that subjects found it difficult to
attend to both incongruent channels, and had to prioritize one over the other. In this case,
subjects reported that the reporter’s narration (M = 4.22) was more helpful than the pull quote
graphic (M = 2.97). In the high-redundancy condition, the model achieved nonsignificant results

WHEN EYES AND EARS COMPETE
48
between the two variables, implying that, when both audio and graphic were congruent, subjects
attended to both the audio and the visual and, therefore determined each channel to be of equal
helpfulness.
RQ4 asked if the gaze patterns of subjects who viewed the lower redundancy condition
would show that they were searching the screen more than subjects who watched the medium-
redundant and high-redundant stories, as indicated by the FDM. To identify similarities and
differences between the three groups, the current study visually compared hot spot maps of gaze
patterns side by side. Video of the fixation density map was downloaded for each condition,
imported into Adobe Premiere editing software 15.3 and placed next to each other on the screen
(see Figure 2). The starting point was synced of each of the five pull quote graphics from the
three redundancy conditions. When all three video conditions were played simultaneously, the
researchers could better compare and contrast the screen-viewing behavior of the subjects as
displayed on the fixation density maps. Fixation points were shown on the map colored lime
green. Areas that appeared more orange and red indicated higher concentration of fixations.
Overall the results showed subjects who viewed the high-redundant condition appeared to
have a greater tendency to fixate on similar words in the first four pull quote graphics than
subjects in the medium- and low-redundant conditions. Therefore, the gaze patterns of high-
redundant subjects appeared to indicate more effective searching behavior than subjects in the
other test conditions. The larger hot spots superimposed on the pull quotes in the high-redundant
condition appeared to correlate with the spoken words in the auditory channel. This was
consistent across all five pull quote graphics in the high-redundant story.
The hot spots for subjects in both the medium redundancy and low redundancy
conditions appeared to be more spread out across the first four pull quote graphics, as opposed to

WHEN EYES AND EARS COMPETE
49
the fixation densities in the high-redundant condition, where fixations appeared more tightly
clustered. One phenomenon that unfolded showed that subjects in these two conditions appeared
to scan the text in the first two lines of the first two pull quotes in the stories. In these instances,
the hot spots were more tightly grouped the first two seconds the graphics appeared. At three
seconds, the hot spots appeared more diffused. On the third pull quote shown in the stories, after
less than two seconds the fixation densities were diffused across the graphic. The same episode
unfolded on the fourth pull quote in the low-redundant and medium-redundant stories.
As explained earlier, the magnitudes with the FDM indicate how much attention is being
directed at certain locations on the screen, with greater densities indicating effective searching,
and lower densities indicating unstructured or inefficient searching. In the current study, the
FDM could therefore reveal that subjects who viewed the high-redundant story exhibited more
effective searching behavior of the text in the pull quote graphics than subjects in the other
conditions. Likewise, the FDM could also indicate that subjects in the low-redundant and
medium-redundant conditions attempted to follow the pattern of the text on the screen from left
to right and top to bottom as if they were reading, but because the auditory channel and the
pictorial channel were not isomorphic, the subjects’ search became more unstructured. By the
third pull quote in the low and medium conditions, the unstructured searching manifested itself
even faster, possibly as subjects realized the text did not follow the narration verbatim.
Pull quote graphic 5 was also compared visually between the three conditions. The
graphic contained only five words and appeared for two seconds, so gaze pattern behavior
appeared relatively uniform amongst subjects.
In addition to examining the gaze pattern, the researchers also compared the fixation
duration within each lookzone in the three story conditions. The fixation duration between the

WHEN EYES AND EARS COMPETE
50
high-, medium-, and low-redundant conditions did not reveal any statistically significant results.
One explanation could be that since the pull quote graphics encapsulated the entire lookzones,
filled most of the screen, and really were the main stimulus, subjects’ eyes remained relatively
fixated within the lookzones.

WHEN EYES AND EARS COMPETE
51
CHAPTER FIVE
DISCUSSION
The present study sought to use several different measures to determine if a television
news story presented with high redundancy between the reporter’s narration and the
videographic that appeared on the screen helped viewers better remember the message than in
conditions of audio-video dissonance. While previous studies have merely utilized recall tests
(Reese, 1983; Severin, 1967a; Katz, Adoni, & Parness, 1977; Dhawan & Pellegrino, 1977; Drew
& Grimes, 1987; Grimes, 1990; Pezdek & Stevens, 1984; Baggett & Ehrenfeucht; Brosius &
Donsbach; Findahl, 1971), the present study also used signal detection analysis to determine
memory strength (Fox, 2004), as well as eye-tracking metrics to get a clear picture of how news
viewers search the screen in varying conditions of redundancy—high, medium, and low. By
comparing and contrasting results, the researcher was able to say with greater confidence
whether one condition proved to be more superior, in terms of the viewers’ ability to remember
the message.
The topic of all three news stories revolved around a drive-by shooting in a Charlotte,
North Carolina, neighborhood that left two people dead. While the story was 1 minute 20
seconds long, the researchers were only interested in how the subjects viewed and recalled the
sections that contained the five pull quote videographics. In the high-redundancy condition,
every word of the reporter’s narration that subjects heard was presented in the pull quote
graphics verbatim. For instance, when the reporter voice track stated, “Documents say detective
Morales was able to identify Johnson in a video recording . . . in a Concord Mills store . . . as
the purchaser of the two guns and ammunition four days earlier”; the pull quote graphic

WHEN EYES AND EARS COMPETE
52
displayed those exact words. In contrast, in the medium redundancy condition, the pull graphic
remained the same, but the reporter rephrased it by saying, “Documents say detective Morales
traced those bullets to a store in Concord Mills that had video of Levi Johnson buying two guns
and ammunition four days earlier.” In the low-redundancy condition, the reporter’s narration was
completely different from the pull quote graphic. The narration stated, “A Charlotte-
Mecklenburg police department SWAT team and the violence criminal apprehension team
arrested Johnson on Cottonwood Street early Friday.” In other words, the subjects’ eyes were
competing with their ears, a condition that causes interference, and in the case of this study,
distraction, as stated by several subjects in unsolicited comments written on their post eye
tracking questionnaire. While the low-redundancy pull quote condition is not as common in
newscasts, it happens occasionally, especially in cases where a reporter has to read his or her
story live, instead of pretaped, and a video operator has to try to roll the video or graphic
simultaneously. If the video or graphic is not rolled at the precise time, the reporter’s audio gets
out of sync with the video, causing a low-redundancy condition. In the present study, the low-
redundancy condition was also included to see if there would be an effect between it and its polar
opposite, the high-redundancy condition, as other studies have done (Drew & Grimes, 1987;
Grimes, 1990; Severin, 1967a).
Recall
While similar research on television news stories has looked for effects between high-,
medium-, and low-redundancy conditions, it appears that many of the studies that the researchers
examined while conducting this study tested recall on the auditory channel of the stories (Katz,
Adoni, & Parness, 1977; Pezdek & Stevens, 1984; Reese, 1983). The present study tested
subjects on the visual element instead because pull quotes are text passages pulled from real

WHEN EYES AND EARS COMPETE
53
documents or quotes. Therefore, the text has to remain the same when presented to viewers;
changing the text would result in a false and inaccurate report. In the commercial television news
industry, the reporter must decide whether to read the pull quote as it is written, rephrase it,
summarize the graphic, or even leave it up to television viewers to read the graphic themselves,
while the reporter discusses other details. Since producers and reporters can’t change the text
when they create a pull quote graphic, in this study the pull quote text was kept as a control
variable and the narration was manipulated.
The results of the study showed with statistical significance that viewers were better able
to recall messages from the pull quote graphics when the news story was presented with high
redundancy compared to low redundancy. This result supports the assumptions of dual-
processing theory, that learning occurs when a learner retains relevant information from their
auditory and visual working memory, and when the verbal and pictorial information is in the
working memory at the same time (Mayer & Moreno, 1998). Clearly, in the high-redundancy
condition, the verbal and pictorial elements of the news story were presented at the same time,
and thus would have been in the subjects’ working memory at the same time. This would have
been the opposite in the low-redundancy condition, where the auditory and visual cues elicited
incompatible responses and therefore produced conflict and interference, as the theory of cue
summation theorized would happen (Severin, 1967b). In fact, several subjects who viewed the
low-redundant story expressed this in comments written on the borders of their questionnaire.
For example, one subject stated they found listening to the narration while trying to read
completely different words in the pull quote graphic was “distracting with both.” Likewise,
another subject wrote, “The pull quote distracted me from hearing anything in the newscast.”
Similarly, two other low-redundant subjects stated they stopped listening to the reporter’s

WHEN EYES AND EARS COMPETE
54
narration and just read the pull quote instead, whiles others stated they did just the opposite—
stopped reading the pull quote and just listened to the narration.
This brings up an important observation about conducting eye-tracking studies. The
primary investigator in the current study questions whether the briefing subjects received before
they watched the news story that their eye movements on the screen were being tracked, altered
the way in which they watched the story. A couple subjects self-disclosed at the end of their
debrief that they knew the researcher was tracking their eyes, so they tried to pay closer attention
to where their eyes were looking on the screen.
As stated, the results of the study did not achieve statistical significance between all three
redundancy conditions. Perhaps the narration did not deviate from the text in the graphic enough
to cause a significant difference in recall rate. A future study could adjust the level of
redundancy further and examine how different the narration needs to be from the pull quote
graphic to cause a reduction in recall with statistical significance.
Memory Sensitivity
The present study used memory sensitivity as another measure to determine if one story
redundancy condition proved superior over another in terms of the viewers’ ability to remember
facts in the story. Sensitivity is a measure of memory strength—how easily a person can
distinguish between actual memories, facts that actually appeared in the news story, and false
memories, information that did not appear in the report (Fox, 2004). The higher the d’ value, the
greater the sensitivity will be (Shapiro & Fox, 2002).
As was seen in the RQ1 that looked at recall, the test for memory sensitivity in RQ2
resulted in the highest d’ values for the high-redundant story condition and the lowest d’ value
for the low-redundant story. The difference in values was found to be statistically significant

WHEN EYES AND EARS COMPETE
55
between the high and low conditions. This tells one that there was a difference in memory
performance when audio and video messages were redundant or dissonant. The measure of
memory sensitivity discerned a significant memory advantage for the high-redundant condition
over the low. But as was also seen in the simple test of recall, in this case even though the d’
values were higher for the high-redundant condition than the medium-redundant, and the
medium-redundant d’ was higher than the low-redundant d’, there were not statistically
significant differences between the high- and medium-redundancy values.
Audio Versus Narration
Previous research has drawn two conclusions, when conditions are redundant and
nonredundant, of whether subjects attend more to the auditory channel or the pictorial (Grimes,
1990; Gunter, 1983; Pezdek & Stevens, 1984; Posner, Nissen, & Klein, 1976; Reese, 1983). In
the current study, subjects in the low- and medium-redundant conditions found the narration in
the auditory channel more helpful to their recollection of the facts in the story than the pull quote
graphics shown. This supports Grimes’ (1990) and Gunter’s (1983) findings that in conditions
of nonredundancy between audio and video, subjects turned their attention to the audio, or the
stimuli that most easily provided the most meaning. The low-redundancy condition in this study
created the maximum amount of video-audio conflict, similar to Grimes’ (1990) study. So in that
condition, if subjects stopped trying to read the pull quote graphic (like some told the researchers
following the survey), and instead listened to the narration, then they would have missed key
information presented in the pull quote graphic. That could also help explain why recall and
memory sensitivity values were lowest in the low-redundancy condition.
In contrast, researchers have also concluded when there is low redundancy, television
viewers pay more attention to the video (Pezdek & Stevens, 1984; Posner, Nissen, & Klein,

WHEN EYES AND EARS COMPETE
56
1976). In the current study, a number of subjects in the low redundancy condition achieved high
recall and memory sensitivity scores similar to subjects who watched the high-redundant news
story. This phenomenon would also support the findings of research that posits the video
dominates audio in conditions of dissonance between the two channels. It has been noted that
several subjects self-reported they stopped listening to the audio and just read the pull quote
graphics in the low redundancy condition. This may help to explain why some low-redundant
recall and memory sensitivity scores were high. A study discussed earlier also found that video
appears to be more memorable than audio material (Pezdek & Stevens, 1984) and that visual
stimuli dominate other modalities in recall tasks (Posner, Nissen, & Klein, 1976). So perhaps,
even though the narration did not match the words in the pull quote in the low condition, the
visual was powerful and memorable enough to recall. At the same time, if these subjects were
tested on information presented in the narration, recall and memory sensitivity scores could have
suffered. But as stated, one has to wonder if the mere fact the subjects knew the researchers were
tracking their eye movements caused them to read the pull quote graphic instead of listening to
the audio in the dissonant conditions.
Also, in the present study subjects did not say with statistical significance in the high
redundancy condition that they preferred the auditory channel more than the pictorial to aid
recall. This could be because both channels were acting in concert. Therefore, subjects were not
left to choose whether to attend to the auditory channel or pictorial. This supports results from
Grimes’s (1990) study that showed that television viewers split their attention more efficiently
between the video and audio in high-redundant stories compared to medium- and low-redundant.
Therefore, one would expect the auditory and pictorial channel values not to show a difference
that was statistically significant in the high-redundancy condition.

WHEN EYES AND EARS COMPETE
57
Gaze Pattern
It has been noted the present study used eye tracking to examine the areas of stimulus
subjects directed their attention during the various story conditions. The gaze pattern revealed
that the path of the fixation densities appeared to be more predictable in the high-redundant
condition than in the low- and medium-redundant. The pattern was predictable in the sense that
the fixation densities tended to follow the sequential arrangement of the words on the pull quote
graphics as the reporter spoke them in the narration. This was not the case for the low- and
medium-redundant conditions. The fixation densities had the tendency to appear small, more
sporadic, and diffused when superimposed on the pull quotes. Overall, the FDM provided a
resourceful depiction of the text searching strategies of subjects. In the high-redundant condition,
subjects appeared to more easily follow the order of the words in the pull quote. Therefore,
theory suggests learning was occurring because auditory and pictorial cues were in their working
memory at the same time. The subjects’ eyes and ears were not competing, so interference was
limited. As a result, subjects better remembered the facts in the story; not only that, but subjects
were better able to identify erroneous information that did not appear in the story during a recall
test.
One result the researcher found surprising in this study was that the FDM revealed a large
spread of gaze points in the medium-redundant condition, in contrast to the tight clusters of
fixations that produced larger hot spots in the high-redundant condition. The medium-redundant
FDM looked similar to the low-redundant FDM in some instances. That’s surprising because the
reporter merely summarized the text in the medium-redundant pull quotes, and many of the
words that were in the narration also appeared in the pull quotes, though not verbatim.
Regardless, the medium-redundant FDM revealed that the subjects’ abilities to search the text,

WHEN EYES AND EARS COMPETE
58
assumably to match what their ears were hearing with what their eyes were seeing, was
unstructured and inefficient. But then, given what the FDM displayed, one would then have
expected the medium redundancy recall and/or memory sensitivity scores to be lower than the
high-redundant; they were, but not with statistical significance at the 95% confidence level. At
least one similar study also failed to achieve this level of significance between the high- and
medium-redundant story conditions in terms of recall (Grimes, 1990).
Lastly, the researcher was not surprised by the low-redundant FDM. Research supports
the results. A news story condition in which the words and video don’t match at all is not
conducive to learning due to interference between the auditory and pictorial channel. This goes
back to theories discussed earlier in this manuscript. One’s working memory, which tracks what
one sees and hears, has limited capacity, according to the theory of working memory ((Holmes,
Josephson, & Carney, 2012; Josephson & Holmes, 2006). Learning occurs if pictures and audio
are in the working memory at the same time, according to dual-processing theory (Mayer &
Moreno, 1998). The low-redundant condition not only fed the subjects’ working memory with
competing information, but also additional information, since they were tasked with processing
unrelated cues in two different modalities. This condition created the interference and conflict
that the theory of cue summation suggests would happen (Severin, 1967b), and it resulted in less
information gain.

WHEN EYES AND EARS COMPETE
59
CHAPTER 6
CONCLUSION
The purpose of this study was to understand how the video and audio in a television news
story interact with or against each other when the story used pull quote graphics to convey key
information to viewers. The study also sought to produce visual depictions of exactly what
viewers looked at on the screen when the words in the reporter’s voice track matched the text in
the pull quote graphic verbatim, when the reporter summarized the text in the graphic, and when
the reporter’s voice track ignored the text in the pull quote. The study sought to determine the
effect of high redundancy, medium redundancy, and low redundancy on recall and memory
sensitivity.
The researchers found pull quotes presented with low redundancy resulted in lower recall
and memory sensitivity scores (a measure of memory strength) than pull quotes that the reporter
either summarized or read verbatim on the air. The researcher found that neither high
redundancy nor medium redundancy stories were superior or inferior to the other, when looking
at the effect on recall and memory sensitivity. But the use of eye-tracking technology provided a
different story on how news viewers examined pull quote graphics. Screen data recorded of
points of interest showed that viewers appeared to follow the text on the screen as the reporter
read them aloud. In this condition of high redundancy, theory suggests that learning occurs. On
the other hand, when the reporter summarized the text in the pull quote, eye-tracking data
revealed that news viewers did not appear to follow the pull quote text as systematically, but
rather their eyes jumped around the screen, an indication of unstructured or inefficient searching

WHEN EYES AND EARS COMPETE
60
of text. This visual comparison of the medium redundancy condition’s FDM surprisingly had
similar characteristics to the FDM of subjects who viewed the story with low redundancy.
This study stated the importance of understanding and remembering the news, since
doing so could influence the decisions one makes in the future. Pull quote graphics play an
integral role in storytelling. Content producers and news reporters play a big role in helping
viewers walk away from a news story or newscast cast feeling either well-informed or ill-
informed. The takeaway from this study is, when in doubt whether to narrate a pull quote graphic
verbatim in a news story, doing so may help viewers better remember the story. Reporters and
producers who include pull quotes in their stories should at the very least summarize the graphic.
Little to no good comes out of using the graphic as wallpaper video; this research showed that
viewers will either ignore the text in the graphic and listen to the narration, or some may ignore
what the reporter or anchor is saying and try to read the text. In either instance, important
information presented in the graphic or on the audio could be missed.
Another application to the results of this study is not related to television news but class
instruction. It is common practice for those who teach classes in high school and higher
education to use Microsoft PowerPoint or Apple Keynote presentations. Often, the slides
projected contain text. In a sense, the text could act as a pull quote, highlighting key words and
phrases the presenter wants to convey. Given the results of this study, it is suspected a similar
phenomenon could occur if the presenter projects the slides and does not bother to read the
words aloud. Students could either tune out the instructor while they read the slide, or they could
ignore reading the slide and instead focus their attention on what the instructor says. Thus this
would render the slide virtually useless. This suspicion, of course, could be tested in another
study.

WHEN EYES AND EARS COMPETE
61
Overall, the power of the medium of television and mass media cannot be
underestimated. There is power in obtaining information. There is power in retaining
information. Tuggle et al. (2011) stated that the script should always match the video in
television news. The present study demonstrated reasons why.
Limitations and Future Research
While this study sought to examine the effects of varying degrees of redundancy on the
recall of pull quote graphics, a convenience sample of college-age students may not be
representative of the news-viewing audience as a whole. Future research should eye-track
television viewers from numerous age brackets. Findahl (1971) found a correlation between age,
sex, and education, and how much subjects recalled from a news program. On average men
remembered more than women. On average, young people remembered more than middle-aged
and elderly individuals. On average, those who were better educated remembered more than
those with less education. Similarly, Neuman (1976) found those who are college-educated have
a higher rate of news recall, but the difference was “not very impressive” (p. 118).
Another limitation relates to the eye-tracking experience. Though subjects no longer need
to wear headgear to have their eye movements tracked, the news-viewing experience does not
appear to be as natural as someone watching television from the sofa in the their own home or
even someone sitting at a computer. Subjects in the present study were required sit within 24
inches of the computer screen and had to sit relatively still during the eye-tracking session. Given
the capabilities of the D6HS infrared camera, future research should consider better mimicking a
television viewing environment and experience by backing the camera unit farther away from the
screen and using a real flat screen television, instead of a computer monitor.

WHEN EYES AND EARS COMPETE
62
Future research could also replicate this study and the experimental conditions and not
use the eye-tracker at all. It is suspected that the eye-tracker may have changed the viewing
habits of some of the subjects, since they knew the investigators could see exactly where they
were looking.
Finally, the present study conducted a visual comparison of fixation density maps
provided by the eye tracker. Researchers visually compared and contrasted gaze patterns in the
three redundancy conditions. Future research could attempt to quantify the differences in the
gaze patterns statistically.
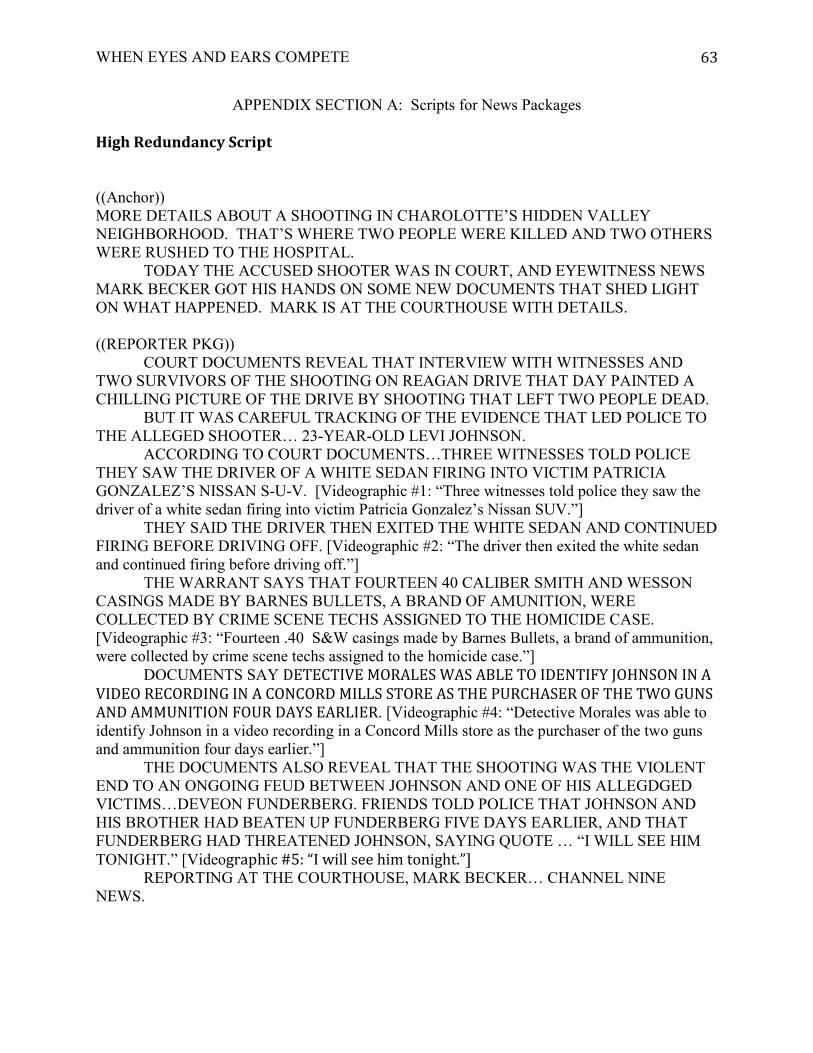
WHEN EYES AND EARS COMPETE
63
APPENDIX SECTION A: Scripts for News Packages
High Redundancy Script
((Anchor)) MORE DETAILS ABOUT A SHOOTING IN CHAROLOTTE’S HIDDEN VALLEY NEIGHBORHOOD. THAT’S WHERE TWO PEOPLE WERE KILLED AND TWO OTHERS WERE RUSHED TO THE HOSPITAL. TODAY THE ACCUSED SHOOTER WAS IN COURT, AND EYEWITNESS NEWS MARK BECKER GOT HIS HANDS ON SOME NEW DOCUMENTS THAT SHED LIGHT ON WHAT HAPPENED. MARK IS AT THE COURTHOUSE WITH DETAILS. ((REPORTER PKG)) COURT DOCUMENTS REVEAL THAT INTERVIEW WITH WITNESSES AND TWO SURVIVORS OF THE SHOOTING ON REAGAN DRIVE THAT DAY PAINTED A CHILLING PICTURE OF THE DRIVE BY SHOOTING THAT LEFT TWO PEOPLE DEAD. BUT IT WAS CAREFUL TRACKING OF THE EVIDENCE THAT LED POLICE TO THE ALLEGED SHOOTER… 23-YEAR-OLD LEVI JOHNSON. ACCORDING TO COURT DOCUMENTS…THREE WITNESSES TOLD POLICE THEY SAW THE DRIVER OF A WHITE SEDAN FIRING INTO VICTIM PATRICIA GONZALEZ’S NISSAN S-U-V. [Videographic #1: “Three witnesses told police they saw the driver of a white sedan firing into victim Patricia Gonzalez’s Nissan SUV.”] THEY SAID THE DRIVER THEN EXITED THE WHITE SEDAN AND CONTINUED FIRING BEFORE DRIVING OFF. [Videographic #2: “The driver then exited the white sedan and continued firing before driving off.”] THE WARRANT SAYS THAT FOURTEEN 40 CALIBER SMITH AND WESSON CASINGS MADE BY BARNES BULLETS, A BRAND OF AMUNITION, WERE COLLECTED BY CRIME SCENE TECHS ASSIGNED TO THE HOMICIDE CASE. [Videographic #3: “Fourteen .40 S&W casings made by Barnes Bullets, a brand of ammunition, were collected by crime scene techs assigned to the homicide case.”] DOCUMENTS SAY DETECTIVE MORALES WAS ABLE TO IDENTIFY JOHNSON IN A VIDEO RECORDING IN A CONCORD MILLS STORE AS THE PURCHASER OF THE TWO GUNS AND AMMUNITION FOUR DAYS EARLIER. [Videographic #4: “Detective Morales was able to identify Johnson in a video recording in a Concord Mills store as the purchaser of the two guns and ammunition four days earlier.”] THE DOCUMENTS ALSO REVEAL THAT THE SHOOTING WAS THE VIOLENT END TO AN ONGOING FEUD BETWEEN JOHNSON AND ONE OF HIS ALLEGDGED VICTIMS…DEVEON FUNDERBERG. FRIENDS TOLD POLICE THAT JOHNSON AND HIS BROTHER HAD BEATEN UP FUNDERBERG FIVE DAYS EARLIER, AND THAT FUNDERBERG HAD THREATENED JOHNSON, SAYING QUOTE … “I WILL SEE HIM TONIGHT.” [Videographic #5: “I will see him tonight.”] REPORTING AT THE COURTHOUSE, MARK BECKER… CHANNEL NINE NEWS.

WHEN EYES AND EARS COMPETE
64
Medium Redundancy Script
((Anchor)) MORE DETAILS ABOUT A SHOOTING IN CHAROLOTTE’S HIDDEN VALLEY NEIGHBORHOOD. THAT’S WHERE TWO PEOPLE WERE KILLED AND TWO OTHERS WERE RUSHED TO THE HOSPITAL. TODAY THE ACCUSED SHOOTER WAS IN COURT, AND EYEWITNESS NEWS MARK BECKER GOT HIS HANDS ON SOME NEW DOCUMENTS THAT SHED LIGHT ON WHAT HAPPENED. MARK IS AT THE COURTHOUSE WITH DETAILS. ((REPORTER PKG)) COURT DOCUMENTS REVEAL THAT INTERVIEW WITH WITNESSES AND TWO SURVIVORS OF THE SHOOTING ON REAGAN DRIVE THAT DAY PAINTED A CHILLING PICTURE OF THE DRIVE BY SHOOTING THAT LEFT TWO PEOPLE DEAD. BUT IT WAS CAREFUL TRACKING OF THE EVIDENCE THAT LED POLICE TO THE ALLEGED SHOOTER… 23-YEAR-OLD LEVI JOHNSON. ACCORDING TO COURT DOCUMENTS…THREE WITNESSES WHO HAPPENED TO BE IN THE AREA TOLD POLICE THEY HAD SEEN THE DRIVER OF A WHITE SEDAN FIRING INTO THE VICTIM’S S-U-V. [Videographic #1: “Three witnesses told police they saw the driver of a white sedan firing into victim Patricia Gonzalez’s Nissan SUV.”] THEY SAID THE SHOOTER GOT OUT OF HIS CAR AND CONTINUED SHOOTING BEFORE DRIVING OFF. [Videographic #2: “The driver then exited the white sedan and continued firing before driving off.”] THE WARRANT SAYS THAT CRIME SCENE TECHS THEN FOUND 14 FORTY CALIBER SHELLS CASINGS AT THE SCENE, MADE BY BARNES BULLETS, A BRAND OF AMMUNITION. [Videographic #3: “Fourteen .40 S&W casings made by Barnes Bullets, a brand of ammunition, were collected by crime scene techs assigned to the homicide case.”] DOCUMENTS SAY DETECTIVE MORALES TRACED THOSE BULLETS TO A STORE IN CONCORD MILLS THAT HAD VIDEO OF LEVI JOHNSON BUYING TWO GUNS AND AMMUNITION FOUR DAYS EARLIER. . [Videographic #4: “Detective Morales was able to identify Johnson in a video recording in a Concord Mills store as the purchaser of the two guns and ammunition four days earlier.”] THE DOCUMENTS ALSO REVEAL THAT THE SHOOTING WAS THE VIOLENT END TO AN ONGOING FEUD BETWEEN JOHNSON AND ONE OF HIS ALLEGDGED VICTIMS…DEVEON FUNDERBERG. FRIENDS TOLD POLICE THAT JOHNSON AND HIS BROTHER HAD BEATEN UP FUNDERBERG FIVE DAYS EARLIER, AND THAT FUNDERBERG HAD THREATENED JOHNSON, SAYING THAT HE WOULD QUOTE -- “SEE HIM TONIGHT.” [Videographic #5: “I will see him tonight.”] REPORTING AT THE COURTHOUSE, MARK BECKER… CHANNEL NINE NEWS.

WHEN EYES AND EARS COMPETE
65
Low Redundancy Script
((Anchor)) MORE DETAILS ABOUT A SHOOTING IN CHAROLOTTE’S HIDDEN VALLEY NEIGHBORHOOD. THAT’S WHERE TWO PEOPLE WERE KILLED AND TWO OTHERS WERE RUSHED TO THE HOSPITAL. TODAY THE ACCUSED SHOOTER WAS IN COURT, AND EYEWITNESS NEWS MARK BECKER GOT HIS HANDS ON SOME NEW DOCUMENTS THAT SHED LIGHT ON WHAT HAPPENED. MARK IS AT THE COURTHOUSE WITH DETAILS. ((REPORTER PKG)) COURT DOCUMENTS REVEAL THAT INTERVIEW WITH WITNESSES AND TWO SURVIVORS OF THE SHOOTING ON REAGAN DRIVE THAT DAY PAINTED A CHILLING PICTURE OF THE DRIVE BY SHOOTING THAT LEFT TWO PEOPLE DEAD. BUT IT WAS CAREFUL TRACKING OF THE EVIDENCE THAT LED POLICE TO THE ALLEGED SHOOTER… 23-YEAR-OLD LEVI JOHNSON. ACCORDING TO COURT DOCUMENTS… JOHNSON IS CHARGED WITH TWO COUNTS OF FIRST-DEGREE MURDER, TWO COUNTS OF ATTEMPTED MURDER, TWO COUNTS OF ASSAULT WITH A DEADLY WEAPON WITH INTENT TO KILL INFLICTING SERIOUS INJURY AND FOUR COUNTS OF SHOOTING INTO AN OCCUPIED VEHICLE CAUSING SERIOUS INJURY. [Videographic #1: “Three witnesses told police they saw the driver of a white sedan firing into victim Patricia Gonzalez’s Nissan SUV.”]
COURT PAPER SAY JOHNSON KILLED 23-YEAR-OLD PATRICIA GONZALEZ AND 22-YEAR-OLD DAVION FUNDERBURK, WHEN HE FIRED INTO A CAR ON REAGAN DRIVE ON JULY 11. GONZALEZ DIED AT THE SCENE AND FUNDERBURK DIED AT THE HOSPITAL THE NEXT DAY. [Videographic #2: “The driver then exited the white sedan and continued firing before driving off.”]
POLICE SAY TWO OTHERS WERE INJURED IN THE SHOOTING, 18-YEAR-OLD ANDY SPRINGS AND 22-YEAR-OLD BRANDON ALEXANDER. [Videographic #3: “Fourteen .40 S&W casings made by Barnes Bullets, a brand of ammunition, were collected by crime scene techs assigned to the homicide case.”]
A CHARLOTTE-MECKLENBURG POLICE DEPARTMENT SWAT TEAM AND THE VIOLENCE CRIMINAL APPREHENSION TEAM ARRESTED JOHNSON ON COTTONWOOD STREET EARLY FRIDAY. [Videographic #4: “Detective Morales was able to identify Johnson in a video recording in a Concord Mills store as the purchaser of the two guns and ammunition four days earlier.”]
POLICE HAVE NOT SAID WHETHER THEY ARE LOOKING FOR MORE SUSPECTS, BUT THEY ARE ASKING ANYONE WITH INFORMATION ABOUT THE SHOOTING TO CALL 704-432-TIPS AND SPEAK DIRECTLY TO A HOMICIDE DETECTIVE. [Videographic #5: “I will see him tonight.”]
REPORTING AT THE COURTHOUSE, MARK BECKER… CHANNEL NINE NEWS.

WHEN EYES AND EARS COMPETE
66
APPENDIX B: Post Eye-Tracking Questionnaire/Recall Test
Research Subject #________________________ Story Condition:_______________
Directions: This survey is meant to help the researchers determine your perceptions and recall of the text graphics shown in this news story. Please answer all questions truthfully. Your identity will not be recorded. Thank you. 1. What is your gender? A) Male B) Female 2. What is your age? ______________________ 3. Which category describes you? o White o Hispanic, Latino, or Spanish origin o Black or African American o Asian o American Indian or Alaska Native o Middle Eastern or North African o Native Hawaiian or Other Pacific Islander o Some other race, ethnicity, or origin 4. How many years of higher education (college) have you completed? A) One year B) Two years C) Three years D) Four years E) More than four years 5. Approximately how many hours a week do you spend watching television news stories (on television, computer, smartphone, or tablet)? A) I don’t watch television news B) Less than 1 hour a week C) About 1 hour a week D) About 2 hours a week E) About 3 hours a week F) About 4 hours a week G) About 5 hours a week H) More than 5 hours a week

WHEN EYES AND EARS COMPETE
67
6. How familiar were you with the content presented in news story you just watched? In other words, have witnessed the characters in any prior news story? 1-----------------2-----------------3-----------------4------------------5 Not familiar Moderately Familiar Very Familiar 7. Did you try to read the pull quote graphics in the news story? A) Yes B) No 8. Please rate the importance of each of the following elements to your recollection of the story? (A) Narration: 1-----------------2-----------------3-----------------4------------------5 Not Slightly Moderately Important Very Important Important Important Important (B) Pull Quote Graphic: 1-----------------2-----------------3-----------------4------------------5 Not Slightly Moderately Important Very Important Important Important Important
(Continued on next page…)

WHEN EYES AND EARS COMPETE
68
9. Please check whether each of the items was presented in the television news story about the shooting. For each item, circle how confident you are in your response about whether the item was presented in the story. Was the item
presented in the story?
How confident are you?
Yes No Levi Johnson bought four guns and ammo illegally.
1-----------2-----------3-----------4-----------5 Not Somewhat Neutral Confident Very Confident Confident Confident
Driver was in a white sedan. 1-----------2-----------3-----------4-----------5 Not Somewhat Neutral Confident Very Confident Confident Confident
Driver was in a 2-door sedan. 1-----------2-----------3-----------4-----------5 Not Somewhat Neutral Confident Very Confident Confident Confident
The victim drove a Nissan SUV. 1-----------2-----------3-----------4-----------5 Not Somewhat Neutral Confident Very Confident Confident Confident
Police located all bullet casings. 1-----------2-----------3-----------4-----------5 Not Somewhat Neutral Confident Very Confident Confident Confident
Levi Johnson purchased two guns. 1-----------2-----------3-----------4-----------5 Not Somewhat Neutral Confident Very Confident Confident Confident
14 bullet casings were collected. 1-----------2-----------3-----------4-----------5 Not Somewhat Neutral Confident Very Confident Confident Confident
Three people were shot. 1-----------2-----------3-----------4-----------5 Not Somewhat Neutral Confident Very Confident Confident Confident
The bullet casings were Smith and Wesson.
1-----------2-----------3-----------4-----------5 Not Somewhat Neutral Confident Very Confident Confident Confident
The victim was Patricia Gonzalez. 1-----------2-----------3-----------4-----------5 Not Somewhat Neutral Confident Very Confident Confident Confident
Levi Johnson purchased two semi-automatic pistols.
1-----------2-----------3-----------4-----------5 Not Somewhat Neutral Confident Very Confident Confident Confident
The bullets were hollow point. 1-----------2-----------3-----------4-----------5 Not Somewhat Neutral Confident Very Confident Confident Confident
The bullets were made by Barnes Bullets.
1-----------2-----------3-----------4-----------5 Not Somewhat Neutral Confident Very Confident Confident Confident

WHEN EYES AND EARS COMPETE
69
The driver exited the sedan and fired.
1-----------2-----------3-----------4-----------5 Not Somewhat Neutral Confident Very Confident Confident Confident
The driver called out the victim and fired.
1-----------2-----------3-----------4-----------5 Not Somewhat Neutral Confident Very Confident Confident Confident
Levi Johnson went unidentified for 2 weeks.
1-----------2-----------3-----------4-----------5 Not Somewhat Neutral Confident Very Confident Confident Confident
One victim had told the suspect he would “see him tonight.”
1-----------2-----------3-----------4-----------5 Not Somewhat Neutral Confident Very Confident Confident Confident
Detective Morales identified Levi Johnson.
1-----------2-----------3-----------4-----------5 Not Somewhat Neutral Confident Very Confident Confident Confident
The victim’s drove a white SUV. 1-----------2-----------3-----------4-----------5 Not Somewhat Neutral Confident Very Confident Confident Confident
Levi Johnson purchased ammunition four days earlier before the shooting.
1-----------2-----------3-----------4-----------5 Not Somewhat Neutral Confident Very Confident Confident Confident
The suspect told the victim he “would not live through the night.”
1-----------2-----------3-----------4-----------5 Not Somewhat Neutral Confident Very Confident Confident Confident
The bullet casings were brass and aluminum.
1-----------2-----------3-----------4-----------5 Not Somewhat Neutral Confident Very Confident Confident Confident
You are done. Thank you for your participation!!

WHEN EYES AND EARS COMPETE
70
Key:
Target Items Foil Items Driver was in a white sedan. Driver was in a 2-door sedan. 14 bullet casings were collected . Police located all bullet casings. The victim was Patricia Gonzalez. Three people were shot. The victim drove a Nissan SUV. The victim’s drove a white SUV. The driver exited the sedan and fired. The driver called out the victim and fired. The bullets were made by Barnes Bullets. The bullets were hollow point. Detective Morales identified Levi Johnson. Levi Johnson went unidentified for 2 weeks. Levi Johnson purchased two guns. Levi Johnson purchased two semi-automatic pistols. Levi Johnson purchased ammunition four days earlier before the shooting.
Levi Johnson bought four guns and ammo illegally.
The bullet casings were Smith and Wesson. The bullet casings were brass and aluminum. One victim had told the suspect he would “see him tonight.”
The suspect told the victim he “would not live through the night.”

WHEN EYES AND EARS COMPETE
71
APPENDIX C: Informed Consent Form
Brigham Young University
INFORMED CONSENT FORM Eyetracking and Television News Principal Investigator: Othello Richards, JR You are invited to participate in a research study examining eye tracking during a television news story. INFORMATION
The study you have volunteered to participate in will help us to better understand how television viewers watch the news. The eyetracker used in the study monitors your eye movements by monitoring one eye with a video camera while you are performing a task. A special computer uses the video image to determine the direction that your eye is pointing. Your eye will be illuminated with an infrared LED (like that used in TV remote controls). The amount of infrared illumination at your eye is less than the amount outside on a sunny day, and ten to a hundred times less than the recommended chronic (long-term) exposure levels. RISKS
We do not foresee any risks associated with your participation in this research study. As described, the infrared illumination is lower than you receive outdoors. BENEFITS
This is part of an ongoing effort to understand how viewers watch television news. For you personally, there is no direct benefit aside from being able to see your eye movements. A better understanding of visual perception relates to our basic knowledge of the visual system and may help improve television news viewers’ experiences. CONFIDENTIALITY
The information in the study records will be kept strictly confidential. Data will be stored securely and will be made available only to persons conducting the study. No reference will be made in oral or written reports, which could link you to the study. Publications related to this work will not make reference to any individuals. CONTACT
If you have questions at any time about the study or the procedures, you may contact the researcher, Othello Richards, JR, (509) 999-9541, [email protected], Brigham Young University, 329 BRMB, Provo, UT 84602 PARTICIPATION
Your participation in this study is voluntary; you may decline to participate without penalty. If you decide to participate, you may withdraw from the study at any time without penalty and without loss of benefits

WHEN EYES AND EARS COMPETE
72
to which you are otherwise entitled. If you withdraw from the study before data collection is completed your data will be destroyed. CONSENT
I have read and understand the above information. I agree to participate in this study. Subject's signature_______________________________________________ Date ______________ Investigator or designate’s signature________________________________ Date_______________ ________________ Parent or guardian’s signature_____________________________________ Date ______________

WHEN EYES AND EARS COMPETE
73
APPENDIX D: Recruiting Sheet
Eyetracking and Television News Research Principal Investigator: Othello Richards, JR Email: [email protected] Cell Phone: (509) 999-9541 Information:
You are invited to participate in a research study examining eye tracking during a television news story. The study will help us to better understand how television viewers watch the news. The eyetracker used in the study monitors your eye movements by monitoring one eye with a video camera while you are performing a task. A special computer uses the video image to determine the direction that your eye is pointing. Your eye will be illuminated with an infrared LED (like that used in TV remote controls). The amount of infrared illumination at your eye is less than the amount outside on a sunny day, and ten to a hundred times less than the recommended chronic (long-term) exposure levels. Compensation: The names of eight participants will be randomly drawn to receive $25 cash for participation in the study. Prizes will be distributed upon completion of data collection. Directions: Print your name, email address, and telephone number in the desired time slot. Please be prompt to prevent delays. Date: (TBD) TIME: NAME: EMAIL: PHONE #:
9:00 AM
9:10 AM
9:20 AM
9:30 AM
9:40 AM
9:50 AM
10:00 AM
10:10 AM

WHEN EYES AND EARS COMPETE
74
APPENDIX E: Debriefing Statement
Eyetracking and Television News Research Debriefing Statement
Thanks for your participation in this current eyetracking study. As you know, you were asked to view a news story, and that the study would help us to better understand how television viewers watch the news. What we didn’t fully disclose was exactly what elements of the news story we were interested in. That is, we wanted to see how well you could recall pull quote graphics when either the graphics matched the narration word-for-word, or when the audio and video were out of sync. Research has shown when the video does not match the audio, it’s more difficult for people to remember information presented in a news story. We chose not to reveal exactly what we were studying because revealing this information at the onset could have altered the natural way in which you viewed the television news story. Sometimes, when participants know the exact purpose of an experiment that could jeopardize the reliability of the results. Having heard what I just said, if you wish to remove your data from this study, you may do so without any penalty. You will still be entered into the drawing for the $25 cash prize because of your full participation, if you desire. What we do ask of you now, please do not share the intent of this study with others for the next two weeks, until we have gathered all the data. Doing so could compromise the reliability of the results, but of course you have the agency to do what you want. If you have had any concerns about the study’s procedures, feel free to contact BYU’s Institutional Review Board at (801) 422-1461. The office is located in room A-285 of the ASB. Once again, thanks for helping out with this study. Do you have any other questions? (Answer questions)

WHEN EYES AND EARS COMPETE
75
TABLES AND FIGURES
_________________________________________________________ __________________________________________________________
n M SD SE
__________________________________________________________
Redundancy Cond. Low 26 .615 .152 .030 Medium 33 .642 .125 .023 High 28 .711 .15 .028 __________________________________________________________ Note. N = 87
Table 1
One-Way ANOVA - Hit Rate

WHEN EYES AND EARS COMPETE
76
__________________________________________________________
Source df SS MS F p
__________________________________________________________ Between groups 2 .133 .066 3.317 .04 Within groups 84 1.68 .02 Total 86 1.81
__________________________________________________________
Note. N = 87
Table 2
One-Way Analysis of Variance of Hit Rate by Redundancy Condition

WHEN EYES AND EARS COMPETE
77
__________________________________________________________
n M SD SE
__________________________________________________________
Redundancy Cond. Low 26 -.052 .128 .025 Medium 33 -.005 .113 .02 High 28 .055 .099 .019 __________________________________________________________ Note. N = 87
Table 3
One-Way ANOVA - Memory Sensitivity

WHEN EYES AND EARS COMPETE
78
_________________________________________________________________
Source df SS MS F p
_________________________________________________________________
Between groups 2 .154 .077 5.983 .004 Within groups 84 1.083 .013 Total 86 1.237
________________________________________________________________
Note. N = 87
Table 4
One-Way Analysis of Variance of Memory Sensitivity by Redundancy Condition

WHEN EYES AND EARS COMPETE
79
__________________________________________________________
n M SD SE
__________________________________________________________
Low Audio 26 3.58 1.07 .21 Graphic 26 2.77 1.07 .21 Medium Audio 32 4.22 1.07 .19 Graphic 32 2.97 1.18 .21 High Audio 28 4.29 .81 .15 Graphic 28 3.07 1.09 .21 __________________________________________________________ Note. N = 86
Table 5
Audio/Graphic Preference by Condition

WHEN EYES AND EARS COMPETE
80
___________________________________________________________________________
Key term Definition ___________________________________________________________________________ Fixation A period of time when the eye is stationary long enough to extract and interpret information. One hundred milliseconds has become a widely accepted rule of thumb. Fixation Density Map Sometimes referred to as a hot spot map. It shows aggregate (FDM) eye fixations of a screen. It provides a summary of the gaze positions received from multiple eye-tracking sessions and subjects based on the data. Fixation Duration The amount of time a subject spends fixating on a point. Gaze Pattern Visual representation of the pattern of fixations. Used to create a fixation density map. Saccade Quick jumps of the eye; their purpose is to bring a new visual region upon the fovea, the part of the retina where visual acuity is the greatest and where clear detail can be obtained.
Table 6
Eye-tracking Measures

WHEN EYES AND EARS COMPETE
81
Figure 1
Pull Quote Example

WHEN EYES AND EARS COMPETE
82
Figure 2
High, Medium, Low Redundancy Fixation Density Map
Pull Quote Graphic #1 (Time Code labeled on the bottom right of each frame)

WHEN EYES AND EARS COMPETE
83

WHEN EYES AND EARS COMPETE
84
Pull Quote Graphic #2

WHEN EYES AND EARS COMPETE
85

WHEN EYES AND EARS COMPETE
86
Pull Quote Graphic #3

WHEN EYES AND EARS COMPETE
87

WHEN EYES AND EARS COMPETE
88

WHEN EYES AND EARS COMPETE
89
Pull Quote Graphic #4

WHEN EYES AND EARS COMPETE
90

WHEN EYES AND EARS COMPETE
91

WHEN EYES AND EARS COMPETE
92
Pull Quote Graphic #5

WHEN EYES AND EARS COMPETE
93
References
Adams, J., & Chambers, R. (1962). Response to simultaneous stimulus of two sense modalities.
Journal of Experimental Psychology, 63, 198–206.
Associated Press Online. (2001, August 6). CNN Headline News relaunches. AP Online.
Retrieved from https://www.highbeam.com/doc/1P1-46161342.html
Baddeley, A. D. (1986). Working memory. Oxford, England: Oxford University Press.
Baddeley, A. D. (1992). Working memory. Science, 255, 556–559.
Baggett, P., & Ehrenfeucht, A. (1983). Encoding and retaining information in the visuals and
verbals of an educational movie. Journal of Educational Psychology, 76, 408–417.
Barnhurst, K. G., & Steele, C. A. (1997). Image bite news: The visual coverage of elections on
U.S. television, 1968–1992. Harvard International Journal of Press/Politics, 2, 40–58.
Baron, S. (2008). First-hand: Inventing the Vidifont: the first electronics graphics machine used
in television production. Retrieved from http://ethw.org/First-
Hand:Inventing_the_Vidifont:_the_first_electronics_graphics_machine_used_in_televisi
on_production
Bass, R. (1967). The development of CBS News 36. The Journal of Typographic Research, 4,
357–372.
Bass, R. (1971). The development of Vidifont. Visible Language, 5, 33-48
Becker, L. A. (2000, March 20). Effect size calculators [Web log post]. Retrieved from
http://www.uccs.edu/~lbecker/
Bergman, L., Grimes, T., & Potter, D. (2005). How attention partitions itself during simultaneous
message presentations. Human Communication Research, 31, 311–336.
Broadbent, D. (1958). Perception and communication. New York, NY: Pergamon.

WHEN EYES AND EARS COMPETE
94
Brosius, H., & Donsbach, W. (1996). How do text-picture relations affect the informational
effectiveness of television newscasts? Journal of Broadcasting & Electronic Media, 40,
180–196.
Caldwell, J. T. (1995). Televisuality: Style, crisis, and authority in American television. New
Brunswick, NJ: Rutgers University Press.
Carlston, D. E. (1980). Events, inferences, and impression formation. In R. Hastie, T. M.
Ostrom, E. B. Ebbeson, R. S. Wyer, D. L. Hamilton, & D. E. Carlston (Eds.), Person
memory: The cognitive basis of social perception (pp. 89–119). Hillsdale, NJ: Lawrence
Erlbaum Associates.
Cavanaugh, J. C. (1983). Comprehension and retention of television programs by 20- and 60-
year-olds. Journal of Gerontology, 38, 190–196.
Chandler, P., & Sweller, J. (1992). The split-attention effect as a factor in the design of
instruction. British Journal of Educational Psychology, 62, 233–246.
Clark, J. M., & Paivio, A. (1991). Dual coding theory and education. Educational Psychology
Review, 3, 149–210.
Cooke, L. (2005). The visual convergence of print, television, and the internet: Charting 40 years
of design change in news presentation. New Media & Society, 7, 22–46.
Day, W. F., & Beach, B. R. (1950). A survey of the research literature comparing the visual and
auditory presentation of information (ATI Report No. 5921). Charlottesville, VA:
University of Virginia. Retrieved from the Defense Technical Information Center
website: http://www.dtic.mil/dtic/tr/fulltext/u2/a800181.pdf
Dhawan, M., & Pellegrino, J. W. (1977). Acoustic and semantic interference effects in words
and pictures. Memory & Cognition, 5, 340–346.

WHEN EYES AND EARS COMPETE
95
Dickson, G. (2008, October 31). CNN’s virtual election night. Broadastingcable.com. Retrieved
from http://www.broadcastingcable.com/news/news-articles/cnns-virtual-election-
night/69225
Drew, D. G., & Grimes, T. (1987). Audio-visual redundancy and TV news recall.
Communication Research, 14, 452–461.
Engelke, U., Liu, H., Wang, J., Le Callet, P., Heynderickx, I., Zepernick, H. J., & Maeder, A.
(2013). Comparative study of fixation density maps. IEEE Transactions on Image
Processing, 22(3), 1121–1133.
Faul, F., Erdfelder, E., Buchner, A., & Lang, A. G. (2009). Statistical power analyses using
G*Power 3.1: Tests for correlation and regression analyses. Behavior Research
Methods, 41, 1149–1160.
Faul, F., Erdfelder, E., Lang, A. G., & Buchner, A. (2007). G*Power 3: A flexible statistical
power analysis program for the social, behavioral, and biomedical sciences. Behavior
Research Methods, 39, 175–191.
Findahl, O. (1971). The effect of visual illustrations upon perception and retention of news
programmes. Swedish Broadcasting Corp.: Stockholm, Sweden. Retrieved from
http://files.eric.ed.gov/fulltext/ED054631.pdf
Fox, J. R. (2004). A signal detection analysis of audio/video redundancy effects in television
news video. Communication Research, 31, 524–536.
Frenkel, K. A. (1988). Computers and elections. Communications of the ACM, 31, 1176–1183
Gibson, R., Hester, J. B., & Stewart, S. (2001). Pull quotes shape reader perceptions of news
stories. Newspaper Research Journal, 22, 66–78.

WHEN EYES AND EARS COMPETE
96
Goldberg, J. H., & Kotval, X. P. (1999). Computer interface evaluation using eye movements:
Methods and constructs. International Journal of Industrial Ergonomics, 24, 631–645.
Grimes, T. (1990). Audio-video correspondence and its role in attention and memory.
Educational Technology Research and Development, 38, 15–25.
Grzanich, S. (2012, November 6). CBS election night 1984 [Video file]. Retrieved from
https://www.youtube.com/watch?v=K0_sYOgJzfE
Gunter, B. (1983). Forgetting the news. In E. Wartella & D. C. Whitney (Eds.), Mass
communication review yearbook (Vol. 4). Newbury Oark, CA: Sage.
Hallin, D. C. (1992). Sound bite news: Television coverage of elections, 1968–1988. Journal of
Communication, 42, 5–24.
Hartman, F. R. (1961b). Single and multiple channel communication: A review of research and a
proposed model. AV Communication Review, 9, 235–262.
Hembrooke, H., Feusner, M., & Gay, G. (2006). Averaging scan patterns and what they can tell
us. Paper presented at the 2006 Symposium on Eye Tracking Research & Applications,
New York, NY.
Hess, S., Hensher, D., & Daly, A. (2012). Not bored yet—Revisiting respondent fatigue in stated
choice experiments. Transportation Research Part A: Policy and Practice, 46, 626–644.
Hewitt, D. (1985). Minute by minute: The story of “60 Minutes.” New York, NY: Random
House.
Holmes, M., Josephson, S., & Carney, R. E. (2012). Visual attention to television programs with
a second-screen application. Paper presented at the 2012 Symposium on Eye Tracking
Research and Applications, Santa Barbara, CA.

WHEN EYES AND EARS COMPETE
97
Hsia, H. (1968). Output, error, equivocation, and recalled information in auditory, visual, and
audiovisual information processing with constraint and noise. Journal of Communication,
18, 325–353.
IMotions. (2015, July 9). 7 most used eye tracking metrics and terms. IMotions Biometric
Research Platform. Retrieved from https://imotions.com/blog/7-terms-metrics-eye-
tracking/
Jacob, R. J. K., & Karn, K. S. (2003). Eye tracking in human-computer interaction and usability
research: Ready to deliver the promises. In J. Hyönä, R. Radach, & H. Deubel (Eds.), The
mind’s eye: Cognitive and applied aspects of eye movement research (pp. 573–605).
Radarweg, Amsterdam: Elsevier.
John, K. K. (2015). Using eye-tracking to optimize skin self-examination training (Unpublished
doctoral dissertation). University of Utah, Salt Lake City, UT.
Josephson, S., & Holmes, M. E. (2002). Attention to repeated images on the World-Wide Web:
Another look at scanpath theory. Behavior Research Methods, Instruments, &
Computers, 34, 539–548.
Josephson, S., & Holmes, M. E (2006, March). Clutter or content? How on-screen enhancements
affect how TV viewers scan and what they learn. In K. Raiha (Ed.), ETRA ’06 eye
tracking research and applications. Paper presented at the meeting of the Association for
Computing Machinery, New York, NY.
Katz, E., Adoni, H., & Parness, P. (1977). Remembering the news: What pictures add to recall.
Journalism Quarterly, 54, 231–239.
Ketchum, C. H., & Heath, R. W. (1962). Teaching effectiveness of sound with pictures that do
not embody the material being taught. AV Communication Review, 10, 89–93.

WHEN EYES AND EARS COMPETE
98
Keller, T., & Hawkins, S. (2009). Editing. In T. Keller & S. Hawkins (Eds.), Television news: A
handbook for reporting, writing, shooting, editing & producing (pp. 289–322).
Scottsdale, AZ: Holcomb Hathaway.
Kolodzy, J. (2013). Practicing convergence journalism: An introduction to cross-media
storytelling. New York, NY: Routledge.
Lewis, M. S., & Jackson, D. W. (2001). Television literacy: Comprehension of program content
using closed captions for the deaf. Journal of Deaf Studies and Deaf Education, 6, 44–53.
Manhartsberger, M., & Zellhofer, N. (2005). Eye tracking in usability research: What users
really see. Empowering Software Quality: How Can Usability Engineering Reach These
Goals? Usability Symposium 2005, 198, 141-152.
MacMillan, N., & Creelman, C. (1991). Detection theory: A user’s guide. Cambridge, UK:
Cambridge University Press.
Mayer, R. E. (1997). Multimedia learning: Are we asking the right questions? Educational
Psychologist, 32, 1–19.
Mayer, R. E. & Moreno, R. (1998). A split-attention effect in multimedia learning: Evidence for
dual processing systems in working memory. Journal of Educational Psychology, 902,
312–320.
Mayer, R. E., Steinhoff, K., Bower, G., & Mars, R. (1995). A generative theory of textbook
design: Using annotated illustrations to foster meaningful learning of science text.
Educational Technology Research and Development, 43, 31–43.
Miller, N. E. (Ed.). (1957). Graphic communication and the crisis in education. In collaboration
with W. A. Allen, et al. AV Communication Review, 5, 1–120.

WHEN EYES AND EARS COMPETE
99
Neuman, W. R. (1976). Patterns of recall among television news viewers. The Public Opinion
Quarterly, 40, 115–123.
Norton, D., & Stark, L. W. (1971). Scanpaths in saccadic eye movements while viewing and
recognizing patterns. Vision Research, 11, 547–551.
Paivio, A. (1986). Mental representation: A dual coding approach. Oxford, England: Oxford
University Press.
Parker, B. (2010, November 16). 1992 Election coverage part 1 [Video file]. Retrieved from
https://www.youtube.com/watch?v=opYnHcoKKCU&list=PLg2KzMsaR9dVIHml_hullc
l9OdBZqHCrv&index=76
Pezdek, K., & Stevens, E. (1984). Children’s memory for auditory and visual information on
television. Developmental Psychology, 20, 212–218.
Ponce de Leon, C. (2015). That’s the way it is: A history of television news in America. Chicago,
IL: The University of Chicago Press.
Posner, M. I., Nissen, M. J., & Klein, R. M. (1976). Visual dominance: An information-
processing account of its origins and significance. Psychological Reviews, 83, 157–171.
Rayner, K. (1978). Eye movements in reading and information processing. Psychological
Bulletin, 85, 618–660.
Rayner, K. (1998). Eye movements in reading and information processing: Twenty years of
research. Psychological Bulletin, 124, 372–422.
RCA Corporation. (1959). RCA 501 Computer, brochure. (Catalog number 102646273,
Identifying numbers 3J3303). Computer History Museum, Mountainview, CA. Retrieved
from http://archive.computerhistory.org/resources/access/text/2010/09/102646273-05-01-
acc.pdf
WHEN EYES AND EARS COMPETE
100
Reese, S. D. (1983, August). Improving audience learning from television news through
between-channel redundancy. Paper presented at the Annual Meeting of the Association
for Education in Journalism and Mass Communication, Corvalis, OR.
Reese, S. D. (1984). Visual-verbal redundancy effects on TV news learning. Journal of
Broadcasting, 28, 79–87.
Rich, C. (2014). Writing and reporting news: A coaching method. Boston, MA: Cengage
Learning.
Robinson, J., Sahin, H., & Davis, D. (1981). Television journalists and their audiences. In J.S.
Ettema & D.C. Whitney (Eds.), Individuals in Mass Media Organiations: Creativity and
Constraint. Beverly Hills, CA: Sage.
Rodrigues, R., Veloso, A., & Mealha, O. (2016). Influence of the graphical layout of television
news on the viewers: An eye tracking study. Observatorio (OBS) Journal, 10, 67–82.
Severin, W. J. (1967a). Another look at cue summation. AV Communication Review, 15, 233–
245.
Severin, W. J. (1967b). The effectiveness of relevant pictures in multiple-channel
communication. AV Communication Review, 15, 386–401.
Shapiro, M. (1994). Signal detection measures of recognition memory. In A. Lang (Ed.),
Measuring psychological responses to media messages (pp. 133–148). Hillsdale, NJ:
Lawrence Erlbaum.
Shapiro, M. A., & Fox, J. R. (2002). The role of typical and atypical events in story memory.
Human Communication Research, 27, 109–135.
Smith, M. C., & Magee, L. E. (1990). Tracing the time course of picture-word processing.
Journal of Experimental Psychology: General, 109, 373–392.

WHEN EYES AND EARS COMPETE
101
Son, J., Reese, S. D., & Davie W. R. (1987). Effects of visual-verbal redundancy and recaps on
the TV news learning. Journal of Broadcasting and Electronic Media, 31, 207–216.
Sweller, J. (1988). Cognitive load during problem solving: Effects on learning. Cognitive
Science, 12, 257–285.
Sweller, J. (1989). Cognitive technology: Some procedures for facilitating learning and problem
solving in mathematics and science. Journal of Educational Psychology, 81, 457–466.
Sweller, J., Chandler, P., Tierney, P., & Cooper, M. (1990). Cognitive load as a factor in the
structuring of technical material. Journal of Experimental Psychology: General, 119,
176-192.
Szarkowska, A., Krejtz, I., Klyszejko, Z., & Wieczorek, A. (2011). Verbatim, standard, or
edited? Reading patterns of different captioning styles among deaf, hard of hearing, and
hearing viewers. American Annals of the Deaf, 156, 363–378.
Tuggle, C. A., Carr, F., & Huffman, S. (2011). Television news story forms—The VO. In P.
Braffman, & A. Lonn (Eds.), Broadcast news handbook: Writing, reporting, and
producing in the age of social media (pp. 103–135). New York, NY: McGraw-Hill.
Uttal, W. R., & Smith, E. (1968). Recognition of alphabetic characters during voluntary eye
movements. Perception & Psychophysics, 3, 257–264.
Von Pein, D. (2013, August 30). Election night 1960 (NBC-TV Coverage) [Video file]. Retrieved
from
https://www.youtube.com/watch?v=XtOuIqHi8ns&index=1&list=PLg2KzMsaR9dVI
Hml_hullcl9OdBZqHCrv

WHEN EYES AND EARS COMPETE
102
Wang, P., Wang, Y., Paul, P., & Loeterman, M. (2007). Near-verbatim captioning versus edited
captioning for students who are deaf or hard of hearing: a preliminary investigation of
effects on comprehension. American Annals of the Deaf, 152, 20-28.
Warsaw, P. R. (1978). Application of selective attention theory to television advertising displays.
Journal of Applied Psychology, 63, 366–372.
Winslow, G. (2014). Newsroom graphics offer the look of efficiency. Broadcasting & Cable,
144, 35.
Wenger, D. H., & Potter, D. (2015). Storytelling: Broadcast. In B. Matthew, E. Oettinger, G.
Piccininni, J. Masnovi, J. Haenel, & M. Bast (Eds.), Advancing the story (pp. 172–199).
Thousand Oaks, CA: CQ Press.
Woodall, W. G., Davis, D. K., & Sahin, H. (1983). From the boob tube to the black box:
Television news comprehension from an information processing perspective. Journal of
Broadcasting, 27, 1–23.