When Do Foreign Banks Finance Domestic Investment? … Foreign Banks 3-9-03.pdf · When Do Foreign...
36
When Do Foreign Banks Finance Domestic Investment? New Evidence on the Importance of Legal and Financial Systems by Benjamin C. Esty First Draft: December 23, 2002 Last Draft: February 12, 2003 Current Draft: March 9, 2003 Morgan 381 Harvard Business School Soldiers Field Road Boston, Massachusetts 02163 Phone: (617) 495-6159 Fax: (617) 496-6592 Email: [email protected] Copyright © 2002, Benjamin C. Esty * Acknowledgements: I would like to thank Max Maksimovic and Andrei Shleifer for helpful comments, and Bill Megginson for helping to create the original database, for many helpful discussions on syndicated lending, and for graciously letting me extend our previous work as a sole author. I would also like to thank the Division of Research at Harvard Business School for supporting this research.
Transcript of When Do Foreign Banks Finance Domestic Investment? … Foreign Banks 3-9-03.pdf · When Do Foreign...
When Do Foreign Banks Finance Domestic Investment? New Evidence on the Importance of Legal and Financial Systems
by
Benjamin C. Esty
First Draft: December 23, 2002 Last Draft: February 12, 2003 Current Draft: March 9, 2003
Morgan 381 Harvard Business School Soldiers Field Road Boston, Massachusetts 02163 Phone: (617) 495-6159 Fax: (617) 496-6592 Email: [email protected] Copyright © 2002, Benjamin C. Esty * Acknowledgements: I would like to thank Max Maksimovic and Andrei Shleifer for helpful comments, and Bill Megginson for helping to create the original database, for many helpful discussions on syndicated lending, and for graciously letting me extend our previous work as a sole author. I would also like to thank the Division of Research at Harvard Business School for supporting this research.
When Do Foreign Banks Finance Domestic Investment? New Evidence on the Importance of Legal and Financial Systems
Abstract
This paper analyzes how different legal and financial systems affect the composition of loan syndicates, and how the composition, in turn, affects loan pricing. In contrast with previous work on the availability and allocation of external finance, I study the supply of long-term funds to large, illiquid project companies. Using a sample of 495 loan tranches to project companies located in 61 countries (worth $151 billion), I find that foreign banks provide a greater share of total funds in countries with strong creditor rights, strong legal enforcement, and less-developed financial systems. I also find that loan spreads are positively related to the fraction of total funds provided by foreign banks. These findings demonstrate that both legal and financial systems affect the availability of funds and, presumably, investment decisions and economic growth. JEL Classification Codes: G2, K0, O1, P5
2
Introduction
The direction of causality between the development of financial systems and the
rate of economic growth has been the subject of debate for almost 100 years. Schumpeter
(1911) argued that banks foster economic growth by identifying attractive investment
opportunities. Consistent with this argument, Merton and Bodie (1995) claim that one of
the most important functions provided by a financial system is the allocation of resources
across time and space. Financial instruments, capital markets, and institutions, such as
banks, arise to overcome market frictions that discourage investment. More developed
financial systems are better able to allocate scarce resources to optimal investment
opportunities. On the other side of the debate, Robinson (1952) claims that financial
systems respond to, but do not foster economic growth. Subsequent empirical research
appears to corroborate the Schumpeterian view that financial systems do, indeed, have a
positive impact on economic growth (see Levine, 1997, for a review of the theoretical
arguments and empirical research).1
More recently, there has been another line of research highlighting the role of
legal systems as a determinant of financial development and economic growth. La Porta,
López-de-Silanes, Shleifer, and Vishny (hereafter, LLSV; 1997 and 1998) show that legal
origin is an important determinant of investor protection, and that stronger investor
protection results in larger and deeper capital markets. Levine (1999) and Levine,
Loayza, and Beck (2000) extend this analysis by showing that stronger investor
protection leads to greater development of financial intermediaries, which in turn leads to
greater economic growth.
The general conclusion from these two lines of research is that both legal and
financial systems affect economic growth. Having reached this conclusion, the focus of
the analysis has shifted to understanding how legal and financial systems affect growth.
For example, Demirgüç-Kunt and Maksimovic (1998 and 1999) analyze financing
decisions at the firm level and find that both legal rights and financial development affect
1 There is additional evidence at the country (Levine and Zervos, 1998; King and Levine, 1993), industry
(Rajan and Zingales, 1998; Wurgler, 2000), and firm levels (Demirgüç-Kunt and Maksimovic, 1998 and 1999; Jayaratne and Strahan, 1996) that is consistent with financial development having a positive impact on economic growth.
1
the ability of firms to raise external finance, particularly long-term debt. Firms in
countries with strong legal protection and well-developed markets are able to raise more
long-term capital and, subsequently, grow faster. Giannetti (2002) also finds that it is
easier for firms to raise long-term debt and borrow against intangible assets in countries
that provide stronger creditor rights.
In this paper, I tackle the same question—do legal and financial systems affect
firms’ abilities to raise long-term capital—from a different perspective and with a
potentially more powerful dataset. Whereas Demirgüç-Kunt and Maksimovic focus on
the demand for long-term finance by firms, I focus on the supply of long-term funds by
banks. In other words, when and under what kinds of conditions will banks agree to
finance long-term investment opportunities. Specifically, I test whether foreign banks
fund domestic projects (capital investments), whether foreign bank participation is a
function of a country’s financial and legal systems, and how foreign bank participation
affects loan pricing. Levine (1996) addresses the first question qualitatively, but did not
have the data to analyze it empirically.
I examine these relationships in the context of greenfield project companies,
which are separately incorporated (i.e. legally independent) companies financed with
nonrecourse debt for the purpose of investing in a capital asset (Esty, 2002). Mines,
power plants, pipelines, and toll roads are examples of assets commonly financed through
project companies. For several reasons, project companies are a particularly attractive
setting in which to study the determinants of long-term financing. First, as standalone,
greenfield assets, project companies do not have access to internally-generated cash flow.
Instead, they must raise all of their capital from external sources. Second, they are
created to finance illiquid assets with long, but usually limited, lives. For maturity
matching reasons, the average project loan has a maturity of over nine years. Moreover,
as large companies with few growth options, they are also more likely to use long-term
debt.2 The use of longer term debt forces capital providers to make long-term
assessments of project, industry, and sovereign risks. Third, for agency reasons related to
the use of free cash flow (Jensen, 1986), project companies have very high leverage ratios
2 Barclay and Smith (1995) find that larger firms and firms with few growth options have more long-term
debt in their capital structure, which they interpret as being consistent with costly contracting.
2
and capital structures comprised almost entirely of amortizing bank debt (Esty, 2003).3
In fact, the average project company has a book value debt-to-total capitalization ratio of
70%. Moreover, bank loans have historically accounted for over 90% of total project
debt.4 And finally, because most of the operating contracts and virtually all of the
enforcement of financial claims (e.g., seizure of collateral upon default) depend on the
legal system in the country where the project is located, creditors must understand their
legal rights as well as the efficiency of local law enforcement before making long-term
loans.
Using a dataset containing information on 495 syndicated loan tranches to project
companies located in 61 different countries, I test whether syndicate composition is
related to a country’s legal and financial systems and whether syndicate composition, in
turn, affects loan pricing. In particular, I test three hypotheses. First, is funding by
foreign banks positively related to the strength of creditor rights and the efficiency of
local enforcement? Second, is funding by foreign banks negatively related to a country’s
level of financial development? And third, are loan spreads positively related to the
fraction of funds provided by foreign banks?
Regarding the first two hypothesis, I find that syndicate composition is a function
of a country’s legal environment and its financial development. Foreign banks provide a
larger share of funds in countries with stronger creditor rights and better enforcement.
For example, foreign banks hold 20-30% more of the total loan tranche in absolute terms
in common law countries—I assume, based on LLSV’s (1998) analysis, that common law
legal systems provide creditors with stronger legal rights. In terms of the legal
enforcement, foreign banks hold 35% more of the loan tranche in countries with stronger
enforcement, defined as a move across the inter-quartile range of the Berkowitz, Pistor
and Richard’s (2003, hereafter BPR) legality index. Turning from the legal to the
financial system, foreign banks provide a smaller share of funds in countries with well-
developed financial systems. Finally, regarding the third hypothesis, I show that loan 3 Rajan (1992) highlights the disadvantages of bank control, namely the danger of getting locked into
banking relationships. Because project finance involves a one-time transaction rather than an on-going relationship, and involves multiple rather than single creditors, concerns regarding lock-in are less relevant in this setting. Sponsors that repeatedly use project finance may be more susceptible to this phenomenon, but the mandate process usually ensures that many banks submit offers (see Esty 2001).
4 Even in 2001, a record year for project bond issuance, they accounted for only 19% of total project debt ($25 billion out of $133.5 billion; see Esty, 2002).
3
spreads are positively related to the fraction of funds provided by foreign banks: for each
incremental 10% of the total tranche provided by foreign banks, borrowers pay
approximately 7 basis points more per year in loan spread. Viewed collectively, these
results establish a link between both legal and financial systems and real economic
activity, namely the financing of large capital investments. Sponsoring firms must resort
to costly foreign capital when financing projects in countries with weak legal systems,
poor enforcement, and less-developed financial systems.
This paper is organized in four sections. The next section provides background
information on syndicated lending and describes the primary hypotheses tested later in
the paper. Section II describes the dataset and provides univariate analysis of the key
variables. The dataset is essentially the same one used by Esty and Megginson (2003)
with additional data on lender nationality and indicators of financial system development.
I test the hypotheses and present the results in Section III. Finally, I conclude in Section
IV.
I. Background and Hypotheses
As background for the empirical analysis, I need to establish some basic facts and
terminology about syndicated lending. A bank syndicate is a collection of banks that
jointly extends a loan to a specific borrower (see Esty, 2001, for a more detailed
description of the syndication process.) Syndication differs from a loan sale because it
involves a direct contract between each syndicate bank and the borrower (see Pennachi,
1988, for a description of loan sales). Lending syndicates resemble pyramids with a few
arranging banks (arrangers) at the top and many providing banks (providers) at the
bottom. Prior to closing a loan, the arranging (or mandated) banks meet with the
borrower, assess the credit quality, negotiate key terms and conditions, and prepare an
information memorandum for providing banks. Once the key terms are in place, the
arranging banks invite other banks, both domestic and foreign, to participate in the deal
and allocate shares to the participating banks as they see fit. The syndication process
4
allows me to assume that syndicate structure is endogenously determined in response to
project and country characteristics (e.g. the country’s legal and financial systems).
In the empirical section of this paper, I analyze syndicate structure and use it to
draw inferences about the importance of legal and financial systems. In particular, I test
three hypotheses. The first two hypotheses analyze the relationship between syndicate
composition, defined as the fraction of foreign banks by number and by dollar share, and
a country’s legal and financial systems. The third hypothesis tests whether loan pricing is
a function of syndicate composition. The three hypotheses are:
H1: Foreign bank participation is positively related to the strength of creditor rights and enforcement.
H2: Foreign bank participation is negatively related to financial development. H3: After controlling for legal risk (rights and enforcement) and other loan
characteristics, loan spreads are positively related to the share held by foreign banks
As noted by Esty and Megginson (2003), project companies are a particularly
appropriate setting in which to test for a relation between legal risk, defined as the
strength of creditor rights and the reliability of legal enforcement, and lending activity
because they are, essentially, a bundle of contractual agreements. In fact, some people
refer to project finance as “contract finance.” Prior to financing a project company,
sponsoring firms sign contracts with construction firms, suppliers, customers, and host
governments. Lenders, on the other hand, negotiate commitment letters, collateral
packages, and loan documents with project companies, and inter-creditor agreements
among themselves. Typically, New York or UK law governs the financing contracts. In
contrast, the operating contracts and the enforcement of security provisions (e.g., seizure
of collateral upon default) depend on the legal system in the country where the project is
located.
In practice, countries vary considerably in terms of the rights they afford creditors
and the efficiency with which they enforce contractual provisions and protect property
rights. For example, there is a well-documented difference between civil law and
common law jurisdictions in terms of investor protection. Coffee (2000) and Beck et al.
5
(2002) argue that common law systems provide greater flexibility to address new or
unforeseen situations than civil law systems do because they are restricted to the existing
body of laws. Consistent with this argument, LLSV (1998) show that common law
countries provide stronger legal protection for both shareholders and creditors.
In the context of project finance, Hoffman (1998, pp. 76-77) argues that common
law countries provide greater leeway in the types of collateral that can be seized in
default and the types of liens that can be placed on assets.5 For similar reasons, Walsh
(1999, p. 125) concludes, “…civil law jurisdictions restrict the security rights available to
project lenders…In contrast to the civil law, the common law offers a far more expedient
approach to securing assets.” As an example, civil law countries generally forbid
“floating liens,” do not permit mortgages to be registered in a foreign currency, and
forbid foreign entities—including foreign banks—from operating or purchasing
foreclosed assets.6 Penrose and Rigby (2000, p. 60), two analysts in Standard and Poor’s
project finance/infrastructure finance group, note:
“In many countries, the notion of contract supported debt remains a novelty. Little case law or civil law, for instance, exists to support the assignment of contracts to lenders as collateral. The legal system may not support the Western-style contracts so typical in project finance.”
Similarly, there is wide disparity across countries in the degree to which they
enforce legal contracts. Before they agree to invest, creditors must ensure they have
rights and that they are enforceable in the host country. According to Moody’s (2001, pp.
47, 48):
Project finance is typically a pyramid of contracts. In many countries, investors simply do not know if these contracts will be upheld as legal, binding, or enforceable …these contracts are worth little more than the paper on which they are written if the host country’s legal and political system cannot guarantee that they will be consistently enforced.
5 Kolo and Wälde (2000) also argue that common law systems provide stronger protection and less
opportunity for ex post renegotiation than civil law systems in the context of international projects. 6 When countries restrict foreign banks from holding security over project assets, the syndicate typically
includes one or more local banks and the financing documents include a pro-rated “sharing clause.” This clause says that all banks will share amounts received or recovered from the borrower in proportion to their participation in the financing (see Beenhakker,1997, p. 13).
6
Ratings analysts at Fitch (Dell et al., 2001, p. 10) and S&P (Penrose and Rigby, 2000, pp.
44-51) echo similar sentiments regarding the importance of contract enforceability while
recent academic research reinforces the relation between judicial efficiency and well-
functioning credit markets (see Johnson et al., 2002; Djankov et al., 2003; Giannetti,
2003; and Jappelli, Pagano, and Bianco, 2002). If capital providers cannot rely on
consistent and predictable enforcement of contract law, then they will be reluctant to
invest particularly over the long-term.
At first blush, these arguments about legal rights and enforcement could apply
equally to both domestic and foreign banks. I believe, however, they are more important
for foreign banks for several reasons. First, domestic banks do not always have access to
foreign borrowers or the skill to underwrite foreign credits. Instead, they may be forced
to make local loans and, to the extent they have excess funds available, then look abroad
for additional lending opportunities. Foreign banks, by way of contrast, are making the
choice to lend abroad. Second, withholding taxes and many political risks such as
currency inconvertibility do not apply to local lenders. Third, there is an on-going debate
and an unresolved empirical question in the field of project finance regarding whether
foreign or domestic banks are more susceptible to expropriation. On the one hand,
Hoffman (1998, p. 109), Finnerty (1996, p. 47), and others argue that host governments
are less likely to expropriate their own banks. On the other hand, Moran (1973, pp. 284-
85), Clifford Chance (1991, p. 8), and Beenhakker (1997, pp. 7, 13) argue that syndicates
comprised of foreign lenders provide a stronger deterrent against expropriation by raising
the cost of adverse sovereign intervention. The idea is that governments will protect their
banks and will retaliate against an expropriating country through international trade, aid,
and political pressure. Holding expropriation risk constant, I assert that bankers will be
more willing to lend to a project company located in a country with stronger creditor
rights and better legal enforcement. Conversations with bankers and lawyers who
specialize in project finance support this assertion. It is important to recognize that I test
for a relation between legal rules and foreign bank participation, but do not test whether
syndicate composition does, indeed, deter adverse sovereign intervention.
7
The second hypothesis, the existence of a negative relation between foreign bank
participation and financial development, is more straightforward. At a very basic level, a
country with no domestic financial intermediaries cannot finance domestic projects.
Such a country will be beholden to foreign financial intermediaries or the local
government for funding. Countries with large financial systems have sufficient domestic
capital to fund most projects even though they could benefit from the competition
introduced by foreign financial intermediaries. Bencivenga and Smith (1991, p. 195)
present a model that is consistent with the idea that the development of financial
intermediaries “…shifts the composition of domestic savings toward capital, causing
intermediation to be growth promoting.”
There are other information-based and currency-based reasons to expect a
negative relation between financial development and foreign bank participation. In both
debt and equity markets, investors exhibit a “home bias”, preferring to invest in nearby
rather than distant assets (see Coval and Moskowitz, 1999, in the context of equities and
Petersen and Rajan, 2002, in the context of bank lending). The rationale is that
asymmetric information between local and non-local investors drives the preference for
geographically proximate assets. Although this argument may be less applicable to large,
tangible capital investments (i.e., the projects in my sample), the availability of
information is greater and the ability to monitor project performance is nevertheless
easier for domestic lenders given their proximity to the project itself. One might also
expect greater domestic bank participation as a way to avoid currency risks. Assuming a
loan is made in the local currency, foreign banks will not be able to hedge against
currency fluctuations and/or convertibility risks unless a country has large, liquid capital
markets. While it is true that the local office of a foreign bank may raise and invest local
funds, it must still convert and repatriate profits at some point in the future. For these
reasons, I expect to find a negative relation between financial development and foreign
bank participation.
The third hypothesis, there is a positive relation between loan spreads and foreign
bank participation, is based on two arguments. First, the presence of foreign banks could
indicate an absence of lending capacity in the home country. Recognizing the limited
capacity, foreign banks with specialized skills in cross-border lending agree to enter the
8
market, but must be induced to do so with additional compensation given their
informational disadvantages. A second rationale, in line with the arguments described
earlier, is that foreign banks may actually provide deterrence benefits against sovereign
intervention. If true, the positive relation between loan pricing and foreign bank
participation could simply be compensation for greater deterrence benefits. The
deterrence argument can be true even if foreign banks are treated unequally and unfairly
if something goes wrong—they may just lower the probability of something bad
happening to the project.
The arguments against finding a positive relationship between loan pricing and
syndicate composition are based on credit rationing and lending competition. Stiglitz and
Weiss (1981) show that when banks use prices rather than quantities to ration credit, they
can induce incentive problems, notably adverse selection. As a result, foreign banks may
prefer to ration credit rather than to increase loan spreads. At the same time, loan pricing
may simply reflect competitive dynamics. If true, then greater foreign participation may
simply reflect more competitive pressure during the bidding process to win syndication
mandates, and could even result in a negative relationship (i.e., greater foreign bank
participation results in lower spreads). Pricing, however, is only one of several criteria
used by borrowers when they select lead arrangers. Project sponsors are also interested
in execution speed, willingness to underwrite the entire deal (fully underwritten vs. best
efforts deals), covenant restrictions, and lending expertise.7 Failure to find a positive
relation between loan spreads and syndicate composition could, therefore, occur for
several reasons.
In summary, there are theoretical arguments supporting each of the three
hypotheses. There are, however, valid arguments against each of them, as well. For this
reason, I leave it up to the data to determine the answers.
II. Data
7 Esty (2001) describes the syndication of the Hong Kong Disneyland project loan in which Disney
awarded the mandate to Chase based on a “competitively priced”, though not necessarily the lowest-priced bid. Flexibility on key covenants was an equally important selection criterion.
9
I use four types of data in this study: data on syndicated loans, legal systems,
financial development, and sovereign risk. The sample of syndicated loans comes from
Dealogic’s (formerly CapitalData) Loanware database and is an expanded version of the
database Esty and Megginson (2003) use to study the relation between legal risk and debt
ownership concentration. The Loanware database contains information on more than
85,000 syndicated loan tranches made between 1980 and April 2000. It provides detailed
information on loan tranches, yet it provides little on the borrowing entities (the project
companies), sponsoring firms (the equity investors), or lenders.
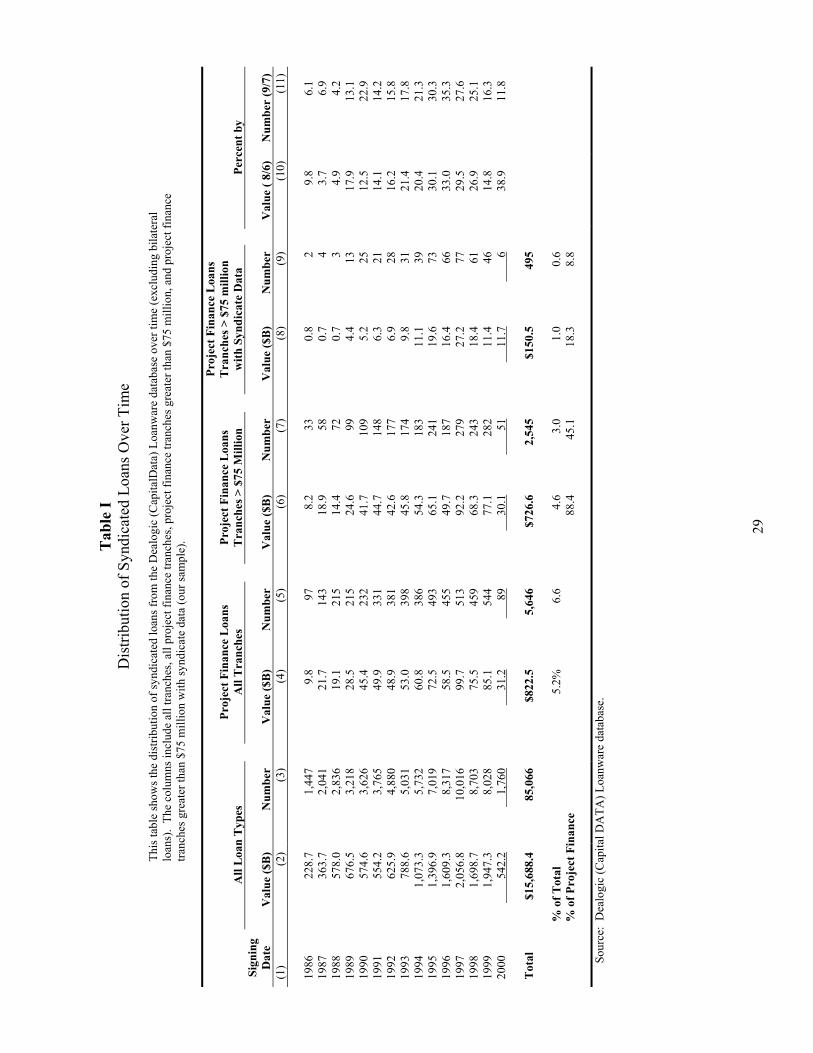
The full database contains 5,646 loan tranches designated as project finance loans
(see Table I). After excluding the smallest tranches—those less than $75 million—and
tranches lacking complete syndicate share information—the amount held by each bank in
the syndicate—the dataset contains 495 tranches from 61 different countries. I focus on
larger tranches because they have more complex syndicate structures and because I am
interested in the financing of large assets. According to Esty and Megginson (2003), the
495 included observations are not statistically different from the excluded observations in
terms of financing dates, maturity, or sovereign risk (rating). All of the loans closed
between 1986 and 2000, though the majority of the tranches are fairly evenly spread
between 1990 and 1999. In terms of geographic distribution, U.S. loans comprise the
largest fraction of the total sample (15.2%), followed by the UK (9.5%), Australia
(6.7%), Indonesia (6.1%), China (5.7%), and Taiwan (5.1%). All other countries
represent less than 5% of the total sample size by number. Because the unit of
observation is a loan tranche, multiple tranches from the same loan appear as separate
observations in the database—there are 468 distinct loans, 22 of which have multiple
tranches in the dataset (446 loans have a single tranche while 22 loans account for 49
tranches). Thus, most observations are independent observations.
**** Insert Table I here ****
For each bank in the syndicate, I identify the nationality of its head office using
The Bankers Almanac World Ranking 2000, and then calculate the number of foreign
banks, the total share provided by all foreign banks, and the average share per foreign
10
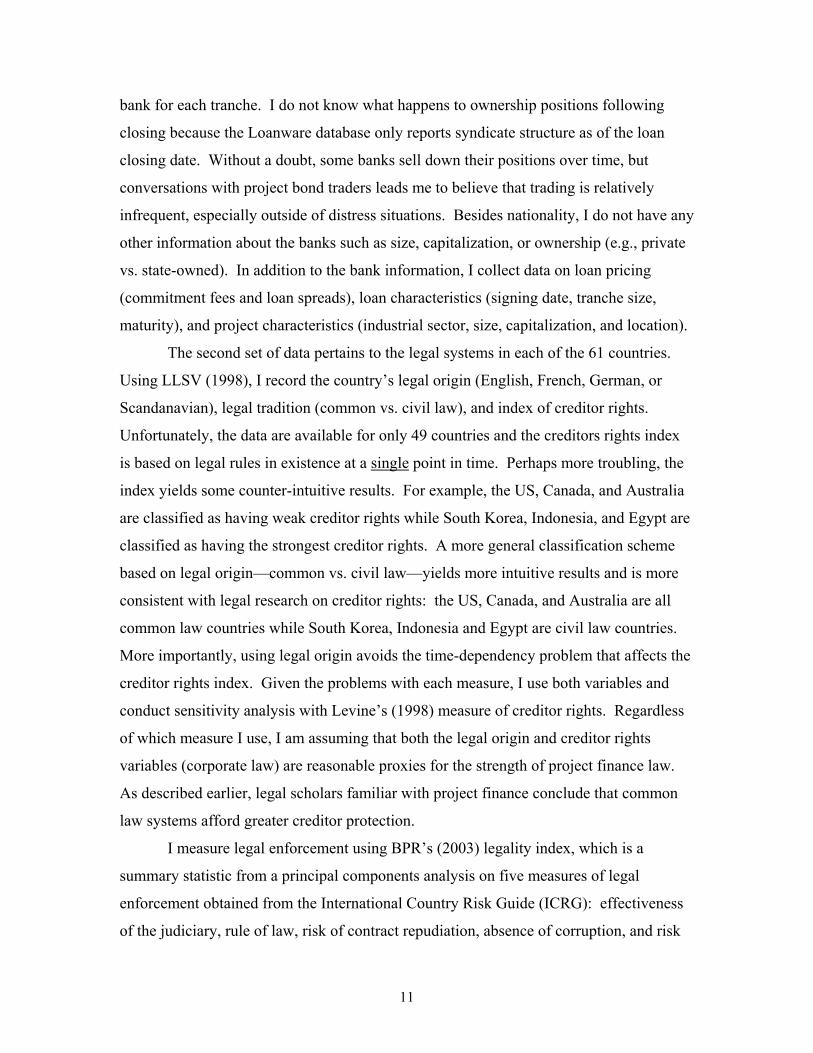
bank for each tranche. I do not know what happens to ownership positions following
closing because the Loanware database only reports syndicate structure as of the loan
closing date. Without a doubt, some banks sell down their positions over time, but
conversations with project bond traders leads me to believe that trading is relatively
infrequent, especially outside of distress situations. Besides nationality, I do not have any
other information about the banks such as size, capitalization, or ownership (e.g., private
vs. state-owned). In addition to the bank information, I collect data on loan pricing
(commitment fees and loan spreads), loan characteristics (signing date, tranche size,
maturity), and project characteristics (industrial sector, size, capitalization, and location).
The second set of data pertains to the legal systems in each of the 61 countries.
Using LLSV (1998), I record the country’s legal origin (English, French, German, or
Scandanavian), legal tradition (common vs. civil law), and index of creditor rights.
Unfortunately, the data are available for only 49 countries and the creditors rights index
is based on legal rules in existence at a single point in time. Perhaps more troubling, the
index yields some counter-intuitive results. For example, the US, Canada, and Australia
are classified as having weak creditor rights while South Korea, Indonesia, and Egypt are
classified as having the strongest creditor rights. A more general classification scheme
based on legal origin—common vs. civil law—yields more intuitive results and is more
consistent with legal research on creditor rights: the US, Canada, and Australia are all
common law countries while South Korea, Indonesia and Egypt are civil law countries.
More importantly, using legal origin avoids the time-dependency problem that affects the
creditor rights index. Given the problems with each measure, I use both variables and
conduct sensitivity analysis with Levine’s (1998) measure of creditor rights. Regardless
of which measure I use, I am assuming that both the legal origin and creditor rights
variables (corporate law) are reasonable proxies for the strength of project finance law.
As described earlier, legal scholars familiar with project finance conclude that common
law systems afford greater creditor protection.
I measure legal enforcement using BPR’s (2003) legality index, which is a
summary statistic from a principal components analysis on five measures of legal
enforcement obtained from the International Country Risk Guide (ICRG): effectiveness
of the judiciary, rule of law, risk of contract repudiation, absence of corruption, and risk
11
of expropriation. The index runs from 8.51 for the Philippines to 21.91 for Switzerland,
and covers the same 49 countries in the LLSV (1998) analysis—the values represent
averages of monthly ratings over the period from 1980 to 1995, roughly corresponding to
my sample period of 1986 to 2000. Knack and Keefer (1995) show that these ICRG
variables provide greater explanatory power than other sovereign and legal risk measures.
Nevertheless, other authors have used different measures of legal enforcement. For
example, Demirgüç-Kunt and Maksimovic (1998 and 1999) use a “Law & Order”
variable while Levine (1998) uses an average of the rule of law and the risk of contract
repudiation, two factors contained in the more comprehensive legality index created by
Berkowitz, Pistor, and Richard. I test the robustness of my results using these different
enforcement indicators and, for the most part, the results hold due to the high
correlations—above 90%—between these variables and the BPR legality index.
Appendix 1 shows that my sample contains significant cross-sectional heterogeneity in
terms of legal systems and enforcement.
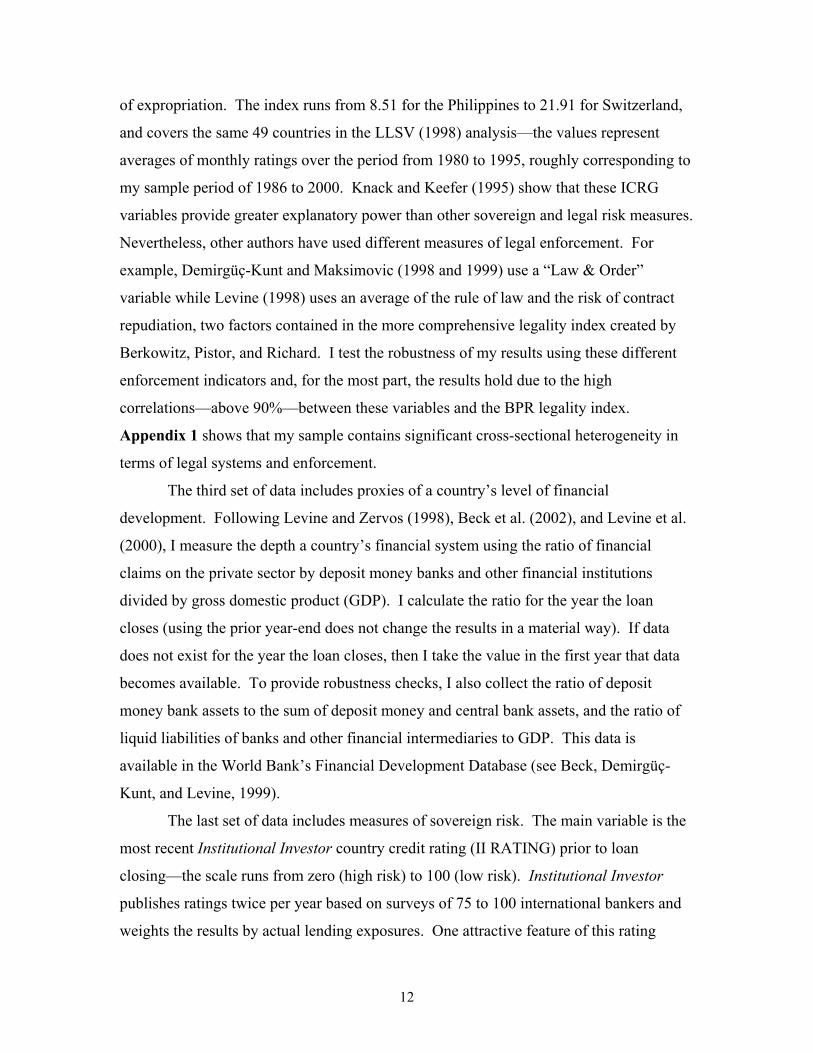
The third set of data includes proxies of a country’s level of financial
development. Following Levine and Zervos (1998), Beck et al. (2002), and Levine et al.
(2000), I measure the depth a country’s financial system using the ratio of financial
claims on the private sector by deposit money banks and other financial institutions
divided by gross domestic product (GDP). I calculate the ratio for the year the loan
closes (using the prior year-end does not change the results in a material way). If data
does not exist for the year the loan closes, then I take the value in the first year that data
becomes available. To provide robustness checks, I also collect the ratio of deposit
money bank assets to the sum of deposit money and central bank assets, and the ratio of
liquid liabilities of banks and other financial intermediaries to GDP. This data is
available in the World Bank’s Financial Development Database (see Beck, Demirgüç-
Kunt, and Levine, 1999).
The last set of data includes measures of sovereign risk. The main variable is the
most recent Institutional Investor country credit rating (II RATING) prior to loan
closing—the scale runs from zero (high risk) to 100 (low risk). Institutional Investor
publishes ratings twice per year based on surveys of 75 to 100 international bankers and
weights the results by actual lending exposures. One attractive feature of this rating
12
system is that it provides a forward-looking estimate of sovereign debt capacity and
repayment probabilities. As a word of caution, this rating is an inverse measure of risk
so that high ratings correspond to low risk. As a further proxy for lending conditions in
emerging market countries, I use JP Morgan’s Emerging Market Bond Index of sovereign
spreads. This index measures the spreads on emerging market bonds and provides a
composite view of investor sentiment regarding emerging market investments.
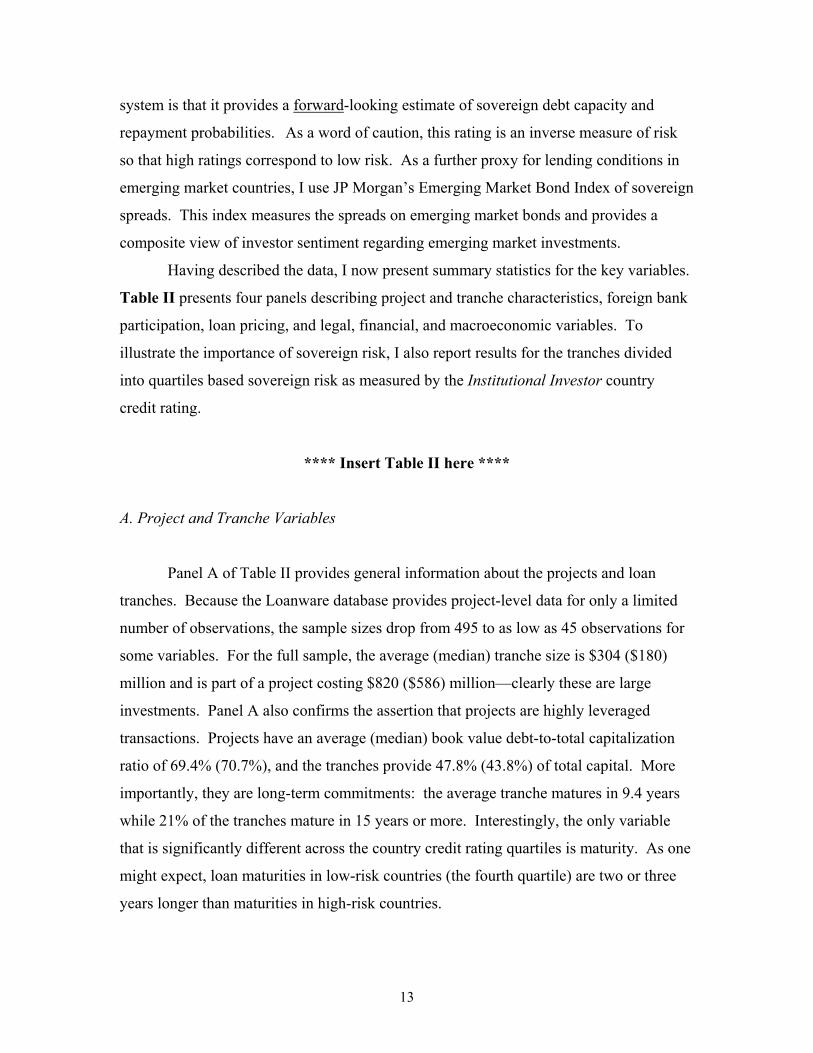
Having described the data, I now present summary statistics for the key variables.
Table II presents four panels describing project and tranche characteristics, foreign bank
participation, loan pricing, and legal, financial, and macroeconomic variables. To
illustrate the importance of sovereign risk, I also report results for the tranches divided
into quartiles based sovereign risk as measured by the Institutional Investor country
credit rating.
**** Insert Table II here ****
A. Project and Tranche Variables
Panel A of Table II provides general information about the projects and loan
tranches. Because the Loanware database provides project-level data for only a limited
number of observations, the sample sizes drop from 495 to as low as 45 observations for
some variables. For the full sample, the average (median) tranche size is $304 ($180)
million and is part of a project costing $820 ($586) million—clearly these are large
investments. Panel A also confirms the assertion that projects are highly leveraged
transactions. Projects have an average (median) book value debt-to-total capitalization
ratio of 69.4% (70.7%), and the tranches provide 47.8% (43.8%) of total capital. More
importantly, they are long-term commitments: the average tranche matures in 9.4 years
while 21% of the tranches mature in 15 years or more. Interestingly, the only variable
that is significantly different across the country credit rating quartiles is maturity. As one
might expect, loan maturities in low-risk countries (the fourth quartile) are two or three
years longer than maturities in high-risk countries.
13
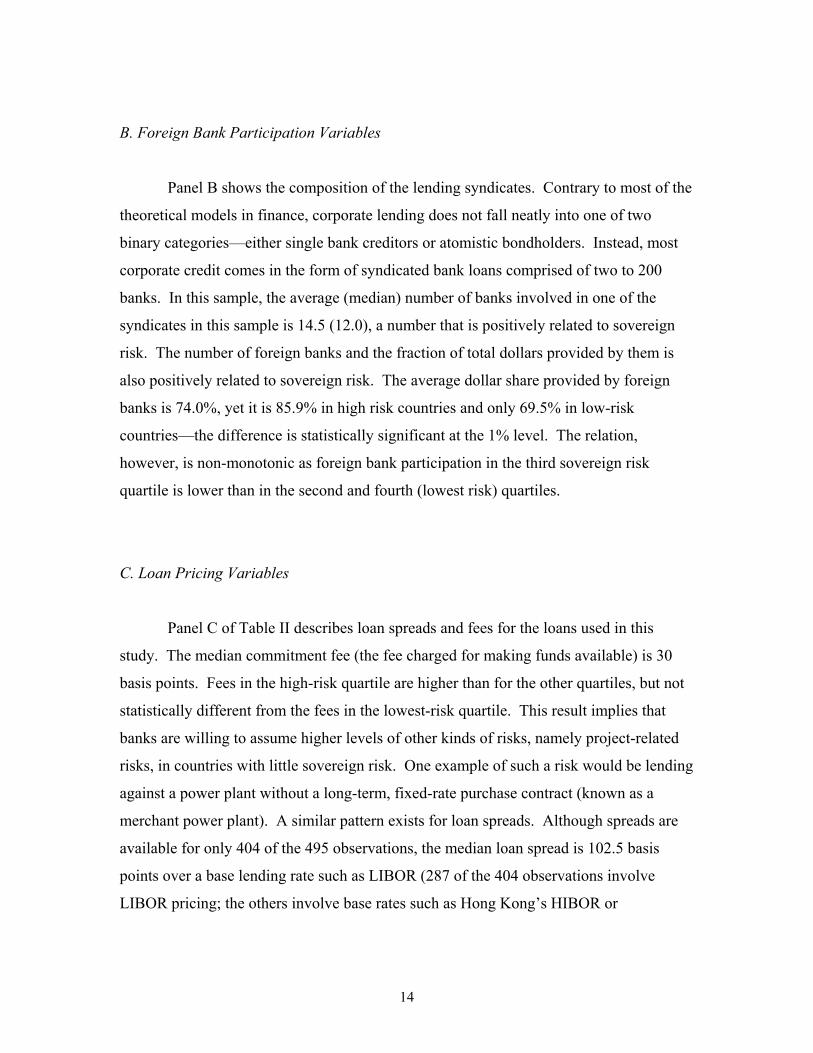
B. Foreign Bank Participation Variables
Panel B shows the composition of the lending syndicates. Contrary to most of the
theoretical models in finance, corporate lending does not fall neatly into one of two
binary categories—either single bank creditors or atomistic bondholders. Instead, most
corporate credit comes in the form of syndicated bank loans comprised of two to 200
banks. In this sample, the average (median) number of banks involved in one of the
syndicates in this sample is 14.5 (12.0), a number that is positively related to sovereign
risk. The number of foreign banks and the fraction of total dollars provided by them is
also positively related to sovereign risk. The average dollar share provided by foreign
banks is 74.0%, yet it is 85.9% in high risk countries and only 69.5% in low-risk
countries—the difference is statistically significant at the 1% level. The relation,
however, is non-monotonic as foreign bank participation in the third sovereign risk
quartile is lower than in the second and fourth (lowest risk) quartiles.
C. Loan Pricing Variables
Panel C of Table II describes loan spreads and fees for the loans used in this
study. The median commitment fee (the fee charged for making funds available) is 30
basis points. Fees in the high-risk quartile are higher than for the other quartiles, but not
statistically different from the fees in the lowest-risk quartile. This result implies that
banks are willing to assume higher levels of other kinds of risks, namely project-related
risks, in countries with little sovereign risk. One example of such a risk would be lending
against a power plant without a long-term, fixed-rate purchase contract (known as a
merchant power plant). A similar pattern exists for loan spreads. Although spreads are
available for only 404 of the 495 observations, the median loan spread is 102.5 basis
points over a base lending rate such as LIBOR (287 of the 404 observations involve
LIBOR pricing; the others involve base rates such as Hong Kong’s HIBOR or
14
Singapore’s SIBOR, etc.) As one might expect, the loan fees and spreads are highest in
the most risky countries, but again the relationship is non-monotonic.
D. Legal Risk, Financial Development, and Sovereign Risk Variables
Panel D of Table II presents descriptive statistics for the legal risk, financial
development, and sovereign risk variables. The LLSV (1998) creditor rights index shows
that the average (median) score is 2.4 (2.0) on a scale from 0 (weak) to 4 (strong).
Because it is available for only 49 countries, it covers only 406 of the tranches. It does
not cover countries like China or any of the socialist countries. The BPR legality index
has an average score of 17.5 and a standard deviation of 4.0, which indicates there is
significant cross-sectional heterogeneity within the sample in terms of enforcement.
Legality is highly positively correlated with country risk: low legality indices occur in
countries with high risk (low II RATINGs). Similarly contract repudiation and
expropriation risk are highly, positively correlated with country credit ratings. These
variables come from International Country Risk Group (ICRG), appear in LLSV 1998),
and are averages of the monthly scores from 1982 to 1995.
I measure financial development using three variables: private credit as a percent
of GDP, liquid liabilities as a % of GDP, and deposit bank assets as a percent of total
bank assets (deposit plus central bank assets). The private credit measure exhibits the
greatest cross sectional heterogeneity, particularly at either end of the country credit
rating spectrum. The high-risk countries exhibit the least amount of depth (the private
credit ratio equals 40.4%) while the low-risk countries exhibit the most depth (the ratio
equals 140.4%).
In terms of sovereign risk, the average tranche is in a country with an II RATING
of 68.5. For purposes of comparison, New Zealand, Iceland, and the United Arab
Emirates had 1999 II RATINGs of 74.0, 67.8, and 63.2, respectively. More than 10% of
the tranches are in countries with risk ratings below 44.0; Egypt (45.4), India (44.3) and
Argentina (42.4) had 1999 II RATINGs at this level. The second measure of sovereign
risk, or investor sentiment regarding emerging market countries, is the JP Morgan
15
Emerging Market Bond Index (EMBI). The average spread at the time the deals closed
was 808 basis points. With a standard deviation of 289.6 basis points, there is
considerable time-series variation over the sample period.
Compared to Kleimeier and Megginson’s (2000, see Table 4) more general
analysis of “high information” project finance loans contained in the Loanware database,
my sample contains larger tranches ($304 million vs. $177 million), with slightly longer
average maturities (9.4 vs. 8.6 years), with an equal number of syndicate banks (14.5
banks), and with slightly higher sovereign risk (II RATING of 68.5 vs. 74.6).8 In terms
of pricing, this sample has a lower average spread (122.8 vs. 130.0 basis points) and
lower average commitment fees (31.9 vs. 36.9 basis points). Not having access to their
sample, I cannot test the statistical significance of any of these differences. With the
exception of size, however, the differences are not large, which provides some support
for the assertion that sample selection biases are not affecting these results. The
difference in size can be explained by the fact that I include only tranches greater than
$75 million.
III. Empirical Analysis
As described in the introduction, I conduct the empirical analysis in two parts.
The first part analyzes whether syndicate composition (i.e., foreign bank participation) is
a function of legal and financial systems—hypotheses H1 and H2. The dependent
variables are the total dollar share of the tranche provided by foreign banks, the average
share held by a foreign bank, and the number of foreign banks. Because the share
variables are bounded by zero below and by one above, I use a Tobit regression
specification and report the results in Table IV below. Similarly, the regression using the
number of foreign banks as the dependent variable is bounded below by a minimum of
two banks (a syndicate, by definition, requires at least two banks). 8 Project loans are very different from general-purpose corporate loans, the most common type of loan in
the Loanware database. According to Kleimeier and Megginson (2000), project finance loans are larger ($177 million vs. $131 million), have longer maturities (8.6 vs. 4.6 years), have more syndicate members (14.5 banks vs. 9.4 banks), and are located in riskier countries (II Rating of 74.6 vs. 87.3). All of these differences are statistically significant at the 5% level.
16
The second part analyzes whether syndicate composition affects loan pricing.
This analysis, designed to address hypothesis H3, differs from the Tobit regression
analysis in several important ways. Given the endogenous nature of specific loan
characteristics and pricing, I estimate a recursive system of equations using three stage
least squares (3SLS) and three independent variables: loan pricing (spread), tranche
maturity, and foreign bank dollar share. Of these variables, I am particularly interested in
loan pricing and whether it is a positive function of foreign bank participation, as
predicted.
The independent variables fall into three categories: loan/tranche variables, legal
and financial system variables, and sovereign risk variables. The loan/tranche variables
include the tranche SIZE (natural log of the size in millions) and MATURITY (in years).
In addition, there are two dummy variables. I include a DOMESTIC CURRENCY
dummy variable, which equals one for tranches in the local currency and zero otherwise,
to account for hedging motivations and currency risk exposure. Because foreign banks
will be more exposed to domestic currency exchange rate fluctuations, convertibility
regulations, and repatriation regulations, they will be more reluctant to take foreign
currency exposure, ceteris paribus. For this reason, I expect the domestic currency
dummy variable will have a negative coefficient. The other dummy variable accounts for
the presence of a multi-lateral or bi-lateral agency such as the International Finance
Corporation (IFC) or the U.S. Export-Import Bank (U.S. Exim—an export credit agency)
in the deal. These agencies help facilitate lending in high-risk settings and help deter
sovereign interference. Their involvement not only suggests a higher level of ex ante
sovereign risk, it also indicates a lower level of ex post project risk, all else equal.
Because they participate as equity investors, lenders, and guarantors, I measure their
participation in a binary fashion (present/not present) rather than in degree (e.g. fraction
of total capital). The AGENCY PARTICIPATION dummy variable equals one if one or
more of these agencies participates in the deal in some capacity, and zero otherwise. I
expect the coefficient on this variable to be positive because multi-lateral agencies reduce
sovereign risk and protect contractual agreements, thereby making it more attractive for
foreign banks to participate in the syndicate.
17
I also include a LOAN PRICING RESIDUAL variable to control for unobserved
project risk. I do not include information on the sponsors due to the nonrecourse nature
of the loan nor do I include other project characteristics that could clearly be relevant.
For example, whether a project contains a long-term purchase contract or a fixed-price
construction contract (or both) has a major effect on the overall level of risk, assuming
creditworthy counterparties. Unfortunately, the Loanware database does not include this
information nor can I obtain it from the proprietary loan documents supporting each deal.
The fact that most project companies are private (not listed) firms severely hinders data
collection of this kind. To address this problem, I create a new variable using the loan
spread to measure residual project risk. First, I regress the loan spread on all of the
independent variables using an OLS specification (results not shown), and then calculate
a LOAN PRICING RESIDUAL for use in the Tobit regressions on syndicate
composition. The idea is that the regression residual will be a proxy for unobserved
project risk with positive residuals indicating higher project risk.
The legal system variables cover both creditor rights and enforcement. I measure
creditor rights using LLSV’s (1998) CREDITOR RIGHTS index as well as legal origin.
I expect lower foreign bank participation in countries with civil law traditions and weaker
creditor rights (i.e. low scores LLSV creditor rights index). Equivalently, I test for higher
foreign bank participation using a COMMON LAW dummy variable. Again, I expect to
see a positive coefficient on this variable. Finally, I measure the strength of a country’s
legal system using BPR’s LEGALITY index. In countries with better legal protection
improves, I expect to see higher foreign bank participation
Having already described the financial development and sovereign risk variables,
I briefly review them here along with empirical predictions on each. PRIVATE
CREDIT, per hypothesis H2, should be negative: foreign bank participation should be
lower in countries with better-developed financial systems. I use II RATING, II
RATING SQUARED (to detect non-linear relationships between syndicate composition
and sovereign risk), and the JP MORGAN EMBI to measure investor sentiment in
emerging markets. I expect foreign bank participation to be lower when sovereign risk is
high. In other words, II RATING and JP MORGAN EMBI both should have negative
coefficients.
18
One potential complication with this specification is the known positive relation
between investor protection and financial development (see LLSV, 1997; and Levine,
1999). Table III presents the simple correlations between the key variables used in this
study. It shows that the correlation between the LLSV CREDITOR RIGHTS and the
FOREIGN BANK PERCENT variables is 0.15, the correlation between the PRIVATE
CREDIT and the FOREIGN BANK PERCENT variables is -0.23; and the correlation
between the LLSV CREDITOR RIGHTS and the PRIVATE CREDIT variables is 0.01.
Thus, the direct correlations between creditor rights or financial development and foreign
bank participation are much stronger than the indirect connection from investor
protection to foreign bank participation via financial development. Although my basic
specification includes both creditor rights and financial development as independent
variables, I also run the analysis with each of the variables alone and with neither of
them. The basic results hold in all cases (some but not all of these results are shown in
Table IV).
**** Insert Table III here ****
A. Syndicate Composition
Table IV presents the results from the Tobit regressions on the relation between
syndicated composition, legal systems, and financial development. Unfortunately, data
restrictions reduce the sample size from 495 tranches to approximately 282 to 356
tranches depending on the regression specification. I am unable to detect statistical
differences between any of the key variables (e.g., tranche SIZE, BPR LEGALITY, II
RATING, etc.) when I compare the excluded tranches against the 356 include tranches.
Despite the reduction in sample size, the regressions explain a large amount of the
variation in syndicate composition: all of the Chi-squared statistics are significant at the
1% level.
**** Insert Table IV here ****
19
Looking first at the dollar share regressions (regressions #1 through #4) and the
legal system variables, there is strong support for hypothesis H1: foreign banks provide a
larger share of funds in countries with stronger creditor rights and with stronger
enforcement. Both measures of creditor rights (high values on the LLSV CREDITOR
RIGHTS INDEX or the COMMON LAW dummy variable) are significant at the 1%
level in regressions #1 through #4—they are also individually significant when I run the
regressions without BPR LEGALITY or PRIVATE CREDIT (not shown). In terms of
magnitude, foreign banks hold 22% more (= 4 * 0.055, from regression #1) in countries
with strong creditor rights (LLSV creditor rights index equals 4) than in countries with
weak creditor rights (LLSV index equals 0). Considering that foreign banks hold 74% of
the tranches on average (see Panel B of Table II), this number is quite large. In addition,
foreign banks hold 31.8% to 38.6% (regressions #2 and #3, respectively) more in
countries with common law legal systems. Again, the magnitudes of these coefficients
are both statistically and economically significant.
The BPR LEGALITY index is significant in regressions #1 and #4, as well as
when it is included by itself without measures of creditor rights or financial development
(not shown). The high degree of correlation between the legal system variables (common
law countries tend to have stronger enforcement) partially explains the loss in
significance in regressions #2 and #3. In terms of magnitude, moving from a country like
Turkey with a legality index rating of 11.84 to a country like Australia with a rating of
20.44 (the inter-quartile range) increases foreign bank participation by 35.3% [= (20.44 –
11.84) * 0.041, from regression #1]. This difference represents 48% of the average share
held by foreign banks in all deals (= 35.3% / 74.0%).
Consistent with hypothesis H2, the prediction that there is a negative relation
between financial development and foreign bank participation, I find that PRIVATE
CREDIT has a negative and significant coefficient in all regressions. The magnitude of
the coefficient varies, but is on the order of –0.135 to -0.335 (the average across
regressions #1 to #4 is –0.234). Once again using Turkey (with PRIVATE CREDIT
equal to 10-15% during my sample period) and Australia (with PRIVATE CREDIT equal
to 80-90% during my sample period) as an example, foreign banks will hold 16% less of
20
the loan tranche in Australia [= (85% - 15%) * -0.234]. While not quite as large as the
legal system effects, it is nevertheless an economically significant difference in
composition resulting from differences in the depth of the local banking market. In other
words, where the local banking market is deep, domestic banks supply a larger fraction of
the funds, consistent with the results in Table II.
As for the other variables, the DOMESTIC CURRENCY dummy variable is
negative, significant, and large. This finding implies that foreign banks are less willing to
fund loan tranches with currency risk. The AGENCY PARTICIPATION dummy
variable is positive and marginally significant indicating that foreign banks provide a
larger share of tranches when protected by the presence of multi-lateral and bi-lateral
agencies. When included in the regression (e.g. regressions #3 and #4), the LOAN
PRICING RESIDUAL is negative and significant. This result is consistent with foreign
banks holding smaller shares of riskier loan tranches, assuming this variable is a valid
proxy for unobserved or unmeasured loan risk. Both measures of sovereign risk, II
RATING and JP MORGAN EMBI are also significant. The coefficient on the II
RATING variable is negative, but the squared term is positive indicating the relationship
is non-linear. Foreign bank participation decreases as sovereign risk decreases with an
inflection point somewhere between an II RATING of 70 and 80—this inflection point
can be seen in Panel B of Table II as well. The negative coefficient on the JP MORGAN
EMBI implies that foreign bank participation falls when emerging market spreads widen.
Alternatively, foreign banks are less likely to lend when emerging market risk is high.
Finally, the sector dummy variables are jointly significant in all regressions.
Regressions #5 (average foreign bank share9) and #6 (number of foreign banks)
provide additional insight into these results. As one might predict, the number of foreign
banks increases and their average share falls as tranche size increases. Banks, in general,
are not willing to hold very large positions. In fact, using data from Table II, the dollar
value of the median foreign bank share is $14 million (= $180.0 million median tranche
size * 7.8% median foreign bank share). The number of banks and average shares are not
related to sovereign risk, but are related to the legal and financial system variables. In
9 The reason this regression has fewer observations than regression #6 is that some tranches have no foreign
banks. These tranches are included in regression #6 with a dependent value equal to zero, but are not included in regression #5.
21
countries with stronger creditor rights (i.e., common law countries), there are more
foreign banks in the syndicate and they hold larger shares, which explains why the total
dollar share held by foreign banks increases. The impact of legality is more complicated:
as legality improves, there are fewer foreign banks, but they hold much larger shares.
The net result is an increase in the fraction held by all foreign banks. Finally, as the
domestic financial system becomes stronger, more domestic (fewer foreign) banks join
the syndicate and they hold larger positions.
I check the robustness of these findings with sensitivity analysis. One concern is
that several of the explanatory variables may be endogenous. For example, maturity,
loan pricing, and agency participation are all functions of loan risk. In the next section, I
show the results hold when using a system of recursive equations. In terms of variable
selection, I obtain similar results when I use liquid liabilities as a percent of GDP and
deposit bank assets as a percent of total bank assets instead of PRIVATE CREDIT; the
Levine (1998) measures of creditor rights instead of LLSV CREDITOR RIGHTS or the
COMMON LAW dummy variable; year dummy variables instead of the JP MORGAN
EMBI; and the ICRG political risk rating instead of the II RATING. When I used the
Demirgüç-Kunt and Maksimovic’s (1998) Law and Order variable instead of the BRP
LEGALITY INDEX, however, the signs and the magnitudes of the coefficient were
similar, but the results were no longer significant. This result is somewhat surprising
given the correlation between these two variables is 0.92 according to Table III.
In addition to verifying the results with alternative variables, I also changed the
regression sample and specification. First, I ran the same regressions that appear in Table
IV, but excluded the low-risk countries (i.e. excluded countries with II RATINGs above
80 or 85) because there are many observations from the most developed countries yet
they exhibit little cross-section heterogeneity in terms of legal or financial systems. The
results did not change materially, though the sample size dropped considerably. I also
ran a fixed effects regression specification to control for the inclusion of loans with
multiple tranches. Again, the core results remain unaffected. Based on this analysis, I
conclude that my primary findings are robust to alternative variables and specifications.
22
B. Loan Pricing
To verify the results in Table IV and to test hypothesis H3—loan pricing is
positively related to foreign bank participation—I estimate a recursive system of
equations using three stage least squares (3SLS). The dependent variables are the loan
spread (in basis points), the dollar share held by foreign banks, and the tranche maturity
(in years). Essentially, I am estimating the loan pricing equation, but using instruments
for foreign bank share and maturity as the two most important endogenous variables.
**** Insert Table V here ****
The results appear in Table V. As one might expect, loan spreads fall as creditor
rights and enforcement strengthen (LLSV CREDITOR RIGHTS and BPR LEGALITY
increase). For example, as creditor rights increase from 0 (low) to 4 (high), loan spreads
fall by 31 basis points (= 4 * -7.692), which is economically significant when compared
to an average loan spread of 122.8 basis points (see Panel C of Table II). Similarly, when
enforcement improves—BPR LEGALITY increases across the inter-quartile range—loan
spreads fall by 43 basis points [= (20.44 – 11.84) * -5.009 from regression #1]. After
controlling for legal rights and enforcement, loan pricing is positively related to the share
held by foreign banks increases. In terms of magnitude, a 10% increase in foreign bank
share increases loan pricing by 7.0 basis points (= 10% * 70.28). This result is consistent
with the idea that limitations in the availability of domestic capital are costly. It is also
consistent with the idea that foreign banks are charging borrowers for and receiving
compensation for providing sovereign risk protection. Unfortunately, I cannot
discriminate between these two explanations. The primary concern with regression #1 is
that it has low explanatory power. The pseudo R-squared is approximately zero even
though several of the coefficients are individually significant and the Chi-squared statistic
is highly significant.
If I run this analysis using the COMMON LAW dummy variable instead of LLSV
CREDITOR RIGHTS, the coefficient on COMMON LAW is not significant in the
pricing regression, yet the coefficients on LEGALITY and FOREIGN BANK SHARE
23
are significant and similar in magnitude. Alternatively, if I run the regression using
Levine’s (1998) measures of enforcement and creditor rights, both are significant in the
pricing regression, but the significance of the coefficient on FOREIGN BANK SHARE
falls to 19%. Because the BPR LEGALITY index is more encompassing than Levine’s
enforcement measure, I believe it is a better proxy for legal enforcement. This analysis
shows, however, that the results depend on the particular explanatory variables used in
the regression analysis.
Among the other variables in Regression #1, tranche size is negative, but not
significant and the JP MORGAN EMBI index is positive and significant (higher spreads
when investors view conditions in emerging markets to be riskier); and the Asian crisis
time dummy variables are positive and jointly significant (higher spreads following the
Asian crisis). Neither the sovereign risk (II RATING) nor the MATURITY variables
were significant. In some ways, it is not surprising that the sovereign risk rating is not
significant. Project finance involves, to borrow Finnerty’s (1996) term, asset-based
financial engineering. Through careful structuring, sponsors are able to create entities
that have higher credit ratings than the sponsoring firms or the host countries.10
Regression #2 in Table V is similar to regression #1 in Table IV minus some of
the insignificant variables. The coefficients have similar signs, levels of significance, and
magnitudes. Because it is estimated as part of a system, it gives some confidence that the
coefficients are not biased due to endogeneity. That said, it is possible that the
DOMESTIC CURRENCY and AGENCY PARTICIPATION dummy variables are
endogenously determined and that the PRIVATE CREDIT variable remains a function of
the legal system (LLSV CREDITOR RIGHTS and BPR LEGALITY). Lacking better
instruments, I cannot eliminate all of the potential bias due to endogeneity.
Regression #3 shows the tranche maturity is strongly associated with sovereign
risk: moving from a country like India with and II RATING of 44 to New Zealand with
an II RATING of 74, extends loan maturity by 1.3 years. Compared to a median maturity
of 9.0 years, this represents a 14% increase. The tranche size variable is positive and
10 My analysis (Esty, 1999) of the Petrozuata project provides a good example. Through careful structuring
and extensive risk mitigation, the sponsors created an investment grade project in a sub-investment grade country (Venezuela). In fact, the project bond rating beat the sovereign foreign currency rating by five notches. This ability to “pierce the sovereign ceiling” is not uncommon in project finance.
24
significant. Barclay and Smith (1995) also find that the use of long-term corporate debt
is positively related to firm size in part because of scale economies in issuance costs.
Finally, the sector dummy variables are significant with power and transportation projects
having the longest maturities, and mining and oil and gas projects having the shortest
maturities.
IV. Conclusion
Using a unique dataset of firms that are totally dependent on external finance and
a new empirical approach based on debt ownership structure, I show that both legal and
financial systems affect the ability to raise external finance. Foreign banks are more
willing to finance large, long-term, illiquid project companies in countries with strong
creditor rights and reliable enforcement. At the same time, they are more likely to
finance projects in countries with less developed financial systems. Based on this
analysis, it appears that foreign banks step in to fill the financing gap left by domestic
banks. When such a gap exists, project sponsors must pay more to get foreign banks to
participate in the deal.
Although only a fraction of the differences in economic growth across
industrialized nations can be explained by physical capital accumulation (see Solow,
1957; King and Levine, 1994; and Krugman, 1993)—“total factor productivity” appears
to explain a larger fraction of the differences in economic growth—Demirgüç-Kunt and
Maksimovic (1998 and 1999) show that the ability to finance long-term growth
opportunities is an important determinant of economic growth. By focusing on a specific
type of growth opportunity, namely large project companies, this paper highlights how
sensitive banks are to the legal and financial systems in place in countries where they are
contemplating lending. At a higher level, this paper shows that both law and finance
affect investment and financing decisions in ways that could affect economic growth. I
do not establish the full link to economic growth in this paper, but I do show that both
legal and financial systems affect the availability of funds and, presumably, investment
decisions and economic growth.
25
References Barclay, M., and C. Smith, 1995, The maturity structure of corporate debt, Journal of
Finance 50(2), 609-631. Beck, T., A. Demirgüç-Kunt, and R. Levine, 1999, A new database on financial
development and structure, World Bank mimeograph. Beck, T., A. Demirgüç-Kunt, and R. Levine, 2002, Law and finance: Why does legal
origin matter? Carlson School of Management working paper, November. Beenhakker, H.L., 1997, Risk Management in Project Finance and Implementation,
Quorum Books (Westport, CT). Bencivenga, V., and B. Smith, 1991, Financial intermediation and endogenous growth,
Review of Economic Studies 58, 195-209. Berkowitz, D., K. Pistor, and J. Richard, 2003, Economic development, legality, and the
transplant effect, European Economic Review 47, 165-195. Clifford Chance, 1991, Project finance, legal overview of the firm’s practice, February. Coffee, J., 2000, Privatization and corporate governance: The lessons from securities
market failure, Columbia Law School working paper no. 158. Coval, J., and T. Moskowitz, 1999, Home bias at home: Local equity preference in
domestic portfolios, Journal of Finance 54, 2045-2073. Dell, J.C., J.W. Kunkle, W. Streeter, D. Champeau, and R. Hunter, 2001, “Rating approach
to project finance,” Fitch IBCA, Duff & Phelps Special Report, April 26. Demirgüç-Kunt, A., and V. Maksimovic. 1998, Law, finance, and firm growth, Journal
of Finance 53, 2107-2137. Demirgüç-Kunt, A., and V. Maksimovic, 1999, Institutions, financial markets and firm
debt maturity, Journal of Financial Economics 54, 295-336. Djankov, S., R. La Porta, F. López-de-Silanes, and A. Shleifer, 2002, Practice of justice,
Quarterly Journal of Economics (forthcoming), May. Esty, B., 2003, The economic motivations for using project finance, Harvard Business
School mimeo, February. Esty, B., 2002, An overview of project finance—2001 update, Harvard Business School
case #202-105. Esty, B., 2001, Structuring loan syndicates: A case study of the Hong Kong Disneyland
project loan, Journal of Applied Corporate Finance 14, No. 3, 80-95. Esty, B., 1999, Petrozuata: A case study of the effective use of project finance, Journal
of Applied Corporate Finance, Vol. 12, No. 3, Fall, pp. 26-42. Esty, B., and W. Megginson, 2003, Creditor rights, enforcement, and debt ownership
structure: Evidence from the global syndicated loan market, Journal of Financial and Quantitative Analysis 38, 37-59.
Finnerty, J.D, 1996, Project Financing: Asset-based financial engineering, John Wiley & Sons (New York, NY).
Giannetti, M., 2003, Do better institutions mitigate agency problems? Evidence from corporate finance choices, Journal of Financial and Quantitative Analysis 38, xxx-yyy.
Hoffman, S.L., 1998, The Law and Business of International Project Finance, Kluwer Law International (The Hague, The Netherlands).
26
Jappelli, T., M. Pagano, and M. Bianco, 2002, Courts and banks: Effects of judicial enforcement on credit markets, University of Salerno - CSEF working paper, April.
Jayaratne, J., and P. Strahan, 1996, The finance-growth nexus: Evidence from bank branch deregulation, Quarterly Journal of Economics 111, 639-670.
Jensen, M.C., 1986, Agency costs of free cash flow, corporate finance, and takeovers, American Economic Review 76, 323-329.
Johnson, S., J. McMillan, and C. Woodruff, 2002, Property rights and finance, American Economic Review 92, 1335-1356.
King, R., and R. Levine, 1993, Finance and growth: Schumpeter might be right, Quarterly Journal of Economics 108, 713-737.
King, R., and R. Levine, 1994, Capital fundamentalism, economic development, and economic growth, Carnegie-Rochester Conference Series on Public Policy 40, 259-92.
Kleimeier, S., and W. Megginson, 2000, Are project finance loans different from other syndicated credits? Journal of Applied Corporate Finance 13(1), 75-87.
Knack, S., and P. Keefer, 1995, Institutions and economic performance: Cross-country tests using alternative institutional measures, Economics and Politics 7(3), 207-227.
Kolo, A., and T. W. Wälde, 2000, Renegotiation and contract adaptation in international investment projects: Applicable legal principles and industry practices, Journal of World Investment 5, 5-57.
Krugman, P., 1993, International finance and economic development, in A. Giovannini, ed., Finance and Development: Issues and Experience, Cambridge University Press (Cambridge, UK).
La Porta, R., F. López-de-Silanes, A. Shleifer, and R. Vishny, 1997, Legal determinants of external finance, Journal of Finance 52(3), 1131-1150.
La Porta, R., F. López-de-Silanes, A. Shleifer, and R. Vishny, 1998, Law and finance, Journal of Political Economy 106, 1113-1150.
Levine, R., 1996, Foreign banks, financial development, and economic growth, Chapter 6 in International Financial Markets: Harmonization Versus Competition, ed. Claude E. Barfield, The AEI Press (Washington, DC).
Levine, R., 1997, Financial development and economic growth: Views and agenda, Journal of Economic Literature 35, 688-726.
Levine, R., 1998, The legal environment, banks, and long-run economic growth, Journal of Money, Credit, and Banking 30(3), 596-620.
Levine, R., 1999, Law, finance, and economic growth, Journal of Financial Intermediation 8, 8-35.
Levine, R., N. Loayza, and T. Beck, 2000, Financial intermediation and growth: Causality and causes, Journal of Monetary Economics, 31-77.
Levine, R., and S. Zervos, 1998, Stock Markets, Banks, and Economic Growth, American Economic Review 88(3), June, 537-558.
Merton, R.C., and Z. Bodie, 1995, A conceptual framework for analyzing the financial environment, in The Global Financial System: A Functional Perspective, eds.: D. Crane et al., Harvard Business School Press (Boston, MA).
27

Moody’s Investors Service, 2001, Debt financing of projects in emerging economies: Lessons from Asia, Project & Infrastructure Finance Sourcebook (December), 45-49.
Moran, Theodore H., 1973, Transnational strategies of protection and defense by multinational corporations: Spreading the risk and raising the cost for nationalization in natural resources, International Organization, Vol. 27, No. 3, Spring, 273-287.
Pennacchi, G., 1988, Loan sales and the cost of bank capital, Journal of Finance 43, 375-396.
Penrose, J. and P. Rigby, 2000, Debt rating criteria for energy, industrial, and infrastructure project finance, Infrastructure Finance: Criteria and Commentary, October, 15-65.
Petersen, M., and R. Rajan, 2002, Does distance still matter? The information revolution in small business lending, Journal of Finance 49(1), 3-37.
Rajan, R.G., 1992, Insiders and outsiders: The choice between informed and arm’s-length debt, Journal of Finance 47, 1367-1400.
Rajan, R., and L. Zingales, 1998, Financial Dependence and Growth, American Economic Review 88(3), June, 559-86.
Robinson, J., 1952, The generalization of the general theory, in The Rate of Interest, and Other Essays, Macmillan (London, UK), 67-142.
Schumpeter, J., 1911, A Theory of Economic Development, Harvard University Press (Cambridge, MA).
Stiglitz, J., and A. Weiss, 1981, Credit rationing in markets with imperfect information, American Economic Review 71, 393-410.
Solow, R., 1957, Technological change and the aggregate production function, Review of Economics and Statistics 39, 312-320.
Walsh, R., 1999, Pacific Rim collateral security laws: What happens when the project goes wrong? Stanford Journal of Law, Business, and Finance 115, 115-147.
Wurgler, J., 2000, Financial markets and the allocation of capital, Journal of Financial Economics 58(1-2), 187-214.
28
Tab
le I
Dis
tribu
tion
of S
yndi
cate
d Lo
ans O
ver T
ime
Th
is ta
ble
show
s the
dis
tribu
tion
of sy
ndic
ated
loan
s fro
m th
e D
ealo
gic
(Cap
italD
ata)
Loa
nwar
e da
taba
se o
ver t
ime
(exc
ludi
ng b
ilate
ral
loan
s).
The
colu
mns
incl
ude
all t
ranc
hes,
all p
roje
ct fi
nanc
e tra
nche
s, pr
ojec
t fin
ance
tran
ches
gre
ater
than
$75
mill
ion,
and
pro
ject
fina
nce
tranc
hes g
reat
er th
an $
75 m
illio
n w
ith sy
ndic
ate
data
(our
sam
ple)
.
A
ll L
oan
Typ
es
Pr
ojec
t Fin
ance
Loa
ns
All
Tra
nche
s
Proj
ect F
inan
ce L
oans
T
ranc
hes >
$75
Mill
ion
Proj
ect F
inan
ce L
oans
T
ranc
hes >
$75
mill
ion
with
Syn
dica
te D
ata
Pe
rcen
t by
Sign
ing
Dat
e V
alue
($B
) N
umbe
r
Val
ue ($
B)
Num
ber
V
alue
($B
) N
umbe
r
Val
ue ($
B)
Num
ber
V
alue
( 8/
6)
Num
ber
(9/7
) (1
)
(2)
(3)
(4
) (5
)
(6)
(7)
(8
) (9
)
(10)
(1
1)
1986
228.
71,
447
9.8
978.
233
0.8
29.
86.
119
8736
3.7
2,04
121
.714
318
.958
0.7
43.
76.
919
8857
8.0
2,83
619
.121
514
.472
0.7
34.
94.
219
8967
6.5
3,21
828
.521
524
.699
4.4
1317
.913
.119
9057
4.6
3,62
645
.423
241
.710
95.
225
12.5
22.9
1991
554.
23,
765
49.9
331
44.7
148
6.3
2114
.114
.219
9262
5.9
4,88
048
.938
142
.617
76.
928
16.2
15.8
1993
788.
65,
031
53.0
398
45.8
174
9.8
3121
.417
.819
941,
073.
35,
732
60.8
386
54.3
183
11.1
3920
.421
.319
951,
396.
97,
019
72.5
493
65.1
241
19.6
7330
.130
.319
961,
609.
38,
317
58.5
455
49.7
187
16.4
6633
.035
.319
972,
056.
810
,016
99.7
513
92.2
279
27.2
7729
.527
.619
981,
698.
78,
703
75.5
459
68.3
243
18.4
6126
.925
.119
991,
947.
38,
028
85.1
544
77.1
282
11.4
4614
.816
.320
00
542
.2
1
,760
3
1.2
89
3
0.1
51
11.
7
6
38.9
11.8
Tot
al$1
5,68
8.4
85,0
66$8
22.5
5,64
6$7
26.6
2,54
5$1
50.5
495
%
of T
otal
5.
2%6.
64.
63.
01.
00.
6
% o
f Pro
ject
Fin
ance
88.4
45.1
18.3
8.8
So
urce
: D
ealo
gic
(Cap
ital D
ATA
) Loa
nwar
e da
taba
se.
29
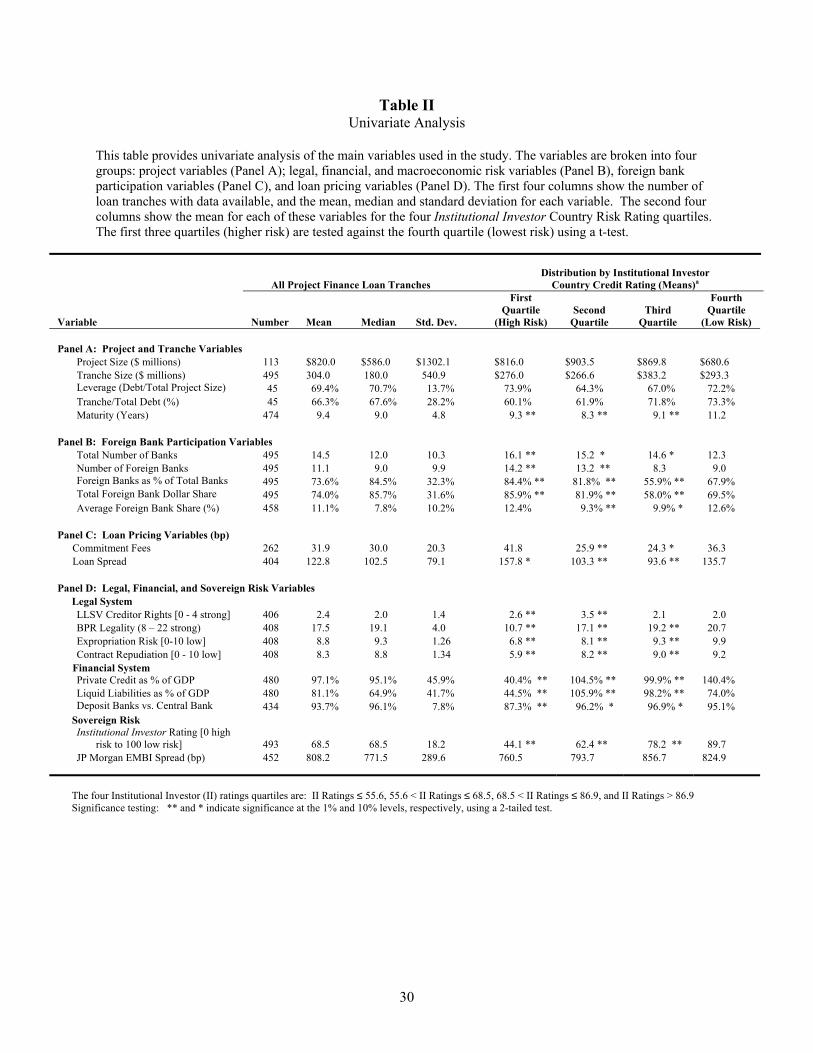
Table II Univariate Analysis
This table provides univariate analysis of the main variables used in the study. The variables are broken into four groups: project variables (Panel A); legal, financial, and macroeconomic risk variables (Panel B), foreign bank participation variables (Panel C), and loan pricing variables (Panel D). The first four columns show the number of loan tranches with data available, and the mean, median and standard deviation for each variable. The second four columns show the mean for each of these variables for the four Institutional Investor Country Risk Rating quartiles. The first three quartiles (higher risk) are tested against the fourth quartile (lowest risk) using a t-test.
All Project Finance Loan Tranches Distribution by Institutional Investor
Country Credit Rating (Means)a
Variable Number Mean Median Std. Dev.
First Quartile
(High Risk) Second
Quartile Third
Quartile
Fourth Quartile
(Low Risk) Panel A: Project and Tranche Variables
Project Size ($ millions) 113 $820.0 $586.0 $1302.1 $816.0 $903.5 $869.8 $680.6 Tranche Size ($ millions) 495 304.0 180.0 540.9 $276.0 $266.6 $383.2 $293.3 Leverage (Debt/Total Project Size) 45 69.4% 70.7% 13.7% 73.9% 64.3% 67.0% 72.2% Tranche/Total Debt (%) 45 66.3% 67.6% 28.2% 60.1% 61.9% 71.8% 73.3% Maturity (Years) 474 9.4 9.0 4.8 9.3 ** 8.3 ** 9.1 ** 11.2
Panel B: Foreign Bank Participation Variables
Total Number of Banks 495 14.5 12.0 10.3 16.1 ** 15.2 * 14.6 * 12.3 Number of Foreign Banks 495 11.1 9.0 9.9 14.2 ** 13.2 ** 8.3 9.0 Foreign Banks as % of Total Banks 495 73.6% 84.5% 32.3% 84.4% ** 81.8% ** 55.9% ** 67.9% Total Foreign Bank Dollar Share 495 74.0% 85.7% 31.6% 85.9% ** 81.9% ** 58.0% ** 69.5% Average Foreign Bank Share (%) 458 11.1% 7.8% 10.2% 12.4% 9.3% ** 9.9% * 12.6%
Panel C: Loan Pricing Variables (bp)
Commitment Fees 262 31.9 30.0 20.3 41.8 25.9 ** 24.3 * 36.3 Loan Spread 404 122.8 102.5 79.1 157.8 * 103.3 ** 93.6 ** 135.7
Panel D: Legal, Financial, and Sovereign Risk Variables
Legal System LLSV Creditor Rights [0 - 4 strong] 406 2.4 2.0 1.4 2.6 ** 3.5 ** 2.1 2.0 BPR Legality (8 – 22 strong) 408 17.5 19.1 4.0 10.7 ** 17.1 ** 19.2 ** 20.7 Expropriation Risk [0-10 low] 408 8.8 9.3 1.26 6.8 ** 8.1 ** 9.3 ** 9.9 Contract Repudiation [0 - 10 low] 408 8.3 8.8 1.34 5.9 ** 8.2 ** 9.0 ** 9.2
Financial System Private Credit as % of GDP 480 97.1% 95.1% 45.9% 40.4% ** 104.5% ** 99.9% ** 140.4% Liquid Liabilities as % of GDP 480 81.1% 64.9% 41.7% 44.5% ** 105.9% ** 98.2% ** 74.0% Deposit Banks vs. Central Bank 434 93.7% 96.1% 7.8% 87.3% ** 96.2% * 96.9% * 95.1%
Sovereign Risk Institutional Investor Rating [0 high
risk to 100 low risk] 493 68.5 68.5 18.2 44.1 ** 62.4 ** 78.2 ** 89.7 JP Morgan EMBI Spread (bp) 452 808.2 771.5 289.6 760.5 793.7 856.7 824.9
The four Institutional Investor (II) ratings quartiles are: II Ratings ≤ 55.6, 55.6 < II Ratings ≤ 68.5, 68.5 < II Ratings ≤ 86.9, and II Ratings > 86.9 Significance testing: ** and * indicate significance at the 1% and 10% levels, respectively, using a 2-tailed test.
30
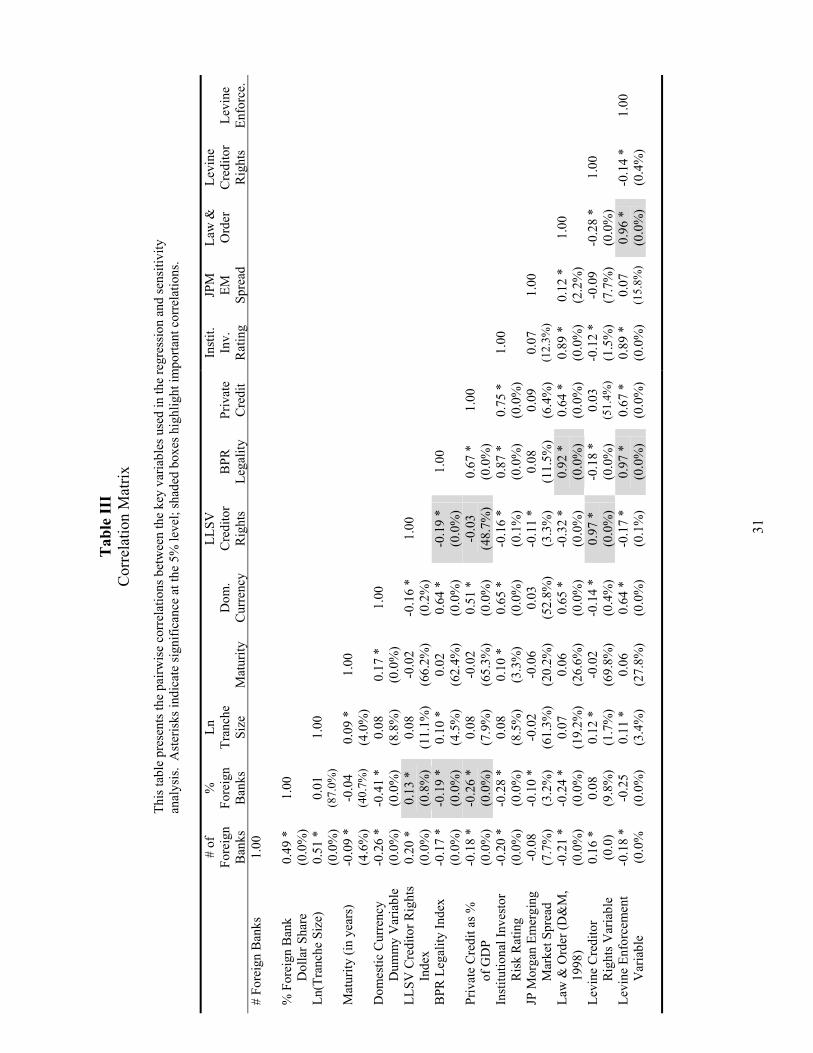
Tab
le II
I C
orre
latio
n M
atrix
This
tabl
e pr
esen
ts th
e pa
irwis
e co
rrel
atio
ns b
etw
een
the
key
varia
bles
use
d in
the
regr
essi
on a
nd se
nsiti
vity
an
alys
is.
Ast
eris
ks in
dica
te si
gnifi
canc
e at
the
5% le
vel;
shad
ed b
oxes
hig
hlig
ht im
porta
nt c
orre
latio
ns.
#of
Fore
ign
Ban
ks
%
Fo
reig
n B
anks
Ln
Tran
che
Size
M
atur
ity
D
om.
Cur
renc
y
LLSV
C
redi
tor
Rig
hts
B
PR
Lega
lity
Pr
ivat
e C
redi
t
Inst
it.
Inv.
R
atin
g
JPM
EM
Sp
read
Law
&
Ord
er
Levi
ne
Cre
dito
r R
ight
s
Le
vine
En
forc
e.
# Fo
reig
n B
anks
1.00
% F
orei
gn B
ank
Dol
lar S
hare
0.
49 *
(0
.0%
) 1.
00
Ln(T
ranc
he S
ize)
0.51
*
(0.0
%)
0.01
(8
7.0%
) 1.
00
Mat
urity
(in
year
s)
-0
.09
* (4
.6%
) -0
.04
(40.
7%)
0.09
*
(4.0
%)
1.00
Dom
estic
Cur
renc
y D
umm
y V
aria
ble
-0.2
6 *
(0.0
%)
-0.4
1 *
(0.0
%)
0.08
(8
.8%
) 0.
17 *
(0
.0%
) 1.
00
LLSV
Cre
dito
r Rig
hts
Inde
x 0.
20 *
(0
.0%
) 0.
13 *
(0
.8%
) 0.
08
(11.
1%)
-0.0
2 (6
6.2%
) -0
.16
* (0
.2%
) 1.
00
BPR
Leg
ality
Inde
x
-0.1
7 *
(0.0
%)
-0.1
9 *
(0.0
%)
0.10
*
(4.5
%)
0.02
(6
2.4%
) 0.
64 *
(0
.0%
) -0
.19
* (0
.0%
) 1.
00
Priv
ate
Cre
dit a
s %
of G
DP
-0.1
8 *
(0.0
%)
-0.2
6 *
(0.0
%)
0.08
(7
.9%
) -0
.02
(65.
3%)
0.51
*
(0.0
%)
-0.0
3 (4
8.7%
) 0.
67 *
(0
.0%
) 1.
00
Inst
itutio
nal I
nves
tor
Ris
k R
atin
g -0
.20
* (0
.0%
) -0
.28
* (0
.0%
) 0.
08
(8.5
%)
0.10
*
(3.3
%)
0.65
*
(0.0
%)
-0.1
6 *
(0.1
%)
0.87
*
(0.0
%)
0.75
*
(0.0
%)
1.00
JP M
orga
n Em
ergi
ng
Mar
ket S
prea
d -0
.08
(7.7
%)
-0.1
0 *
(3.2
%)
-0.0
2 (6
1.3%
) -0
.06
(20.
2%)
0.03
(5
2.8%
) -0
.11
* (3
.3%
) 0.
08
(11.
5%)
0.09
(6
.4%
) 0.
07
(12.
3%)
1.00
Law
& O
rder
(D&
M,
1998
) -0
.21
* (0
.0%
) -0
.24
* (0
.0%
) 0.
07
(19.
2%)
0.06
(2
6.6%
) 0.
65 *
(0
.0%
) -0
.32
* (0
.0%
) 0.
92 *
(0
.0%
) 0.
64 *
(0
.0%
) 0.
89 *
(0
.0%
) 0.
12 *
(2
.2%
) 1.
00
Levi
ne C
redi
tor
Rig
hts V
aria
ble
0.16
*
(0.0
) 0.
08
(9.8
%)
0.12
*
(1.7
%)
-0.0
2 (6
9.8%
) -0
.14
* (0
.4%
) 0.
97 *
(0
.0%
) -0
.18
* (0
.0%
) 0.
03
(51.
4%)
-0.1
2 *
(1.5
%)
-0.0
9 (7
.7%
) -0
.28
* (0
.0%
) 1.
00
Levi
ne E
nfor
cem
ent
Var
iabl
e -0
.18
* (0
.0%
-0
.25
(0.0
%)
0.11
*
(3.4
%)
0.06
(2
7.8%
) 0.
64 *
(0
.0%
) -0
.17
* (0
.1%
) 0.
97 *
(0
.0%
) 0.
67 *
(0
.0%
) 0.
89 *
(0
.0%
) 0.
07
(15.
8%)
0.96
*
(0.0
%)
-0.1
4 *
(0.4
%)
1.00
31
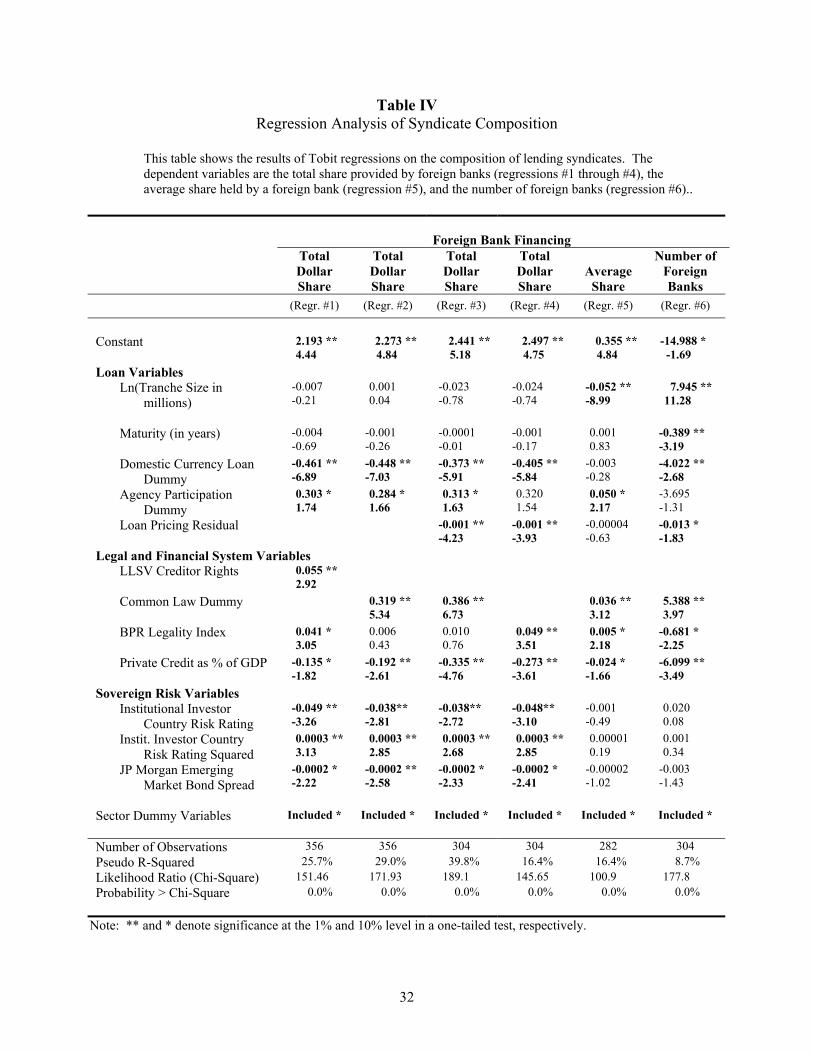
Table IV Regression Analysis of Syndicate Composition
This table shows the results of Tobit regressions on the composition of lending syndicates. The dependent variables are the total share provided by foreign banks (regressions #1 through #4), the average share held by a foreign bank (regression #5), and the number of foreign banks (regression #6)..
Foreign Bank Financing Total
Dollar Share
Total Dollar Share
Total Dollar Share
Total Dollar Share
Average
Share
Number of Foreign Banks
(Regr. #1) (Regr. #2) (Regr. #3) (Regr. #4) (Regr. #5) (Regr. #6)
Constant
2.193 ** 4.44
2.273 ** 4.84
2.441 ** 5.18
2.497 ** 4.75
0.355 ** 4.84
-14.988 * -1.69
Loan Variables Ln(Tranche Size in
millions)
-0.007 -0.21
0.001 0.04
-0.023 -0.78
-0.024 -0.74
-0.052 ** -8.99
7.945 ** 11.28
Maturity (in years)
-0.004 -0.69
-0.001 -0.26
-0.0001 -0.01
-0.001 -0.17
0.001 0.83
-0.389 ** -3.19
Domestic Currency Loan Dummy
-0.461 ** -6.89
-0.448 ** -7.03
-0.373 ** -5.91
-0.405 ** -5.84
-0.003 -0.28
-4.022 ** -2.68
Agency Participation Dummy
0.303 * 1.74
0.284 * 1.66
0.313 * 1.63
0.320 1.54
0.050 * 2.17
-3.695 -1.31
Loan Pricing Residual
-0.001 ** -4.23
-0.001 ** -3.93
-0.00004 -0.63
-0.013 * -1.83
Legal and Financial System Variables LLSV Creditor Rights
0.055 ** 2.92
Common Law Dummy
0.319 ** 5.34
0.386 ** 6.73
0.036 ** 3.12
5.388 ** 3.97
BPR Legality Index
0.041 * 3.05
0.006 0.43
0.010 0.76
0.049 ** 3.51
0.005 * 2.18
-0.681 * -2.25
Private Credit as % of GDP
-0.135 * -1.82
-0.192 ** -2.61
-0.335 ** -4.76
-0.273 ** -3.61
-0.024 * -1.66
-6.099 ** -3.49
Sovereign Risk Variables Institutional Investor
Country Risk Rating -0.049 ** -3.26
-0.038** -2.81
-0.038** -2.72
-0.048** -3.10
-0.001 -0.49
0.020 0.08
Instit. Investor Country Risk Rating Squared
0.0003 ** 3.13
0.0003 ** 2.85
0.0003 ** 2.68
0.0003 ** 2.85
0.00001 0.19
0.001 0.34
JP Morgan Emerging Market Bond Spread
-0.0002 * -2.22
-0.0002 ** -2.58
-0.0002 * -2.33
-0.0002 * -2.41
-0.00002 -1.02
-0.003 -1.43
Sector Dummy Variables Included * Included * Included * Included * Included * Included * Number of Observations 356 356 304 304 282 304 Pseudo R-Squared 25.7% 29.0% 39.8% 16.4% 16.4% 8.7% Likelihood Ratio (Chi-Square) 151.46 171.93 189.1 145.65 100.9 177.8 Probability > Chi-Square 0.0% 0.0% 0.0% 0.0% 0.0% 0.0%
Note: ** and * denote significance at the 1% and 10% level in a one-tailed test, respectively.
32
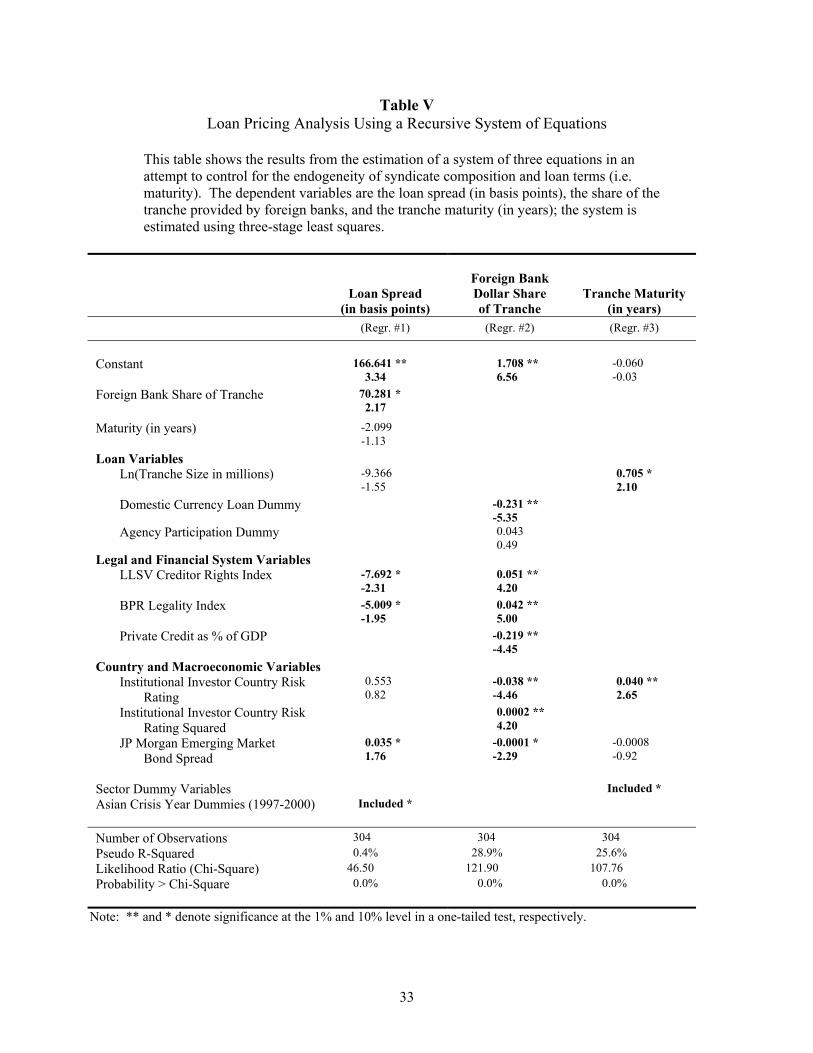
Table V Loan Pricing Analysis Using a Recursive System of Equations
This table shows the results from the estimation of a system of three equations in an attempt to control for the endogeneity of syndicate composition and loan terms (i.e. maturity). The dependent variables are the loan spread (in basis points), the share of the tranche provided by foreign banks, and the tranche maturity (in years); the system is estimated using three-stage least squares.
Loan Spread (in basis points)
Foreign Bank Dollar Share of Tranche
Tranche Maturity
(in years) (Regr. #1) (Regr. #2) (Regr. #3)
Constant
166.641 ** 3.34
1.708 ** 6.56
-0.060 -0.03
Foreign Bank Share of Tranche
70.281 * 2.17
Maturity (in years)
-2.099 -1.13
Loan Variables Ln(Tranche Size in millions)
-9.366 -1.55
0.705 * 2.10
Domestic Currency Loan Dummy -0.231 ** -5.35
Agency Participation Dummy 0.043 0.49
Legal and Financial System Variables LLSV Creditor Rights Index
-7.692 * -2.31
0.051 ** 4.20
BPR Legality Index
-5.009 * -1.95
0.042 ** 5.00
Private Credit as % of GDP
-0.219 ** -4.45
Country and Macroeconomic Variables Institutional Investor Country Risk
Rating 0.553 0.82
-0.038 ** -4.46
0.040 ** 2.65
Institutional Investor Country Risk Rating Squared
0.0002 ** 4.20
JP Morgan Emerging Market Bond Spread
0.035 * 1.76
-0.0001 * -2.29
-0.0008 -0.92
Sector Dummy Variables Included * Asian Crisis Year Dummies (1997-2000) Included *
Number of Observations 304 304 304 Pseudo R-Squared 0.4% 28.9% 25.6% Likelihood Ratio (Chi-Square) 46.50 121.90 107.76 Probability > Chi-Square 0.0% 0.0% 0.0%
Note: ** and * denote significance at the 1% and 10% level in a one-tailed test, respectively.
33
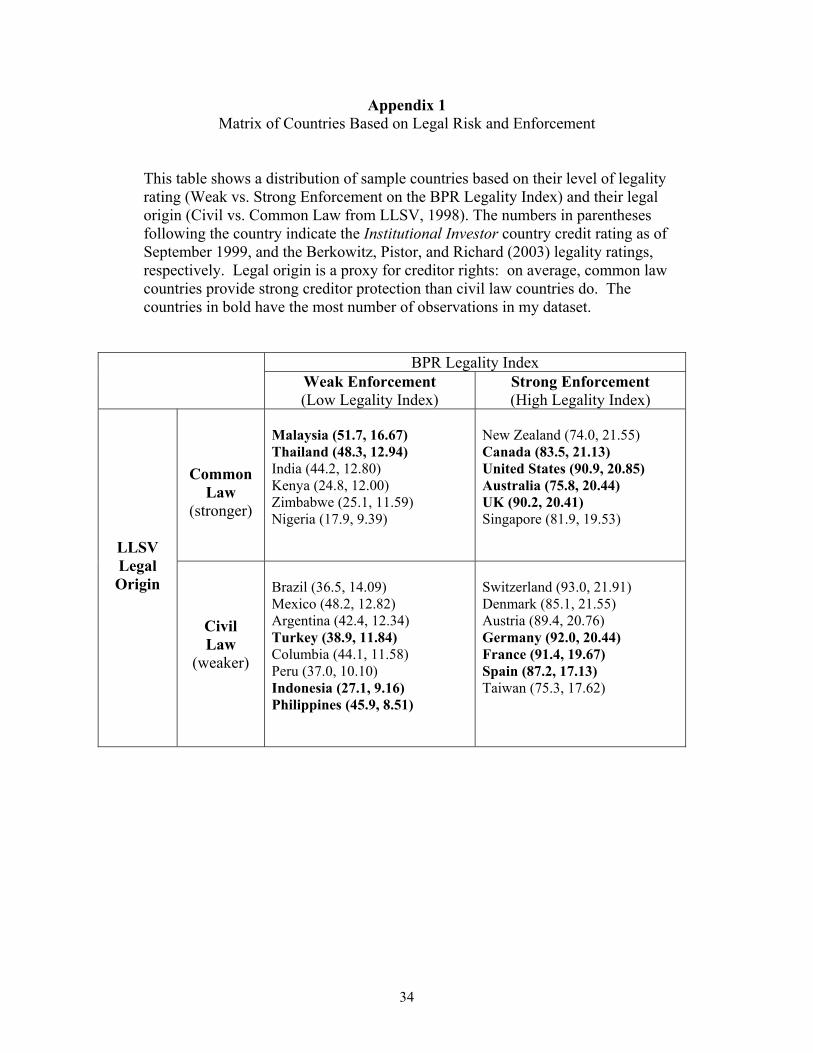
Appendix 1 Matrix of Countries Based on Legal Risk and Enforcement
This table shows a distribution of sample countries based on their level of legality rating (Weak vs. Strong Enforcement on the BPR Legality Index) and their legal origin (Civil vs. Common Law from LLSV, 1998). The numbers in parentheses following the country indicate the Institutional Investor country credit rating as of September 1999, and the Berkowitz, Pistor, and Richard (2003) legality ratings, respectively. Legal origin is a proxy for creditor rights: on average, common law countries provide strong creditor protection than civil law countries do. The countries in bold have the most number of observations in my dataset.
BPR Legality Index Weak Enforcement
(Low Legality Index) Strong Enforcement (High Legality Index)
Common Law
(stronger)
Malaysia (51.7, 16.67) Thailand (48.3, 12.94) India (44.2, 12.80) Kenya (24.8, 12.00) Zimbabwe (25.1, 11.59) Nigeria (17.9, 9.39)
New Zealand (74.0, 21.55) Canada (83.5, 21.13) United States (90.9, 20.85) Australia (75.8, 20.44) UK (90.2, 20.41) Singapore (81.9, 19.53)
LLSV Legal Origin
Civil Law
(weaker)
Brazil (36.5, 14.09) Mexico (48.2, 12.82) Argentina (42.4, 12.34) Turkey (38.9, 11.84) Columbia (44.1, 11.58) Peru (37.0, 10.10) Indonesia (27.1, 9.16) Philippines (45.9, 8.51)
Switzerland (93.0, 21.91) Denmark (85.1, 21.55) Austria (89.4, 20.76) Germany (92.0, 20.44) France (91.4, 19.67) Spain (87.2, 17.13) Taiwan (75.3, 17.62)
34