WHEELER REAL ESTATE INVESTMENT TRUST, INC.
37
UNITED STATES SECURITIES AND EXCHANGE COMMISSION Washington, D.C. 20549 Form 8-K CURRENT REPORT PURSUANT TO SECTION 13 OR 15(d) OF THE SECURITIES EXCHANGE ACT OF 1934 Date of report (date of earliest event reported): February 26, 2020 WHEELER REAL ESTATE INVESTMENT TRUST, INC. (Exact name of registrant as specified in its charter) Maryland 001-35713 45-2681082 (State or Other Jurisdiction of Incorporation) (Commission File Number) (IRS Employer Identification No.) 2529 Virginia Beach Blvd., Suite 200 Virginia Beach, VA 23452 Registrant’s telephone number, including area code: (757) 627-9088 Check the appropriate box below if the Form 8-K filing is intended to simultaneously satisfy the filing obligations of the registrant under any of the following provisions: ¨ Written communications pursuant to Rule 425 under the Securities Act (17 CFR 230.425) ¨ Soliciting material pursuant to Rule 14a-12 under the Exchange Act (17 CFR 240.14a-12) ¨ Pre-commencement communications pursuant to Rule 14d-2(b) under the Exchange Act (17 CFR 240.14d-2(b)) ¨ Pre-commencement communications pursuant to Rule 13e-4(c) under the Exchange Act (17 CFR 240.13e-4(c)) Securities registered pursuant to Section 12(b) of the Act: Title of each class Trading Symbol(s) Name of each exchange on which registered Common Stock, $0.01 par value per share WHLR Nasdaq Capital Market Series B Convertible Preferred Stock WHLRP Nasdaq Capital Market Series D Cumulative Convertible Preferred Stock WHLRD Nasdaq Capital Market
Transcript of WHEELER REAL ESTATE INVESTMENT TRUST, INC.

UNITED STATES SECURITIES AND EXCHANGE COMMISSIONWashington, D.C. 20549
Form 8-K
CURRENT REPORTPURSUANT TO SECTION 13 OR 15(d)
OF THE SECURITIES EXCHANGE ACT OF 1934
Date of report (date of earliest event reported): February 26, 2020
WHEELER REAL ESTATE INVESTMENT TRUST, INC.(Exact name of registrant as specified in its charter)
Maryland 001-35713 45-2681082(State or Other Jurisdiction
of Incorporation) (CommissionFile Number)
(IRS EmployerIdentification No.)
2529 Virginia Beach Blvd., Suite 200Virginia Beach, VA 23452
Registrant’s telephone number, including area code: (757) 627-9088
Check the appropriate box below if the Form 8-K filing is intended to simultaneously satisfy the filing obligations of the registrant under any of the following provisions:
¨ Written communications pursuant to Rule 425 under the Securities Act (17 CFR 230.425)¨ Soliciting material pursuant to Rule 14a-12 under the Exchange Act (17 CFR 240.14a-12)¨ Pre-commencement communications pursuant to Rule 14d-2(b) under the Exchange Act (17 CFR 240.14d-2(b))¨ Pre-commencement communications pursuant to Rule 13e-4(c) under the Exchange Act (17 CFR 240.13e-4(c))
Securities registered pursuant to Section 12(b) of the Act:
Title of each class Trading Symbol(s) Name of each exchange on which registeredCommon Stock, $0.01 par value per share WHLR Nasdaq Capital Market Series B Convertible Preferred Stock WHLRP Nasdaq Capital Market Series D Cumulative Convertible Preferred Stock WHLRD Nasdaq Capital Market

Indicate by check mark whether the registrant is an emerging growth company as defined in Rule 405 of the Securities Act of 1933 (§230.405 of this chapter) or Rule12b-2 of the Securities Exchange Act of 1934 (§240.12b-2 of this chapter).
Emerging growth company ¨
If an emerging growth company, indicate by check mark if the registrant has elected not to use the extended transition period for complying with any new or revisedfinancial accounting standards provided pursuant to Section 13(a) of the Exchange Act. ¨

Item 2.02 Results of Operations and Financial Condition.
On February 26, 2020, Wheeler Real Estate Investment Trust, Inc. (the “Company”), issued a press release announcing its financial results for the three and twelvemonths ended December 31, 2019. A copy of the press release is attached as Exhibit 99.1 to this Current Report on Form 8-K and is incorporated herein by reference. A copyof the Company's Supplemental Operating and Financial Data for the three and twelve months ended December 31, 2019 is attached as Exhibit 99.2 to this Current Report onForm 8-K and is incorporated herein by reference.
Item 9.01(d) Financial Statements and Exhibits.
99.1 Press release, dated February 26, 2020, announcing the Company's financial results for the three and twelve months ended December 31,2019.
99.2 Supplemental Operating and Financial Data for the three and twelve months ended December 31, 2019.

EXHIBIT INDEX
Number Description of Exhibit 99.1 Press release, dated February 26, 2020, announcing the Company's financial results for the three and twelve months ended December 31, 2019.99.2 Supplemental Operating and Financial Data for the three and twelve months ended December 31, 2019.

SIGNATURE
Pursuant to the requirements of the Securities and Exchange Act of 1934, the Registrant has duly caused this report to be signed on its behalf by the undersignedthereunto duly authorized.
WHEELER REAL ESTATE INVESTMENT TRUST, INC.
By: /s/ David Kelly David Kelly President and Chief Executive Officer
Dated: February 26, 2020

Exhibit 99.1
FOR IMMEDIATE RELEASE
WHLR REAL ESTATE INVESTMENT TRUST, INC. ANNOUNCES 2019 FOURTH QUARTER FINANCIAL AND OPERATING RESULTS
Virginia Beach, VA – February 26, 2020 – WHLR Real Estate Investment Trust, Inc. (NASDAQ:WHLR) (“WHLR” or the “Company”) today reportedfinancial and operating results for the three and twelve months ended December 31, 2019.
Three Months Ended December
31, Years Ended December 31, 2019 2018 2019 2018
Net loss per common share $ (0.45) $ (1.66) $ (2.34) $ (3.17)FFO per common share and common unit 0.11 (0.05) (0.06) 0.42AFFO per common share and common unit 0.02 0.15 0.40 0.73
2019 FOURTH QUARTER HIGHLIGHTS(all comparisons to the same prior year period unless otherwise noted) • Total revenue from continuing operations increased by 0.64% or $102 thousand primarily due to increased tenant reimbursement recoveries as well as
increased revenue from our JANAF asset. This increase was partially offset by revenue declines of $301 thousand due to asset sales.• Same store property revenues increased
3.57%.• Same store Net Operating Income ("NOI") increased by 3.14% and by 1.97% on a cash basis.• Reduced the KeyBank Line of Credit by $7.2 million through a refinancing of Litchfield Market Village, which represented a collateralized portion of the line
of credit.• Executed 41 lease renewals totaling 480,008 square feet at a weighted-average increase of $0.33 per square foot, representing an increase of 4.50% over
in-place rental rates.• Signed 13 new leases totaling approximately 40,631 square feet with a weighted-average rental rate of $12.57 per square foot.• Net loss attributable to WHLR's common stock, $0.01 par value per share ("Common Stock") shareholders of $4.3 million, or ($0.45) per
share.• NOI from property operations remained flat at $11.2 million despite declines in NOI resulting from the impact of selling four income producing properties,
totaling approximately $205 thousand, and increases in real estate tax and insurance expenses, which was offset by increases in tenant reimbursementrevenue.
• Adjusted Funds from Operations ("AFFO") of $0.02 per share of the Company's Common Stock and common unit ("Common Unit") in our operatingpartnership, Wheeler REIT, L.P.
• Recognized a $51 thousand impairment charge on St. Matthews, a 29,000 square foot shopping center that was held for sale as of December 31, 2019.

2019 YEAR-TO-DATE HIGHLIGHTS• Sold three properties and an undeveloped land parcel for $16.0 million, resulting in a total gain of $1.7 million and net proceeds of $3.6 million.• Reduced WHLR's weighted-average interest rate to 4.71%, with an average loan term of 4.19 years from 4.84% with a term of 4.31 years at December
31, 2018.• Paid in
full:• Bulldog Senior Convertible notes through scheduled principal and interest payments; and• Revere Term Loan through a combination of asset sale proceeds, operating cash flows and $300 thousand in monthly scheduled principal
payments.• Paid down the KeyBank Line of Credit to $17.9 million with proceeds from the following
sources:• $30.2 million of refinancings from the Village of Martinsville, Laburnum Square and Litchfield Market Village;• $1.9 million in specific principal payments; as well
as• $2.2 million in monthly scheduled principal
payments.• The 1,986,600 publicly traded warrants (CUSIP No.: 963025119) (NASQAQ: WHLRW) exchangeable into 248,325 shares of our Common Stock expired
on April 29, 2019.• Recognized a $5.0 million impairment charge on Sea Turtle Development notes receivable bringing the carrying value to
zero.• Recognized a total of $1.6 million in impairment charges on Perimeter Square, which was sold on July 12, 2019, and St. Matthews, which was sold on
January 21, 2020, subsequent to year end, December 31, 2019.• Corporate general and administrative expenses decreased 19.39% resulting from decreases in employee share based compensation, severance,
professional fees and debt financing expenses and savings from not pursing acquisition and development projects.• Net loss attributable to WHLR's Common Stock shareholders of $22.7 million, or ($2.34) per
share.• Total revenue from continuing operations decreased by 3.24% or $2.1 million primarily due to the 2018 early termination fees of $1.3 million associated
with Berkley Center Shopping Center and Southeastern Grocers ("SEG") recaptures as well as the revenue declines from the impact of selling fiveproperties, approximately $1.3 million, partially offset by an increase of 5.53% in JANAF revenue and tenant reimbursement recoveries of $774 thousand.
• NOI from property operations decreased by 5.36% to $43.9 million primarily due to the 2018 early termination fees of $1.3 million associated with BerkleyCenter Shopping Center and SEG recaptures and the declines in NOI resulting from the impact of selling five properties, approximately $984 thousand.These declines in NOI were partially offset by an increase of $93 thousand or 1.20% in NOI generated by JANAF.
• AFFO of $0.40 per share of the Company's Common Stock and Common Unit in our operating partnership, Wheeler REIT, L.P.
SUBSEQUENT EVENTS• The Company and KeyBank entered into a Second Amendment to the KeyBank Line of Credit effective December 21, 2019 and the Company began
making monthly principal payments of $350 thousand on November 1, 2019. The Second Amendment, among other provisions, requires a pledge ofadditional collateral of $15.00 million in residual equity interests. In addition, the Second Amendment requires the KeyBank Line of Credit to be reduced to$10.0 million by January 31, 2020, $2.0 million by April 30, 2020 and fully matures on June 30, 2020.
• Reduced the KeyBank Line of Credit by $7.5 million through the below, leaving a remaining balance, as required by the Second Amendment, as ofJanuary 31, 2020 of $10.0 million, as noted below:
• sold St. Matthews for a contract price of $1.8 million; and• refinanced the Shoppes at Myrtle Park for $6.0 million at a fixed rate of 4.45%.
• The Company and the Synovus Bank agreed to extend the Rivergate Shopping Center loan to March 20, 2020.
BALANCE SHEET • Cash and cash equivalents totaled $5.5 million at December 31, 2019, compared to $3.5 million at December 31, 2018.• Restricted cash totaled $16.1 million at December 31, 2019, compared to $14.5 million at December 31, 2018. These funds are held in lender reserves for
the purpose of tenant improvements, lease commissions, real estate taxes and insurance expenses.

• Accounts payable, accrued expenses and other liabilities totaled $9.6 million at December 31, 2019, compared to $12.1 million at December 31, 2018, adecrease of $2.6 million.
• Total debt was $347.1 million at December 31, 2019 (including debt associated with assets held for sale), compared to $369.6 million at December 31,2018. The decrease of $22.6 million in debt is primarily a result of:
• $1.1 million Revere Term Loan pay-off;• $12.3 million in payoffs as a result of asset sales;• $4.1 million of additional and scheduled principal pay-downs on the KeyBank Line of Credit; and• regularly scheduled principal
payments.• WHLR's weighted-average interest rate was 4.71% with a term of 4.19 years at December 31, 2019 (including debt associated with assets held for sale).• Net investment properties as of December 31, 2019 totaled at $417.9 million (including assets held for sale), compared to $441.4 million as of
December 31, 2018.
DIVIDENDS • At December 31, 2019, the Company had accumulated undeclared dividends of approximately $17.0 million to holders of shares of our Series A Preferred
Stock, Series B Preferred Stock, and Series D Preferred Stock of which $3.5 million and $14.0 million are attributable to the three and twelve monthsended December 31, 2019, respectively.
OPERATIONS AND LEASING • The Company's real estate portfolio is 89.8% leased as of December 31, 2019.• YTD 2019 Leasing
Activity• Executed 149 lease renewals totaling 1,036,017 square feet at a weighted-average increase of $0.34 per square foot, representing an increase of
4.17% over in-place rental rates.• Signed 43 new leases totaling approximately 117,605 square feet with a weighted-average rental rate of $12.82 per square foot.
• A new grocer tenant, ALDI, completed construction and opened in December 2019 an approximate 20,000 square foot grocery store, which replaced anexisting approximate 10,000 square foot outparcel building at JANAF Shopping Center. The annual base rent increases $58 thousand with the new tenantand the lease expiration extends 17 years. As a result of the demolition of the existing building, the Company incurred a $331 thousand noncash write-off.
• In September, a 20 year ground lease was executed for the development of a new Planet Fitness in the parking field at Freeway Junction in Stockbridge,Georgia.
• The Company’s gross leasable area ("GLA"), which is subject to leases that expire over the next twelve months and includes month-to-month leases,increased to approximately 13.10% at December 31, 2019, compared to 7.08% at December 31, 2018. At December 31, 2019, 44.34% of this expiringGLA is subject to renewal options.
SAME STORE RESULTSThe same store property pool includes those properties owned during all periods presented in their entirety, while the non-same stores property pool consistsof those properties acquired or disposed of during the periods presented. • Same store NOI for the three months ended December 31, 2019 compared to December 31, 2018, increased by 3.14% and 1.97% on a cash basis. Same
store results were impacted by a 4.6% increase in property expenses, primarily due to increased real estate tax and insurance expenses, which was offsetby increases in tenant reimbursement revenue.
• Same store NOI for the years ended December 31, 2019 compared to December 31, 2018, declined by 4.27% and 2.84% on a cash basis. Same storeresults were impacted by a 2.04% decrease in property revenues, primarily a result of the 2018 early termination fee associated with Farm Fresh atBerkley Center Shopping Center, rent modifications to certain 2018 SEG leases, reduced rent at the SEG recaptured and backfilled locations andincremental vacancies. Same Store property expenses increased 3.48% due to an increase in repairs and maintenance expense related to buildings andparking lots.
ACQUISITIONS • In April 2019, the Company absorbed an approximate 25,000 square foot outparcel at JANAF as a result of an unlawful detainer with a delinquent tenant.

DISPOSITIONS • Sold Jenks Plaza for a contract price of $2.2 million, generating a gain of $387 thousand and net proceeds of $1.8
million.• Sold a 1.28-acre portion of an undeveloped land parcel at Harbor Pointe for a contract price of $550 thousand resulting in net proceeds of $19 thousand,
paying off associated debt and retaining an approximate 4-acre unleveraged parcel.• Sold Graystone Crossing for a contract price of $6.0 million, generating a gain of $1.4 million and net proceeds of $1.7
million.• Sold Perimeter Square for a contract price of $7.2 million, generating a loss of $95 thousand and paying off associated
debt.
SUPPLEMENTAL INFORMATION Further details regarding Wheeler Real Estate Investment Trust, Inc.’s operations and financials for the year ended December 31, 2019, including asupplemental presentation, are available at https://ir.whlr.us/.
ABOUT WHEELER REAL ESTATE INVESTMENT TRUST, INC. Headquartered in Virginia Beach, VA, Wheeler Real Estate Investment Trust, Inc. is a fully-integrated, self-managed commercial real estate investmentcompany focused on owning and operating income-producing retail properties with a primary focus on grocery-anchored centers. Wheeler’s portfolio containswell-located, potentially dominant retail properties in secondary and tertiary markets that generate attractive, risk-adjusted returns, with a particular emphasison grocery-anchored retail centers. For additional information about the Company, please visit: www.whlr.us.
A copy of Wheeler’s Annual Report on Form 10-K, which includes the Company’s consolidated financial statements and management’s discussion & analysisof financial condition and results of operations, will be available upon filing via the U.S. Securities and Exchange Commission website (www.sec.gov) orthrough Wheeler’s website at www.whlr.us.

DEFINITIONS FFO, AFFO, Property NOI, EBITDA and Adjusted EBITDA are non-GAAP financial measures within the meaning of the rules of the Securities and ExchangeCommission. Wheeler considers FFO, AFFO, Property NOI, EBITDA and Adjusted EBITDA to be important supplemental measures of its operatingperformance and believes it is frequently used by securities analysts, investors and other interested parties in the evaluation of REITs, many of which presentFFO when reporting their results. FFO is intended to exclude GAAP historical cost depreciation and amortization of real estate and related assets, whichassumes that the value of real estate assets diminishes ratably over time. Historically, however, real estate values have risen or fallen with market conditions.Because FFO excludes depreciation and amortization unique to real estate and gains and losses from property dispositions, the Company believes that itprovides a performance measure that, when compared year-over-year, reflects the impact to operations from trends in occupancy rates, rental rates,operating costs, development activities and interest costs, providing perspective not immediately apparent from the closest GAAP measurement, net income.Management believes that the computation of FFO in accordance with NAREIT’s definition includes certain items that are not indicative of the operatingperformance of the Company’s real estate assets. These items include, but are not limited to, nonrecurring expenses, legal settlements, legal andprofessional fees, and acquisition costs. Management uses AFFO, which is a non-GAAP financial measure, to exclude such items. Management believes thatreporting AFFO in addition to FFO is a useful supplemental measure for the investment community to use when evaluating the operating performance of theCompany on a comparative basis. Management also believes that Property NOI, EBITDA and Adjusted EBITDA represent important supplemental measuresfor securities analysts, investors and other interested parties, as they are often used in calculating net asset value, leverage and other financial metrics usedby these parties in the evaluation of REITs.
FORWARD LOOKING STATEMENTS This press release may contain “forward-looking” statements as defined in the Private Securities Litigation Reform Act of 1995. When the Company useswords such as “may,” “will,” “intend,” “should,” “believe,” “expect,” “anticipate,” “project,” “estimate” or similar expressions that do not relate solely to historicalmatters, it is making forward-looking statements. Forward-looking statements are not guarantees of future performance and involve risks and uncertainties thatmay cause the actual results to differ materially from the Company’s expectations discussed in the forward-looking statements. The Company’s expectedresults may not be achieved, and actual results may differ materially from expectations. Specifically, the Company’s statements regarding; 1) future generationof financial returns from its portfolio; 2) its ability to create higher occupancy rates, increases in annual rent spreads and increased NOI; and 3) its ability toenter into an amendment to the Amended and Restated Credit Agreement with KeyBank are forward-looking statements. These statements are notguarantees of future performance and are subject to risks, uncertainties and other factors, some of which are beyond our control, are difficult to predict andcould cause actual results to differ materially from those expressed or forecasted in the forward-looking statements. For these reasons, among others,investors are cautioned not to place undue reliance upon any forward-looking statements in this press release.
Additional factors are discussed in the Company's filings with the U.S. Securities and Exchange Commission, which are available for review at www.sec.gov.The Company undertakes no obligation to publicly revise these forward-looking statements to reflect events or circumstances that arise after the date hereof.
Mary Jensen Investor [email protected] (757) 627-9088

Wheeler Real Estate Investment Trust, Inc. and SubsidiariesConsolidated Statements of Operations
(in thousands, except share and per share data)
Three Months Ended December
31, Years EndedDecember 31,
2019 2018 2019 2018REVENUE:
Rental revenues $ 15,896 $ 15,748 $ 62,442 $ 63,036Asset management fees 18 46 60 266Commissions — 38 65 140Other revenues 156 136 595 1,833
Total Revenue 16,070 15,968 63,162 65,275OPERATING EXPENSES:
Property operations 4,839 4,669 19,127 18,473Non-REIT management and leasing services — 16 25 75Depreciation and amortization 5,150 6,151 21,319 27,094Impairment of goodwill — 5,486 — 5,486Impairment of notes receivable — 1,739 5,000 1,739Impairment of real estate — 3,938 — 3,938Impairment of assets held for sale 51 — 1,598 —Corporate general & administrative 2,090 1,749 6,633 8,228Other operating expenses — — — 250
Total Operating Expenses 12,130 23,748 53,702 65,283(Loss) Gain on disposal of properties (33) 151 1,394 2,463
Operating Income (Loss) 3,907 (7,629) 10,854 2,455Interest income — 1 2 4Interest expense (4,591) (5,288) (18,985) (20,228)
Net Loss from Continuing Operations Before Income Taxes (684) (12,916) (8,129) (17,769)Income tax benefit (expense) 8 32 (15) (40)
Net Loss from Continuing Operations (676) (12,884) (8,144) (17,809)Net Income from Discontinued Operations — — — 903Net Loss (676) (12,884) (8,144) (16,906)
Less: Net loss attributable to noncontrolling interests (5) (336) (105) (406)
Net Loss Attributable to Wheeler REIT (671) (12,548) (8,039) (16,500)Preferred Stock dividends - declared — (169) — (9,790)Preferred Stock dividends - undeclared (3,657) (3,037) (14,629) (3,037)
Net Loss Attributable to Wheeler REIT Common Shareholders $ (4,328) $ (15,754) $ (22,668) $ (29,327)
Loss per share from continuing operations (basic and diluted) $ (0.45) $ (1.66) $ (2.34) $ (3.26)Income per share from discontinued operations — — — 0.09
$ (0.45) $ (1.66) $ (2.34) $ (3.17)Weighted-average number of shares:
Basic and Diluted 9,693,403 9,484,185 9,671,847 9,256,234

Wheeler Real Estate Investment Trust, Inc. and SubsidiariesConsolidated Balance Sheets
(in thousands, except par value and share data)
December 31, 2019 2018ASSETS:
Investment properties, net $ 416,215 $ 436,006Cash and cash equivalents 5,451 3,544Restricted cash 16,140 14,455Rents and other tenant receivables, net 6,905 5,539Notes receivable, net — 5,000Assets held for sale 1,737 6,118Above market lease intangibles, net 5,241 7,346Operating lease right-of-use assets 11,651 —Deferred costs and other assets, net 21,025 30,073
Total Assets $ 484,365 $ 508,081LIABILITIES:
Loans payable, net $ 340,913 $ 360,190Liabilities associated with assets held for sale 2,026 4,520Below market lease intangibles, net 6,716 10,045Operating lease liabilities 11,921 —Accounts payable, accrued expenses and other liabilities 9,557 12,116
Total Liabilities 371,133 386,871Series D Cumulative Convertible Preferred Stock (no par value, 4,000,000 shares authorized, 3,600,636shares issued and outstanding; $101.66 million and $91.98 million aggregate liquidation preference,respectively) 87,225 76,955
EQUITY: Series A Preferred Stock (no par value, 4,500 shares authorized, 562 shares issued and outstanding) 453 453Series B Convertible Preferred Stock (no par value, 5,000,000 authorized, 1,875,748 shares issued andoutstanding; $46.90 million aggregate liquidation preference) 41,087 41,000Common Stock ($0.01 par value, 18,750,000 shares authorized, 9,694,284 and 9,511,464 shares issuedand outstanding, respectively) 97 95Additional paid-in capital 233,870 233,697Accumulated deficit (251,580 ) (233,184 )
Total Shareholders’ Equity 23,927 42,061Noncontrolling interests 2,080 2,194
Total Equity 26,007 44,255Total Liabilities and Equity $ 484,365 $ 508,081

Wheeler Real Estate Investment Trust, Inc. and Subsidiaries Reconciliation of Funds From Operations (FFO)
(unaudited, in thousands)
Three Months Ended December 31,
Same Store Non-same Store Total Period Over Period
Changes 2019 2018 2019 2018 2019 2018 $ % Net (Loss) Income $ (939) $ (12,868) $ 263 $ (16) $ (676) $ (12,884) $ 12,208 94.75 %Depreciation andamortization of realestate assets 4,249 4,709 901 1,442 5,150 6,151 (1,001) (16.27)%Impairment ofgoodwill — 5,486 — — — 5,486 (5,486) (100.00)%Impairment of realestate — 3,938 — — — 3,938 (3,938) (100.00)%Impairment ofassets held for sale 51 — — — 51 — 51 100.00 %Loss (gain) ondisposal ofproperties — — 33 (151) 33 (151) 184 121.85 %FFO $ 3,361 $ 1,265 $ 1,197 $ 1,275 $ 4,558 $ 2,540 $ 2,018 79.45 %
Years Ended December 31, Same Store Non-same Store Total Year Over Year Changes 2019 2018 2019 2018 2019 2018 $ %Net (Loss) Income $ (9,122) $ (20,071) $ 978 $ 3,165 $ (8,144) $ (16,906) $ 8,762 51.83 %Depreciation andamortization of realestate assets 17,298 21,944 4,021 5,150 21,319 27,094 (5,775) (21.31)%Impairment ofgoodwill — 5,486 — — — 5,486 (5,486) (100.00)%Impairment of realestate — 3,938 — — — 3,938 (3,938) (100.00)%Impairment ofassets held for sale 451 — 1,147 — 1,598 — 1,598 100.00 %Gain on disposal ofproperties — — (1,394) (2,463) (1,394) (2,463) 1,069 43.40 %Gain on disposal ofproperties-discontinuedoperations — — — (903) — (903) 903 100.00 %FFO $ 8,627 $ 11,297 $ 4,752 $ 4,949 $ 13,379 $ 16,246 $ (2,867) (17.65)%

Wheeler Real Estate Investment Trust, Inc. and Subsidiaries Reconciliation of Funds From Operations (FFO)
(unaudited, in thousands)
Three Months Ended
December 31, Years EndedDecember 31,
2019 2018 2019 2018Net Loss $ (676) $ (12,884) $ (8,144) $ (16,906)Depreciation and amortization of real estate assets 5,150 6,151 21,319 27,094Loss (Gain) on disposal of properties 33 (151 ) (1,394 ) (2,463 )Gain on disposal of properties-discontinued operations — — — (903 )Impairment of goodwill — 5,486 — 5,486Impairment of assets held for sale 51 — 1,598 —Impairment of real estate — 3,938 — 3,938FFO 4,558 2,540 13,379 16,246Preferred stock dividends declared — (169 ) — (9,790 )Preferred stock dividends undeclared (3,657 ) (3,037 ) (14,629 ) (3,037 )Preferred stock accretion adjustments 170 169 680 678FFO available to common shareholders and common unitholders 1,071 (497 ) (570 ) 4,097Impairment of notes receivable — 1,739 5,000 1,739Acquisition and development costs 1 (46 ) 26 300Capital related costs 4 168 144 576Other non-recurring and non-cash expenses (1) (19 ) — 42 103Share-based compensation (242 ) 213 2 940Straight-line rental revenue, net straight-line expense 7 (244 ) 6 (1,197 )Loan cost amortization 371 681 1,707 2,363(Below) above market lease amortization (676 ) (274 ) (1,261 ) (695 )Recurring capital expenditures and tenant improvement reserves (280 ) (285 ) (1,126 ) (1,143 )AFFO $ 237 $ 1,455 $ 3,970 $ 7,083
Weighted Average Common Shares 9,693,403 9,484,185 9,671,847 9,256,234Weighted Average Common Units 234,900 259,054 234,999 389,421Total Common Shares and Units 9,928,303 9,743,239 9,906,846 9,645,655FFO per Common Share and Common Units $ 0.11 $ (0.05) $ (0.06) $ 0.42
AFFO per Common Share and Common Units $ 0.02 $ 0.15 $ 0.40 $ 0.73(1) Other non-recurring expenses are described in "Management's Discussion and Analysis of Financial Condition and Results of Operations" included in our Annual
Report on Form 10-K for the year ended December 31, 2019.

Wheeler Real Estate Investment Trust, Inc. and SubsidiariesReconciliation of Property Net Operating Income
(unaudited, in thousands)
Three Months Ended December 31, Same Store Non-same Store Total 2019 2018 2019 2018 2019 2018Net (Loss) Income $ (939) $ (12,868) $ 263 $ (16) $ (676) $ (12,884)Adjustments:
Income tax benefit (8 ) (32) — — (8) (32)Interest expense 3,873 4,355 718 933 4,591 5,288Interest income — (1) — — — (1)Loss (gain) on disposal of properties — — 33 (151) 33 (151)Corporate general & administrative 2,051 1,719 39 30 2,090 1,749Impairment of assets held for sale 51 — — — 51 —Impairment of real estate — 3,938 — — — 3,938Impairment of notes receivable — 1,739 — — — 1,739Impairment of goodwill — 5,486 — — — 5,486Depreciation and amortization 4,249 4,709 901 1,442 5,150 6,151Non-REIT management and leasing services — 16 — — — 16Asset management and commission revenues (18) (84) — — (18) (84)
Property Net Operating Income $ 9,259 $ 8,977 $ 1,954 $ 2,238 $ 11,213 $ 11,215
Property revenues $ 13,213 $ 12,758 $ 2,839 $ 3,126 $ 16,052 $ 15,884Property expenses 3,954 3,781 885 888 4,839 4,669
Property Net Operating Income $ 9,259 $ 8,977 $ 1,954 $ 2,238 $ 11,213 $ 11,215

Wheeler Real Estate Investment Trust, Inc. and SubsidiariesReconciliation of Property Net Operating Income (Continued)
(unaudited, in thousands)
Years Ended December 31, Same Store Non-same Store Total 2019 2018 2019 2018 2019 2018Net (Loss) Income $ (9,122) $ (20,071) $ 978 $ 3,165 $ (8,144) $ (16,906)Adjustments:
Income from Discontinued Operations — — — (903) — (903)Income tax expense 15 40 — — 15 40Interest expense 15,788 16,581 3,197 3,647 18,985 20,228Interest income (2) (4) — — (2) (4)Gain on disposal of properties — — (1,394) (2,463) (1,394) (2,463)Other operating expenses — — — 250 — 250Corporate general & administrative 6,439 8,040 194 188 6,633 8,228Impairment of assets held for sale 451 — 1,147 — 1,598 —Impairment of real estate — 3,938 — — — 3,938Impairment of notes receivable 5,000 1,739 — — 5,000 1,739Impairment of goodwill — 5,486 — — — 5,486Depreciation and amortization 17,298 21,944 4,021 5,150 21,319 27,094Non-REIT management and leasing services 25 75 — — 25 75Asset management and commission revenues (125) (406) — — (125) (406)
Property Net Operating Income $ 35,767 $ 37,362 $ 8,143 $ 9,034 $ 43,910 $ 46,396
Property revenues $ 51,355 $ 52,426 $ 11,682 $ 12,443 $ 63,037 $ 64,869Property expenses 15,588 15,064 3,539 3,409 19,127 18,473
Property Net Operating Income $ 35,767 $ 37,362 $ 8,143 $ 9,034 $ 43,910 $ 46,396

Wheeler Real Estate Investment Trust, Inc. and SubsidiariesReconciliation of Earnings Before Interest, Taxes, Depreciation and Amortization - EBITDA
(unaudited, in thousands)
Three Months Ended
December 31, Years EndedDecember 31,
2019 2018 2019 2018Net Loss $ (676) $ (12,884) $ (8,144) $ (16,906)Add back: Depreciation and amortization (1)
4,474 5,877 20,058 26,399
Interest Expense (2)4,591 5,288 18,985 20,228
Income tax (benefit) expense (8) (32) 15 40
EBITDA8,381 (1,751) 30,914 29,761
Adjustments for items affecting comparability:
Acquisition and development costs 1 (46) 26 300
Capital related costs 4 168 144 576
Other non-recurring and non-cash expenses (3)(19) — 42 103
Impairment of goodwill — 5,486 — 5,486
Impairment of notes receivable — 1,739 5,000 1,739
Impairment of assets held for sale 51 — 1,598 —
Impairment of real estate — 3,938 — 3,938
Loss (Gain) on disposal of properties 33 (151) (1,394) (2,463)
Gain on disposal of properties - discontinued operations — — — (903)
Adjusted EBITDA$ 8,451 $ 9,383 $ 36,330 $ 38,537
(1) Includes above (below) market leaseamortization.
(2) Includes loan costamortization.
(3) Other non-recurring expenses are described in "Management's Discussion and Analysis of Financial Condition and Results of Operations" included in our AnnualReport on Form 10-K for the period ended December 31, 2019.

Exhibit 99.2
Supplemental Operating and Financial Datafor the three months and year ended December 31, 2019

Table of Contents
PageCompany Overview 3Financial and Portfolio Overview 4Financial Summary Consolidated Balance Sheets 5Consolidated Statements of Operations 6Reconciliation of Non-GAAP Measures 7Debt Summary 10Portfolio Summary Property Summary 12Top Ten Tenants by Annualized Base Rent 14Leasing Summary 15Definitions 18
Forward-Looking Statements
This document contains forward-looking statements that are based on current expectations, forecasts and assumptions that involve risks and uncertainties that could causeactual outcomes and results to differ materially. These risks include, without limitation: adverse economic or real estate developments in the retail industry or the markets inwhich Wheeler Real Estate Investment Trust, Inc. operates; defaults on or non-renewal of leases by tenants; increased interest rates and operating costs; decreased rentalrates or increased vacancy rates; Wheeler Real Estate Investment Trust, Inc.'s failure to obtain necessary outside financing on favorable terms or at all; changes in theavailability of additional acquisition opportunities; Wheeler Real Estate Investment Trust, Inc.'s inability to successfully complete real estate acquisitions or successfullyoperate acquired properties and Wheeler Real Estate Investment Trust, Inc.'s failure to qualify or maintain its status as a REIT. For a further list and description of suchrisks and uncertainties that could impact Wheeler Real Estate Investment Trust, Inc.'s future results, performance or transactions, see the reports filed by Wheeler RealEstate Investment Trust, Inc. with the Securities and Exchange Commission, including its quarterly reports on Form 10-Q and annual reports on Form 10-K. Wheeler RealEstate Investment Trust, Inc. disclaims any intention or obligation to update or revise any forward-looking statements, whether as a result of new information, future eventsor otherwise.
Wheeler Real Estate Investment Trust | Supplemental Operating and Financial Data 2

Company OverviewHeadquartered in Virginia Beach, VA, Wheeler Real Estate Investment Trust, Inc. is a fully-integrated, self-managed commercial real estate investmentcompany focused on owning and operating income-producing retail properties with a primary focus on grocery-anchored centers. Wheeler’s portfolio containswell-located, potentially dominant retail properties in secondary and tertiary markets that generate attractive, risk-adjusted returns. Wheeler’s common stock,Series B convertible preferred stock and Series D cumulative convertible preferred stock trade publicly on the Nasdaq under the symbols “WHLR”, “WHLRP”and "WHLRD" , respectively.
Corporate Headquarters Wheeler Real Estate Investment Trust, Inc. Riversedge North 2529 Virginia Beach BoulevardVirginia Beach, VA 23452 Phone: (757) 627-9088Toll Free: (866) 203-4864 Website: www.whlr.us
Executive Management David Kelly - President & CEO Crystal Plum - CFO M. Andrew Franklin - COO
Board of Directors Andrew R. Jones (Chairman) Deborah MarkusStefani D. Carter Joseph D. StilwellClayton ("Chip") Andrews Paula J. PoskonKerry G. Campbell Daniel Khoshaba
Investor Relations Contact Transfer Agent and RegistrarMary Jensen [email protected] Virginia Beach BoulevardVirginia Beach, VA 23452Phone: (757) 627-9088www.whlr.us
Computershare Trust Company, N.A.250 Royall StreetCanton, MA 02021www.computershare.com
Wheeler Real Estate Investment Trust | Supplemental Operating and Financial Data 3

Financial and Portfolio OverviewFor the Three Months Ended December 31, 2019
Financial Results
Net loss attributable to Wheeler REIT common shareholders (in 000s) $ (4,328)Net loss per basic and diluted shares $ (0.45 )Funds from operations available to common shareholders and Operating Partnership (OP) unitholders(FFO) (in 000s) (1) $ 1,071FFO per common share and OP unit $ 0.11Adjusted FFO (AFFO) (in 000s) (1) $ 237AFFO per common share and OP unit $ 0.02
Assets and Leverage Investment Properties, net of $50.47 million accumulated depreciation (in 000s) $ 416,215Cash and Cash Equivalents (in 000s) $ 5,451Total Assets (in 000s) $ 484,365Debt to Total Assets(3) 71.65%Debt to Gross Asset Value 61.72%
Market Capitalization
Common shares outstanding9,694,284
OP units outstanding 234,019Total common shares and OP units 9,928,303
Shares Outstanding at
December 31, 2019 Fourth Quarter stock
price range Stock price as of December
31, 2019Common Stock 9,694,284 $1.36 - $2.43 $ 1.64Series B preferred shares 1,875,748 $10.05 - $13.21 $ 10.99Series D preferred shares 3,600,636 $13.25 - $16.53 $ 14.98
Total debt (in 000s)(3) $ 347,059Common Stock market capitalization (as of December 31, 2019 closing stock price, in 000s) $ 15,899
Portfolio Summary
Total Leasable Area (GLA) in sq. ft. 5,618,877Occupancy Rate 89.4%Leased Rate (2) 89.8%Annualized Base Rent (in 000s) $ 48,512Total number of leases signed or renewed during the fourth quarter of 2019 54Total sq. ft. leases signed or renewed during the fourth quarter of 2019 520,639
(1) See page 18 for the Company's definition of this non-GAAP measurement and reasons for using it.(2) Reflects leases executed through January 6, 2020 that commence subsequent to the end of current period.(3) Includes debt associated with assets held for sale.
Wheeler Real Estate Investment Trust | Supplemental Operating and Financial Data 4

Consolidated Balance Sheets$ in 000s
December 31, 2019 2018ASSETS:
Investment properties, net $ 416,215 $ 436,006Cash and cash equivalents 5,451 3,544Restricted cash 16,140 14,455Rents and other tenant receivables, net 6,905 5,539Notes receivable, net — 5,000Assets held for sale 1,737 6,118Above market lease intangibles, net 5,241 7,346Operating lease right-of-use assets 11,651 —Deferred costs and other assets, net 21,025 30,073
Total Assets $ 484,365 $ 508,081LIABILITIES:
Loans payable, net $ 340,913 $ 360,190Liabilities associated with assets held for sale 2,026 4,520Below market lease intangibles, net 6,716 10,045Operating lease liabilities 11,921 —Accounts payable, accrued expenses and other liabilities 9,557 12,116
Total Liabilities 371,133 386,871Series D Cumulative Convertible Preferred Stock (no par value, 4,000,000 shares authorized, 3,600,636 sharesissued and outstanding; $101.66 million and $91.98 million aggregate liquidation preference, respectively) 87,225 76,955
EQUITY: Series A Preferred Stock (no par value, 4,500 shares authorized, 562 shares issued and outstanding) 453 453Series B Convertible Preferred Stock (no par value, 5,000,000 authorized, 1,875,748 shares issued andoutstanding; $46.90 million aggregate liquidation preference) 41,087 41,000Common Stock ($0.01 par value, 18,750,000 shares authorized, 9,694,284 and 9,511,464 shares issuedand outstanding, respectively) 97 95Additional paid-in capital 233,870 233,697Accumulated deficit (251,580 ) (233,184 )
Total Shareholders’ Equity 23,927 42,061Noncontrolling interests 2,080 2,194
Total Equity 26,007 44,255Total Liabilities and Equity $ 484,365 $ 508,081
Wheeler Real Estate Investment Trust | Supplemental Operating and Financial Data 5

Consolidated Statements of Operations$ in 000s
Three Months Ended December
31, Years EndedDecember 31,
2019 2018 2019 2018REVENUE:
Rental revenues $ 15,896 $ 15,748 $ 62,442 $ 63,036Asset management fees 18 46 60 266Commissions — 38 65 140Other revenues 156 136 595 1,833
Total Revenue 16,070 15,968 63,162 65,275OPERATING EXPENSES:
Property operations 4,839 4,669 19,127 18,473Non-REIT management and leasing services — 16 25 75Depreciation and amortization 5,150 6,151 21,319 27,094Impairment of goodwill — 5,486 — 5,486Impairment of notes receivable — 1,739 5,000 1,739Impairment of real estate — 3,938 — 3,938Impairment of assets held for sale 51 — 1,598 —Corporate general & administrative 2,090 1,749 6,633 8,228Other operating expenses — — — 250
Total Operating Expenses 12,130 23,748 53,702 65,283(Loss) Gain on disposal of properties (33) 151 1,394 2,463
Operating Income (Loss) 3,907 (7,629) 10,854 2,455Interest income — 1 2 4Interest expense (4,591) (5,288) (18,985) (20,228)
Net Loss from Continuing Operations Before Income Taxes (684) (12,916) (8,129) (17,769)Income tax benefit (expense) 8 32 (15) (40)
Net Loss from Continuing Operations (676) (12,884) (8,144) (17,809)Net Income from Discontinued Operations — — — 903Net Loss (676) (12,884) (8,144) (16,906)
Less: Net loss attributable to noncontrolling interests (5) (336) (105) (406)Net Loss Attributable to Wheeler REIT (671) (12,548) (8,039) (16,500)
Preferred Stock dividends - declared — (169) — (9,790)Preferred Stock dividends - undeclared (3,657) (3,037) (14,629) (3,037)
Net Loss Attributable to Wheeler REIT Common Shareholders $ (4,328) $ (15,754) $ (22,668) $ (29,327)
Loss per share from continuing operations (basic and diluted) $ (0.45) $ (1.66) $ (2.34) $ (3.26)Income per share from discontinued operations — — — 0.09
$ (0.45) $ (1.66) $ (2.34) $ (3.17)Weighted-average number of shares:
Basic and Diluted 9,693,403 9,484,185 9,671,847 9,256,234
Wheeler Real Estate Investment Trust | Supplemental Operating and Financial Data 6

Reconciliation of Non-GAAP MeasuresFFO and AFFO (1) $ in 000s
Three Months Ended
December 31, Years EndedDecember 31,
2019 2018 2019 2018Net Loss $ (676) $ (12,884) $ (8,144) $ (16,906)Depreciation and amortization of real estate assets 5,150 6,151 21,319 27,094Loss (Gain) on disposal of properties 33 (151 ) (1,394 ) (2,463 )Gain on disposal of properties-discontinued operations — — — (903 )Impairment of goodwill — 5,486 — 5,486Impairment of assets held for sale 51 — 1,598 —Impairment of real estate — 3,938 — 3,938FFO 4,558 2,540 13,379 16,246Preferred stock dividends declared — (169 ) — (9,790 )Preferred stock dividends undeclared (3,657 ) (3,037 ) (14,629 ) (3,037 )Preferred stock accretion adjustments 170 169 680 678FFO available to common shareholders and common unitholders 1,071 (497 ) (570 ) 4,097Impairment of notes receivable — 1,739 5,000 1,739Acquisition and development costs 1 (46 ) 26 300Capital related costs 4 168 144 576Other non-recurring and non-cash expenses (2) (19 ) — 42 103Share-based compensation (242 ) 213 2 940Straight-line rental revenue, net straight-line expense 7 (244 ) 6 (1,197 )Loan cost amortization 371 681 1,707 2,363(Below) above market lease amortization (676 ) (274 ) (1,261 ) (695 )Recurring capital expenditures and tenant improvement reserves (280 ) (285 ) (1,126 ) (1,143 )AFFO $ 237 $ 1,455 $ 3,970 $ 7,083
Weighted Average Common Shares 9,693,403 9,484,185 9,671,847 9,256,234Weighted Average Common Units 234,900 259,054 234,999 389,421Total Common Shares and Units 9,928,303 9,743,239 9,906,846 9,645,655FFO per Common Share and Common Units $ 0.11 $ (0.05) $ (0.06) $ 0.42
AFFO per Common Share and Common Units $ 0.02 $ 0.15 $ 0.40 $ 0.73
(1) See page 18 for the Company's definition of this non-GAAP measurement and reasons for usingit.
(2) Other non-recurring expenses are described in "Management's Discussion and Analysis of Financial Condition and Results of Operations" included in our AnnualReport on Form 10-K for the year ended December 31, 2019.
Wheeler Real Estate Investment Trust | Supplemental Operating and Financial Data 7

Reconciliation of Non-GAAP Measures (continued)Property Net Operating Income (1) $ in 000s
Three Months Ended
December 31, Years EndedDecember 31,
2019 2018 2019 2018
Net Loss $ (676) $ (12,884) $ (8,144) $ (16,906)Adjustments:
Income from Discontinued Operations — — — (903)Income tax (benefit) expense (8) (32) 15 40Interest expense 4,591 5,288 18,985 20,228Interest income — (1) (2) (4)Loss (gain) on disposal of properties 33 (151) (1,394) (2,463)Other operating expenses — — — 250Corporate general & administrative 2,090 1,749 6,633 8,228Impairment of assets held for sale 51 — 1,598 —Impairment of real estate — 3,938 — 3,938Impairment of notes receivable — 1,739 5,000 1,739Impairment of goodwill — 5,486 — 5,486Depreciation and amortization 5,150 6,151 21,319 27,094Non-REIT management and leasing services — 16 25 75Asset management and commission revenues (18) (84) (125) (406)
Property Net Operating Income $ 11,213 $ 11,215 $ 43,910 $ 46,396
Property revenues $ 16,052 $ 15,884 $ 63,037 $ 64,869Property expenses 4,839 4,669 19,127 18,473
Property Net Operating Income $ 11,213 $ 11,215 $ 43,910 $ 46,396
(1) See page 19 for the Company's definition of this non-GAAP measurement and reasons for usingit.
Wheeler Real Estate Investment Trust | Supplemental Operating and Financial Data 8

Reconciliation of Non-GAAP Measures (continued)EBITDA (4) $ in 000s
Three Months Ended
December 31, Years EndedDecember 31,
2019 2018 2019 2018Net Loss $ (676) $ (12,884) $ (8,144) $ (16,906)Add back: Depreciation and amortization (1)
4,474 5,877 20,058 26,399
Interest Expense (2)4,591 5,288 18,985 20,228
Income tax (benefit) expense (8) (32) 15 40
EBITDA8,381 (1,751) 30,914 29,761
Adjustments for items affecting comparability:
Acquisition and development costs 1 (46) 26 300
Capital related costs 4 168 144 576
Other non-recurring and non-cash expenses (3)(19) — 42 103
Impairment of goodwill — 5,486 — 5,486
Impairment of notes receivable — 1,739 5,000 1,739
Impairment of assets held for sale 51 — 1,598 —
Impairment of real estate — 3,938 — 3,938
Loss (Gain) on disposal of properties 33 (151) (1,394) (2,463)
Gain on disposal of properties - discontinued operations — — — (903)
Adjusted EBITDA$ 8,451 $ 9,383 $ 36,330 $ 38,537
(1) Includes above (below) market leaseamortization.
(2) Includes loan costamortization.
(3) Other non-recurring expenses are described in "Management's Discussion and Analysis of Financial Condition and Results of Operations" included in our AnnualReport on Form 10-K for the period ended December 31, 2019.
(4) See page 18 for the Company's definition of this non-GAAP measurement and reasons for usingit.
Wheeler Real Estate Investment Trust | Supplemental Operating and Financial Data 9

Debt Summary as of December 31, 2019$ in 000sLoans Payable: $347.06
millionWeighted Average InterestRate:
4.71%
Property/Description Monthly Payment Interest
Rate Maturity December 31,
2019 December 31, 2018 Harbor Pointe (1) $ 11,024 5.85 % December 2018 $ — $ 460
Perimeter Square (1) Interest only 6.50 % June 2019 — 6,250
Perimeter Square construction loan (1) Interest only 6.50 % June 2019 — 247
Revere Term Loan $ 109,658 10.00 % April 2019 — 1,059
Senior convertible notes $ 234,199 9.00 % June 2019 — 1,369
DF I-Moyock $ 10,665 5.00 % July 2019 — 73
Rivergate $ 132,968 LIBOR + 295 basis points December 2019 21,545 22,117
KeyBank Line of Credit (6) $ 350,000 LIBOR + 350 basis points Various (6) 17,879 52,102
Folly Road $ 32,827 4.00 % March 2020 5,922 6,073
Columbia Fire Station $ 25,452 4.00 % May 2020 4,051 4,189
Shoppes at TJ Maxx $ 33,880 3.88 % May 2020 5,344 5,539
First National Bank Line of Credit (7) $ 24,656 LIBOR + 300 basis points September 2020 1,214 2,938
Lumber River $ 10,723 LIBOR + 350 basis points October 2020 1,404 1,448
JANAF Bravo $ 36,935 4.65 % January 2021 6,372 6,500
Walnut Hill Plaza $ 26,850 5.50 % September 2022 3,759 3,868
Litchfield Market Village $ 46,057 5.50 % November 2022 7,452 —
Twin City Commons $ 17,827 4.86 % January 2023 2,983 3,048
New Market $ 48,747 5.65 % June 2023 6,713 6,907
Benefit Street Note (3) $ 53,185 5.71 % June 2023 7,361 7,567
Deutsche Bank Note (2) $ 33,340 5.71 % July 2023 5,642 5,713
JANAF $ 333,159 4.49 % July 2023 50,599 52,253
Tampa Festival $ 50,797 5.56 % September 2023 8,077 8,227
Forrest Gallery $ 50,973 5.40 % September 2023 8,381 8,529
Riversedge North $ 11,436 5.77 % December 2023 1,767 1,800
South Carolina Food Lions Note (5) $ 68,320 5.25 % January 2024 11,675 11,867
Cypress Shopping Center $ 34,360 4.70 % July 2024 6,268 6,379
Port Crossing $ 34,788 4.84 % August 2024 6,032 6,150
Freeway Junction $ 41,798 4.60 % September 2024 7,725 7,863
Harrodsburg Marketplace $ 19,112 4.55 % September 2024 3,416 3,486
Graystone Crossing (1) $ 20,386 4.55 % October 2024 — 3,863
Bryan Station $ 23,489 4.52 % November 2024 4,394 4,472
Crockett Square Interest only 4.47 % December 2024 6,338 6,338
Pierpont Centre Interest only 4.15 % February 2025 8,113 8,113
Alex City Marketplace Interest only 3.95 % April 2025 5,750 5,750
Butler Square Interest only 3.90 % May 2025 5,640 5,640
Brook Run Shopping Center Interest only 4.08 % June 2025 10,950 10,950
Beaver Ruin Village I and II Interest only 4.73 % July 2025 9,400 9,400
Sunshine Shopping Plaza Interest only 4.57 % August 2025 5,900 5,900
Barnett Portfolio (4) Interest only 4.30 % September 2025 8,770 8,770
Fort Howard Shopping Center Interest only 4.57 % October 2025 7,100 7,100
Conyers Crossing Interest only 4.67 % October 2025 5,960 5,960
Grove Park Shopping Center Interest only 4.52 % October 2025 3,800 3,800
Parkway Plaza Interest only 4.57 % October 2025 3,500 3,500
Winslow Plaza Interest only 4.82 % December 2025 4,620 4,620
JANAF BJ's $ 29,964 4.95 % January 2026 4,957 5,065
Chesapeake Square $ 23,857 4.70 % August 2026 4,354 4,434
Berkley/Sangaree/Tri-County Interest only 4.78 % December 2026 9,400 9,400
Riverbridge Interest only 4.48 % December 2026 4,000 4,000
Franklin Village Interest only 4.93 % January 2027 8,516 8,516
Village of Martinsville $ 89,664 4.28 % July 2029 16,351 —
Laburnum Square Interest only 4.28 % September 2029 7,665 —
Total Principal Balance (1) 347,059 369,612
Unamortized debt issuance cost (1) (4,172 ) (5,144 )
Total Loans Payable, including assets held for sale 342,887 364,468
Less loans payable on assets held for sale, net loan amortization costs 1,974 4,278
Total Loans Payable, net $ 340,913 $ 360,190

(1) Includes loans payable on assets held for sale.(2) Collateralized by LaGrange Marketplace, Ridgeland and Georgetown.(3) Collateralized by Ladson Crossing, Lake Greenwood Crossing and South Park.(4) Collateralized by Cardinal Plaza, Franklinton Square, and Nashville Commons.(5) Collateralized by Clover Plaza, South Square, St. George, Waterway Plaza and Westland Square.(6) Collateralized by Darien Shopping Center, Devine Street, Lake Murray, Moncks Corner, Shoppes at Myrtle Park, South Lake and St. Matthews (assets held for sale). The various maturity dates are disclosed within Note 7included in our Annual Report on Form 10-K for the year ended December 31, 2019 under the KeyBank Line of Credit.(7) Collateralized by Surrey Plaza and Amscot Building.
Wheeler Real Estate Investment Trust | Supplemental Operating and Financial Data 10

Debt Summary as of December 31, 2019 (continued)Total Debt$ in 000s
Scheduled principal repayments and maturities by year Amount % Total Principal Payments
and MaturitiesDecember 31, 2020 $ 62,068 17.88%December 31, 2021 11,093 3.20%December 31, 2022 15,646 4.51%December 31, 2023 85,326 24.59%December 31, 2024 44,020 12.68%Thereafter 128,906 37.14% Total principal repayments and debt maturities $ 347,059 100.00 %
Wheeler Real Estate Investment Trust | Supplemental Operating and Financial Data 11

Property Summary as of December 31, 2019Property Location
Number ofTenants (1)
Total LeasableSquare Feet
PercentageLeased (1) Percentage Occupied Total SF Occupied
AnnualizedBase Rent (in 000's)
(2)Annualized Base Rentper Occupied Sq. Foot
Alex City Marketplace Alexander City, AL 17 147,791 96.8 % 96.8 % 142,991 $ 1,140 $ 7.98
Amscot Building (3) Tampa, FL 1 2,500 100.0% 100.0% 2,500 116 46.34
Beaver Ruin Village Lilburn, GA 28 74,038 93.7 % 89.2 % 66,036 1,137 17.22
Beaver Ruin Village II Lilburn, GA 4 34,925 100.0% 100.0% 34,925 452 12.95
Berkley (4) Norfolk, VA — — —% —% — — —
Berkley Shopping Center Norfolk, VA 10 47,945 42.0 % 42.0 % 20,140 253 12.54
Brook Run Shopping Center Richmond, VA 19 147,738 92.1 % 92.1 % 136,102 1,404 10.32
Brook Run Properties (4) Richmond, VA — — —% —% — — —
Bryan Station Lexington, KY 10 54,397 100.0% 100.0% 54,397 601 11.05
Butler Square Mauldin, SC 14 82,400 87.6 % 87.6 % 72,196 769 10.66
Cardinal Plaza Henderson, NC 9 50,000 100.0% 100.0% 50,000 479 9.58
Chesapeake Square Onley, VA 12 108,982 96.5 % 96.5 % 105,182 793 7.54
Clover Plaza Clover, SC 10 45,575 100.0% 100.0% 45,575 366 8.03
Columbia Fire Station Columbia, SC 3 21,273 77.3 % 77.3 % 16,450 450 27.35
Courtland Commons (4) Courtland, VA — — —% —% — — —
Conyers Crossing Conyers, GA 12 170,475 97.1 % 97.1 % 165,475 875 5.29
Crockett Square Morristown, TN 4 107,122 100.0% 100.0% 107,122 920 8.59
Cypress Shopping Center Boiling Springs, SC 17 80,435 41.2 % 41.2 % 33,175 448 13.51
Darien Shopping Center Darien, GA 1 26,001 100.0% 100.0% 26,001 156 6.00
Devine Street Columbia, SC 2 38,464 100.0% 100.0% 38,464 319 8.28
Edenton Commons (4) Edenton, NC — — —% —% — — —
Folly Road Charleston, SC 5 47,794 100.0% 100.0% 47,794 728 15.23
Forrest Gallery Tullahoma, TN 27 214,451 95.5 % 95.5 % 204,804 1,415 6.91
Fort Howard Shopping Center Rincon, GA 19 113,652 95.1 % 95.1 % 108,120 923 8.53
Freeway Junction Stockbridge, GA 18 156,834 99.1 % 99.1 % 155,343 1,262 8.12
Franklin Village Kittanning, PA 27 151,821 97.4 % 97.4 % 147,821 1,255 8.49
Franklinton Square Franklinton, NC 14 65,366 95.3 % 95.3 % 62,300 587 9.42
Georgetown Georgetown, SC 2 29,572 100.0% 100.0% 29,572 267 9.04
Grove Park Orangeburg, SC 13 93,265 98.4 % 98.4 % 91,741 718 7.83
Harbor Point (4) Grove, OK — — —% —% — — —
Harrodsburg Marketplace Harrodsburg, KY 8 60,048 91.0 % 91.0 % 54,648 414 7.58
JANAF (6) Norfolk, VA 126 825,006 83.8 % 83.3 % 687,579 8,176 11.89
Laburnum Square Richmond, VA 20 109,405 97.5 % 97.5 % 106,705 971 9.10
Ladson Crossing Ladson, SC 15 52,607 100.0% 100.0% 52,607 497 9.45
LaGrange Marketplace LaGrange, GA 11 76,594 88.3 % 88.3 % 67,594 377 5.57
Lake Greenwood Crossing Greenwood, SC 6 47,546 87.5 % 87.5 % 41,618 331 7.95
Lake Murray Lexington, SC 5 39,218 100.0% 100.0% 39,218 258 6.57
Litchfield Market Village Pawleys Island, SC 18 86,740 87.9 % 87.9 % 76,263 931 12.20
Lumber River Village Lumberton, NC 11 66,781 98.2 % 98.2 % 65,581 451 6.88
Moncks Corner Moncks Corner, SC 1 26,800 100.0% 100.0% 26,800 323 12.07
Nashville Commons Nashville, NC 11 56,100 97.3 % 97.3 % 54,600 589 10.80
New Market Crossing Mt. Airy, NC 13 117,076 96.0 % 96.0 % 112,368 998 8.88
Parkway Plaza Brunswick, GA 4 52,365 81.7 % 81.7 % 42,785 349 8.16
Pierpont Centre
Morgantown, WV
17 111,162 97.2 % 97.2 % 108,001 1,208 11.19
Port Crossing Harrisonburg, VA 8 65,365 96.1 % 96.1 % 62,800 821 13.07
Ridgeland Ridgeland, SC 1 20,029 100.0% 100.0% 20,029 140 7.00
Riverbridge Shopping Center Carrollton, GA 11 91,188 98.5 % 98.5 % 89,788 694 7.73
Riversedge North (5) Virginia Beach, VA — — —% —% — — —
Rivergate Shopping Center Macon, GA 31 201,680 97.0 % 97.0 % 195,719 2,836 14.49
Sangaree Plaza Summerville, SC 9 66,948 100.0% 100.0% 66,948 655 9.79
Wheeler Real Estate Investment Trust | Supplemental Operating and Financial Data 12

Property Summary as of December 31, 2019 (continued)
Property Location Number ofTenants (1)
Total LeasableSquare Feet
PercentageLeased (1) Percentage Occupied Total SF Occupied
AnnualizedBase Rent (in 000's) (2)
Annualized Base Rentper Occupied Sq. Foot
Shoppes at Myrtle Park Bluffton, SC 12 56,601 99.3 % 76.3 % 43,204 $ 547 $ 12.66
Shoppes at TJ Maxx Richmond, VA 14 93,624 94.5 % 94.5 % 88,483 1,084 12.26
South Lake Lexington, SC 5 44,318 14.2 % 14.2 % 6,300 91 14.49
South Park Mullins, SC 3 60,734 83.2 % 83.2 % 50,509 351 6.95
South Square Lancaster, SC 5 44,350 74.2 % 74.2 % 32,900 275 8.37
St. George Plaza St. George, SC 5 59,279 78.8 % 78.8 % 46,718 316 6.76
St. Matthews St. Matthews, SC 5 29,015 87.2 % 87.2 % 25,314 187 7.38
Sunshine Plaza Lehigh Acres, FL 22 111,189 98.2 % 98.2 % 109,186 1,014 9.29
Surrey Plaza Hawkinsville, GA 2 42,680 78.5 % 78.5 % 33,500 211 6.30
Tampa Festival Tampa, FL 16 137,987 63.8 % 63.8 % 87,966 664 7.54
Tri-County Plaza Royston, GA 5 67,577 87.4 % 87.4 % 59,077 382 6.47
Tulls Creek (4) Moyock, NC — — —% —% — — —
Twin City Commons Batesburg-Leesville, SC 5 47,680 100.0% 100.0% 47,680 435 9.12
Village of Martinsville Martinsville, VA 18 297,950 96.1 % 96.1 % 286,431 2,285 7.98
Walnut Hill Plaza Petersburg, VA 6 87,239 38.1 % 38.1 % 33,225 270 8.14
Waterway Plaza Little River, SC 10 49,750 100.0% 100.0% 49,750 488 9.81
Westland Square West Columbia, SC 8 62,735 74.4 % 74.4 % 46,690 427 9.14
Winslow Plaza Sicklerville, NJ 18 40,695 100.0% 100.0% 40,695 633 15.47
Total Portfolio 783 5,618,877 89.8 % 89.4 % 5,023,505 $ 48,512 $ 9.66
(1) Reflects leases executed through January 6, 2020 that commence subsequent to the end of the currentperiod.
(2) Annualized based rent per occupied square foot, assumes base rent as of the end of the current reporting period, excludes the impact of tenant concessions and rentabatements.
(3) We own the Amscot building, but we do not own the land underneath the buildings and instead lease the land pursuant to ground leases. As discussed in the financial statements, theseground leases require us to make annual rental payments and contain escalation clauses and renewal options.
(4) This information is not available because the property isundeveloped.
(5) This property is our corporate headquarters that we 100%occupy.
(6) Square footage is net of management office the Company occupies on premise and buildings on ground lease which the Company only leases theland.
Wheeler Real Estate Investment Trust | Supplemental Operating and Financial Data 13

Top Ten Tenants by Annualized Base Rent as ofDecember 31, 2019
Total Tenants : 783
Tenants Number of
Stores
Annualized BaseRent
($ in 000s)
% of TotalAnnualized Base
Rent
TotalOccupied
Square Feet
Percent TotalLeasable
Square Foot
Base Rent PerOccupied
Square Foot1. BI-LO (1) 10 $ 2,717 5.60% 380,675 6.77% $ 7.142. Food Lion 10 2,692 5.55% 325,576 5.79% 8.273. Piggly Wiggly 7 1,474 3.04% 191,363 3.41% 7.704. Kroger (2) 4 1,340 2.76% 186,064 3.31% 7.205. Winn Dixie (1) 3 863 1.78% 133,575 2.38% 6.466. Planet Fitness 5 783 1.61% 86,927 1.55% 9.017. Hobby Lobby 2 675 1.39% 114,298 2.03% 5.918. BJ's Wholesale Club 1 594 1.22% 147,400 2.62% 4.039. TJ Maxx 2 584 1.20% 69,783 1.24% 8.3710. Harris Teeter (2) 1 577 1.19% 39,946 0.71% 14.44 45 $ 12,299 25.34% 1,675,607 29.81% $ 7.34(1) These tenants are both owned by Southeastern Grocers.(2) These tenants are both owned by The Kroger Company.
Wheeler Real Estate Investment Trust | Supplemental Operating and Financial Data 14

Leasing Summary as of December 31, 2019Total Leasable Area: 5,618,877 square
feetTotal Square FootageOccupied:
5,023,505 squarefeet
Occupancy Rate: 89.4%
Lease Expiration Schedule
Lease Expiration Period
Number ofExpiringLeases
Total Expiring SquareFootage
% of TotalExpiring Square
Footage
% of TotalOccupied
Square FootageExpiring
ExpiringAnnualized
Base Rent (in000s)
% of TotalAnnualized Base
Rent
Expiring BaseRent PerOccupied
Square Foot
Available — 595,372 10.60% —% $ — —% $ —Month-to-Month 29 54,451 0.97% 1.08% 679 1.40% 12.472020 137 681,654 12.13% 13.57% 6,849 14.12% 10.052021 141 662,189 11.79% 13.18% 6,641 13.69% 10.032022 150 572,342 10.19% 11.39% 6,532 13.46% 11.412023 101 752,495 13.39% 14.98% 6,466 13.33% 8.592024 89 606,367 10.79% 12.07% 5,687 11.72% 9.382025 46 560,245 9.97% 11.15% 4,965 10.23% 8.862026 27 350,991 6.25% 6.99% 3,293 6.79% 9.382027 14 98,532 1.75% 1.96% 1,174 2.42% 11.912028 16 329,155 5.86% 6.55% 2,475 5.10% 7.522029 and thereafter 33 355,084 6.31% 7.08% 3,751 7.74% 10.56Total 783 5,618,877 100.00% 100.00% $ 48,512 100.00% $ 9.66
Wheeler Real Estate Investment Trust | Supplemental Operating and Financial Data 15
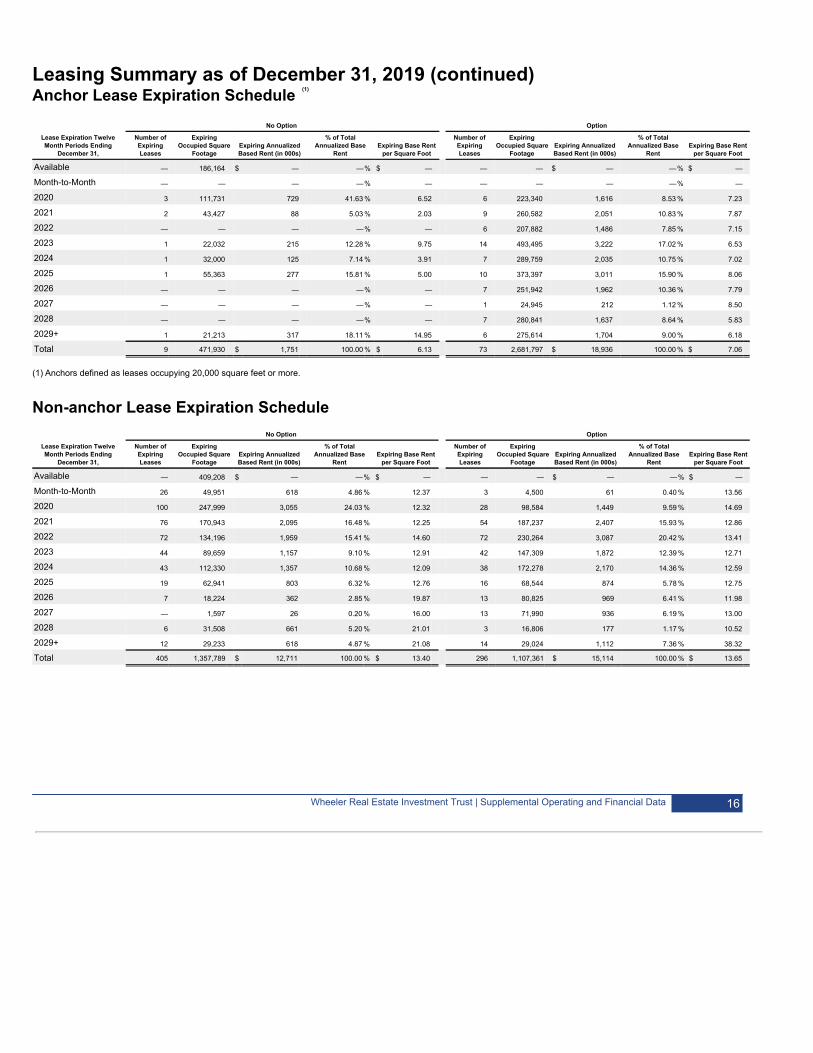
Leasing Summary as of December 31, 2019 (continued)Anchor Lease Expiration Schedule (1)
No Option Option
Lease Expiration TwelveMonth Periods Ending
December 31,
Number ofExpiringLeases
ExpiringOccupied Square
FootageExpiring AnnualizedBased Rent (in 000s)
% of TotalAnnualized Base
RentExpiring Base Rent
per Square Foot Number ofExpiringLeases
ExpiringOccupied Square
FootageExpiring AnnualizedBased Rent (in 000s)
% of TotalAnnualized Base
RentExpiring Base Rent
per Square Foot
Available — 186,164 $ — —% $ — — — $ — —% $ —
Month-to-Month — — — —% — — — — —% —
2020 3 111,731 729 41.63 % 6.52 6 223,340 1,616 8.53 % 7.23
2021 2 43,427 88 5.03 % 2.03 9 260,582 2,051 10.83 % 7.87
2022 — — — —% — 6 207,882 1,486 7.85 % 7.15
2023 1 22,032 215 12.28 % 9.75 14 493,495 3,222 17.02 % 6.53
2024 1 32,000 125 7.14 % 3.91 7 289,759 2,035 10.75 % 7.02
2025 1 55,363 277 15.81 % 5.00 10 373,397 3,011 15.90 % 8.06
2026 — — — —% — 7 251,942 1,962 10.36 % 7.79
2027 — — — —% — 1 24,945 212 1.12 % 8.50
2028 — — — —% — 7 280,841 1,637 8.64 % 5.83
2029+ 1 21,213 317 18.11 % 14.95 6 275,614 1,704 9.00 % 6.18
Total 9 471,930 $ 1,751 100.00 % $ 6.13 73 2,681,797 $ 18,936 100.00 % $ 7.06
(1) Anchors defined as leases occupying 20,000 square feet or more.
Non-anchor Lease Expiration Schedule No Option Option
Lease Expiration TwelveMonth Periods Ending
December 31,
Number ofExpiringLeases
ExpiringOccupied Square
FootageExpiring AnnualizedBased Rent (in 000s)
% of TotalAnnualized Base
RentExpiring Base Rent
per Square Foot Number ofExpiringLeases
ExpiringOccupied Square
FootageExpiring AnnualizedBased Rent (in 000s)
% of TotalAnnualized Base
RentExpiring Base Rent
per Square Foot
Available — 409,208 $ — —% $ — — — $ — —% $ —
Month-to-Month 26 49,951 618 4.86 % 12.37 3 4,500 61 0.40 % 13.56
2020 100 247,999 3,055 24.03 % 12.32 28 98,584 1,449 9.59 % 14.69
2021 76 170,943 2,095 16.48 % 12.25 54 187,237 2,407 15.93 % 12.86
2022 72 134,196 1,959 15.41 % 14.60 72 230,264 3,087 20.42 % 13.41
2023 44 89,659 1,157 9.10 % 12.91 42 147,309 1,872 12.39 % 12.71
2024 43 112,330 1,357 10.68 % 12.09 38 172,278 2,170 14.36 % 12.59
2025 19 62,941 803 6.32 % 12.76 16 68,544 874 5.78 % 12.75
2026 7 18,224 362 2.85 % 19.87 13 80,825 969 6.41 % 11.98
2027 — 1,597 26 0.20 % 16.00 13 71,990 936 6.19 % 13.00
2028 6 31,508 661 5.20 % 21.01 3 16,806 177 1.17 % 10.52
2029+ 12 29,233 618 4.87 % 21.08 14 29,024 1,112 7.36 % 38.32
Total 405 1,357,789 $ 12,711 100.00 % $ 13.40 296 1,107,361 $ 15,114 100.00 % $ 13.65
Wheeler Real Estate Investment Trust | Supplemental Operating and Financial Data 16
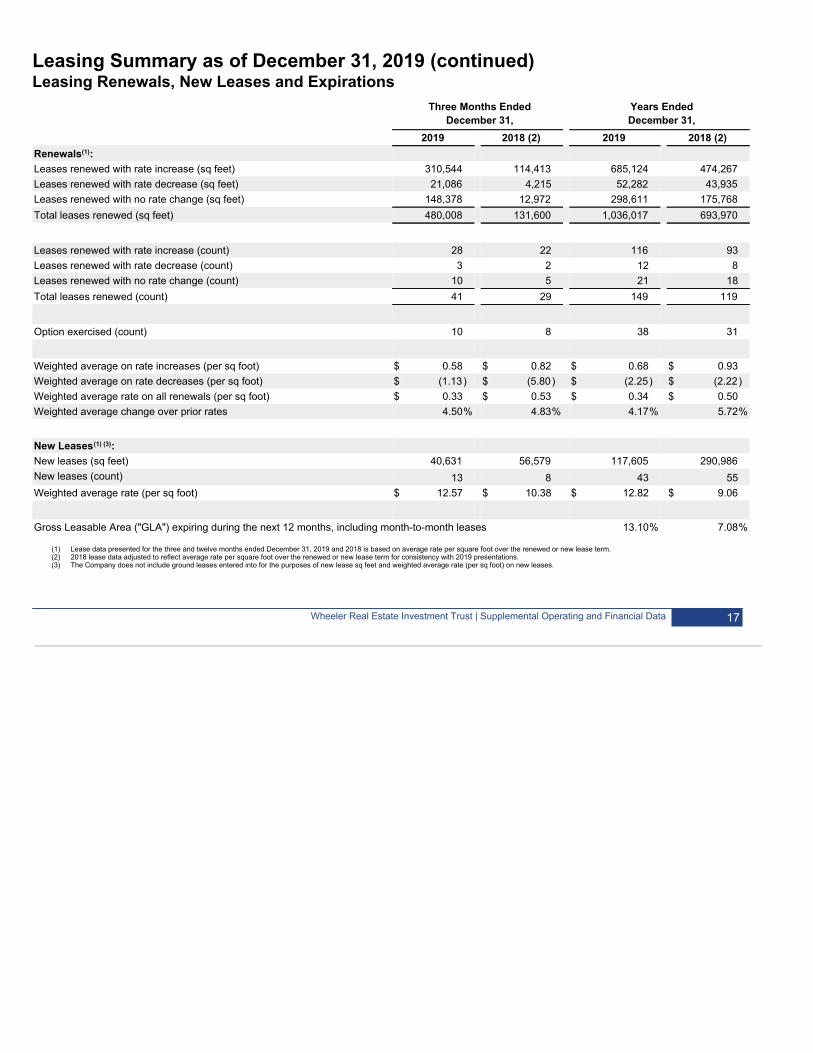
Leasing Summary as of December 31, 2019 (continued)Leasing Renewals, New Leases and Expirations
Three Months Ended
December 31, Years EndedDecember 31,
2019 2018 (2) 2019 2018 (2)Renewals(1): Leases renewed with rate increase (sq feet) 310,544 114,413 685,124 474,267Leases renewed with rate decrease (sq feet) 21,086 4,215 52,282 43,935Leases renewed with no rate change (sq feet) 148,378 12,972 298,611 175,768Total leases renewed (sq feet) 480,008 131,600 1,036,017 693,970
Leases renewed with rate increase (count) 28 22 116 93Leases renewed with rate decrease (count) 3 2 12 8Leases renewed with no rate change (count) 10 5 21 18Total leases renewed (count) 41 29 149 119
Option exercised (count) 10 8 38 31
Weighted average on rate increases (per sq foot) $ 0.58 $ 0.82 $ 0.68 $ 0.93Weighted average on rate decreases (per sq foot) $ (1.13) $ (5.80) $ (2.25) $ (2.22)Weighted average rate on all renewals (per sq foot) $ 0.33 $ 0.53 $ 0.34 $ 0.50Weighted average change over prior rates 4.50% 4.83% 4.17% 5.72%
New Leases(1) (3): New leases (sq feet) 40,631 56,579 117,605 290,986New leases (count) 13 8 43 55Weighted average rate (per sq foot) $ 12.57 $ 10.38 $ 12.82 $ 9.06
Gross Leasable Area ("GLA") expiring during the next 12 months, including month-to-month leases 13.10% 7.08%
(1) Lease data presented for the three and twelve months ended December 31, 2019 and 2018 is based on average rate per square foot over the renewed or new lease term.(2) 2018 lease data adjusted to reflect average rate per square foot over the renewed or new lease term for consistency with 2019 presentations.(3) The Company does not include ground leases entered into for the purposes of new lease sq feet and weighted average rate (per sq foot) on new leases.
Wheeler Real Estate Investment Trust | Supplemental Operating and Financial Data 17

DefinitionsFunds from Operations (FFO): an alternative measure of a REIT's operating performance, specifically as it relates to results ofoperations and liquidity. FFO is a measurement that is not in accordance with accounting principles generally accepted in the UnitedStates (GAAP). Wheeler computes FFO in accordance with standards established by the Board of Governors of NAREIT in its March1995 White Paper (as amended in November 1999 and December 2018). As defined by NAREIT, FFO represents net income (computedin accordance with GAAP), excluding gains (or losses) from sales of property, plus real estate related depreciation and amortization(excluding amortization of loan origination costs), plus impairment of goodwill and real estate related long-lived assets and afteradjustments for unconsolidated partnerships and joint ventures.
Most industry analysts and equity REITs, including Wheeler, consider FFO to be an appropriate supplemental measure of operatingperformance because, by excluding gains or losses on dispositions and excluding depreciation, FFO is a helpful tool that can assist in thecomparison of the operating performance of a company’s real estate between periods, or as compared to different companies.Management uses FFO as a supplemental measure to conduct and evaluate the business because there are certain limitationsassociated with using GAAP net income alone as the primary measure of our operating performance. Historical cost accounting for realestate assets in accordance with GAAP implicitly assumes that the value of real estate assets diminishes predictably over time, whilehistorically real estate values have risen or fallen with market conditions.
Adjusted FFO (AFFO): Management believes that the computation of FFO in accordance with NAREIT’s definition includes certainitems that are not indicative of the operating performance of the Company’s real estate assets. These items include, but are not limitedto, non-recurring expenses, legal settlements, acquisition costs and capital raise costs. Management uses AFFO, which is a non-GAAPfinancial measure, to exclude such items. Management believes that reporting AFFO in addition to FFO is a useful supplementalmeasure for the investment community to use when evaluating the operating performance of the Company on a comparative basis. TheCompany also presents Pro Forma AFFO which shows the impact of certain activities assuming they occurred at the beginning of theyear.
Earnings Before Interest, Taxes, Depreciation and Amortization (EBITDA): another widely-recognized non-GAAP financial measurethat the Company believes, when considered with financial statements prepared in accordance with GAAP, is useful to investors andlenders in understanding financial performance and providing a relevant basis for comparison among other companies, including REITs.While EBITDA should not be considered as a substitute for net income attributable to the Company’s common shareholders, netoperating income, cash flow from operating activities, or other income or cash flow data prepared in accordance with GAAP, theCompany believes that EBITDA may provide additional information with respect to the Company’s performance or ability to meet its futuredebt service requirements, capital expenditures and working capital requirements. The Company computes EBITDA by excluding interestexpense, net loss attributable to noncontrolling interests, depreciation and amortization and impairment of goodwill, long-lived assets andnotes receivable, from income from continuing operations. The Company also presents Adjusted EBITDA which excludes affecting thecomparability of the periods presented, including but not limited to, costs associated with acquisitions and capital related activities.
Wheeler Real Estate Investment Trust | Supplemental Operating and Financial Data 18

Net Operating Income (NOI): The Company believes that NOI is a useful measure of the Company's property operating performance.The Company defines NOI as property revenues (rental and other revenues) less property and related expenses (property operation andmaintenance and real estate taxes). Because NOI excludes general and administrative expenses, depreciation and amortization, interestexpense, interest income, provision for income taxes, gain or loss on sale or capital expenditures and leasing costs, impairment of assetsheld for sale and held for use, impairment of goodwill and impairment of notes receivable, it provides a performance measure, that whencompared year over year, reflects the revenues and expenses directly associated with owning and operating commercial real estateproperties and the impact to operations from trends in occupancy rates, rental rates and operating costs, providing perspective notimmediately apparent from net income. The Company uses NOI to evaluate its operating performance since NOI allows the Company toevaluate the impact of factors, such as occupancy levels, lease structure, lease rates and tenant base, have on the Company's results,margins and returns. NOI should not be viewed as a measure of the Company's overall financial performance since it does not reflectgeneral and administrative expenses, depreciation and amortization, impairment of goodwill, impairment of assets held for sale and heldfor use, involuntary conversion, interest expense, interest income, provision for income taxes, gain or loss on sale or disposition ofassets, and the level of capital expenditures and leasing costs necessary to maintain the operating performance of the Company'sproperties. Other REITs may use different methodologies for calculating NOI, and accordingly, the Company's NOI may not becomparable to that of other REITs.
Wheeler Real Estate Investment Trust | Supplemental Operating and Financial Data 19