What’s Working in Startup Acceleration - Welcome to …€™s Working in Startup Acceleration...
43
SOCIALENTERPRISEGOIZUETA What’s Working in Startup Acceleration Insights from Fifteen Village Capital Programs March 2016 VillageC apita l
Transcript of What’s Working in Startup Acceleration - Welcome to …€™s Working in Startup Acceleration...

SOCIALENTERPRISEGOIZUETA
What’s Working in Startup Acceleration
Insights from Fifteen Village Capital Programs
March 2016
VillageCapital

Authors
Peter W. Roberts, Academic DirectorSocial Enterprise @ Goizueta, Emory University
Saurabh Lall, Research Director Aspen Network of Development Entrepreneurs
Ross Baird, Executive Director Village Capital
Emily Eastman, Program Associate Social Enterprise @ Goizueta, Emory University
Abigayle Davidson, Research Analyst Aspen Network of Development Entrepreneurs
Amanda Jacobson, Latin America Manager Village Capital
Acknowledgements
This report would not have been possible without support from the leadership and staff at Village Capital. In addition to Ross and Amanda, we would like to single out contributions by Victoria Fram, Brittney Riley, Dustin Shay, Nasir Qadree, George Omedo, Kristen Moree, Varun Pawar, Allyson Plosko and Whitney Muse. We would also like to thank the Village Capital entrepreneurs, mentors and other program stakeholders who took the time for our interviews. Your insights and contributions to this report are greatly appreciated.
We also recognize that the Global Accelerator Learning Initiative (GALI) has been made possible by its co-creators and founding sponsors, including the U.S. Global Development Lab at the U.S. Agency for International Development, Omidyar Network, The Lemelson Foundation and the Argidius Foundation. Additional support for GALI has been provided by the Kauffman Foundation and Stichting DOEN.

TABLE OF CONTENTS
Introduction and Research Motivation 4
` Research methodology ..........................................................................................................................6
` About the programs in this report .....................................................................................................7
PART 1: The Early Impacts of Acceleration Honing in on Program Performance Contrasts 10
` Honing in on three metrics ................................................................................................................10
` Impacts of acceleration in year one: Examining early program performance outcomes.......................................................................12
` Explaining performance contrasts ....................................................................................................16
PART 2: Key Findings 20
` PREDICTION 1 Partner quality improves program performance..........................................................................21
` PREDICTION 2 Time spent on program-related activities lowers program performance. ........................... 22
` PREDICTION 3 Quality of the applicant pool improves program performance. .............................................. 22
` PREDICTION 4 More advanced ventures benefit more from acceleration. ....................................................... 23
` PREDICTION 5 Networking among cohort members improves program performance. .............................. 25
` PREDICTION 6 Emphasis on financial acumen improves program performance. ...........................................26
` PREDICTION 7 Mentor quality improves program performance. .........................................................................27
Implications for Action 30
Postscript 33
Appendices 34
` Appendix 1. Fifteen Village Capital programs ................................................................................35
` Appendix 2. Correlations among one-year changes ................................................................... 36
` Appendix 3. Performance contrasts for fifteen programs .........................................................37
` Appendix 4. Typology of program performance predictions .................................................. 38
Invitation to Join GALI 40
What’s Working in Startup
Acceleration Insights from Fifteen Village Capital Programs

W H A T ’ S W O R K I N G I N S T A R T U P A C C E L E R A T I O N3

I N S I G H T S F R O M F I F T E E N V I L L A G E C A P I T A L P R O G R A M S 4
Introductionand Research Motivation
There is growing interest among public and private sector organizations in supporting small and growing businesses as a catalyst for economic development around the world. This is stimulating a range of support mechanisms for early stage entrepreneurs, including incubators, angel investor networks, training programs and, more recently, accelerator programs.1Accelerators, which emerged in 2005 with the launch of Y-Combinator, differ from other entrepreneurial support programs in several ways:2
` They tend to be limited in duration, typically offering roughly three months of intense training and mentorship.
` They tend to select and work with cohorts of early stage entrepreneurs that go through the program as a single group.
` Finally, accelerators aim to facilitate greater connections with potential investors so that entrepreneurs can raise the growth capital necessary to accelerate their ventures.3 4
In the past decade, a wide array of acceleration models have emerged around the world, both in developed countries like the United States and the Netherlands and in emerging economies such as India, South Africa, Kenya, Mexico, and Brazil. These programs receive support from a range of sources, including governments, foundations, corporations, and universities.5 For example, the
1 Kempner,R.(2013).Incubatorsarepoppinguplikewildflowers.Innovations,8(3-4),3-6.
2 Cohen,S.(2013).Whatdoacceleratorsdo?Insightsfromincubatorsandangels.Innovations,8(3-4),19-25.
3 Cohen,S.&Hochberg,Y.V.(2014).Acceleratingstartups:Theseedacceleratorphenomenon.AvailableatSSRN2418000.
4 Miller,P.&Bound,K.(2011).Thestartupfactories:Theriseofacceleratorprogrammestosupportnewtechnologyventures.NESTA.
5 Dempwolf,C.S.,Auer,J.&D’Ippolito,M.(2014).Innovationaccelerators:Definingcharacteristicsamongstartupassistanceorganizations.SBAHQ-13-M-0197.USSmallBusinessAdministration.

W H A T ’ S W O R K I N G I N S T A R T U P A C C E L E R A T I O N5
World Bank’s infoDev program provides grant funding for accelerators working in developing countries. The Argidius Foundation also supports accelerator programs, including those run by Agora Partnerships and Technoserve in Latin America. As an example of corporate support, both companies and corporate foundations provide funding for the various cohorts of Points of Light Civic Accelerator entrepreneurs. Lastly, Santa Clara University is a prime example of university support, running the GSBI Accelerator through its Miller Center for Social Entrepreneurship.
These numerous acceleration programs, along with their cohort-based designs and relatively short durations, provide settings that should be appealing for researchers. However, very few published studies provide systematic insights about the impacts that accelerators are having on the ability of early-stage ventures to grow revenues and employees and to attract outside investment.6 Therefore, despite the existence of hundreds of programs around the world, we currently know little about their effectiveness or how differences across programs and models influence entrepreneur performance.
To address this shortcoming, Social Enterprise @ Goizueta at Emory University and the Aspen Network of Development Entrepreneurs (ANDE) launched the Global Accelerator Learning Initiative (GALI) in collaboration with a consortium of public and private funders. GALI builds on the work of the Entrepreneurship Database Program at Emory, which has been working with accelerator programs around the world to collect and analyze data describing the many entrepreneurs that they attract and support.
The Entrepreneurship Database Program works with a range of accelerators to collect systematic data from every entrepreneur who applies. Then, roughly six months after the completion of each program, participating and rejected entrepreneurs are re-surveyed to capture changes in venture performance. When aggregated, these data:
` Provide detailed information about thousands of entrepreneurs who sought the services of accelerator programs;
` Allow researchers to compare the performance of the two groups of participating and rejected entrepreneurs to generate reliable insights about program effectiveness; and
` Allow sector stakeholders to track changes in different variables to determine whether and how participating in an accelerator program has an impact on early-stage ventures.7
The first accelerator to work with the Entrepreneurship Database Program was Village Capital. Village Capital is a seed-stage accelerator that runs a number of programs that focus on supporting entrepreneurs in impact-oriented sectors such as agriculture, energy, education, financial inclusion, and health (see Figure 1 for an overview of the Village Capital model). They joined the Entrepreneurship Database Program in 2013, seeking to better understand the impacts of their various programs. By the end of 2015, application and follow-up data had been collected from fifteen different Village Capital programs (see Appendix 1 for a list of these fifteen programs).
6 Kempner,R.&Roberts,P.W.Aren’tacceleratorsgreat?Maybe…WSJAcceleratorsBlog.April10,2015.
7 Formoreinformationaboutourdata,reports,publicationsandpresscoverage,visitwww.entrepreneurdata.com or www.andeglobal.org/accelerators.

I N S I G H T S F R O M F I F T E E N V I L L A G E C A P I T A L P R O G R A M S 6
Ultimately, this report aims to provide accelerator program managers and funders with practical lessons and insights to consider for their own programs, based on the experiences and analysis of these fifteen Village Capital programs. Through this and other research efforts, we hope to stimulate more evidence-based learning and practice improvements in the entrepreneurial acceleration sector.
Research methodologyThe Village Capital data include application and follow-up information from hundreds of entrepreneurs who applied to similar-but-different programs run in different sectors and regions around the world. They present a unique opportunity to examine the performance of ventures accelerated by a range of Village Capital programs and to compare their performance to entrepreneurs who applied to these same programs but were not selected.
In this report, these venture-level data are used to estimate the short-term impacts of the different Village Capital programs in their ability to drive revenue, employee and investment growth. We estimate each program-level impact by calculating the average year-over-year change in revenues, full-time employees and investment levels (equity, debt and philanthropy) for entrepreneurs who participated in a program and for those who applied but were not accepted.
These calculations allow us to sort the fifteen programs by degree of impact, from those with very positive impacts to those with smaller — or even negative — impacts. With these program-level performance contrasts in hand, we engaged a team of Village Capital program experts to brainstorm potential explanations for these contrasts. These discussions yielded several predictions as to why certain accelerator programs outperformed others. We put the most promising of these predictions in front of our research team to devise specific research strategies for addressing each of them. In some cases, this called for a return to the application data. In other cases, it called for information that was gleaned from a carefully-designed survey for program managers. In the remaining cases, it called for structured interviews with entrepreneurs, mentors and other program stakeholders.
THE BASIC VILLAGE CAPITAL MODEL figure 01
2RECRUIT
fifteen entrepreneurs
with unique solutions to major
problems
3WORK
to refine business models through:
Customer interaction Hypothesis testing Mentor value-add Investor engagement
4 ASSESS
one another at the end of the program;entrepreneurs that are top-ranked by their peers receive
seed capital
1 DETERMINE
the location and sector of program
and recruit organizational
partners

W H A T ’ S W O R K I N G I N S T A R T U P A C C E L E R A T I O N7
This combination of expert predictions and carefully-collected data provided several findings that are relevant to the people responsible for designing and running accelerator programs; both Village Capital and other early-stage accelerator programs. We present these findings — related to the importance of program partners, pipeline development, entrepreneur selection and program design — in the main section of this report.
In the final section of this report, we provide guidance about the implications of these findings. Here, we ask decision-makers within Village Capital to make sense of the findings and to determine how to turn these insights into action.
About the programs in this report A range of public and private institutions are excited about the potential that accelerators have to transform early-stage ventures into world-changing companies. However, despite this enthusiasm, rigorous research on the actual and potential effectiveness of entrepreneurial acceleration has not kept pace with the proliferation of accelerator programs. There are literally hundreds of accelerators working in different sectors and regions around the world. Each has been working with subtly different models, but all are trying to grow early-stage ventures into businesses with the potential to scale. Despite these many pseudo-experiments with entrepreneurial acceleration, few studies have been able to leverage the data — both quantitative and qualitative — that these programs are generating to learn about what is and is not working.
Global Accelerator Learning InitiativeThe Global Accelerator Learning Initiative (GALI) is a recently-launched collaboration between the Aspen Network of Development Entrepreneurs (ANDE) and Social Enterprise @ Goizueta (SE@G) at Emory University. GALI is set up to explore and answer key questions about acceleration, such as: Do acceleration programs contribute to revenue growth? Do they help early-stage ventures attract investment? Do they work as well for developing-world entrepreneurs as they do for those in the developed world?
This report begins to address this critical research gap by leveraging several years of commitment on the part of three complementary organizations:
Aspen Network of Development EntrepreneursThe Aspen Network of Development Entrepreneurs (ANDE) is a global network of organizations that propel entrepreneurship in emerging markets. ANDE members provide critical financial, educational, and business support services to small and growing businesses (SGBs) based on the conviction that SGBs will create jobs, stimulate long-term economic growth, and produce environmental and social benefits. Ultimately, ANDE believes that SGBs can help lift countries out of poverty. ANDE is a program of of the Aspen Institute, an educational and policy studies organization.
Social Enterprise @ GoizuetaSocial Enterprise @ Goizueta is a research center within Emory University that applies business acumen and market-based solutions to achieve meaningful and enduring societal impacts. SE@G is home to the Entrepreneurship Database Program. This program partners with a range of accelerator programs, integrating a core set of questions into their application processes. Then, the program follows up with every entrepreneur who applied to these programs, including those who were not selected for acceleration. The comparative, longitudinal data that are collected and collated allow for a deeper understanding of how different programs are affecting the growth of early-stage ventures.

I N S I G H T S F R O M F I F T E E N V I L L A G E C A P I T A L P R O G R A M S 8
Village CapitalVillage Capital is a peer-selected accelerator program with a global vision and a community focus. Their early-stage entrepreneurs and investors thrive in communities driven by extensive training, experienced mentorship, and data-driven research. Village Capital focuses on stimulating collaboration among entrepreneurs within each of their programs. In many cases, cohorts focus on a specific societal issue; honing in on specific sectors like agriculture, education, energy, financial inclusion, and health. Focusing on specific sectors allows for peer-to-peer mentorship that may not be possible with more general programs. This produces a true immersion of entrepreneurs in each of the ventures. With this level of involvement, the entrepreneurs in each cohort are given the opportunity to select which ventures will receive $50,000+ investments from Village Capital and its partners at the conclusion of each program. This peer-selection model sets Village Capital apart from other programs. In 2013, Village Capital’s peer-to-peer model won the Harvard Business Review/McKinsey & Co.’s M-Prize Award for innovation.

W H A T ’ S W O R K I N G I N S T A R T U P A C C E L E R A T I O N9

I N S I G H T S F R O M F I F T E E N V I L L A G E C A P I T A L P R O G R A M S 1 0
PART 1:
The Early Impacts of Acceleration:
Honing in on Program Performance Contrasts
Honing in on three metrics The main challenge faced when studying the effectiveness of accelerator programs is that different programs seek to accelerate different things. To get a sense for the full range of variables that accelerators might focus on, consider Endeavor, which ‘works to catalyze long-term economic growth by selecting, mentoring, and accelerating the best high-impact entrepreneurs worldwide.’ A quick look at the impact dashboard for Endeavor shows the wide range of entrepreneurial outcomes — related to human, financial, intellectual and social capital — that accelerators might seek to promote, especially programs that work in developing countries and sectors.
Among the indicators tracked on Endeavor’s impact dashboard are those related to revenue, employment and investment. Given the almost universal desire to promote commercially sustainable and scalable businesses, and given the importance of these three variables in these business processes, this report focuses on the ability of Village Capital programs to accelerate the growth of revenues, full-time employment and investment (equity, debt and philanthropic) (see Box 1, for details about the revenue, employment and investment data used in this report). These three variables are clearly among those that Village Capital programs seek to accelerate and are also relevant to most of the other accelerators in our data. The Village Capital website reports that “over the past five years, program graduates have reached 6 million customers, created over 7,000 jobs, and raised more than $110 million in follow-on capital.”
A second challenge arises from the fact that the performance of non-selected ventures also changes over time. As such, it is not enough to show that accelerated ventures grew their revenues, employment or investment levels. Rather, the analysis must show that participating entrepreneurs are growing these variables faster on average than those who applied but were not accepted into programs.
A final challenge relates to the timeframe of the analysis. The underlying goal of accelerator programs is to stimulate the long-term development of the most promising entrepreneurs. However, most programs do the bulk of their acceleration work within a short window during the earliest stages of venture development. Therefore, the data that we currently have access to focus on the short-term (i.e., current year) effects of acceleration. Therefore, we must caution readers to be careful in interpreting the long-term implications of acceleration based on these initial results. While it is critical to better understand the effects of acceleration “in the moment,” it is entirely plausible that some of the most important effects of accelerators like the Village Capital programs might not be evident for several years.8
8 Wewillexaminelonger-termimpactsinfuturestudiesaswecontinuetotracktheperformanceofparticipatingandrejectedventures over time.

W H A T ’ S W O R K I N G I N S T A R T U P A C C E L E R A T I O N11
BOX 01
Venture-Level Revenue,
Employment and Investment Data
Several core survey questions generated the revenue, employment and investment data used in this report. As part of the application for each Village Capital program, entrepreneurs were asked the following questions. When responding, they were instructed to focus on the most recent calendar year. Roughly six months after the close of each program, entrepreneurs — both participating and rejected — were asked the same questions again, this time focusing on the calendar year in which the program took place. By comparing responses from these application and follow-up surveys, we are able to track the year-over-year changes in revenues, employees and investment for both rejected and participating entrepreneurs.
Using entrepreneurs who applied in 2013 as one example, the questions below are those asked during application and in the follow-up survey (in parenthesis):
What was your venture’s total earned revenue in calendar year 2012 (2013)?
Not counting founders, on December 31, 2012 (2013), how many people worked for your venture?
How much equity financing did your venture obtain from all outside sources in calendar year 2012 (2013)?
How much did your venture borrow from all sources in calendar year 2012 (2013)?
How much philanthropic support did your venture receive from all outside sources in calendar year 2012 (2013)?
The results in this report are based only on entrepreneurs who reported data at application time and in the first wave of follow-up surveys. To ensure that our program comparisons were not overly influenced by outlier observations, we examined the distribution of each of our main variables (revenues, full-time employees, equity, debt and philanthropic investment) and set aside those where reported values were clearly outside the typical range for each. For example, entrepreneurs (and their ventures) were dropped if reported revenues were greater than $US 5,000,000 at application or $US 2,800,000 in the first follow up survey; or if prior-year equity was greater than $US 1,500,000 at application or $US 1,200,000 in the first follow up survey. A total of ten observations were set aside; seven rejected entrepreneurs and three participating entrepreneurs.

I N S I G H T S F R O M F I F T E E N V I L L A G E C A P I T A L P R O G R A M S 1 2
Impacts of acceleration in year one: Examining early program performance outcomesBefore looking at the programs individually, it is useful to examine all fifteen Village Capital programs together. The information in Table 1 is based on application and follow-up surveys completed by 138 entrepreneurs who participated in one of the Village Capital programs in this report and another 427 who applied but were not accepted.9
FIFTEEN VILLAGE CAPITAL PROGRAMS table 01
REJECTED ENTREPRENEURS
AVERAGE
PARTICIPATING ENTREPRENEURS
AVERAGE
1-Year Revenue Growth $7,934 $11,329
1-Year Employee Growth
0.95 employees
1.36 employees
1-Year Investment Growth $6,274 $54,236
Equity $2,570 $24,588
Debt $2,357 $16,410
Philanthropy $1,347 $13,238
Sample Size 427 138 —
Statisticallysignificantdifferenceatthep<.05level: YES NO
Table 1 presents the average year-over-year change in reported revenues, full-time employees and investment levels observed during the year in which programs were run. The first column shows the average changes among the entrepreneurs who applied but were not accepted, while the second column shows the average changes for entrepreneurs who participated in a Village Capital program.
The first thing to note about Table 1 is that all of the cell values are positive. When we think about the impacts of accelerator programs, we must account for the fact that the rejected pools of entrepreneurs and ventures are also changing over time. Therefore, instead of simply looking at the raw change in numbers for participating entrepreneurs, we must compare these changes to the hold out group of rejected entrepreneurs.
In this respect, the second observation from Table 1 is that for each variable (revenue, employee and investment growth), the reported average for participating entrepreneurs is greater than the corresponding average for the rejected pool. However, many of these differences are not statistically significant.
9 TheinformationinTable1isinfluencedbyresponserates.Itisthereforeimportanttoconsiderwhethersurveyrespondentsare“representative”intheparticipatingandrejectedsamples.Atotalof138/178(78%)ofparticipatingentrepreneursprovidedfollow-updataandarethereforeincludedinthesample.Supplementaryanalysisrevealsthattheserespondentsarenotsignificantlydifferentfromnon-respondentsintermsofrevenues,employees,equity,debtorphilanthropyinvestmentlevelsreportedatapplication.Amongtherejectedentrepreneurs,427/1008(43%)providedfollow-updata.Here,respondentsarenotsignificantlydifferentintermsofrevenues,employees,equityordebtatapplication.However,notethatrespondentsweresignificantlyhigherthannon-respondentsintermsofphilanthropylevelsreportedatapplication.

W H A T ’ S W O R K I N G I N S T A R T U P A C C E L E R A T I O N1 3
The most obvious short-term Village Capital impact is on investment levels. While the average rejected entrepreneur increased new investment (equity, debt and philanthropy combined) by $6,274, the average program participant grew investment by $54,236. This more than eight-fold difference is statistically significant. Moreover, it is distributed widely across investment sources. During their year of acceleration, Village Capital entrepreneurs grew equity investment by more than nine-fold, new debt by almost seven-fold, and new philanthropic investment by almost ten-fold relative to the entrepreneurs who applied but were not accepted.
BOX 02
Program Performance for all 28 Programs
As we consider generalizing the findings of this study to non-Village Capital accelerator programs, it is important to see these overall Village Capital impacts in the context of those observed in the full sample of programs that participated in the Entrepreneurship Database Program during the 2013 to 2014 period.
Among all programs, including the fifteen Village Capital programs profiled in this study, we see a larger and significant impact on reported revenues. The 852 rejected entrepreneurs grew revenues by an average of $1,359 while 335 participating entrepreneurs reported an average increase of $32,965. At the same time, the impact of acceleration on investment was more modest, with participating entrepreneurs growing total investment by $34,528, compared to $11,255 for rejected entrepreneurs.
REJECTED ENTREPRENEURS
AVERAGE
PARTICIPATING ENTREPRENEURS
AVERAGE
1-Year Revenue Growth $1,359 $32,965
1-Year Employee Growth 0.66 1.11
1-Year Investment Growth $11,255 $34,528
Equity $4,951 $14,792
Debt $2,436 $7,520
Philanthropy $3,369 $12,216
Sample Size 852 335 —
Statisticallysignificantdifferenceatthep<.05level: YES NO

I N S I G H T S F R O M F I F T E E N V I L L A G E C A P I T A L P R O G R A M S 1 4
OUTLINE OF OUR RESEARCH PROCESS figure 02
VILLAGE CAPITAL PROGRAMS
2 “MOST-POSITIVE” PROGRAMS
4 HIGH-PERFORMING PROGRAMS
4 LOW-PERFORMING PROGRAMS
2 “MOST-NEGATIVE” PROGRAMS ACCEPTED REJECTED
RESULT15
1
2
3
4
5
6
7
8
9
10
11
12
13
14
15
FOLLOWED the same
process for each metric:
revenue employees investmentIDENTIFIED
the most positive and negative-performing programs based on these differentials
COMPARED performance of accepted versus
rejected entrepreneurs
These numbers shed light on one very important question: are accelerator programs working? Here, the answer seems to be “yes.” Across the board, accelerated ventures show higher growth in the variables that correlate with future success. These effects are especially prominent (and consistent) when it comes to driving investment toward promising early-stage ventures.10
10 Thisreportdoesnotaspiretoprovidethelastwordonthe“doesaccelerationwork”question.Rather,ourgoalistobeginunpackingtheaccelerationmodelandtoofferpracticalguidancetoprogrammanagersandfundersaboutmoreandlesspromisingpractices.Thus,itisbeyondthescopeofthisreporttodeterminewhethertheoverallinvestmentimpactisduetothe“treatment”effectofactuallyparticipatinginaspecificprogram,ortoVillageCapital’sspecificabilitytolocateandselect more promising entrepreneurs into their programs.

1 5
However, the main goal of this report is to dig deeper and learn from prominent performance contrasts observed across the fifteen Village Capital programs (see Figure 2). Here, we leverage the fact that some Village Capital programs do better than others when it comes to accelerating early-stage ventures. To hone in on these program performance contrasts, we identified programs in the sample with the largest and smallest differentials between the averages observed for participating and rejected entrepreneurs. We isolated the “most positive” two programs and the “most negative” two programs for each of our three metrics — revenues, employees and investment levels. Then, because the correlations between changes in revenues, employees and investment are typically quite low (see Appendix 2), we ensured that the candidate programs also fared reasonably well (or reasonable poorly) on the other two metrics.
HIGHEST VERSUS LOWEST-PERFORMING VILLAGE CAPITAL PROGRAMS table 02
Highest-Performing Lowest-Performing
PROGRAMAPPLICATION
YEARCOUNTRY
TYPETECH-
FOCUSED
1-YEARREVENUEGROWTH
DIFFERENCE
1-YEAREMPLOYEEGROWTH
DIFFERENCE
1-YEARINVESTMENT
GROWTHDIFFERENCE
Agriculture & Cleantech: Louisville 2013 Developed Some
what $73,882 1.09 $84,528
FinTech Mexico 2014 Developing Yes $108,777 1.42 $21,398
Energy: Boulder & Houston (US) 2014 Developed No $18,109 0.81 $141,888
EdTech: DC & Chicago (US) 2014 Developed Yes $114,667 3.28 $97,478
Impact: Nairobi 2013 Developing No $21,812 -0.46 $10,941
Health IT: Houston & Salt Lake City (US) 2014 Developed Yes -$343,658 -2.88 $55,689
Kenya: Innovations for Agriculture 2014 Developing Yes -$169,249 0.30 $23,128
Last Mile: Ahmedabad 2014 Developing No -$4,700 -2.27 $21,626

I N S I G H T S F R O M F I F T E E N V I L L A G E C A P I T A L P R O G R A M S 1 6
Table 2 presents the differences in accelerator program performance that we will emphasize in the next section of the report (see Appendix 3 for the full range of program performance outcomes). Among the four high-performing programs, the EdTech: DC & Chicago (US) program performed well across all three metrics, while the Agriculture & Cleantech: Louisville and Energy: Boulder & Houston (US) programs performed well on investment growth and reasonably well on the other two metrics. Finally, the FinTech Mexico program performed well on revenue growth. At the other end of the spectrum, the four low-performing programs included cases where the rejected entrepreneur group actually out-performed the group of participating entrepreneurs. Revenue growth differentials were negative for the Health IT: Houston & Salt Lake City (US) and Kenya: Innovations for Agriculture programs, while employee growth differentials were negative for the Health IT: Houston & Salt Lake City (US) and Last Mile: Ahmedabad programs.
With these observations in hand, we shift from answering the general question of whether acceleration is working to the more focused task of explaining these performance differences. This is simplified by the fact that Village Capital programs share a number of consistent program elements. For example, every program makes multiple $50K investments in the most promising ventures, with the investment decisions being made by participating entrepreneurs. These consistent program elements should, all else equal, produce consistent performance outcomes across programs. However, a number of factors that vary across programs might account for the observed performance differences. For example, Table 2 shows that three of the four high-performing programs were run in developed countries, while three of the four low-performing programs were run in developing countries (see Box 3 for more information on region and year effects).
Explaining performance contrastsTo get a handle on the full range of factors that might account for performance differences across programs, we assembled a small group of Village Capital staff with experience on one or more programs and presented them with the starkest program performance differences. We asked each of them to brainstorm all of the possible reasons why we might be seeing these performance differences.11 In this way, the predictions about accelerator effectiveness that we consider in this report are based on the collective judgment of individuals with deep experience running accelerator programs.
This brainstorming exercise generated a list of 133 potential reasons for accelerator program performance differences. With these in hand, our research team organized and consolidated the various explanations into a concise typology of categories and sub-categories. The major categories of explanations revealed by the program experts include: general, pipeline development, selection and program design (including curriculum, mentorship, and investment). Another more general category of explanations focuses on the program’s context; i.e., the country, sector and year of the program. The final category of explanation focuses on the quality of the data used to produce the observations (see Appendix 5 for the complete typology of factors).
This typology provided structure for analyzing how specific program elements might influence accelerator program outcomes. To ensure that this report remains focused on the most promising factors (as identified by our program experts), we settled on the following small set of potential explanations that were raised most often during the brainstorming session (see Figure 3).
11 ThespecificinstructionstotheVillageCapitalteamwere…“Foreachofthethreechartsbelow,pleasethinkforamomentandthenfillintheblankstosuggestallplausiblereasonswhytheremaybedifferencesbetweentheprogramsthathadpositiveimpacts on cohorts and those that had negative impacts. You do not have to believe every one of your listed reasons. We would liketobeexhaustiveinourdevelopmentofpossibleexplanations.Whenyouarefinished,however,pleaseindicatewhichofthelistedexplanationsyouthinkaremostplausible."

W H A T ’ S W O R K I N G I N S T A R T U P A C C E L E R A T I O N17
BOX 03
Year and Country Effects on
Village Capital Program Impacts
Programs from both application years and from developed and developing countries are found in each of the high-performing and low-performing groups. However, when interpreting the (mostly univariate) results presented in this report, it is important to remember that year and country context clearly matter. For example, the overall Village Capital revenue impact was much higher for programs that launched applications in 2013, while the investment impact was noticeably higher in that latter year. At the same time, the Village Capital revenue impact is higher on average for programs run in developing countries, while its investment impact is greater in developed-country programs.
APPLICATION YEAR
REJECTED ENTREPRENEURS
AVERAGE
PARTICIPATING ENTREPRENEURS
AVERAGE
1-YearRevenueGrowth
2013 ($11,947) $36,503
2014 $17,944 $315
1-YearEmployeeGrowth
2013 0.66 1.38
2014 1.1 1.35
1-YearInvestmentGrowth
2013 ($5,070) $31,163
2014 $11,986 $64,330
COUNTRY TYPE
REJECTED ENTREPRENEURS
AVERAGE
PARTICIPATING ENTREPRENEURS
AVERAGE
1-YearRevenueGrowth
Developed $21,069 $4,364
Developing ($4,082) $19,381
1-YearEmployeeGrowth
Developed 0.44 0.92
Developing 1.42 1.88
1-YearInvestmentGrowth
Developed $10,091 $83,534
Developing $2,783 $20,360

I N S I G H T S F R O M F I F T E E N V I L L A G E C A P I T A L P R O G R A M S 1 8
With these seven predictions in hand, we designed research strategies to assess each one. In some cases, the prediction took us back to the detailed application data. To shed light on whether differences in the quality of the applicant pool were consistent with program performance outcomes, we compared the applicant data across the high-performing and low-performing programs. In other cases, validating a prediction required specific information gathered in surveys of program managers. For example, to examine whether the quality of program partners influenced the performance of programs, we asked program managers specific questions about the partners involved in the high-performing and low-performing programs. Finally, some of the predictions required more qualitative insights that come from structured interviews with program stakeholders. To examine the relationship between mentor quality and program performance, we conducted interviews with entrepreneurs and other program stakeholders from the high-performing and low-performing programs.
PREDICTIONS EXAMINED IN THIS REPORT figure 03
Brainstorm with Village Capital
program experts – 133 potential
reasons
Construct typology of categories and
identify most popular predictions
What factors might explain the
differences between highest and lowest-
performing programs?
GENERAL FACTORS
Partner quality
Time spent on program activities
PIPELINE
Quality of applicant pool
SELECTION
What do selectors emphasize?
PROGRAM DESIGN
Networking
Financials and accounting training
Mentor quality

W H A T ’ S W O R K I N G I N S T A R T U P A C C E L E R A T I O N1 9

I N S I G H T S F R O M F I F T E E N V I L L A G E C A P I T A L P R O G R A M S 2 0
BOX 04
Average Cost of High- and
Low-Performing Programs
Before digging into our seven predictions, we calculated the average amount of money spent on the high-performing versus low-performing programs. In our program surveys, we asked each manager, “to the nearest $10,000, what is the total financial cost associated with running this program? Please include all living stipends paid to participating entrepreneurs, but do not include any financial investments that you expect to make into the ventures themselves.”
The four high-performing programs had an average spend of $140,321, which is more than $60,000 more than the average for the four low-performing programs. Note that this difference is not due to the fact that more low-performing programs were run in developing countries. In fact, the averages (across all fifteen programs) were $83,911 for developed-country programs and $118,333 for developing-country programs.
AVERAGEPROGRAMCOST HIGH-PERFORMING PROGRAMS
$140,321AVERAGEPROGRAMCOST LOW-PERFORMING PROGRAMS
$80,000
PART 2:
Key Findings
In this section, we combine information from the application and program-level surveys along with interview data gathered from entrepreneurs, mentors and other program stakeholders to critically evaluate each of the seven predictions listed in the previous section.

W H A T ’ S W O R K I N G I N S T A R T U P A C C E L E R A T I O N2 1
PREDICTION 1 SUPPORTED PARTNERQUALITYIMPROVESPROGRAMPERFORMANCE.SUMMARY ASSESSMENT
Partner organizations were rated much higher in the high-performing programs. Relative to those that worked on the low-performing programs, these organizations were described as “engaged”; “putting entrepreneurs first”; and “contributing to program content.”
According to Village Capital records, 31 organizational partners were recruited to work across the fifteen programs. These included Accion Venture Lab (FinTech Mexico), VentureWell (Agriculture & Cleantech: Louisville) and Chilton Capital (Energy: Boulder & Houston (US)). In all cases, partners were recruited to provide critical complementary resources for the different programs.
We asked three senior Village Capital leaders — each with broad experience across the fifteen programs — to “give a quick and simple grade to each partner”; with a grade of 1 indicating below average partner performance; 2 indicating average or expected partner performance; and 3 indicating above-average partner performance. These ratings were based on a “holistic assessment of the quality of contributions to program effectiveness.” Partner grades were then averaged across the three Village Capital leaders. Figure 4 shows that partner grades were much higher for the ten partners that worked on high-performing programs; an average grade of 2.52, compared to just 1.76 for the nine partners who worked on the low-performing programs.
We then asked these same three Village Capital leaders to “list up to five words that summarize why a particular program partner was rated above average or below average.” The most common partner descriptions for the high-performing program partners were “engaged” (four mentions versus one for the low-performing programs); “put entrepreneurs first” (six versus zero); and “contributed to program content” (four versus zero). On the other hand, the most common partner descriptions for the low-performing programs were “misfit” (three versus zero for the high-performing programs) and “disorganized” (three versus zero). In between, the partner descriptions that were observed with similar frequency across performance groups were “contributed to credibility” and “co-invested in ventures.”
PROGRAM PARTNER QUALITY figure 04
1.5 2.5 3.0
Low-Performing Programs
(9 Partners)1.76
2.52High-Performing
Programs (10 Partners)
1.0Below
Average
2.0 Average
3.0Above
Average

I N S I G H T S F R O M F I F T E E N V I L L A G E C A P I T A L P R O G R A M S 2 2
PREDICTION 2 SUPPORTED TIMESPENTONPROGRAM-RELATEDACTIVITIESLOWERSPROGRAMPERFORMANCE.SUMMARY ASSESSMENT
Rather than spending as much time as possible delivering program content, high-performing programs tended to set aside more time for entrepreneurs to work on their own.
There are concerns among some accelerator program managers and supporters that the time spent “in the classroom” can be detrimental to the early-stage entrepreneur who is trying to launch a successful company. Although time spent in organized activities with other entrepreneurs and mentors can provide valuable insights that might pay off down the road, it might be beneficial to give cohort entrepreneurs more time to work on their own (or with their own teams) to put a more limited range of structured insights into practice.
In our program-level surveys, we asked the managers of the fifteen programs to “give us a rough idea of how a typical entrepreneur allocated his/her time.” The responses allowed program managers to tell us roughly how much time was spent working on site versus remotely, and how much time was spent working with other entrepreneurs, with mentors or on their own. When we aggregated the responses, we found that the percentage of time spent working on-site or remotely with other entrepreneurs and/or mentors (versus working on their own) was 53% for the high-performing programs versus 83% for low-performing programs.
PREDICTION 3 SUPPORTED QUALITYOFTHEAPPLICANTPOOLIMPROVESPROGRAMPERFORMANCE.SUMMARY ASSESSMENT
The high-performing programs had smaller applicant pools on average. However, their applicants tended to have more intellectual property and more educational, entrepreneurial and senior management experiences.
To end up with the best cohorts of entrepreneurs, accelerator programs must attract promising entrepreneurs into their applicant pools. Typically, this involves a lot of work in the months leading up to the program, spreading the word about the program and its focus so that the most suited and most promising entrepreneurs apply.
Our comparative analysis of the high-performing and low-performing Village Capital programs reveal some interesting differences in program applicants (see Table 3). First, program success is not related to the size of the applicant pools. On average, the low-performing programs selected from almost 100 applicants, while high-performing programs considered roughly 75 applicants.
If — beyond some threshold level — the number of applicants does not influence program performance, then we must turn our attention to the quality of those applicants. Looking through a range of variables that characterize Village Capital program applicants (all taken from our initial application surveys), we find that the high-performing programs tended to attract ventures with

W H A T ’ S W O R K I N G I N S T A R T U P A C C E L E R A T I O N2 3
significantly more intellectual property — more patents, copyrights and trademarks. At the same time, the entrepreneurs who applied to these high-performing programs had more college degrees and more prior for-profit (but not nonprofit) founding experience. They were also more likely to have at least one founder with CEO or executive director experience in another company.
These differences — especially those that relate to entrepreneurial credentials — are not particularly surprising. However, they validate the importance of having more promising entrepreneurs in the applicant pool, as opposed to larger numbers of applicants.
APPLICANT POOL CHARACTERISTICS table 03
AVERAGE FOR HIGH-
PERFORMING PROGRAMS
AVERAGE FOR LOW-
PERFORMING PROGRAMS
Total applicants 75.6 98.5 —
Percentage with patents 27.5% 21.9%
Percentage with copyrights 20.5% 14.0%
Percentage with trademarks 39.7% 27.0%
Percentage of teams with college degrees 56.2% 39.0%
Percentage of teams with prior For-profit founding experience 68.9% 57.1%
Percentage of teams with prior Nonprofit founding experience 25.8% 27.0%
Percentage of teams with CEO / ED experience 46.0% 31.4%
Statisticallysignificantdifferenceatthep<.05level: YES NO
PREDICTION 4 NOT SUPPORTED MOREADVANCEDVENTURESBENEFITMOREFROMACCELERATION.SUMMARY ASSESSMENT
Program selectors for the high-performing programs placed more emphasis on the quality or promise of the underlying idea than the venture itself. This led them to select ventures that were younger on average.
In our program surveys, we asked program managers “what were selectors asked to emphasize when they made their selection decisions?” The respondents were asked to indicate how many points (out of 100) they should allocate to the quality or promise of the idea, the founding team or the enterprise itself. Responses from the high-performing and low-performing programs allocated a similar number of points (roughly 23 on average) to the quality of the team. However, high-performing programs allocated more points to the quality or promise of the idea (roughly 36 points

I N S I G H T S F R O M F I F T E E N V I L L A G E C A P I T A L P R O G R A M S 2 4

W H A T ’ S W O R K I N G I N S T A R T U P A C C E L E R A T I O N2 5
versus roughly 25 for the low-performing programs) and fewer points to the quality or promise of the current enterprise (roughly 41 points compared to roughly 53 for the low-performing programs).
Consistent with this orientation, the average venture age for program participants was 2.47 years for low-performing programs versus 1.73 years for high-performing programs.
PREDICTION 5 LIMITED SUPPORT NETWORKINGAMONGCOHORTMEMBERSIMPROVES PROGRAMPERFORMANCE.SUMMARY ASSESSMENT
Descriptions of cohort dynamics were mainly positive in both high and low-performing programs. While the differences were modest, participants in high-performing programs described the cohorts as being more partnership-oriented and as having more peer-to-peer involvement. Participants in low-performing programs did not describe a lack of peer-to-peer involvement in their cohorts but emphasized individual qualities, such as creativity and innovation.
Cohort dynamics were addressed in interviews with entrepreneurs, mentors, and other program informants. We received thirteen responses from the high-performing programs and eleven from the low-performing programs, asking each to list three adjectives that best describe the dynamics of their cohort, including how entrepreneurs worked together and got along, and to provide specific examples to support those descriptions.
While the adjectives used to describe cohort dynamics were largely positive among both high and low-performing programs, we did observe some minor trends:
Participants in high-performing programs described the entrepreneurs as collegial and supportive with emphasis on action and shared opportunity. They used adjectives such as “collaborative,” “productive,” and “sincere” and shared examples such as “everyone took comments and feedback well and used them to improve” and “it was a great environment to put it all on the table; a very transparent environment that nurtured a sense of sharing and vulnerability.” This suggests entrepreneurs within high-performing cohorts focused more on partnerships and peer-to-peer involvement.
Alternatively, low-performing cohorts seemed to place more emphasis on innovation and creativity when describing the entrepreneurs. Adjectives such as “innovative,” “passionate,” and “knowledgeable” were common, citing examples such as “entrepreneurs all wanted to change the world — always high intensity” and “people knew their sector and shared perspective on how to sell to specific targets.” This suggests the low-performing programs may have been more individualistic and self-sufficient.
Based on these differences, it appears that networking and collaboration within cohorts was more predominate among the high-performing programs, while innovation within ventures was more of the focus in low-performing programs. However, as participants from low-performing programs did not describe their cohorts as not collaborative or not partnership-orientated, these differences should be considered initial insights rather than definitive findings.
I N S I G H T S F R O M F I F T E E N V I L L A G E C A P I T A L P R O G R A M S 2 6
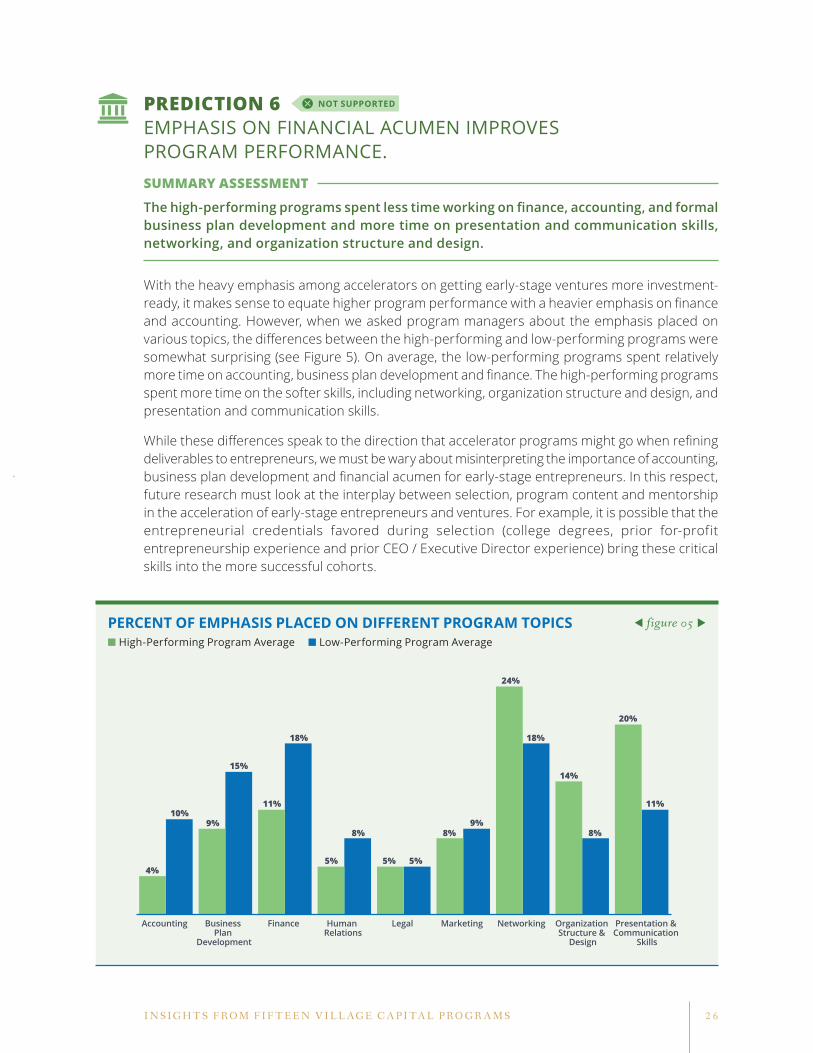
PREDICTION 6 NOT SUPPORTED EMPHASISONFINANCIALACUMENIMPROVES PROGRAMPERFORMANCE.SUMMARY ASSESSMENT
The high-performing programs spent less time working on finance, accounting, and formal business plan development and more time on presentation and communication skills, networking, and organization structure and design.
With the heavy emphasis among accelerators on getting early-stage ventures more investment-ready, it makes sense to equate higher program performance with a heavier emphasis on finance and accounting. However, when we asked program managers about the emphasis placed on various topics, the differences between the high-performing and low-performing programs were somewhat surprising (see Figure 5). On average, the low-performing programs spent relatively more time on accounting, business plan development and finance. The high-performing programs spent more time on the softer skills, including networking, organization structure and design, and presentation and communication skills.
While these differences speak to the direction that accelerator programs might go when refining deliverables to entrepreneurs, we must be wary about misinterpreting the importance of accounting, business plan development and financial acumen for early-stage entrepreneurs. In this respect, future research must look at the interplay between selection, program content and mentorship in the acceleration of early-stage entrepreneurs and ventures. For example, it is possible that the entrepreneurial credentials favored during selection (college degrees, prior for-profit entrepreneurship experience and prior CEO / Executive Director experience) bring these critical skills into the more successful cohorts.
PERCENT OF EMPHASIS PLACED ON DIFFERENT PROGRAM TOPICS figure 05
■ High-PerformingProgramAverage ■ Low-PerformingProgramAverage
Presentation & Communication
Skills
Organization Structure &
Design
NetworkingMarketingLegalHuman Relations
FinanceBusiness Plan
Development
Accounting
4%
9%
11% 11%
5% 5% 5%
8% 8%8%
24%
14%
20%
10%
15%
18% 18%
9%

W H A T ’ S W O R K I N G I N S T A R T U P A C C E L E R A T I O N2 7
PREDICTION 7 MIXED SUPPORT MENTORQUALITYIMPROVESPROGRAMPERFORMANCE.SUMMARY ASSESSMENT
High-performing programs connected entrepreneurs with a larger number of mentors. However, this did not translate into more time spent with mentors overall. While all programs tended to use similar individuals as mentors, there is some evidence that program alumni are not very effective mentors and that including potential customers as mentors is a good idea.
On average, high-performing Village Capital programs recruited 54 male mentors and 22 female mentors. On the other hand, the average low-performing program recruited only 29 male and 13 female mentors. Thus, while the gender composition of mentor pools was similar across the two groups of programs, the high-performing programs exposed entrepreneurs to a larger group of mentors.
But who were these mentors? According to our program-level surveys, all Village Capital programs recruited experienced investors, business practitioners and entrepreneurs to serve as mentors. It is therefore difficult to provide concrete insights about how mentor backgrounds influenced program performance. However, it is interesting to note that three of the four low-performing programs used program alumni as mentors, while none of the high-performing programs did so. On the other hand, two high-performing programs recruited potential customers to serve as mentors, while none of the low-performing programs did so.
Notwithstanding differences in the size of mentor pools, program performance was not related to the total amount of time spent working with these mentors. In fact, the low-performing programs reported that entrepreneurs spent roughly 34 percent of their program time working (on site and remotely) with mentors. Entrepreneurs in the high-performing programs spent less than 12 percent of their time working with mentors.
Of course, these high-level observations do not provide insights about the more subtle evaluations of mentors by participating entrepreneurs. We therefore raised questions about mentor quality in structured interviews with entrepreneurs and other program stakeholders. We asked each individual to list three adjectives that best describe their program’s mentors as a whole and to provide specific examples to support those descriptions. The adjectives used to describe mentors were mainly positive in both the high- and low-performing programs, with terms like “engaged” and “helpful” commonly expressed.

I N S I G H T S F R O M F I F T E E N V I L L A G E C A P I T A L P R O G R A M S 2 8
BOX 05
An Additional Role for Mentors?
In six of the fifteen programs considered in this study, individual mentors were specifically named during the promotion of the program; in recruitment flyers, emails or on program websites. It is interesting to note that half of the high-performing programs adopted this practice, compared to only one of the four low-performing programs. This suggests an additional benefit to having the right mentors — attracting more promising entrepreneurs into the application process.
MENTOR NAMES MENTIONED IN PROMOTION
Low-Performing Programs 25%
50%High-Performing Programs

W H A T ’ S W O R K I N G I N S T A R T U P A C C E L E R A T I O N2 9

I N S I G H T S F R O M F I F T E E N V I L L A G E C A P I T A L P R O G R A M S 3 0
Implications for Action
We close this report by respecting the division of labor between generating data-driven insights and determining what to do with them. Because Ross Baird and his team are in the best position to know which findings are most compelling and how Village Capital plans to react to them, we will share his reflections as the main recommendations from our report.
� The second best time to plant a tree is now.
– Chinese proverb
The most difficult part about understanding what works in entrepreneurship is how long it takes to see true results. Seed funds, incubators, accelerators, and other organizations supporting new ventures are deploying millions of dollars around the world – and we’ve got very little information on what is and is not working. To get useful data that inform these questions requires time and effort. Moreover, the best time to plant this tree, according to our Chinese proverb, was 20 years ago.
We do not have a twenty-year track record at Village Capital. However, for several years, we have been working with Social Enterprise @ Goizueta to understand what’s working in our various programs. We have run over 50 programs over the past seven years. Thanks to the Global Accelerator Learning Initiative, we are now able to take a systematic look at fifteen of those programs using solid data.
This report focuses on fifteen programs over the past several years globally, and with the help of GALI, we have evaluated the differences in (a) how we operated the program, and (b) what difference these changes made. In doing so, we looked at variables most closely related to improved outcomes for companies, specifically (1) increased revenue growth; (2) increased job creation; (3) increase in funds raised. Are there differences in programming that get more resources to entrepreneurs looking to grow, improve their businesses, and ultimately create more jobs?
In looking at the findings in this report, my team sees seven key insights for individuals looking to develop excellent programs that support the most promising entrepreneurs:

W H A T ’ S W O R K I N G I N S T A R T U P A C C E L E R A T I O N31
Accelerators have better results with ventures that have some initial revenues, but need to “speed up” investment. Because we run time-bound, limited-engagement programs, we generate better results for ventures that are based on great ideas and a limited track record, but need to accelerate the flow of investment funds. If it is true that entrepreneurship is a relay race, acceleration programs like ours may be better for this critical second lap of the race.
We need program partners who will roll up their sleeves. We’ve partnered with a lot of organizations and are now getting a better sense of what kinds of partners are better for our entrepreneurs. Partners that contribute to curriculum and play a meaningful role in programming tend to yield better outcomes. On the other hand, while they are really attractive, partners who simply add brand value (many of which are corporations) do not figure strongly into positive program outcomes.
For the applicant pool, focus on quality not quantity. Many programs — ourselves included — use quantity of applications as a proxy for program value. “We had 300 applications and picked just fifteen — we are more selective than Harvard!” These findings tell us that the expected quality of applicants (not surprisingly) has a stronger relationship with good program outcomes. What was somewhat surprising is that the quantity of applicants actually had an inverse relationship with program outcomes. This really makes us think about the amount of time (and bragging) we spend trying to drive those application numbers upward.
‘Less is more’ when it comes to program content. Programs where entrepreneurs spend a lot of time in the classroom — listening to guest speakers or to us teaching — have inferior outcomes. The more remote work we allow, the better. Accelerators would do well to design content as something that entrepreneurs do remotely as they work on their businesses, and save the on-site time for building valuable relationships.
Programs need to focus more on building entrepreneurial networks and less on delivering content. Many promising entrepreneurs don’t have access to resources because they don’t have the right networks. They didn’t go to the right schools, or don’t speak the same language as investors (in emerging markets, quite literally). The program time that is most closely related to better program outcomes was time that focused on overcoming these networking and communication challenges. Because many of our best entrepreneurs don’t come from well-connected backgrounds, networking sessions are literally levelling the playing field.
1
2
3
4
5

I N S I G H T S F R O M F I F T E E N V I L L A G E C A P I T A L P R O G R A M S 3 2
While understanding financials is clearly necessary for investment readiness, we should not be building more content or classes around finance and accounting. This is a provocative finding that makes us think about how we accelerate a necessary set of skills without taking our entrepreneurs to school.
If you’re an entrepreneur, don’t take accelerators at their word when they say “we provide mentorship”—ask who those mentors are and what they will be doing. We know that mentorship is critically important to what we do! In this respect, our programs do better when we expose our entrepreneurs to a broader set of mentors. However, we are not seeing the expected relationships between time spent with mentors and program outcomes. If I had to place a bet on where this research will go in the future, I would say that who we recruit is extremely important, and that entrepreneurs will want to know how we plan to expand their networks during our programs.
These are our initial reactions to the findings presented in this report. As the companies we have worked with continue to mature and grow, and as we continue to modify our programming into the future, we look forward to more opportunities to reflect on the data we are generating to ensure that our entrepreneurs are best served by the time they spend with us.
Ross Baird, Executive Director, Village Capital
6
7

W H A T ’ S W O R K I N G I N S T A R T U P A C C E L E R A T I O N3 3
Postscript
This report leverages two years of collaboration between GALI and Village Capital. Between 2013 and 2015, this partnership collected and collated data from hundreds of entrepreneurs who applied to fifteen different Village Capital programs. With these data in hand, we deployed a blended research methodology to assess seven specific predictions about the drivers of accelerator program performance that were developed by a team of program experts.
Some of our findings are equivocal. For instance, while we still believe that subtle differences in cohort dynamics will influence program performance, we were unable to provide reliable insights about their specific effects. In this respect, this report should be considered the first in a stream of research that uses quantitative and qualitative evidence to test specific ideas about the drivers of accelerator program effectiveness.
Some of our findings are interesting, although not completely surprising. For example, it seems sensible that programs that attract entrepreneurs with superior educational, entrepreneurial and professional credentials will deliver better program-level performance.
The remaining findings are the ones that lead to changes in how program managers think about designing and executing accelerators. For example:
` Program performance depends less on the size of applicant pools and more on their composition;
` Programs that spend less time on finance, accounting and business plan development perform better than the others;
` Programs that allow more time for entrepreneurs to work on their own tend to experience better performance; and
` Organizational partners that are willing to engage with entrepreneurs and to work on program content are more valuable than those that simply contribute to the program’s brand or credibility.
It is clear from the reactions from Ross Baird (in the previous section) that these latter findings are specifically relevant to future Village Capital programs. It is our hope — and belief — that they are also relevant to other programs that work in similar sectors and regions using similar program methodologies.
However, it is also clear that this report merely scratches the surface when it comes to generating specific and defensible insights that move the needle on our understanding of acceleration practices. In the course of completing this report, it became obvious to the research team that:
` There are many more research questions and variables than those covered in this report (see Appendix 4);
` There are many other accelerator program models that are quite different from the Village Capital model; and
` There are many (sector and country) contexts that will influence the kinds of observations presented in this report.
In this respect, the GALI team encourages (and stands ready to support) others who are prepared to see this report as the first among many that will use our expanding dataset to examine specific cause-effect relationships that lie behind effective accelerator program decision-making.

Appendices

W H A T ’ S W O R K I N G I N S T A R T U P A C C E L E R A T I O N3 5
APPENDIX 1.
Fifteen Village Capital programs
PROGRAM NAME YEAR HOST COUNTRY FOCUS PARTICIPANTS EXAMPLE VENTURES
Agriculture & Cleantech: Louisville 2013 United States Agriculture 13 Aisle Won, BlocPower,
Future Tech Farm
Agriculture: Louisville (US) 2014 United States Agriculture 10 FIn Gourmet, Growcentia,
IUNU
EdTech: DC & Chicago (US) 2014 United States Education 11 Mathalicious, MPOWER,
Pear Deck
Edupreneurs: India 2013 India Education 14
MangoSense Pvt Ltd, RMinds Education, Sage School
Edupreneurs: South Africa 2014 South Africa Education 11
Learning Horizon, Lekki Peninsula Affordable Schools, Mea Opus/Systemic
Energy: Boulder & Houston (US) 2014 United States Energy &
Water 10 e-Chromic Technologies, OptiEnz Sensors, PAX Pure
FinTech Mexico 2014 Mexico Financial Inclusion 12 BillPocket, Chapulin,
ComproPago
FinTech: Salt Lake City/Bay Area (US) 2014 United States Financial
Inclusion 11 WiseBanyan, eMoneyPool, MPOWER
Health IT: Boston (US) 2014 United States Health 12 Kohana, TruClinic, Rimidi
Diabetes
Health IT: Houston & Salt Lake City (US) 2014 United States Health 11 VerbalCare, 1DocWay,
Healarium, Inc.
Impact: Amsterdam 2013 Netherlands Impact 10 SolarSwing Energy, GreenGraffiti, Susteq
Impact: Nairobi 2013 Kenya Impact 14 Dinero Limited, ZanaAfrica Group, Baobantu Naturals
Kenya: Innovations for Agriculture 2014 Kenya Agriculture 10 Develatech Ltd, Esoko,
Mi-Crop
Last Mile: Ahmedabad 2014 India Impact 13 MicroX Labs, edustbin,
Krishi Star
Tech4Impact: Ahmedabad 2013 India Impact 8
Doctor On Call, GreenNerds Solutions, Aakar Innovations

I N S I G H T S F R O M F I F T E E N V I L L A G E C A P I T A L P R O G R A M S 3 6
APPENDIX 2.
Correlations among one-year changes
It is important to recognize that the factors that accelerate one of our variables of interest might have different effects on the other variables. This is clear in the following correlations among one-year growth outcomes in the full sample of ventures that applied to a Village Capital program and in the subset of ventures that participated. While there is a modest positive correlation between one-year growth in revenues and employees, the correlation between investment growth (the variable in which we see the biggest difference between selected and rejected) and the other two growth variables is roughly zero.
ALL VILLAGE CAPITAL APPLICANTS:
REVENUEGROWTH
EMPLOYEEGROWTH
INVESTMENTGROWTH
Revenue Growth 1.00
Employee Growth 0.21 1.00
Investment Growth 0.03 0.11 1.00
VILLAGE CAPITAL PARTICIPATING VENTURES:
REVENUEGROWTH
EMPLOYEEGROWTH
INVESTMENTGROWTH
Revenue Growth 1.00
Employee Growth 0.55 1.00
Investment Growth 0.01 0.04 1.00

APPENDIX 3.
Performance contrasts for fifteen programs
GROUP PROGRAMAPP
YEARCOUNTRY
TYPE*TECH-
FOCUSED
REVENUE CHANGE REJECTED
REVENUE CHANGE
PARTICIPATED DIFFERENCE
FT EMPLOYEES
CHANGEREJECTED
FT EMPLOYEES CHANGE
PARTICIPATED
DIFFERENCE
INVESTMENT CHANGEREJECTED
INVESTMENT CHANGE
PARTICIPATED DIFFERENCE
— Edupreneurs: India 2013 Developing No $2,892 $6,244 $3,352 0.48 2.44 1.97 $10,358 $55,111 $44,753
HighEnergy: Boulder &
Houston (US)2014 Developed No -$13,407 $4,702 $18,109 0.19 1.00 0.81 $12,712 $154,600 $141,888
LowLast Mile:
Ahmedabad2014 Developing No $12,733 $8,033 -$4,700 2.17 -0.10 -2.27 $16,295 $37,922 $21,626
LowKenya: Innovations
for Agriculture2014 Developing Yes $78,193 -$91,055 -$169,249 3.45 3.75 0.30 -$17,590 $5,538 $23,128
Low Impact: Nairobi 2013 Developing No $14,549 $36,361 $21,812 1.76 1.30 -0.46 $2,043 $12,984 $10,941
— Impact: Amsterdam 2013 Developed No $259,576 $87,183 -$172,392 -0.56 1.33 1.89 -$20,328 $14,083 $34,411
—Agriculture:
Louisville (US)2014 Developed No $20,533 $32,275 $11,742 0.41 1.33 0.92 -$5,492 $44,667 $50,158
—Health IT:
Boston (US)2014 Developed Somewhat -$11,063 -$2,329 $8,734 0.48 0.18 -0.30 $19,179 $93,455 $74,276
HighEdTech: DC & Chicago (US)
2014 Developed Yes $31,644 $146,312 $114,667 0.72 4.00 3.28 $32,967 $130,444 $97,478
—FinTech: Salt Lake City/Bay Area (US)
2014 Developed Yes $34,996 $77,483 $42,488 0.59 1.00 0.41 $27,676 $70,750 $43,074
LowHealth IT: Houston &
Salt Lake City (US)2014 Developed Yes $9,211 -$334,447 -$343,658 0.68 -2.20 -2.88 -$4,789 $50,900 $55,689
—Edupreneurs: South
Africa2014 Developing Somewhat -$20,904 $41,949 $62,852 0.00 2.92 2.92 $1,129 $4,771 $3,642
—Tech4Impact: Ahmedabad
2013 Developing Yes -$117,565 -$13,210 $104,355 0.29 0.14 -0.15 -$11,313 -$17,786 -$6,473
HighAgriculture &
Cleantech: Louisville2013 Developed Somewhat -$5,614 $68,268 $73,882 0.31 1.40 1.09 -$12,228 $72,300 $84,528
High FinTech Mexico 2014 Developing Yes $23,444 $132,221 $108,777 1.08 2.50 1.42 $18,720 $40,118 $21,398
* Based on the World Bank Country Classification. Countries designated as High-Income (with per capita GNI > $12,736) are classified as Developed, with all others classified as Developing.
3 7I N S I G H T S F R O M F I F T E E N V I L L A G E C A P I T A L P R O G R A M S

W H A T ’ S W O R K I N G I N S T A R T U P A C C E L E R A T I O N3 8
APPENDIX 4.
Typology of program performance predictions
PREDICTION (TIMES MENTIONED BY VILLAGE CAPITAL PROGRAM EXPERTS)
GENERAL
SectorFocus Thedegreeofsectorfocusaffectsprogramperformance(4)
Program Partner Quality Partnerqualityimprovesprogramperformance(4)
ProgramStaffQuality Thequalityofprogramstaffimprovesprogramperformance(4)
Program as Distraction Timespentonprogram-relatedactivitieslowersprogramperformance(5)
PIPELINE DEVELOPMENT
RecruitingTeamQuality Thequalityoftherecruitingteamimprovesprogramperformance(5)
Applicant Quality Thequalityoftheapplicantpoolimprovesprogramperformance(5)
SELECTION
Quality of Process Thequalityoftheselectionprocessimprovesprogramperformance(7)
Participant Quality Theaveragepromiseofselectedventuresimprovesprogramperformance(4)
Stage of Development Moreadvancedcompaniesbenefitmorefromacceleration(6)
PROGRAM DESIGN
Cohort Dynamics Cohortdiversityaffectsprogramperformance(2)
Cohortsizeaffectsprogramperformance(1)
Networkingamongcohortmembersimprovesprogramperformance(5)
Curriculum Emphasisonfinancialacumenimprovesprogramperformance(2)
Emphasis on organization and hiring improves program performance (2)
Mentorship Mentorqualityimprovesprogramperformance(6)
ExternalConnections Programswithbetterexternalconnectionshavebetterperformance(4)
Programswithbettercustomerconnectionshavebetterperformance(4)
Program Design – Investment Programswithbetteraccesstoinvestorshavebetterperformance(7)

I N S I G H T S F R O M F I F T E E N V I L L A G E C A P I T A L P R O G R A M S 3 9
APPENDIX 4. (CONTINUED)
Typology of program performance predictions
PREDICTION (TIMES MENTIONED BY VILLAGE CAPITAL PROGRAM EXPERTS)
DATA / MEASUREMENT ISSUES Results are driven by outliers (2)
Results are driven by response rates (1)
Some data are misreported (2)
Programbenefitswillbemoreobviousinyeartwo(4)
YEAR EFFECTS Program performance varies from year to year (1)
SECTOR EFFECTS Program performance varies systematically across sectors (26)
REGION EFFECTS Programperformancevariessystematicallyacrossregions(9)
OTHER COMMENTS Revenue, employment and investment performance outcomes are inter-related(8)

W H A T ’ S W O R K I N G I N S T A R T U P A C C E L E R A T I O N4 0
Photos generously provided by: 9 (bottom), 10, 15, 19, 20, 24 (top), 29 (bottom), 30, 32, 34, 41 (top), Back Cover John-Michael Maas/Darby Communications Cover (top), 3 (top), 4, 8, 9 (top), 17, 28, 31, 36, 39, 41 (bottom) Village Capital
GALI works in association with the Global Entrepreneurship Research Network; a working coalition of institutions funding research as a tool in realizing the full potential of entrepreneurship to create inclusive prosperity on a global scale.
Invitation to Join GALI
We invite interested accelerators to consider joining the Entrepreneurship Database Program to begin developing a more comprehensive understanding of acceleration practices and impacts. Although our accelerator partners are asked to devote time and energy to this project, they also gain from participation by getting:
` Deeper insights from reports about applicant pools, selection biases and impacts on revenue, employment and investment growth based on all entrepreneurs who apply to your program. These reports are valuable for programs that want to demonstrate impacts to program funders and supporters; and
` Visibility from the broader GALI network, which provides benefits for those looking to develop more visible platforms for participating entrepreneurs.
We invite you to indicate your interest by answering a few questions at: http://goo.gl/forms/pHTYHLVeHq.
ANDE is a policy program of The Aspen Institute.


Emory’s Entrepreneurship Database ProgramVisit us online at www.entrepreneurdata.com
Contact us at [email protected]
ANDE Research InitiativeVisit us online at www.andeglobal.org/research_initiativeContact us at [email protected]
SOCIALENTERPRISEGOIZUETA
TOLEARNMOREABOUTGALI ,PLEASEVISITANDEGLOBAL.ORG/ACCELERATORS
The views expressed in this document reflect the personal opinions of the authors and are entirely the authors’ own. They do not necessarily reflect the opinions of the
U.S. Agency for International Development (USAID) or the United States Government. USAID is not responsible for the accuracy of any information supplied herein.