WHAT’S GOING ON IN GEOSPACE?
52
VOL. 102 | NO. 5 MAY 2021 Cubism and You What PIs Can Do About Systemic Bias How’s the Weather on Titan? WHAT’S GOING ON IN GEOSPACE? Observational gaps could make it tougher to understand high-altitude climate change and avoid catastrophes in low-Earth orbit.
Transcript of WHAT’S GOING ON IN GEOSPACE?

VOL. 102 | NO. 5MAY 2021
Cubism and You
What PIs Can Do About Systemic Bias
How’s the Weather on Titan?
WHAT’S GOING ON IN
GEOSPACE?Observational gaps could make it tougher
to understand high-altitude climate change and avoid catastrophes in low-Earth orbit.


SCIENCE NEWS BY AGU // Eos.org 1
FROM THE EDITOR
Heather Goss, Editor in Chief
SCIENCE NEWS BY AGU // Eos.org 1
Vice President, Communications,Marketing,and Media Relations
Amy Storey
Production & Design
EditorialManager, News and Features Editor
Science EditorAssociate Editor
News and Features WriterNews and Features Writer
Caryl-Sue MicalizioTimothy OlesonAlexandra ScammellKimberly M. S. CartierJenessa Duncombe
AGU Sta�
Editor in Chief Heather Goss, AGU, Washington, D.C., USA; [email protected]
Communications SpecialistAssistant Director, Marketing & Advertising
Maria MuekaliaLiz Zipse
Marketing
AdvertisingDisplay Advertising
Recruitment Advertising
Steve [email protected]@wiley.com
Science AdvisersGeomagnetism, Paleomagnetism,
and ElectromagnetismSpace Physics and Aeronomy
CryosphereStudy of the Earth’s Deep Interior
GeodesyHistory of Geophysics
Planetary SciencesNatural Hazards
Volcanology, Geochemistry, and PetrologySocietal Impacts and Policy Sciences
SeismologyTectonophysics
Near-Surface GeophysicsEarth and Space Science Informatics
Mineral and Rock PhysicsOcean Sciences
Global Environmental ChangeEducationHydrology
TectonophysicsPaleoceanography and Paleoclimatology
Atmospheric SciencesNonlinear Geophysics
BiogeosciencesHydrology
Diversity and InclusionEarth and Planetary Surface Processes
Atmospheric and Space ElectricityGeoHealth
Julie Bowles
Christina M. S. CohenEllyn EnderlinEdward J. GarneroBrian C. GunterKristine C. HarperSarah M. HörstMichelle HummelEmily R. JohnsonChristine Kirchho� Keith D. KoperJian LinJuan LorenzoKirk MartinezSébastien MerkelJerry L. MillerHansi SinghEric M. RiggsKerstin StahlCarol A. SteinKaustubh ThirumalaiMika Tosca Adrian TuckMerritt TuretskyAdam S. WardLisa D. WhiteAndrew C. WilcoxYoav YairBen Zaitchik
Manager, Production and OperationsProduction and Analytics Specialist
Assistant Director, Design & BrandingSenior Graphic DesignerSenior Graphic Designer
Graphic Design Intern
Faith A. IshiiAnaise AristideBeth BagleyValerie FriedmanJ. Henry PereiraClaire DeSmit
©2021. AGU. All Rights Reserved. Material in this issue may be photocopied by individual scientists for research or classroom use. Permission is also granted to use short quotes, fi gures, and tables for publication in scientifi c books and journals. For permission for any other uses, contact the AGU Publications O� ce.
Eos (ISSN 0096-3941) is published monthly by AGU, 2000 Florida Ave., NW, Washington, DC 20009, USA. Periodical Class postage paid at Washington, D.C., and at additional mailing o� ces. POSTMASTER: Send address changes to Member Service Center, 2000 Florida Ave., NW, Washington, DC 20009, USA
Member Service Center: 8:00 a.m.–6:00 p.m. Eastern time; Tel: +1-202-462-6900; Fax: +1-202-328-0566; Tel. orders in U.S.: 1-800-966-2481; [email protected].
Submit your article proposal or suggest a news story to Eos at bit.ly/Eos-proposal.
Views expressed in this publication do not necessarily refl ect o� cial positionsof AGU unless expressly stated.
Randy Fiser, Executive Director/CEO
Paying Attention to the “Ignorosphere”
In our May issue of Eos, we are looking up at a region of Earth’s atmosphere, the scientists in these pages argue, that we aren’t looking at quite enough. That region is called
geospace, which encompasses the mesosphere and the ther-mosphere from altitudes of around 45 to 1,000 kilometers.
In “An Observational Gap at the Edge of Space,” Martin Mlynczak and colleagues write about how geospace is sensi-tive to changes in carbon dioxide. Some research has already shown that effects from climate change are changing the den-sity of geospace and thus aerodynamic drag in this “atmo-spheric borderland” where satellites orbit. Although there are missions observing this region right now, most are past their design lifetimes and have no successors, leaving a looming gap. Read more about the importance of collecting data from geospace on page 36.
Sean Bruinsma and colleagues go into more detail about the consequences to the ever more populated low-Earth orbital paths in “Charting Satellite Courses in a Crowded Thermosphere” on page 19. “Despite progress made over the past couple of decades, large uncertainties still exist in estimates of the solar, magnetospheric, and gravity wave energy input to—and thus in how this energy affects—the thermosphere,” write the authors, who suggest that a geospace- focused study be commissioned in time for the next heliophysics decadal survey.
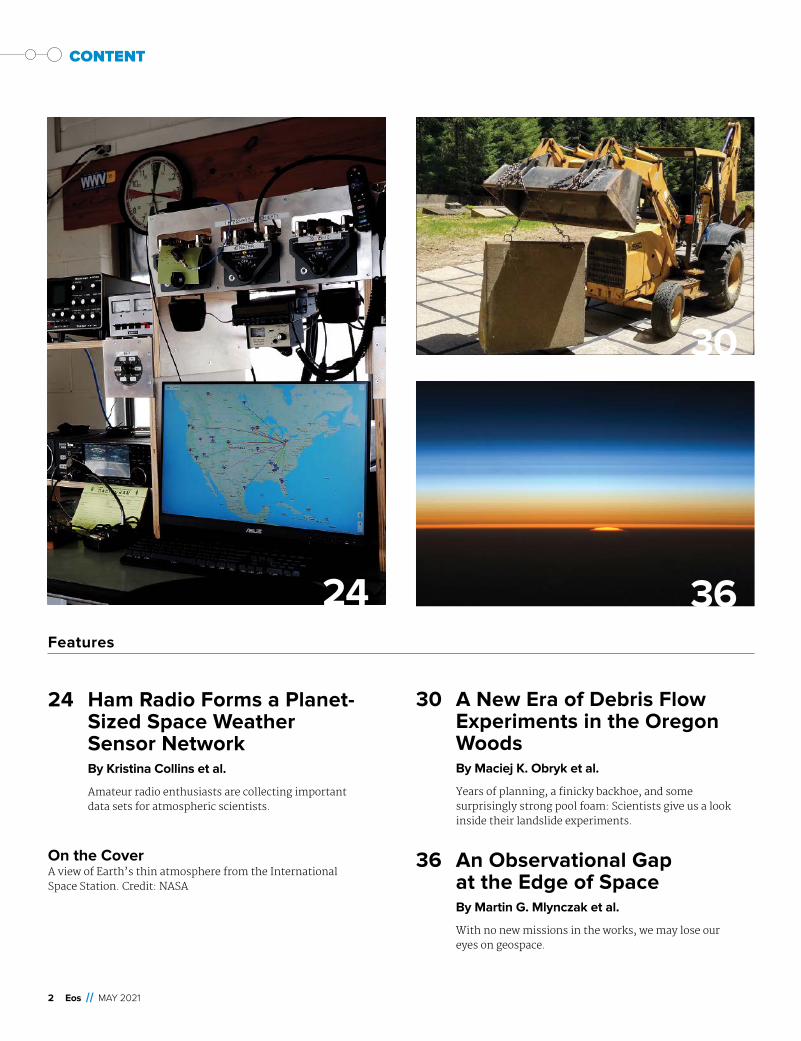
Could one solution for the data gap be...ham radio? One group called the Ham Radio Science Citizen Investigation, or HamSCI, is harnessing access to inexpensive, open- source instru-mentation along with their passionate, global community to create usable data sets for researchers. The group is particularly focused on the ionosphere, the layer of geospace that reflects radio waves, and how it experiences variability that affects the propagation of those signals. This work may not replace the real- time, continuous observations that space mis-sions can provide, but it is already contributing to research. Read more from Kristina Collins and colleagues in “Ham Radio Forms a Planet- Sized Space Weather Network” on page 24.
In another wonderful story about nonscientists providing important data to researchers, read about auroral “dunes” on page 13. A group of amateur astronomers in Finland had gath-ered online to celebrate a new book featuring their photography when one of them saw pecu-liar green stripes in the sky—3 years to the day since the group had last seen this auroral phe-nomenon. The club members are now collaborating with researchers to use the observations of the unusual structure of the dunes to study this part of the upper mesosphere where they occur.
Finally, be sure to take a Braque break on page 22. When glaciologist Donovan Dennis told us he wanted to write about “Cubist Geomorphology: Your Kinship with Picasso, Explained,” we were very excited to read his unusual take. He reminds us that “this Cubist example is one of many possible comparing the intellectual endeavors of artists and geoscientists and demon-strates the long- observed belief that both disciplines stand to strongly benefit from each other.”
2 Eos // MAY 2021
Features
CONTENT
36
30
30 A New Era of Debris Flow Experiments in the Oregon WoodsBy Maciej K. Obryk et al.
Years of planning, a finicky backhoe, and some surprisingly strong pool foam: Scientists give us a look inside their landslide experiments.
36 An Observational Gap at the Edge of SpaceBy Martin G. Mlynczak et al.
With no new missions in the works, we may lose our eyes on geospace.
24
24 Ham Radio Forms a Planet-Sized Space Weather Sensor NetworkBy Kristina Collins et al.
Amateur radio enthusiasts are collecting important data sets for atmospheric scientists.
On the CoverA view of Earth’s thin atmosphere from the International Space Station. Credit: NASA

SCIENCE NEWS BY AGU // Eos.org 3
Columns
AmericanGeophysicalUnion company/american-geophysical-union@AGU_Eos AGUvideos americangeophysicalunion americangeophysicalunion
CONTENT
43
From the Editor 1 Paying Attention to the “Ignorosphere”
News 4 Flying Saucers Could One Day Probe the Mesosphere 5 Observing a Galápagos Volcano from Buildup
to Eruption 7 7 Ways PIs Can Counteract Systematic Bias Right Now 8 A Window into the Weather on Titan 9 A Dip in Atmospheric Carbon May Have Facilitated
Dinosaur Dispersal 10 New Funding Fortifies Africa’s Great Green Wall 12 Rocket Mission Conjures a Ghostly Noctilucent Cloud 13 Auroral “Dunes” Light Up Earth’s Atmosphere 15 A New Understanding of the Mid-Atlantic Ridge
and Plate Tectonics 16 Superlasers Shed Light on Super-Earth Mantles
Opinion 19 Charting Satellite Courses in a Crowded
Thermosphere
GeoFIZZ 22 Cubist Geomorphology: Your Kinship with Picasso,
Explained
Research Spotlight 41 Uncovering Patterns in California’s Blazing Wildfires 42 Coastal Flooding Enhances Methane Buildup in
Forests | The Alkalinity Trap at the Bottom of the World 43 Subduction May Recycle Less Water Than Thought |
Gravity Waves Leave Ripples Across a Glowing Night Sky 44 Decoding the Age of the Ice at Mars’s North Pole 45 Modeling Gravity Waves with Machine Learning |
Evaluating Environmental Predictors of Western U.S. Wildfires
Editors’ Highlights 46 Deep Decarbonization? Yes We Can! | Modeling
Interactions Between Cities and Climate Across Scales
Positions Available 47 Current job openings in the Earth and space sciences
Postcards from the Field 49 Hello from a team studying greenhouse gases on the
mudflats of Quebec.
15

4 Eos // MAY 2021
NEWS
Flying Saucers Could One Day Probe the Mesosphere
F lying saucers might someday flit through Earth’s upper atmosphere, at altitudes above 50 kilometers where the
mesosphere starts. With their diameters likely reaching just a few centimeters, the saucers won’t be large enough to cause much of a fuss. Instead, they’ll provide climate sci-entists with measurements of temperatures, pressures, wind speeds, and other parameters in the mesosphere, a poorly studied region of the atmosphere.
Researchers from the University of Penn-sylvania used a phenomenon known as pho-tophoresis—fluid flow created by light—to levitate small, thin disks for up to about 30 seconds per flight. The aerial platforms were created and tested by the researchers in late 2019, and the results were reported in Sci-ence Advances ( bit . ly/ levitating - disks).
“It’s pretty cool,” said Igor Bargatin, an associate professor and lead author of the study. “The concept of using photophoresis to make structures fly has been around a while—a bunch of patents were even pub-lished. But nothing was ever realized.”
The Pennsylvania team—especially grad-uate student Mohsen Azadi—turned the con-cept into reality using disks of Mylar film roughly 6 millimeters in diameter and just 500 nanometers thick. “Think of it as cling wrap but about 50 times thinner,” said Bar-gatin. The researchers coated the bottoms of the disks with a 300- nanometer layer of car-bon nanotubes.
The researchers placed their test disks inside a vacuum chamber, where the pressure was reduced to levels comparable to those in the mesosphere, Bargatin said. The disks
were illuminated by a ring of eight LED arrays placed just below the acrylic chamber.
Gas molecules below the disks were briefly trapped by the bumpy carbon nanotubes. The molecules ricocheted between nanotubes, which were warmed as the disks absorbed light, gaining energy with each encounter. When they finally escaped, the molecules moved faster than molecules that bounced off the smooth top surface. The momentum that moved from the gas- surface connections led to an upward recoil force that made the sam-ple levitate.
The bumpy bottom surface would provide an upward thrust regardless of the direction of the incoming light, Bargatin noted. As long as heat was efficiently distributed through-out the flyer, the photophoresis effect would generate upward thrust, allowing the disk to stay aloft even though its top surface was receiving more light than the bottom.
Where Few Probes Have Gone BeforeBargatin and his team suggested that such disks could make effective platforms for probing the mesosphere, the layer above the stratosphere. It begins at an altitude of 50–65 kilometers and extends to 85-100 kilometers. It is the atmosphere’s coldest layer, with temperatures as low as –140°C.
This part of the atmosphere is difficult to reach. The air is too thin to support balloons or aircraft but too thick for satellites to fly in, so it is studied primarily through remote
sensing or through brief incursions by sound-ing rockets.
As a result, “we don’t have a complete pic-ture” of the mesosphere, said Daniel Marsh, a senior scientist at the National Center for Atmospheric Research who was not involved in the study. “Apart from simply wanting to know more about the least measured but fas-cinating part of our atmosphere, the meso-
One of the experimental disks levitates above the LED arrays. Credit: Igor Bargatin
“The concept of using photophoresis to make structures fly has been around a while—a bunch of patents were even published. But nothing was ever realized.”
uRead the latest news at Eos.org

SCIENCE NEWS BY AGU // Eos.org 5
NEWS
sphere is the transition region between the lower atmosphere and space,” he said. “Space weather that impacts communica-tions and GPS systems can be caused by atmospheric waves that originate from weather in the troposphere and pass through the mesosphere. We would like to track those
waves to understand how they propagate and predict their impact.”
Photophoresis- powered flyers scaled up to diameters of 6 or so centimeters should be able to carry payloads of up to about 10 milli-grams, Bargatin said—large enough to incor-porate a radio transmitter, battery, and tiny sensor package. Arrays of disks could be linked by carbon fibers to provide total pay-load masses of a gram or more.
Getting to the mesosphere won’t be easy, though. The disks could be delivered by a sounding rocket. And if launched into a polar summer, with uninterrupted sunlight, they might stay aloft for days or weeks—if scien-tists can find a way to keep them steady in mesospheric winds that can reach more than 100 kilometers.
Eventually, similar technology might even be used to explore Mars—especially at higher elevations, where atmospheric pressure is similar to that in Earth’s mesosphere—“right in the sweet spot of our experiments,” Bar-gatin said.
We’re not likely to see flying saucers flit-ting through the skies of Earth or any other world anytime soon, though. “Five to 10 years is probably a reasonable estimate,” said Bargatin, who hopes to create alliances with climate scientists to help refine and further the concept. “We have plans for growing the payload capability, and as we do, more potential applications are opening up. Eventually, we hope to operate at surface pressure, so we could make a lot of tiny robots to fly all around. But we have our work cut out for us.”
By Damond Benningfield ( damond5916@ att . net), Science Writer
Observing a Galápagos Volcano from Buildup to Eruption
It’s a rarity to observe a volcano move through its entire eruption cycle. But a group of scientists did just that by collect-
ing data on Sierra Negra, a volcano that sits on the southeastern part of Isabela, the larg-est of the islands that make up the Galápagos Archipelago. The international team captured inflation measurements, seismic rumblings, and lava characteristics before, during, and after the 2018 eruption.
In particular, the researchers noted that the basaltic caldera actually went through resurgence, or growth, after eruption—a rar-ity for this type of volcano. The scientists suggested that their observations at Sierra Negra could provide valuable insights into basaltic eruptions and the importance of international, interdisciplinary collabora-tions to fully monitor volcanic eruptions.
Volcanic eruptions can occur in a myriad of landscapes, including on the tropical islands
of Hawaii and under Iceland’s glaciers. Erup-tions at Hawaii’s K ılauea in 2018 and Iceland’s Bárðarbunga in 2014 spewed lava into their respective regions, and then both calderas had significant subsidence after eruptions.
But the basaltic volcanoes that make up the Galápagos Islands are a bit different. “They have a much higher slope angle than regular shield volcanoes—all of the magma stays inside the caldera,” said Peter La Femina, an integrative volcanologist and coauthor of a
The air in the mesosphere is too thin to support balloons or aircraft but too thick for satellites to fly in.
Field crew (from left to right) Andrew Bell (University of Edinburgh), Máximo Mendoza (Galápagos National Park),
and David Craig (University College Dublin) perform data downloading and station maintenance at seismic sta-
tion SN03 at Sierra Negra, Galápagos Islands. Credit: Mario Ruiz ( IG-EPN)
The basaltic caldera actually went through resurgence, or growth, after eruption.

6 Eos // MAY 2021
NEWS
new paper in Nature Communications ( bit . ly/ volcano - galapagos).
Instead of a broad shield, the magma in the Galápagos Islands tends to move upward to
create a steeper dome, La Femina said. He added that this change in magma movement is due to the location of the Galápagos. Basal-tic shields like K ılauea or Bárðarbunga are situated on rift systems that can channel the magma away from the caldera.
But the Galápagos is different—there is no rift zone for the magma to migrate to, he said, adding that “we think the fundamental stress fields around the volcanoes are different.”
Although the Galápagos Islands are remote, there is an extensive network of geo-physical monitoring systems run by an inter-national consortium of researchers. In total, there are 6 permanent seismic stations, 10 permanent continuous GPS networks, and remote InSAR (interferometric synthetic aperture radar) surveys of the area.
Since Sierra Negra erupted in 2005, researchers have been measuring the seis-
micity and deformation of the volcano. “Between 2005 and 2018, the caldera floor grew about six and a half meters vertically,” said La Femina, adding that “it’s just awe-some. It’s probably one of the largest, if not the largest, preobstructive inflation events that has been measured.”
While inflation was occurring, the inner faults in the caldera were under increasing stress, especially the trapdoor fault—a hinged, U-shaped fault that is an escape hatch for magma.
Changes started to accelerate in late 2017. “The geodetic rate was just going really high, over a meter per year [of uplift], and the seis-mic rate started going up,” said La Femina.
On 26 June 2018, a magnitude 5.4 earth-quake occurred on the trap door fault. La Femina said that after the initial earth-quake, there were about 8 hours of tranquil-ity—no real seismicity but some continual inflating of the caldera. Then the rest of the trap door fault system let loose.
Extensive instrumentation allowed the team members to see distinct changes in the caldera during the eruption. La Femina explained that two seismic stations located close to the trap door fault allowed the team to witness the injection of magma along that fault system from 2 kilometers deep up to the surface fissures. “To me, that’s also just another stellar part of this data set—combin-ing the seismicity and geodesy to capture that magma migration right up to eruption,” he said.
During the 13 years between eruptions (2005-2018), the Sierra Negra caldera had
6.5 meters of uplift. Although there was some subsidence after the eruption, a net 1.5-meter permanent resurgence uplift remained. La Femina said this sort of elevation gain is rare in basaltic volcanoes.
“Resurgence happens at large, silicic sys-tems, your Yellowstones,” said La Femina. But the location of this basaltic volcano—without a rift system—changes what is con-sidered “normal” behavior. La Femina said that because Galápagos volcanoes can’t inject magma into rifts, more of the molten rock stays in the system and expands upward.
After the eruption, the researchers also looked at the petrology of the tephra and lava. They found that magma erupted from two different sources: first, from a deeper- sourced rock about 7.5 kilometers deep, and then from a shallower source (about 1 kilo-meter deep).
This finding was unexpected to Einat Lev, an associate researcher at Columbia Univer-sity who was not involved with the study. “You need to have sort of weird geometry to have the deep stuff come out first,” said Lev. “There might be something interesting going on at the plumbing, with things coming out in a different order than you’ll maybe expect them to.”
Researchers will need suitable instrumen-tation to monitor volcanoes long term, includ-ing seismic, geodesic, and petrologic data, said Lev. “The earthquakes tell us about the shal-lowmost part, the petrology tells us what hap-pens underneath, and geodesy tells us kind of the overall change and the importance of hav-ing long- term observations,” she explained.
“This is something I’m always touting in terms of the power of the Global Positioning System,” said La Femina, adding that the GPS instruments allowed the team to capture the deformation that happened in the 24–36 hours around the eruption. He added that long-term, multiparameter observations are “so important for our science these days.”
Lev agreed, adding that long- duration pro-grams are needed around volcanoes, rather than swooping in only when there are signs of volcanic unrest. “Then it might be too late” to get the information scientists need to understand volcanic eruptions, Lev said.
“In any kind of natural system, the more you look, the more complicated it gets,” she said. “There’s so many volcanoes that we need to study. And only then we can start looking for patterns.”
By Sarah Derouin (@Sarah_Derouin), Science Writer
This photorealistic image of the northeastern caldera rim of Sierra Negra shows new eruptive vents and lava
flows from the 2005 and 2018 eruptions. Credit: UNAVCO
“It’s just awesome. It’s probably one of the largest, if not the largest, preobstructive inflation events that has been measured.”

SCIENCE NEWS BY AGU // Eos.org 7
NEWS
7 Ways PIs Can Counteract Systemic Bias Right Now
W hen a worldwide call for racial jus-tice in 2020 resonated into the halls, labs, and fields of geoscien-
tists, postdoc Christine Y. Chen saw depart-ments discussing strategic plans and sys-temic changes. “But there was also so much low- hanging fruit that could be implemented immediately to reduce harm happening to our most marginalized community members right now,” she said.
Chen cowrote a practical guide that was published in AGU Advances to help principal investigators (PIs) to immediately enact change (bit . ly/ counteracting- systemic- bias). She discusses actions leaders can take in the classroom, field, and lab and applies to any leader in science, including teaching assis-tants, lab technicians, and field organizers. These actions focus on how individuals can enact change in their spheres of influence.
Erika Marín- Spiotta, a biogeochemist at the University of Wisconsin- Madison who served as an independent reviewer of the work, said it’s “a must- read for those leading lab, classroom, and field activities and who therefore have the responsibility to build and ensure safe, equitable, just, and inclusive environments.”
Here are seven takeaways from the paper.1. Normalize talking about diversity, equity,
and inclusion in scientific settings. “I had to hide the fact that I was doing any kind of work related to diversity, equity, and inclusion because it was seen as an activity that would take away from my primary science,” said Chen of her past research.
PIs can encourage discourse in diversity, equity, and inclusion (DEI) by talking openly about their own work in that space or articles they read about DEI. They can also organize a weekly seminar, like lead author and assis-tant professor Emily H. G. Cooperdock has done at the University of Southern California.
Scared to talk about it? Know that you’re not alone. “It’s not like there’s a group of us for whom it is not uncomfortable,” said Cooperdock. “That discomfort is part of the growth.”
Training in bystander intervention and conflict mitigation can help.
2. Write fair and balanced reference letters.Follow guides for reducing gender bias and racial bias when writing reference letters. And remember to watch for biased language when reading reference letters.
“There are actual social science studies to support that there are racial and gender biases introduced into letter writing,” Chen explained. It’s “one specific example of where faculty and PIs have the power to change the trajectory of their trainees’ career paths.”
3. Design your class field trips to be universally accessible. Create spaces for geoscientists with disabilities in class field trips. COVID-19 was a crash course in flexible course design, and the International Association for Geoscience Diversity is a great resource to keep the juices flowing.
Remember financial barriers too.Offer a gear- sharing locker so that first
timers can afford to go into the field. Consider dedicating a lecture to field basics: clothing, layering, tents, bathrooms, menstruation, hydration, etc. Chen lectured her sedimen-tology class about this and got great class reviews, she said.
4. Write safety plans for the field. People who are nonwhite, LGBTQ+, disabled, or members of gender minorities and other minoritized groups face dangers in the field. For example, PIs can help make them safer by implementing these 10 steps to protect BIPOC (Black, Indigenous, and People of Color) scholars in the field: bit . ly/ Eos- protect - BIPOC. Remember the challenges that LGBTQ+ scientists face in the field too (bit . ly/ Eos -LGBTQ-fieldwork).
Use that information to write safety plans that include not only emergency medicine, supplies, and weather precautions but also field inclusivity, accessibility, and procedures for preventing and addressing misconduct.
5. Partner with local communities.
Dominique M. David- Chavez explained how she worked to avoid scientific colonial-ism in her doctored research. She first met with community elders and leaders in the Cidra and Comerío municipalities in Puerto Rico. “We asked them specifically what Indigenous environmental knowledge they felt was most important for the youth and future generations to learn about,” David- Chavez said.
6. Feature scientists from many backgrounds in the classroom. Try featuring careers and real-life scientists in lectures.
Don’t know where to look for scientists from diverse backgrounds? Check out the pro-files on the Diverse Geologists website (bit . ly/ diverse - geologists) or the Latinas in Earth and Planetary Sciences page (@GeoLatinas) and the #BlackInGeoscience hashtag on Twit-ter.
7. Most important of all: You’re a leader. Just do something. PIs may be the royalty of the sci-ence world, but with that power comes great responsibility.
When it comes to working on these issues, “there’s a wave of enthusiasm from a grass-roots level, mainly [by] students, postdocs, and early- career people,” said Cooperdock.
But where she sees the most progress is in places where people at the top match that energy.
“The ball is really in other people’s court now,” said Chen. “The limitation is really, will other people pick up the mantle and move to action?”
By Jenessa Duncombe (@jrdscience), Staff Writer
uRead this story online at bit.ly/Eos-counteract-bias for links to more resources.
“We asked them specifically what Indigenous environmental knowledge they felt was most important.”

8 Eos // MAY 2021
NEWS
A Window into the Weather on Titan
It’s been 4 years since NASA’s Cassini spacecraft flew by Titan—the spacecraft vaporized in Saturn’s atmosphere in
2017—but the data collected on the 13-year mission are still yielding new information about Saturn’s largest moon. Researchers have long studied Cassini’s Titan flybys for hints of the moon’s climate and topography, but a new study bolsters our understanding of the moon’s day-to-day weather.
Over the years, Cassini has revealed Titan to be a relatively Earth- like planetary body. The moon’s climate cycles through seasons that last about 7.5 Earth years, and circula-tion in its atmosphere redistributes heat from the equator toward the poles, keeping temperatures relatively uniform and stable. On its surface, liquid natural gas flows through rivers and lakes. It’s the only place in the solar system other than Earth that experiences such a flow of liquids across its surface, and researchers have long theorized that these lakes and rivers are fed by rainfall from clouds of methane in the moon’s atmo-sphere.
“While rain may be predicted by theory, of course there are all kinds of theories,” said Roger Clark, a senior scientist at the Planetary Science Institute not involved in the new research. “One of the theories when we got to Titan was that it would be covered in an ocean
of methane and that there wouldn’t be any solid surface, so theories may not have all of the data points.” But the new study is a “key data point in the case for active rain.”
“It’s the only extraterrestrial world where we can talk about extraterrestrial rainfall,” said Rajani Dhingra, a NASA postdoctoral fel-low at the California Institute of Technology’s Jet Propulsion Laboratory and lead author of the new study.
The study builds on previous work from Dhingra and her colleagues in which the team combed through data from Cassini’s Visual and Infrared Mapping Spectrometer and spotted a massive reflective feature on the moon’s surface. The reflection, which the team deemed a bright ephemeral feature (BEF) in a 2019 paper, was temporary. The team theorized that it was likely the result of
sunlight reflecting off a wet surface, akin to the way the Sun can reflect off of pavement after rain here on Earth.
If the BEF were the result of a surface- wetting rainfall, that event would also have caused a local change in temperature. The logical next step for Dhingra and her col-leagues was to look for that temperature change using Cassini’s Composite Infrared Spectrometer, which would provide further support for the idea that the reflective feature was the result of a surface- wetting rainfall event. But the data on the original BEF were too noisy to enable seeing any change in tem-perature. So in the new study, published in Geophysical Research Letters ( bit . ly/ titan - temperature), the team identified another BEF in data from Cassini’s 121st flyby on 25 July 2016.
This time, the instruments collected enough spectra from both on and off the BEF to identify a temperature drop of roughly 1.2 kelvins within the BEF compared with the area around it.
“We were fortunate enough to have that number of spectra to see a perceptible tem-perature difference in a single flyby in a single
day on Titan, so we have for the first time probably looked at the weather on Titan,” said Dhingra.
The team suspected that the temperature drop came from evaporative cooling and therefore would be temporary. Indeed, by the next flyby, the BEF was gone. “We don’t know the fate of the rainfall,” Dhingra said. Did it gather in a shallow puddle that quickly evap-orated, seep into the ground, or drain into tributaries that flowed into lakes or seas else-where? Or did it never reach the surface at all, instead settling as a fog above the surface, to be blown away by the wind?
Clark noted that a wet surface, ice, or even clouds can all cause the kind of spectral reflections that have been detected on Titan.
Those questions will be much easier to answer when NASA’s Dragonfly mission reaches Titan. Dragonfly will launch in 2026 and land on Titan’s surface in 2034. Dhingra is eagerly awaiting its arrival, not least because Titan’s thick atmosphere makes studying rainfall or temperature changes at the surface very tricky from above.
“I’m awed that we can see something like that in a world that’s 10 times farther away from the Sun than Earth is, from a mission that was conceived in the 1980s,” Dhingra said. “I cannot wrap my head around the sci-ence we’re going to do with Dragonfly on the surface.”
By Kate Wheeling (@katewheeling), Science Writer
Titan’s north pole is at the top of this true- color
image captured by Cassini in 2012. Credit: NASA
Titan’s thick atmosphere, pictured here, is full of
methane clouds, which feed rainfall at the planet’s
poles. Credit: NASA
“It’s the only extraterrestrial world where we can talk about extraterrestrial rainfall.”

SCIENCE NEWS BY AGU // Eos.org 9
NEWS
A Dip in Atmospheric Carbon May Have Facilitated Dinosaur Dispersal
There are hotbeds of dinosaur fossils around the world. However, some of the species spotted in the Southern
Hemisphere don’t show up in the Northern Hemisphere until millions of years later, which makes for a paleontological mystery: Animals should have been able to make the journey northward—across the superconti-nent of Pangea—in a few decades at most.
Now scientists have hypothesized that the amount of carbon dioxide (CO2 ) in the atmo-sphere might have played a role in dinosaur dispersal: Dinosaurs appeared in what are today Greenland and Germany right around the time when the planet’s atmosphere expe-rienced a large, abrupt drop in CO2. That dip, which lasted for a few million years, likely reduced the aridity of the planet’s tropical desert belts, making the region easier to tra-verse, the team proposed.
Roughly 230 million years ago, around the time when dinosaurs first appeared in the fossil record, Earth’s continents were crowded together to form the supercontinent of Pan-gea. “All the major landmasses were contig-uous,” said Dennis Kent, a geophysicist at Lamont- Doherty Earth Observatory of Columbia University in Palisades, N.Y.
Pangea was enormous—running more than 10,000 kilometers from north to south—but it contained no significant geo-graphic barriers like high mountains or large seaways, said Kent. “You expect that a land animal could just walk from one place to another.”
But herbivorous dinosaur fossils appear in places like Argentina and Brazil, the erstwhile southern reaches of Pangea, millions of years earlier than they do in northern locales like Germany and Greenland. Considering that a group of dinosaurs could have easily ambled a couple of kilometers north each day, that time delay doesn’t make sense, said Kent. “You can do that in 20 years.”
Kent and Lars B. Clemmensen, a geologist at the University of Copenhagen, set out to investigate the mystery. First, they needed to accurately correlate the ages of fossils found in different regions of Pangea. The research-ers focused on Plateosaurus, an herbivorous dinosaur that measured up to 8 meters from nose to tail.
To track the passage of time more than 200 million years ago, the team turned to magne-tostratigraphy. This technique hinges on a
well- known phenomenon: The planet’s mag-netic poles reverse polarity approximately every few hundred thousand years.
Cutting into Earth’s stratigraphic layers can reveal a record of these geomagnetic reversals. That’s because certain minerals—for example,
hematite—record the polarity of Earth’s mag-netic field. By tracing the relative thicknesses of layers corresponding to intervals of normal and reverse polarities, it’s possible to assem-ble a visual record of our planet’s magnetic history, said Kent. “It’s like a bar code.”
Because these magnetic changes are expe-rienced all over Earth simultaneously, mag-netostratigraphy is a bit like the Rosetta Stone, said Kent. “If we can find the same sig-nature of polarity reversals in different places, we can correlate them.” That allows the stratigraphic layers of regions separated by thousands of kilometers to be placed on a common timescale.
Kent and Clemmensen analyzed hundreds of sediment samples from two sites across Greenland to assemble a magnetostrati-graphic record. They then determined the absolute ages of their records’ layers by cor-relating their sequences with an astrochrono-stratigraphic record that hinges on, among other data, Milankovitch orbital cycle- induced climate patterns and uranium- lead- dated volcanic ash layers.
The researchers found that Plateosaurus fos-sils showed up in Greenland sediments roughly 15 million years after they first appeared in southern Pangea fossil beds. That’s a strikingly long delay, the authors pro-posed, because there were no significant geo-graphic barriers in Pangea to inhibit the dis-
Plateosaurus, a plant- eating dinosaur, may have dispersed northward thanks to changes in atmospheric carbon
dioxide levels. Credit: iStock.com/MR1805
“If we can find the same signature of polarity reversals in different places, we can correlate them.”

10 Eos // MAY 2021
NEWS
New Funding Fortifies Africa’s Great Green Wall
Two of the most extreme effects of cli-mate change are desertification and land degradation, phenomena that
may displace some 50 million people in this decade, according to the United Nations. To help address these issues in one of the world’s most vulnerable regions, a refor-estation project in Africa known as the Great Green Wall (GGW) recently got a big shot in the arm with $14.32 billion in pledges from donors. Backers, consisting of international development banks and national govern-ments, are hoping the project can help halt the advance of the Sahara desert in the northern Sahel.
The United Nations defines desertification as “the persistent degradation of dryland ecosystems by climate change and mainly human activities.” The consequences of desertification are not only ecological but also social, economic, and political: As land becomes degraded, people are dragged into poverty, forcing some to migrate.
Saving the SahelLand degradation could have profound con-sequences for the 250 million people living in
10 countries across the Sahel, a band of trop-ical and subtropical grasslands and savannas spanning northern Africa from Senegal to Djibouti. “Without the Great Green Wall, the Sahel region as we know it may disappear,” African Development Bank president Akin-wumi Adesina said at a donor conference ear-lier this year.
Launched in 2007 as an initiative of the Afri-can Union, the GGW is an ambitious attempt to cultivate an 8, 000- by 15-kilometer- wide barrier across the Sahel by planting trees, grasslands, and other vegetation. Aside from restoring 100 million hectares of degraded land across the Sahel and the neighboring Sahara, the project aims to create 10 million jobs.
Farmers and other residents are engaging with international partners in the regreening efforts that are part of
the Great Green Wall, an attempt to cultivate an 8,000- kilometer- long greenbelt through the Sahel. Credit:
United Nations Convention to Combat Desertification
persal of Plateosaurus. Something else might have prevented the dinosaurs from journeying northward, Kent and Clemmensen surmised.
Climatic barriers were the likely culprit, they concluded. Prior to the dispersal of Pla-teosaurus, the concentration of CO2 in the atmosphere was about 4,000 parts per mil-lion. That’s about 10 times higher than it is today, and it’s likely that deserts encircled the planet’s tropics as a result, said Clem mensen. “Climate modeling indicates that when we have these extreme CO2 concentrations, we have a very, very extreme climate with some very, very dry deserts.”
Those arid regions would have acted as cli-matic barriers, the team proposed. Consistent with that story, the arrival of herbivorous dinosaurs in Greenland coincided with a dra-matic decline in CO2: Between roughly 215 million and 212 million years ago, the con-centration of CO2 in the atmosphere fell by a factor of 2 to approximately 2,000 parts per million. The cause of the dip is unknown, but one idea is that it’s linked to an asteroid impact that occurred around the same time in what is today Canada.
Regardless of the origin of the decline in CO2, the change likely lessened the aridity of the planet’s tropical desert belts, making
them more traversable by dinosaurs, said Clemmensen. “They had this window of more acceptable climate.”
These results were published in the Pro-ceedings of the National Academy of Sciences of the United States of America ( bit . ly/ dinosaur - dispersal).
It’s an intriguing idea that climatic barriers dictated dinosaur dispersal, said Aline Ghi-lardi, a paleontologist at the Federal Univer-sity of Rio Grande do Norte in Natal, Brazil, not involved in the research. However, there’s always the lurking possibility that older fossils exist in northern latitudes but simply haven’t been discovered, she said. “The null hypothesis is that we didn’t find them yet. We need to keep on digging.”
By Katherine Kornei (@KatherineKornei), Science Writer
Those arid regions would have acted as climatic barriers.
“Without the Great Green Wall, the Sahel region as we know it may disappear.”

SCIENCE NEWS BY AGU // Eos.org 11
NEWS
“When you consider that 80% of Africa’s economy depends on a climate- sensitive nat-ural resource base like rain- fed, subsistence agriculture, then you start to understand the implications of land degradation on the workforce here,” said James Bigila, a spokes-person for the United Nations Convention to Combat Desertification (UNCCD).
Between 2007 and 2018, nearly 18 million hectares of land were restored, over 350,000 jobs were created, and around $90 million was generated through GGW activities, according to Bigila, who added that the project is con-tributing to 15 of the 17 U.N. Sustainable Development Goals.
Studies Target the Greening TrendThe Sahel suffered a series of droughts and famines between the 1960s and 1990s. It has been identified as a “hotspot for climate change” by the U.N. Intergovernmental Panel on Climate Change, which predicts that tem-peratures in Africa, particularly in arid regions, will rise faster than the global land average.
However, research has also suggested that parts of the Sahel have actually been green-ing in recent decades because of increased rainfall and other factors. This phenomenon has been the subject of debate. Barron Joseph Orr, lead scientist for UNCCD, said that although satellite imagery shows expanded green areas since the 1980s, there is general agreement among land users that even though rains may have recovered, the quality of the land and its vegetation has not always returned to what it was before the droughts.
“Greening does not necessary equate with more healthy land,” said Orr. “Moreover, the greening trend is not uniform, and the ‘where’ of greening matters.”
Against that backdrop, the Sahel and the GGW have been the subject of a spate of recent scientific studies with differing views of the project. A 2019 study in Regional Envi-ronmental Change describes the GGW as a “potential game- changer in the Sahel” due to such factors as pan- African coordination, significant investment, scientific research informing the process from an early stage, and a consensus that business- as- usual development efforts are ineffective.
A 2020 analysis in Land Degradation and Development took a clear- eyed look at the practicality and sustainability of the GGW. It noted that without specifying a crop or vege-tation type, 43.5% of the Sahel and 25.6% of the proposed GGW region, respectively, “are not feasible for sustainable planting, that is, under rainfed and natural land fertility con-ditions” and that investing in a greenbelt east of longitude 10°E is “risky without supple-mentary irrigation.” Orr pointed out that there are major efforts to improve the arid adaptiveness of crops, trees, and grasses “in a way that is increasingly full systems- based,” noting work by the International Center for Agricultural Research in the Dry Areas ( ICARDA) and World Agroforestry.
Overcoming ChallengesEven with its new financial pledges, the GGW faces numerous obstacles. For one, it’s only about 15% under way and will require at least $33 billion to meet its objectives of creating
“a natural wonder” across the African conti-nent.
Other challenges include monitoring and tracking progress, political instability and conflict in and among participating nations, and population growth putting pressure on natural resources. Most GGW countries face challenges in establishing governance and project structures for attracting funding as
well as technical hurdles and survival rates of tree planting projects, said Bigila.
But supporters of the project said that greening the land is something that can and must be achieved.
“Ignoring the plight of jobless young peo-ple in sub- Saharan Africa is a recipe for polit-ical instability and global insecurity,” said Bigila. “The Great Green Wall is one piece in the puzzle in providing genuine alternatives for people increasingly seeking ‘a way out’ of abject hopelessness and desperate poverty.”
By Tim Hornyak (@robotopia), Science Writer
“The Great Green Wall is one piece in the puzzle in providing genuine alternatives for people increasingly seeking ‘a way out’ of abject hopelessness and desperate poverty.”

12 Eos // MAY 2021
NEWS
Rocket Mission Conjures a Ghostly Noctilucent Cloud
W hen the sky is dark and the Sun rests just below the horizon, noc-tilucent clouds appear like ghosts
in the polar skies, silvery and translucent. These shimmering wisps, long confined to the coldest reaches of Earth’s atmosphere near the poles, have been steadily creeping toward lower latitudes, lured by fresh seeps of the icy water crystals that feed them.
How and why do these apparitions form, and what can they teach us about the atmo-spheric realm they come from? To answer these questions, scientists sought a way to conjure a ghost of their own.
“A lot of times, to study this region of the atmosphere observationally, you’re working with what you’ve got,” said Richard Collins, an atmospheric scientist at the University of Alaska Fairbanks. “You’re observing the nat-ural system and putting together what we know about it to determine the various factors
that are in play…. Here we are actively exper-imenting in the system by injecting a known amount of water in a controlled way so that we can actually see what’s happening.”
To Haunt the Night Sky, First Add WaterEarth’s mesosphere, the atmospheric layer 50-80 kilometers above the surface, is home to polar mesospheric clouds (PMCs), also known as noctilucent or night- shining clouds. They are typically seen in Arctic and Antarctic skies during summer months when humidity in the upper atmosphere is high. These clouds form from water ice crystals at the edge of space, where the mesosphere is coldest.
In the past few decades, however, people have introduced large quantities of water vapor into the atmosphere through industrial and agricultural activities, drawing these ghostly clouds away from the poles. “We’re
making the upper atmosphere more humid as part of the general climate change scenario with the release of methane into the atmo-sphere,” Collins explained. “Methane, when it gets up high in the atmosphere, reacts and forms water vapor and carbon dioxide.” Rocket emissions, too, are a source of atmo-spheric water vapor and can trigger PMC for-mation.
Moreover, human- induced climate change has steadily cooled the mesosphere and ther-mosphere, making conditions more favorable for noctilucent clouds. Scientists want to bet-ter understand how these upper - atmospheric changes will affect the creation of noctilucent clouds and also how these clouds can be used as diagnostic tools to understand the meteo-rology of this often- invisible part of Earth’s atmosphere.
To do this, Collins and a team of scientists launched a mission called Super Soaker, which sent three sounding rockets into the mesosphere in January 2018 from a facility in Fairbanks. One of the rockets carried a canis-ter filled with 220 kilograms of pure water, which was explosively released 85 kilometers above Earth’s surface. The other two rockets, as well as a ground- based lidar system, mon-itored the meteorological conditions before, during, and after the explosion.
The researchers found that a modestly sized noctilucent cloud formed a mere 18 sec-onds after the water was released and lasted for a few minutes before dissipating. On the basis of measurements from Super Soaker, cloud formation models indicated that the sharp spike in humidity raised the freezing
temperature of water in that spot by about 50°C. The explosive release of water also cre-ated meter- sized ice filaments that quickly cooled the air by 25°C and were critical for seeding the cloud’s formation.
“We were surprised that the cloud formed so quickly and that this cooling could be so rapid,” Collins said.
“This is the first time anyone has exper-imentally demonstrated that PMC formation in the mesosphere is directly linked to cool-
The Super Soaker experiment launched three rockets: One carried a canister of water, and two tracked wind
movement (orange trails). A lidar beam (green trail) was used to study the resulting noctilucent cloud (bright
white). Credit: NASA’s Wallops Flight Facility/Poker Flat Research Range/Zayn Roohi
“We were surprised that the cloud formed so quickly.”

SCIENCE NEWS BY AGU // Eos.org 13
NEWS
ing by water vapor itself,” Irfan Azeem, chief scientist at Astra LLC in Louisville, Colo., and principal investigator of Super Soaker, told NASA. The results of this exper-iment were published in the Journal of Geo-physical Research: Space Physics ( bit . ly/ cloud -cooling).
Specters of the Future“The Super Soaker investigations are a beau-tiful and very seldom seen example of per-forming an active experiment in this region for atmospheric conditions which cannot be adequately reproduced in the laboratory,” said Franz- Josef Lübken, an atmospheric sci-entist at the Leibniz Institute of Atmospheric Physics in Kühlungsborn, Germany. “Such experiments can actively create and control physical conditions in the mesopause region in order to study the formation and behavior of ice clouds in a unique environment and study related science topics such as micro-physical processes, transport and photo-chemistry of water vapor, and effects on the background atmosphere.” Lübken was not involved with this research.
Collins plans for future experiments to test cloud formation triggers by using more water, releasing it in different ways, and measuring the resulting clouds more directly. The arti-ficial cloud’s speedy formation in wintertime, when the air is usually far too dry, suggests that these specters might haunt the skies at the slightest provocation as the increasing pace of climate change and rocket launches injects ever more water into the upper atmo-sphere.
By Kimberly M. S. Cartier (@AstroKimCartier), Staff Writer
Releasing water into the mesosphere with an explo-
sion (a ground test of which can be seen above) was
a key step in forming an artificial noctilucent cloud.
Credit: NASA’s Wallops Flight Facility
Auroral “Dunes” Light Up Earth’s Atmosphere
Earth’s atmosphere is relatively thin—imagine an apple’s skin compared to the fruit itself—but there’s still much
to learn about it. Now, using a recently dis-covered aurora as an atmospheric spotlight, a team of amateur astronomers and research-ers has discovered evidence for high- altitude atmospheric waves. This discovery sheds light on the structure of our planet’s upper atmosphere, a region that’s notoriously tough to monitor with either spacecraft or balloons.
Mysterious Green StripesAurorae, formed when energetic particles bombard Earth’s atmosphere, are a captivat-ing sight—their shimmering, waving forms have been recorded for millennia.
“They are always so mysterious and beau-tiful,” said Matti Helin, an amateur astrono-mer and photographer in Lieto, Finland, who spotted his first aurora while a teenager.
Helin and other members of the Ursa Astronomical Association, Finland’s amateur
astronomy group, regularly observe the sky in search of aurorae. On 7 October 2015, they were treated to a spectacle.
Green stripes covered a wide swath of the sky that night, the amateur astronomers found when they trained their cameras sky-ward. Green is a common auroral color—it’s associated with oxygen—but aurorae typically resemble arcs, spirals, or curtains. Seeing stripes was a surprise, said Helin. “Nobody knew what they were.” The features dissi-pated after a few hours, and the sky watchers filed their pictures away.
Three years later to the day, Helin and other Ursa members gathered online to cel-ebrate the release of a new book about auro-rae. The book, cowritten by Minna Palmroth, a space physicist at the University of Helsinki in Finland, features club members’ photog-raphy.
Dashing OutsideOut of habit, Helin took a few pictures of the sky during the celebration. He was astonished
Amateur astronomers spotted a new auroral feature, nicknamed “the dunes,” on 7 October 2015. Credit: Matti
Helin

14 Eos // MAY 2021
NEWS
to find he had captured the green stripes again, which he hadn’t seen since 2015. “I immediately informed Minna and the oth-ers,” he said. Aurora afficionados across Fin-land and Sweden rushed outside to photo-graph the elusive feature.
Emma Bruus, a member of Ursa, took pic-tures from central Finland. It was fun to partic-ipate in such a coordinated effort, she said. And it was particularly exciting because the obser-vations ended up launching a research collab-oration, said Bruus. “We didn’t know it at the time that we were doing science research.”
Bruus and Helin, along with other Ursa members, collaborated with Palmroth and a few of her colleagues to analyze the observa-tions collected on 7 October 2018. By then, the green stripes had acquired a nickname: “the dunes.” (“You could imagine you’re actually looking at sandy dunes,” said Palmroth.)
The dunes are a true aurora, the collabora-tion believes, unlike the atmospheric phe-nomenon known as STEVE (strong thermal emission velocity enhancement), which made headlines a few years ago. STEVE is thought to be caused by moving plasma rather than by particles slamming into Earth’s atmosphere.
The team started by analyzing a pair of images of the dunes, both taken at 19:41 local time from two different locations in Finland. Using planetarium software, team members pinpointed the stars behind six of the dunes’ stripes. They then applied trigonometry to cal-culate that all of the stripes were at an altitude of roughly 100 kilometers, consistent with the altitude of other known auroral features.
A Long- Ignored RegionThat part of Earth’s atmosphere, the upper mesosphere, is particularly hard to study. Sending spacecraft there is tough because of the significant amounts of frictional heating that close to Earth. At the same time, it’s too high for most balloons to reach. “It’s a region that is extremely hard to measure,” said Palmroth. For that reason, scientists have jokingly taken to calling this swath of the atmosphere the “ignorosphere.”
The researchers started by asking a basic question: What dictates the dunes’ structure? Its stripes are hundreds of kilometers long and typically separated by about 50 kilome-ters. Something must be varying to explain the aurora’s alternating regions of relative brightness and darkness, the team concluded.
They proposed two hypotheses: Either the flux of particles bombarding the atmosphere (the source) is varying, or the number of oxy-gen atoms in the atmosphere (the target) is varying.
To test the first theory, the researchers used measurements from orbiting GPS satellites to estimate the vertical total electron content above the dunes. (Electrons constitute a large fraction of the particles that bom-
bard Earth’s atmo-sphere and produce visible- light auro-rae.) They found that the dunes tended to be coin-cident with regions with higher- than- normal electron contents. However, the limited spatial resolution of the data prevented the team from investi-gating changes in electron density on the scale of the dunes’ stripes.
They next used g r o u n d - b a s e d magnetometers to trace the move-
ment of electrons—in other words, electric currents—within Earth’s atmosphere at an altitude below that of the dunes. The team found a pronounced eastward moving current at the location of the dunes.
These measurements reveal enhancements over a wide range of altitudes, the team con-cluded. But the dunes themselves occur over only a relatively thin swath of atmosphere near an altitude of 100 kilometers. Therefore, it’s unlikely that a difference in the flux of electrons bombarding the atmosphere is responsible for the dunes’ structure, the team suggested.
A Wave in the SkyThat leaves the second hypothesis: The dunes look the way they do because of variations in the number of oxygen atoms in the atmo-sphere. And a rare atmospheric wave known as a “mesospheric bore” could plausibly be responsible for those variations, the team suggested.
Temperature inversions and wind shear in the atmosphere can trigger mesospheric bores, which manifest as changes in air den-sity that can propagate over long distances. (They’re similar to the tidal bores observed in some rivers.)
The varying densities of oxygen atoms in mesospheric bores are responsible for the dunes’ characteristic stripes, the team pro-posed. “The aurora illuminates this wave which is already in the atmosphere,” said Palmroth. It’s the first time that a meso-spheric bore has been traced with an aurora, she said. “This is a new phenomenon.”
These results were published last year in AGU Advances on page 1 of issue 1 ( bit . ly/ auroral - dunes). “We’re really proud to be the first- ever article to be published in AGU Advances,” said Palmroth.
This discovery turns a spotlight on meso-spheric bores, and it’s surprising to find them so close to Earth’s poles, said Bea Gallardo- Lacourt, a space physicist at NASA Goddard Space Flight Center in Greenbelt, Md., not involved in the research. “It’s a completely novel result.”
This work also highlights the important contributions of science enthusiasts and community groups, Gallardo- Lacourt said. Camera- toting amateurs have an important leg up on stationary research facilities, she said. “They have the advantage of going where the phenomenon is happening.”
By Katherine Kornei (@KatherineKornei), Science Writer
“You could imagine you’re actually looking at sandy dunes.”
Donate $100 to the Lend-a-HandMembership Fund to pay for a two-year AGU membership to a colleague in low/low-middle income countries! (as designated by the World Bank)
SCIENCE NEWS BY AGU // Eos.org 15
NEWS
A New Understanding of the Mid- Atlantic Ridge and Plate Tectonics
Geologists have long thought that mid- ocean ridges are relatively passive participants in plate tectonics. But a
new study shows that more activity might be going on beneath the equatorial Mid- Atlantic Ridge.
The study, published in Nature, suggests that beneath the ridge, upwelling from a thin mantle transition zone (MTZ) might be driv-ing seafloor spreading ( bit . ly/ thin - mantle).
“It was assumed that these gravitational forces, which are pulling down, are contrib-uting to the spreads at the ridges,” said Mat-thew Agius, lead author of the new study and a researcher at Roma Tre University in Rome. This conventional view explains that gravity pulls subducting plates away from the ridge, a process that is accommodated by passive mantle upwelling at the ridge itself.
In 2015, Agius learned of an experiment led by Catherine Rychert and Nicholas Harmon, associate professors in geophysics at the Uni-versity of Southampton, and University of Oxford professor Michael Kendall. The origi-nal goal, however, wasn’t to figure out the drivers of spread at mid- ocean ridges. Agius, a postdoctoral fellow at the University of Southampton during this experiment, and these colleagues intended to use ocean bot-tom seismometers to take some of the first seismic recordings at the Mid- Atlantic Ridge and learn about lithosphere formation beneath it.
In 2016, their research cruise set out for Cape Verde and traveled from there to deploy 39 seismometer stations around the Mid- Atlantic Ridge across an area 1,000 kilome-
ters wide. A year later, the scientists came back to collect the instruments and look at their data.
At the outset, the team hoped to find clues about the origins of the lithosphere. “But the quality of the data was so rich—very high quality seismic data—that it gave us the abil-ity to zoom in deeper,” said Agius. Using P-to-S receiver functions on the seismic data beneath the stations, the team could image the MTZ, the boundary between the lower and the upper mantle, between 410 and 660 kilo-meters deep.
“You can only do those measurements where you have stations, so the oceans are largely unsampled,” said Christine Houser, an assistant professor and geophysics researcher at the Tokyo Institute of Technol-ogy’s Earth- Life Science Institute not involved with this study.
When they zoomed in, the researchers saw that the MTZ in the western part of their study area was thinner than expected—the 410- kilometer discontinuity was depressed, and the 660- kilometer discontinuity was uplifted. They also noticed that beneath the
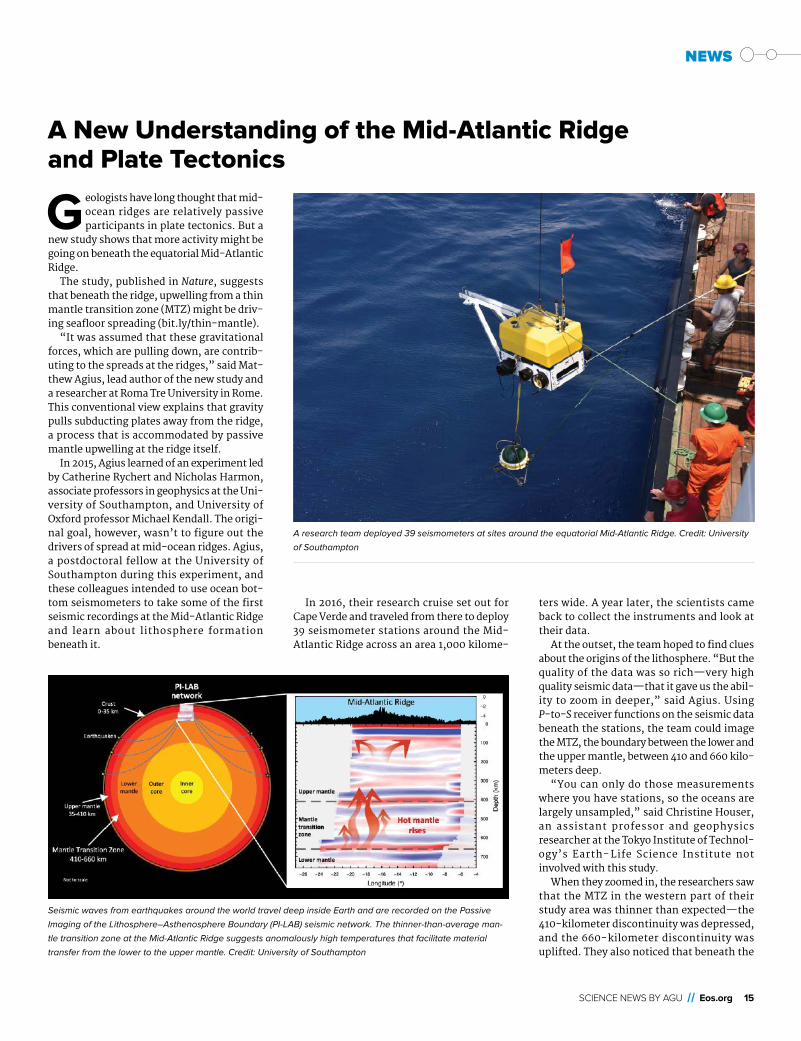
A research team deployed 39 seismometers at sites around the equatorial Mid- Atlantic Ridge. Credit: University
of Southampton
Seismic waves from earthquakes around the world travel deep inside Earth and are recorded on the Passive
Imaging of the Lithosphere– Asthenosphere Boundary ( PI-LAB) seismic network. The thinner- than- average man-
tle transition zone at the Mid- Atlantic Ridge suggests anomalously high temperatures that facilitate material
transfer from the lower to the upper mantle. Credit: University of Southampton

16 Eos // MAY 2021
NEWS
Superlasers Shed Light on Super- Earth Mantles
Of the more than 4,300 planets discov-ered outside our solar system, super- Earths—rocky planets up to twice as
large and up to 5 times as massive as Earth—are among the most common. What they’re made of, how they form, and what their inte-rior structure and dynamics look like are still relatively unclear.
To get a grasp on the inner workings of super- Earths, recent experiments put iron oxide under the pressures expected within the mantles of these rocky exoplanets. The experiments showed that this common plan-etary material likely takes a different shape in those planets’ mantles than it does in Earth’s.
Working with one of the most powerful lasers in the world allowed researchers to con-duct “laboratory experiments that tell you something about the interior structure of planets so far away and which we can’t even look at directly,” said Federica Coppari, a plan-etary materials scientist at Lawrence Liver-more National Laboratory in Livermore, Calif.
Coppari said that many planetary scientists begin studying super- Earths with simplified models of Earth’s interior and proceed to scale them up to approximate super- Earth sizes, pressures, and temperatures. This approach is a good starting point, she said, but it doesn’t account for how properties of mantle materials might change. In recent years, experimentalists have begun to explore how common planetary materials behave at the pressures and temperatures inside super- Earths to build a picture of the structure and dynamics inside those planets.
Coppari and her team sought to learn how one of the dominant minerals in Earth’s man-tle, ferropericlase, might behave in a super- Earth’s mantle. They used the Omega Laser Facility in Rochester, N.Y., to compress iron oxide, a component of ferropericlase, to pres-sures 3-5 times those at Earth’s core- mantle boundary. Just a few nanoseconds of compres-
The way planetary materials behave under pressure influences planets’ interior structure. Credit: iStock.com/
Rost-9D
“Laboratory experiments…tell you something about the interior structure of planets so far away and which we can’t even look at directly.”
ridge, shear waves were slower than they were underneath older Atlantic seafloor, implying a hotter MTZ. These characteristics are typically found at hot spots, not ridges.
“For the first time, we have evidence of higher temperatures in the mantle transition zone [at the Mid- Atlantic Ridge],” said Agius. From that, the researchers inferred that material in the lower mantle is rising to the upper mantle. Instead of gravity, upwelling could be driving seafloor spreading.
This experiment is the first time scientists have obtained seismic data directly from the ridge, as opposed to data from land stations,
which provide a hazier view of Earth’s inner mechanics at the ridge. “It introduces new evidence for the whole study of plate tecton-ics,” said Agius.
“This finding in itself, that there could be regions in our mantle where there’s vertical material transport that are not…[sites of] active upwelling and downwelling like slabs and plumes, is intriguing,” said Elvira Mul-yukova, an associate research scientist who studies geodynamics at Yale University who was not involved in the research.
Houser, like the Southampton team, uses seismic data to map Earth’s mantle. She said that the data from this new study align with her own models so far.
But Mulyukova wants stronger evidence and measurements of more geophysical properties at the ridge. The authors inter-preted their observations as evidence of ver-tical material transfer in the mantle, but there are other possibilities. Agius and his colleagues agree that studying other proper-ties in this area would give a more holistic view.
If proven to be true, this team’s findings could change the understanding of major aspects of Earth’s history. “This would have an implication for the thermal history of the planet, the geochemical history of the planet [and] the geodynamo,” Agius said.
By Jackie Rocheleau (@JackieRocheleau), Science Writer
“It introduces new evidence for the whole study of plate tectonics.”

SCIENCE NEWS BY AGU // Eos.org 17
NEWS
sion were needed to reach super- Earth mantle pressure (roughly 350-665 gigapascals).
Researchers found that at those pressures, iron oxide reached a density more than twice that of another end- member component of mantle material, magnesium oxide, and underwent a phase transition at a far lower pressure. Inside Earth’s mantle, these two minerals have the same structural phase and mix together in ways that are well under-stood. However, the fact that the material properties of iron oxide and magnesium oxide diverge at high pressures means that super- Earth mantles could layer, mix, and flow in entirely foreign ways.
“Not only are the atoms more tightly packed, this new material phase [of iron oxide] is associated with a dramatic drop in viscosity…[which] plays an important role in the convecting motions inside the mantle,” Coppari said. “The rheology of a large extra-solar planet might be completely different than that of the Earth…and it’s related to the different material properties at more extreme conditions expected inside exoplanets.” The researchers published these results in Nature Geoscience ( bit . ly/ interior - exoplanet).
The lower viscosity “would affect how the mantle flows over time,” said Rebecca Fischer, “with implications for heat trans-port, thermal evolution, and even magnetic field generation and surface tectonics, which may be important processes to creating a habitable planet…. I think this is a very impactful study that significantly advances our understanding of a mineral likely to be abundant in exoplanet mantles.” Fischer, who was not involved with this research, is an experimental planetary scientist at Harvard University in Cambridge, Mass.
“These are impressive experiments with significant technological advances to inves-tigate material structure and behavior under conditions of a super- Earth interior,” said Yingwei Fei, an experimental planetary sci-entist at the Carnegie Institution for Science in Washington, D.C., who was not involved with this research. “It provides new oppor-tunities for determining not only density but also phase transition at conditions relevant to a super- Earth mantle…[and] raises an important question about stratification caused by phase transition and its potential role in mantle dynamics.”
High- pressure experiments help build a more complete geophysical picture of planets larger than Earth, Coppari said. These tests explore materials common in Earth’s mantle, but the composition of exoplanet mantles is completely unknown. Future work will con-tinue to study the high- pressure behavior of individual mineral components of Earth’s mantle and also test different planetary mix-tures to find ones that could exist in super- Earths. All of these experiments help refine models of planetary interiors that, in turn, help predict which materials would be useful to test.
“From the experimental side, it is a good approach to start with compositionally sim-ple end- members, but important compo-nents of rocky planets, and build the database necessary for modeling the complex real sys-tems,” Fei said. “We are still at the early stage to paint a detailed picture of the interior. It will require an interdisciplinary approach to advance our understanding.”
By Kimberly M. S. Cartier (@AstroKimCartier), Staff Write
Read it first onArticles are published on Eos.org before they appear in the magazine. Visit Eos.org daily for the latest news and perspectives.
Aerosol Scientists Try to Clear the Air About COVID Transmissionbit.ly/Eos-aerosol-scientists
Vicuña Poop Nourishes “Dung Gardens” High in the Andes bit.ly/Eos-vicuna-poop
The New River Gorge: Ancient River, Old Mines, New National Parkbit.ly/Eos-New-River-Gorge
The Gaps in Environmental Networks Across Latin Americabit.ly/Eos-network-gaps
Improving Models for Solar Climate Intervention Researchbit.ly/Eos-solar-climate-intervention

18 Eos // MAY 2021
作为AGU会员,您将:• 支持未来数代的地球与 空间科学家。• 帮助使地球与空间科学 社区更加多元化和具有 包容性。• 扩展您的专业人际网络。• 分享您的研究和见解。• 向他人学习,以了解最新 的新 闻和研究。• 参加秋季会议、查普曼 会议以及其他会议和科 学活 动。
请即刻获取或续签您的AGU会员资格!当您加入AGU时,您就加入了一个由13万名地球与空间科学专家及爱好者组成的全球社区。
AGU会员还可以获得:• AGU出版物的折扣,包括35%的图书折扣。• 以更低费用参加AGU会议(包括秋季会议),以展示您的研究成果并扩展您的人 际网络。• 通过我们的荣誉和表彰计划,提名或让同行认可您为推进地球与空间科学所做的 工作。• 与您的同龄人和学生/早期职业专业人士进行分组交流,以进一步扩大您的学科影响 范围。• 免费的: • AGU获奖的新闻杂志《Eos》月刊。 • 季度电子书。 • Geofacets千禧版访问权限。 • AGU数字图书馆的访问权限,此图书馆是我们1996年以来的数化期刊内容,其中一些 可以追溯 到100多年前。
请即刻获取或续签您的AGU会员资格!
www.agu.org/join
www.agu.org/joinwww.agu.org/join
¡Únase o renueve ya mismo su membresía AGU!Al unirse a AGU, se conectará a una comunidad mundial de 130,000 de entusiastas a expertos en ciencias de la Tierra y del espacio.
Como miembro de AGU, estará:• Apoyando futuras generaciones de científicos de la Tierra y del espacio.• Ayudando a que la comunidad de la ciencia de la Tierra y del espacio sea más diversa e inclusiva.• Expandiendo su red profesional.• Compartiendo sus investigaciones y conocimientos.• Aprendiendo de los demás para mantenerse actualizado con las noticias e investigaciones más recientes.• Participando en la reunión de otoño, con comerciantes y otras reuniones y eventos científicos.
Los miembros de AGU también reciben: • Descuentos en las publicaciones AGU, incluido un 35 % de descuento en libros.• Tarifas reducidas para las reuniones de AGU, incluida la reunión de otoño, para presentar su investigación y ampliar su red.• Nominación o reconocimiento de sus compañeros por su trabajo para promover las ciencias terrestres y espaciales a través de nuestro programa de Honores y Reconocimientos.• Interacciones con sus compañeros y estudiantes/profesionales comenzando la carrera en secciones para expandir aún más el alcance de su disciplina.• Gratis: • Número mensual de Eos, la galardonada revista de noticias de AGU. • Libros electrónicos trimestrales. • Acceso a la edición de Geofacets Millennium. • Acceso a la Biblioteca Digital AGU, que contiene nuestras revistas digitalizadas hasta 1996, algunas de las cuales se remontan a más de 100 años.
¡Únase o renueve ya mismo su membresía AGU!
JOIN OR RENEW YOUR AGU MEMBERSHIP!
SCIENCE NEWS BY AGU // Eos.org 19
OPINION
Charting Satellite Courses in a Crowded Thermosphere
Satellites play important roles in our daily lives, providing navigation, data, and communications solutions, as well
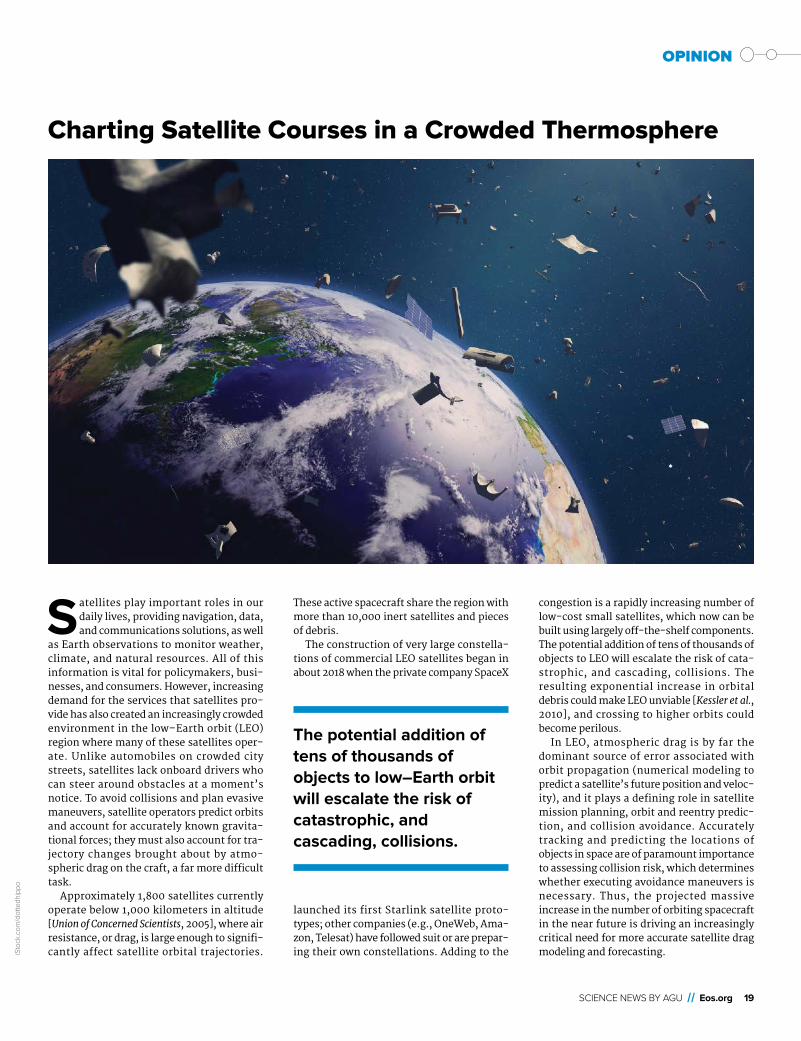
as Earth observations to monitor weather, climate, and natural resources. All of this information is vital for policymakers, busi-nesses, and consumers. However, increasing demand for the services that satellites pro-vide has also created an increasingly crowded environment in the low– Earth orbit (LEO) region where many of these satellites oper-ate. Unlike automobiles on crowded city streets, satellites lack onboard drivers who can steer around obstacles at a moment’s notice. To avoid collisions and plan evasive maneuvers, satellite operators predict orbits and account for accurately known gravita-tional forces; they must also account for tra-jectory changes brought about by atmo-spheric drag on the craft, a far more difficult task.
Approximately 1,800 satellites currently operate below 1,000 kilometers in altitude [Union of Concerned Scientists, 2005], where air resistance, or drag, is large enough to signifi-cantly affect satellite orbital trajectories.
These active spacecraft share the region with more than 10,000 inert satellites and pieces of debris.
The construction of very large constella-tions of commercial LEO satellites began in about 2018 when the private company SpaceX
launched its first Starlink satellite proto-types; other companies (e.g., OneWeb, Ama-zon, Telesat) have followed suit or are prepar-ing their own constellations. Adding to the
congestion is a rapidly increasing number of low- cost small satellites, which now can be built using largely off- the- shelf components. The potential addition of tens of thousands of objects to LEO will escalate the risk of cata-strophic, and cascading, collisions. The resulting exponential increase in orbital debris could make LEO unviable [Kessler et al., 2010], and crossing to higher orbits could become perilous.
In LEO, atmospheric drag is by far the dominant source of error associated with orbit propagation (numerical modeling to predict a satellite’s future position and veloc-ity), and it plays a defining role in satellite mission planning, orbit and reentry predic-tion, and collision avoidance. Accurately tracking and predicting the locations of objects in space are of paramount importance to assessing collision risk, which determines whether executing avoidance maneuvers is necessary. Thus, the projected massive increase in the number of orbiting spacecraft in the near future is driving an increasingly critical need for more accurate satellite drag modeling and forecasting.
The potential addition of tens of thousands of objects to low–Earth orbit will escalate the risk of catastrophic, and cascading, collisions.
iSto
ck.c
om/d
otte
dhip
po

20 Eos // MAY 2021
OPINION
Quality Models Require Quality InputThe accuracy of orbit prediction relies on the quality of the atmospheric drag force models and the forecasts they produce. Satellite characteristics (e.g., size and geometry) influence atmospheric drag, but drag mostly depends on the very low density of the highly variable upper atmosphere, called the ther-mosphere. Realizing significant advances in orbit prediction will require more accurate specification and forecasting of this space environment. The greatest limitation to improving thermosphere models is the inconsistent quality and sparse distribution of upper atmosphere observations.
Uncertainties in atmospheric drag model-ing are largely associated with variability of the density of the neutral (as opposed to charged) atoms and molecules in the thermo-sphere. This variability is driven by changing solar extreme ultraviolet emissions (referred to as solar activity), by interactions of the magnetosphere with the solar wind (referred to as geomagnetic activity), and by upwardly propagating meteorological perturbations like gravity waves and tides that originate at lower altitudes in Earth’s atmosphere.
Information about these driving sources is required to feed both empirical and physics- based models of the upper atmosphere, which in turn are used (separately) to calculate sat-ellite drag. Despite progress made over the
past couple of decades, large uncertainties still exist in estimates of the solar, magneto-spheric, and gravity wave energy input to—and thus in how this energy affects—the ther-mosphere [e.g., Siscoe et al., 2004; Palmroth et al., 2005; Peterson et al., 2012; Oberheide et al., 2015; Becker and Vadas, 2020].
As the scientific community focuses on improving measurements of the magnitude, spatial distribution, and temporal evolution of these drivers, efforts are under way to advance modeling of thermospheric variabil-ity with the development and testing of data assimilation schemes that combine models and near- real- time observations [e.g., Codrescu et al., 2018; Sutton, 2018; Pilinski et al., 2016]. Data assimilation methods have been
used in terrestrial weather analyses and fore-casts for decades to better specify initial meteorological conditions in models.
Sparse Data from the ThermosphereData assimilation methods require a steady stream of observations with which to update and refine model forecasts. The main obstacle in data assimilation efforts for thermosphere specification is the scarcity of high- quality measurements of density, temperature, and composition. After a hiatus of more than 15 years when practically no data were col-lected, the distribution of density data since observations started again in 2000 has still been rather sparse (Figure 1). Although these data have facilitated new research investigat-ing the upper atmosphere, that contribution will stagnate without adequate follow- up data collection missions.
This information is even more important for the development of operational models con-strained by data assimilation. Data assimila-tion and subsequent model verification with independent observations are, by definition, not possible without current data. Sustained, long- term global observations of such key variables as temperature, wind, and the chem-ical composition in the thermosphere are essential for achieving a better understanding of its complex dynamics and chemistry, for evaluating and improving models, and for developing robust forecasting capabilities.
Filling the Data Gaps High- resolution measurements of air density have been inferred from accelerometer data since 2000. These data were collected by the German CHAMP (Challenging Minisatellite Payload) satellite and then by NASA and Deutsches Zentrum für Luft- und Raum-fahrt’s GRACE (Gravity Recovery and Climate Experiment) satellite and the European Space Agency’s GOCE (Gravity Field and Steady- State Ocean Circulation Explorer) and Swarm satellites. Except for Swarm, atmospheric density monitoring was not a mission objec-tive, so these valuable density data sets we currently have are data of opportunity. The data sets made relatively detailed verification of thermosphere models possible for the first time, which in turn contributed significantly to the models’ improvement.
Figure 1 shows that we have few measure-ments of density under high and very high solar activity conditions. We also have very few measurements from days when geomag-netic storm conditions were moderate to extreme because of the relative rareness of these short- duration ( 1- 3 days, typically)
Fig. 1. This stacked histogram shows the distribution of accelerometer density observations of geomagnetic and
solar activity by altitude and total observation duration from 2000 to 2018. Observations are from the CHAMP
(Challenging Minisatellite Payload), GRACE (Gravity Recovery and Climate Experiment), GOCE (Gravity Field and
Steady- State Ocean Circulation Explorer), and Swarm satellites. CHAMP and GRACE data were obtained from a
repository at Delft University of Technology; GOCE and Swarm data were obtained from the European Space
Agency’s Earth Online platform.
The greatest limitation to improving thermosphere models is the inconsistent quality and sparse distribution of upper atmosphere observations.
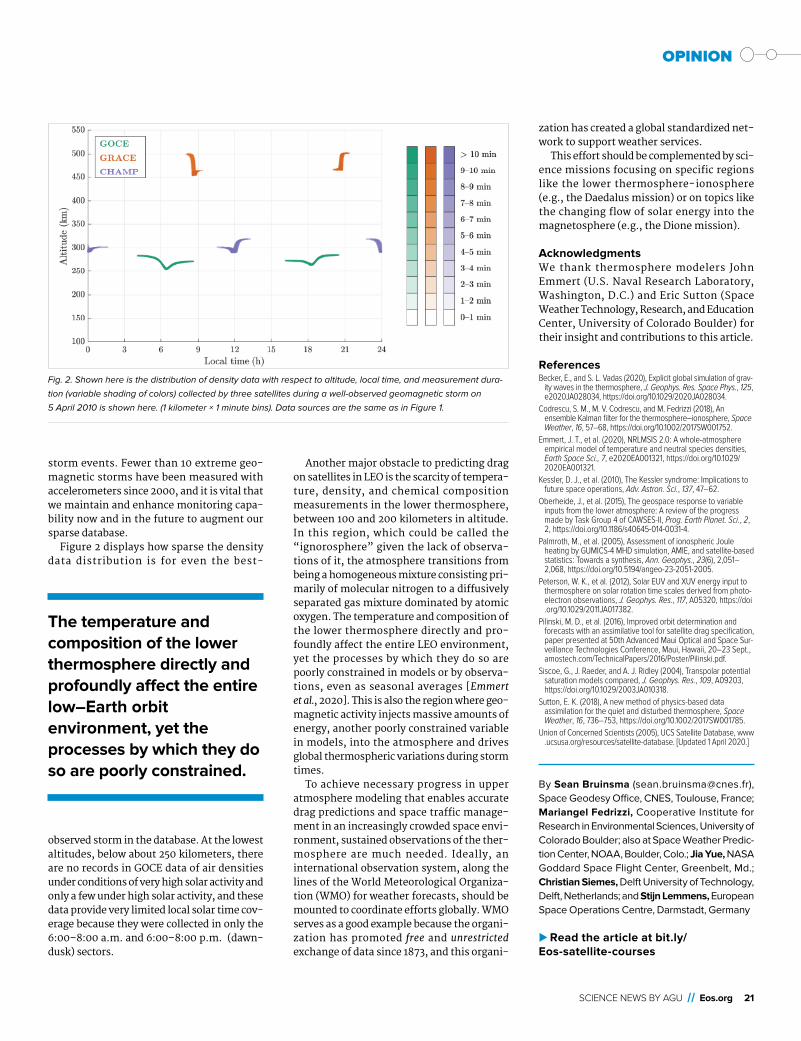
SCIENCE NEWS BY AGU // Eos.org 21
OPINION
storm events. Fewer than 10 extreme geo-magnetic storms have been measured with accelerometers since 2000, and it is vital that we maintain and enhance monitoring capa-bility now and in the future to augment our sparse database.
Figure 2 displays how sparse the density data distribution is for even the best-
observed storm in the database. At the lowest altitudes, below about 250 kilometers, there are no records in GOCE data of air densities under conditions of very high solar activity and only a few under high solar activity, and these data provide very limited local solar time cov-erage because they were collected in only the 6: 00– 8:00 a.m. and 6: 00– 8:00 p.m. ( dawn- dusk) sectors.
Another major obstacle to predicting drag on satellites in LEO is the scarcity of tempera-ture, density, and chemical composition measurements in the lower thermosphere, between 100 and 200 kilometers in altitude. In this region, which could be called the “ignorosphere” given the lack of observa-tions of it, the atmosphere transitions from being a homogeneous mixture consisting pri-marily of molecular nitrogen to a diffusively separated gas mixture dominated by atomic oxygen. The temperature and composition of the lower thermosphere directly and pro-foundly affect the entire LEO environment, yet the processes by which they do so are poorly constrained in models or by observa-tions, even as seasonal averages [Emmert et al., 2020]. This is also the region where geo-magnetic activity injects massive amounts of energy, another poorly constrained variable in models, into the atmosphere and drives global thermospheric variations during storm times.
To achieve necessary progress in upper atmosphere modeling that enables accurate drag predictions and space traffic manage-ment in an increasingly crowded space envi-ronment, sustained observations of the ther-mosphere are much needed. Ideally, an international observation system, along the lines of the World Meteorological Organiza-tion (WMO) for weather forecasts, should be mounted to coordinate efforts globally. WMO serves as a good example because the organi-zation has promoted free and unrestricted exchange of data since 1873, and this organi-
zation has created a global standardized net-work to support weather services.
This effort should be complemented by sci-ence missions focusing on specific regions like the lower thermosphere- ionosphere (e.g., the Daedalus mission) or on topics like the changing flow of solar energy into the magnetosphere (e.g., the Dione mission).
AcknowledgmentsWe thank thermosphere modelers John Emmert (U.S. Naval Research Laboratory, Washington, D.C.) and Eric Sutton (Space Weather Technology, Research, and Education Center, University of Colorado Boulder) for their insight and contributions to this article.
ReferencesBecker, E., and S. L. Vadas (2020), Explicit global simulation of grav-
ity waves in the thermosphere, J. Geophys. Res. Space Phys., 125, e2020JA028034, https:// doi .org/ 10 .1029/ 2020JA028034.
Codrescu, S. M., M. V. Codrescu, and M. Fedrizzi (2018), An ensemble Kalman filter for the thermosphere– ionosphere, Space Weather, 16, 57– 68, https:// doi .org/ 10.1002/ 2017SW001752.
Emmert, J. T., et al. (2020), NRLMSIS 2.0: A whole- atmosphere empirical model of temperature and neutral species densities, Earth Space Sci., 7, e2020EA001321, https:// doi .org/ 10.1029/ 2020EA001321.
Kessler, D. J., et al. (2010), The Kessler syndrome: Implications to future space operations, Adv. Astron. Sci., 137, 47– 62.
Oberheide, J., et al. (2015), The geospace response to variable inputs from the lower atmosphere: A review of the progress made by Task Group 4 of CAWSES- II, Prog. Earth Planet. Sci., 2, 2, https:// doi .org/ 10.1186/ s40645- 014- 0031- 4.
Palmroth, M., et al. (2005), Assessment of ionospheric Joule heating by GUMICS- 4 MHD simulation, AMIE, and satellite- based statistics: Towards a synthesis, Ann. Geophys., 23(6), 2, 051– 2,068, https:// doi .org/ 10 .5194/ angeo- 23- 2051- 2005.
Peterson, W. K., et al. (2012), Solar EUV and XUV energy input to thermosphere on solar rotation time scales derived from photo-electron observations, J. Geophys. Res., 117, A05320, https:// doi .org/ 10 .1029/ 2011JA017382.
Pilinski, M. D., et al. (2016), Improved orbit determination and forecasts with an assimilative tool for satellite drag specification, paper presented at 50th Advanced Maui Optical and Space Sur-veillance Technologies Conference, Maui, Hawaii, 20– 23 Sept., amostech .com/ TechnicalPapers/ 2016/ Poster/ Pilinski .pdf.
Siscoe, G., J. Raeder, and A. J. Ridley (2004), Transpolar potential saturation models compared, J. Geophys. Res., 109, A09203, https:// doi .org/ 10 .1029/ 2003JA010318.
Sutton, E. K. (2018), A new method of physics- based data assimilation for the quiet and disturbed thermosphere, Space Weather, 16, 736– 753, https:// doi .org/ 10 .1002/ 2017SW001785.
Union of Concerned Scientists (2005), UCS Satellite Database, www .ucsusa .org/ resources/ satellite- database. [Updated 1 April 2020.]
By Sean Bruinsma (sean .bruinsma @cnes .fr), Space Geodesy Office, CNES, Toulouse, France; Mariangel Fedrizzi, Cooperative Institute for Research in Environmental Sciences, University of Colorado Boulder; also at Space Weather Predic-tion Center, NOAA, Boulder, Colo.; Jia Yue, NASA Goddard Space Flight Center, Greenbelt, Md.; Christian Siemes, Delft University of Technology, Delft, Netherlands; and Stijn Lemmens, European Space Operations Centre, Darmstadt, Germany
uRead the article at bit.ly/Eos-satellite-courses
Fig. 2. Shown here is the distribution of density data with respect to altitude, local time, and measurement dura-
tion (variable shading of colors) collected by three satellites during a well- observed geomagnetic storm on
5 April 2010 is shown here. (1 kilometer × 1 minute bins). Data sources are the same as in Figure 1.
The temperature and composition of the lower thermosphere directly and profoundly affect the entire low– Earth orbit environment, yet the processes by which they do so are poorly constrained.

22 Eos // MAY 2021
Cubist Geomorphology: Your Kinship with Picasso, Explained
Mask on, glasses fogged, I studied the brightly painted courtyard scene on the canvas in front of me, one of
David Hockney’s midcareer Cubist nods. Before the pandemic, I would have breezed by its bold colors in favor of the artist’s more subdued works. But after 3 long months cooped up in my small apartment, I savored every minute in the gallery, taking care to study each individual piece on dis-play. I thought about Hockney’s treatment of perspective—it was summative. He had captured every angle of the courtyard from one vantage point. My seemingly stagnant dissertation weighing heavily on my mind, I found in Hockney’s painting a mirror of my own research on glacial landscapes and realized that I and his Cubist forebears may have more in common than I previously thought.
For self- respecting scientists who pride themselves on the accurate description and reportage of scientific fact, equating Cubist art with scientific practice is, perhaps, a heretical suggestion. Georges Braque, Pablo Picasso, Juan Gris, and other Cubists scandal-ously distorted their subjects to the brink of unrecognition. Conversely, Earth scientists, and scientists more generally, pride them-selves on a puritanical devotion to the study of a physics- grounded reality. By what stretch of the imagination could Cubism’s landscape blasphemers share any overlap with their pious relations, the Earth scientists?
Deconstructing the Earth SciencesViewed through the eyes of an Earth scientist, a mountain range is not a tall agglomeration of rock, soil, and vegetation but is evidence of a complex system of interwoven pro-
cesses. Formed (in many cases) fol-lowing the colli-sion of tectonic plates, mountain building continues until the pressure between plates is relieved. This relief is often achieved when one of the plates subducts under the other and is consumed b y t h e m a n t l e below. At the sur-face, the mountain range weathers and erodes as a function of tecton-ics and climate. Weathering, ero-sion, and sediment transport occur during and after tectonic uplift and proceed, in theory, until the angle of the mountain slope relative to the sur-rounding terrain is near zero—that is, the surface is flat, and the mountains no longer exist.
This idealized portrait of the life cycle of a mountain range, however, remains rare and elusive in nature. The geometry of a subduct-ing plate can affect the differential height of mountains in a range, and regions with com-plex tectonic regimes and histories (Southern California, Tibet, and Greece, to name a few) often experience multiple or even concurrent episodes of mountain building. Differing and temporally evolving climatic regimes sculpt landscapes into a mélange of past and pres-ent. Relict glacial features mingle with active floodplains; ancient fault scarps are cut by modern landslides.
“Archetype” landscapes that reflect cur-rent geomorphic processes are therefore rare on Earth. The Earth scientist’s role is to define distinct regimes within these palimp-sests and use observations of Earth as it pres-ently exists for informed inference. We study Earth and then carve it into its constituent pieces to make sense of it.
When considering the uplift and erosion of a mountain range, for instance, we could begin by thinking of the mountain as an equi-lateral pyramid eroding at a constant rate, then move on to more complicated geome-tries and erosion styles that better reflect real mountains. In doing so, we build an imagined, simplified reality—a reality that exists nowhere but allows us to draw out and emphasize certain elements we know to be important and to distill a numbingly complex landscape (or process) into its most essential components.
Geomorphic CubismCubists, too, distill their landscapes to dis-crete elements.
Consider Braque’s Castle of La Roche- Guyon (1909). This work is characterized by sequen-tial, retreating planes within a central lozenge shape and is painted in a two- toned color scheme that facilitates the immediate divi-sion of textural forms into the more loosely painted green (suggesting foliage) and the yellow- ochre- beige shapes of the castle and associated buildings. Distilled into its most fundamental components, the scene is iden-tifiable but disorienting. One cannot quite distinguish the background from the fore-ground—and from what vantage point is the viewer observing this castle?
Braque’s landscape is compressed and reorganized, a landscape painted by an artist
GEOFIZZGEOFIZZ
Georges Braque’s Castle of La Roche- Guyon reflects the artist’s perception of a
landscape more than a naturalistic reproduction. Credit: Pushkin Museum of Fine
Arts/HIP/Art Resource, NY
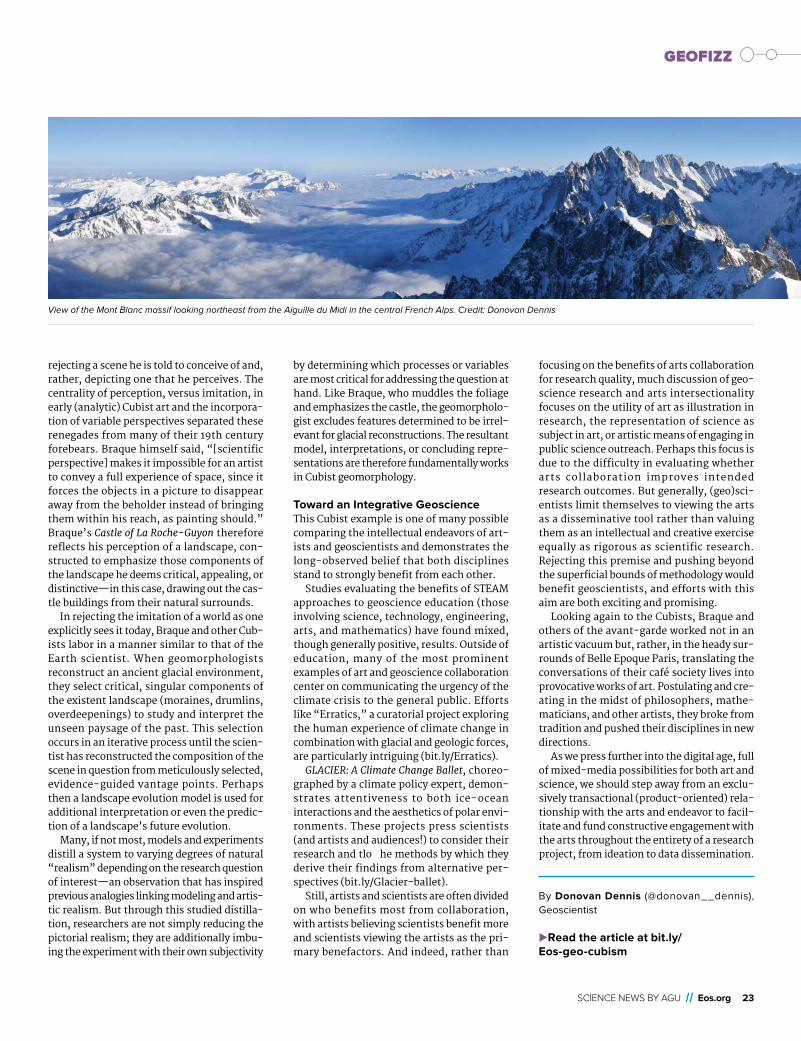
SCIENCE NEWS BY AGU // Eos.org 23
GEOFIZZ
rejecting a scene he is told to conceive of and, rather, depicting one that he perceives. The centrality of perception, versus imitation, in early (analytic) Cubist art and the incorpora-tion of variable perspectives separated these renegades from many of their 19th century forebears. Braque himself said, “[scientific perspective] makes it impossible for an artist to convey a full experience of space, since it forces the objects in a picture to disappear away from the beholder instead of bringing them within his reach, as painting should.” Braque’s Castle of La Roche- Guyon therefore reflects his perception of a landscape, con-structed to emphasize those components of the landscape he deems critical, appealing, or distinctive—in this case, drawing out the cas-tle buildings from their natural surrounds.
In rejecting the imitation of a world as one explicitly sees it today, Braque and other Cub-ists labor in a manner similar to that of the Earth scientist. When geomorphologists reconstruct an ancient glacial environment, they select critical, singular components of the existent landscape (moraines, drumlins, overdeepenings) to study and interpret the unseen paysage of the past. This selection occurs in an iterative process until the scien-tist has reconstructed the composition of the scene in question from meticulously selected, evidence- guided vantage points. Perhaps then a landscape evolution model is used for additional interpretation or even the predic-tion of a landscape’s future evolution.
Many, if not most, models and experiments distill a system to varying degrees of natural “realism” depending on the research question of interest—an observation that has inspired previous analogies linking modeling and artis-tic realism. But through this studied distilla-tion, researchers are not simply reducing the pictorial realism; they are additionally imbu-ing the experiment with their own subjectivity
by determining which processes or variables are most critical for addressing the question at hand. Like Braque, who muddles the foliage and emphasizes the castle, the geomorpholo-gist excludes features determined to be irrel-evant for glacial reconstructions. The resultant model, interpretations, or concluding repre-sentations are therefore fundamentally works in Cubist geomorphology.
Toward an Integrative GeoscienceThis Cubist example is one of many possible comparing the intellectual endeavors of art-ists and geoscientists and demonstrates the long- observed belief that both disciplines stand to strongly benefit from each other.
Studies evaluating the benefits of STEAM approaches to geoscience education (those involving science, technology, engineering, arts, and mathematics) have found mixed, though generally positive, results. Outside of education, many of the most prominent examples of art and geoscience collaboration center on communicating the urgency of the climate crisis to the general public. Efforts like “Erratics,” a curatorial project exploring the human experience of climate change in combination with glacial and geologic forces, are particularly intriguing (bit .ly/ Erratics).
GLACIER: A Climate Change Ballet, choreo-graphed by a climate policy expert, demon-strates attentiveness to both ice- ocean interactions and the aesthetics of polar envi-ronments. These projects press scientists (and artists and audiences!) to consider their research and tlo he methods by which they derive their findings from alternative per-spectives (bit .ly/ Glacier-ballet).
Still, artists and scientists are often divided on who benefits most from collaboration, with artists believing scientists benefit more and scientists viewing the artists as the pri-mary benefactors. And indeed, rather than
focusing on the benefits of arts collaboration for research quality, much discussion of geo-science research and arts intersectionality focuses on the utility of art as illustration in research, the representation of science as subject in art, or artistic means of engaging in public science outreach. Perhaps this focus is due to the difficulty in evaluating whether arts collaboration improves intended research outcomes. But generally, (geo)sci-entists limit themselves to viewing the arts as a disseminative tool rather than valuing them as an intellectual and creative exercise equally as rigorous as scientific research. Rejecting this premise and pushing beyond the superficial bounds of methodology would benefit geoscientists, and efforts with this aim are both exciting and promising.
Looking again to the Cubists, Braque and others of the avant- garde worked not in an artistic vacuum but, rather, in the heady sur-rounds of Belle Epoque Paris, translating the conversations of their café society lives into provocative works of art. Postulating and cre-ating in the midst of philosophers, mathe-maticians, and other artists, they broke from tradition and pushed their disciplines in new directions.
As we press further into the digital age, full of mixed- media possibilities for both art and science, we should step away from an exclu-sively transactional ( product- oriented) rela-tionship with the arts and endeavor to facil-itate and fund constructive engagement with the arts throughout the entirety of a research project, from ideation to data dissemination.
By Donovan Dennis (@donovan__dennis), Geoscientist
uRead the article at bit.ly/Eos-geo-cubism
GEOFIZZ
View of the Mont Blanc massif looking northeast from the Aiguille du Midi in the central French Alps. Credit: Donovan Dennis
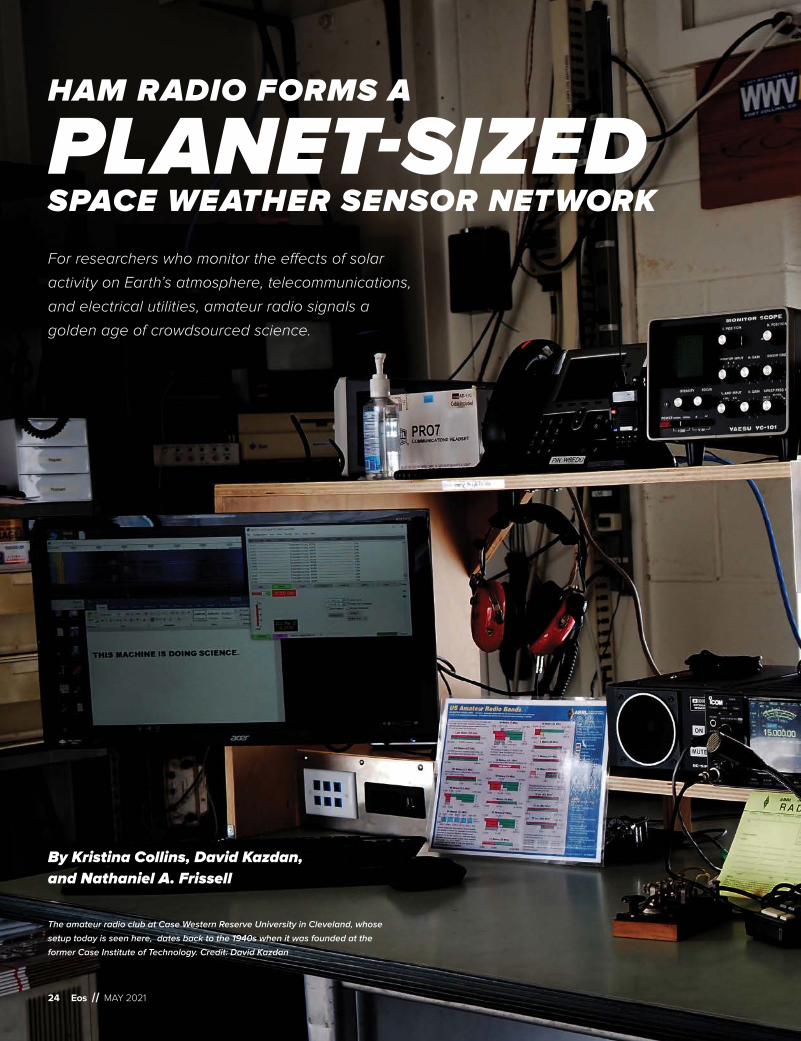
For researchers who monitor the effects of solar
activity on Earth’s atmosphere, telecommunications,
and electrical utilities, amateur radio signals a
golden age of crowdsourced science.
By Kristina Collins, David Kazdan, and Nathaniel A. Frissell
HAM RADIO FORMS A
PLANET-SIZEDSPACE WEATHER SENSOR NETWORK
24 Eos // MAY 2021
The amateur radio club at Case Western Reserve University in Cleveland, whose
setup today is seen here, dates back to the 1940s when it was founded at the
former Case Institute of Technology. Credit: David Kazdan

SCIENCE NEWS BY AGU // Eos.org 25

26 Eos // MAY 2021
S pace weather events, triggered by solar emissions and their interactions with Earth’s atmosphere, can have significant effects on communications and navigation technology and on electrical power systems. As with ter-restrial weather events, the economic impacts of space
weather– related disruptions can be substantial, affecting satellite systems as well as systems on the ground. A severe geomagnetic storm (on the order of the Carrington Event of 1859) could have a cat-astrophic effect on modern infrastructure. Even solar storms of more ordinary size can induce currents in the power grid that drive up energy prices, affecting manufacturing and commerce.
Considerable interest exists in developing space weather forecast-ing technologies that use Earth’s ionosphere as a sensor for events in its neighboring atmospheric layers. The ionosphere occupies a privi-leged niche in the geospace system, as it is coupled into both the ter-restrial weather of the neutral atmosphere below and the space weather of the magnetosphere above.
Although we have a good understanding of ionospheric climate—diurnal and seasonal variations are well known, as are the rhythms of the sunspot cycle—there are new and vital areas of research to be explored. For example, it is known that the ionosphere—and near- Earth space—experiences variability (e.g., radio signals can fade in and out over periods of seconds, minutes, or hours due to changes in ionospheric electron densities along signal propagation paths), but this variability has not been sampled or studied adequately on regional and global scales.
To fully understand variability on small spatial scales and short timescales, the scientific community will require vastly larger and denser sensing networks that collect data on continental and global scales. With open- source instrumentation cheaper and more plenti-ful than ever before, the time is ripe for amateur scientists to take distributed measurements of the ionosphere—and the amateur radio community is up for the challenge.
The Ham Radio Science Citizen Investigation (HamSCI) is a col-lective that unites amateur radio operators with the research com-munity in the space and atmospheric sciences. This confederation of scientists, engineers, and hobbyists holds annual workshops during which ham radio operators and space scientists share find-ings. A new HamSCI effort, the Personal Space Weather Station project, aims to develop a robust and scalable network of amateur stations that will allow amateurs to collect useful data for space sci-ence researchers. The next HamSCI workshop was held virtually 19- 21 March 2021, and focused on midlatitude ionospheric mea-surements.
A Ready-Made Volunteer Science CommunityFrom a communications point of view, the electromagnetic spectrum is a finite resource. Signals from broadcasting, telecommunications, and navigation all have their own demands of bandwidth and range. Spectrum allocations are managed by government agencies, such as the Federal Communications Commission (FCC) in the United States. Most countries allot some of the available spectrum to amateur users
Equipment belonging to the Case Western Reserve University amateur radio club is seen here. Solar- induced effects in Earth’s ionosphere change the frequencies of radio
signals picked up at receiving stations around the world, so ham radio enthusiasts can provide a rich source of information on space weather. Credit: Kristina Collins

SCIENCE NEWS BY AGU // Eos.org 27
for the purposes of recreation, experimentation, and the promotion of international goodwill. There are more than 760,000 licensed amateur radio operators and uncounted shortwave listeners in the United States alone.
Amateur radio operators have an empirical knowledge of space weather because they want to know when and on what frequencies they can establish communications—and when and where they can-not. Changes in the ionosphere like those caused by the day- night transition or by solar activity can impede or aid communications on various frequencies. For example, the 20- meter band ( 14- 14.35 megahertz) usually has its longest transcontinental reach during daylight hours, but the 40- meter band ( 7- 7.3 megahertz) often works best at night. Amateur radio frequency allocations are distributed throughout the electromagnetic spectrum, enabling useful propaga-tion experiments for any frequency range.
In the pursuit of the hobby, many an amateur operator (or “ham”) has experienced hearing the high- frequency (HF) bands ( 3- 30 mega-hertz) go quiet right after sunset or has swapped frequencies to reach a distant station. Hams greatly value forecasts of space weather con-ditions and real- time information about propagation, and the com-munity has a high level of scientific literacy on the topic. Resources like spaceweather.com and a weekly podcast by Tamitha Skov (the “Space Weather Woman,” whose amateur call sign is WX6SWW) are regularly consulted today by hams looking to achieve a distant con-tact.
Ham radio is currently experiencing a technical renaissance, thanks to the advent of inexpensive single- board computing plat-forms (a complete computer built onto a single circuit board, such as a Raspberry Pi) and open- source software. Such computer- based systems serve as virtual radio repeaters, connecting computers via the Internet to actual ham radios in the real world to enable remote control and data collection. Beyond the old- fashioned pursuit of voice communication, the lure of maker movement projects and the removal of the Morse code requirement from the amateur licensing exam have led to a greater number of licensed amateurs than ever before.
Out of this increasing technical sophistication, digital communica-tions networks, such as the Automatic Packet Reporting System (APRS), the Weak Signal Propagation Reporter (WSPR), and the Reverse Beacon Network (RBN), enjoy wide membership and serve the amateur community while collecting propagation data at rates and resolutions that were previously impossible. The reach of these crowdsourced systems and the support of the amateur community offer tremendous opportunities for scientific measurements.
One such measurement took place at sunset on 17 October 2017, when amateur station W8EDU in Cleveland transmitted the Morse code for “TEST TEST TEST DE W8EDU W8EDU W8EDU” on frequen-cies in the 20-, 40-, and 80- meter bands. A map of the automated listening stations in the RBN that picked up, or “spotted,” this signal shows all of the spots with extant propagation paths (Figure 1). In this case, the result clearly shows that the 40- meter paths go primarily to the nightside of the terminator (the moving boundary between regions in daylight and those in darkness), and the 20- meter paths, to the dayside.
For amateur operators, this is a useful tool for determining the reach of one’s signals: A ham might say that “there’s a path into Europe opening up on 40 meters” and listen for the call signs of European stations. Or, if operators want to reach a station in South America, they might rotate their antenna by 90° and try running an RBN test again.
Harnessing the Data for ScienceHow can ham radio signals tell scientists about energy and particles originating in the Sun and traveling millions of miles through space? The answer lies in the ionosphere, the electrified atmospheric region that can refract radio signals back to Earth. This is a complex region heavily influenced by the solar wind, extreme ultraviolet ionizing radiation, geomagnetic disturbances, and even by the lower and mid-dle neutral atmosphere.
From the perspective of scientists studying the ionosphere, ham radio data become most interesting in aggregate. All the data in the RBN, from 2009 to the present, are archived at reversebeacon.net and can be freely downloaded. For scale, the earlier- referenced Cleveland transmission represented only a small subset of the 168,713 radio spots that were recorded on 17 October 2017, each one representing a propagation path between two points on a given frequency at a given time.
HamSCI encouraged amateur operators to generate data on the RBN during the North American eclipse of 2017. Later analysis con-firmed that the RBN data were consistent with physics- based iono-spheric models [Frissell et al., 2018], demonstrating the promise of this system for collecting propagation data.
A further advantage of collecting data through the amateur com-munity is that these observations naturally tend to fulfill the require-ments of FAIR data: findable, accessible, interoperable, and reusable. Amateur operators are prohibited by the strictures of licensure from earning money through the act of operating, so most data used by operators are open and accessible at their creation. Because much of the amateur community is technically literate, databases and records are structured around machine readability. Most important, amateur radio has a global and persistent identifier woven into the metadata of every recorded contact: Each licensed operator or club has a unique call sign, tied to a physical address in its respective government data-base.
“At the Tone, the Time Will Be…”Just outside Fort Collins, Colo., lies the heartbeat of the electromag-netic communications spectrum—and one key to precision measure-ments of the interactions between ham radio and solar weather. The sound of radio station WWV, the time and frequency standard of the National Institute of Standards and Technology, is familiar to any shortwave listener. It is the oldest continuously operating radio sta-tion in the United States, having been on the air since 1919. Today
Fig. 1. On 10 October 2017, stations in the Reverse Beacon Network spotted a test
message from amateur station W8EDU, the school club of Case Western Reserve
University in Cleveland. Yellow lines go to stations that received broadcasts on the
40- meter band, and magenta lines go to stations that received broadcasts on the
20- meter band. Credit: Kristina Collins; Map data ©2017 Google, INEGI, ORION- ME
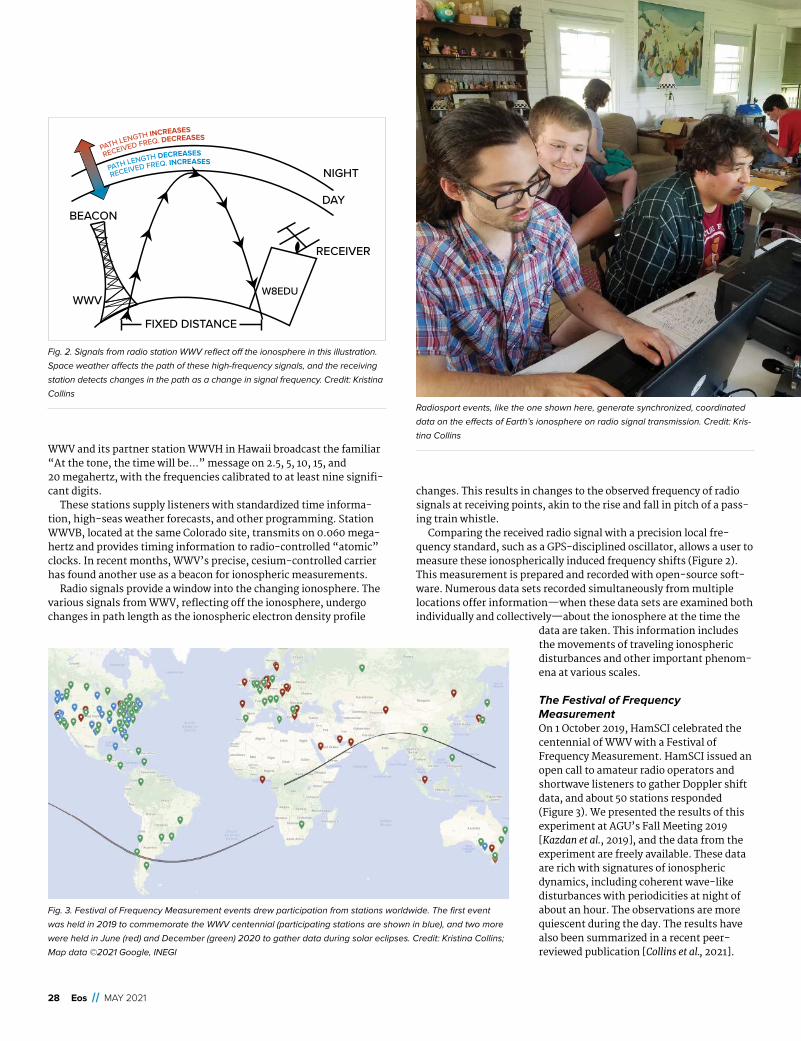
28 Eos // MAY 2021
WWV and its partner station WWVH in Hawaii broadcast the familiar “At the tone, the time will be...” message on 2.5, 5, 10, 15, and 20 megahertz, with the frequencies calibrated to at least nine signifi-cant digits.
These stations supply listeners with standardized time informa-tion, high- seas weather forecasts, and other programming. Station WWVB, located at the same Colorado site, transmits on 0.060 mega-hertz and provides timing information to radio- controlled “atomic” clocks. In recent months, WWV’s precise, cesium- controlled carrier has found another use as a beacon for ionospheric measurements.
Radio signals provide a window into the changing ionosphere. The various signals from WWV, reflecting off the ionosphere, undergo changes in path length as the ionospheric electron density profile
changes. This results in changes to the observed frequency of radio signals at receiving points, akin to the rise and fall in pitch of a pass-ing train whistle.
Comparing the received radio signal with a precision local fre-quency standard, such as a GPS- disciplined oscillator, allows a user to measure these ionospherically induced frequency shifts (Figure 2). This measurement is prepared and recorded with open- source soft-ware. Numerous data sets recorded simultaneously from multiple locations offer information—when these data sets are examined both individually and collectively—about the ionosphere at the time the
data are taken. This information includes the movements of traveling ionospheric disturbances and other important phenom-ena at various scales.
The Festival of Frequency MeasurementOn 1 October 2019, HamSCI celebrated the centennial of WWV with a Festival of Frequency Measurement. HamSCI issued an open call to amateur radio operators and shortwave listeners to gather Doppler shift data, and about 50 stations responded (Figure 3). We presented the results of this experiment at AGU’s Fall Meeting 2019 [Kazdan et al., 2019], and the data from the experiment are freely available. These data are rich with signatures of ionospheric dynamics, including coherent wave- like disturbances with periodicities at night of about an hour. The observations are more quiescent during the day. The results have also been summarized in a recent peer-reviewed publication [Collins et al., 2021].
Fig. 3. Festival of Frequency Measurement events drew participation from stations worldwide. The first event
was held in 2019 to commemorate the WWV centennial (participating stations are shown in blue), and two more
were held in June (red) and December (green) 2020 to gather data during solar eclipses. Credit: Kristina Collins;
Map data ©2021 Google, INEGI
PATH LENGTH INCREASES
RECEIVED FREQ. DECREASES
PATH LENGTH DECREASES
RECEIVED FREQ. INCREASES
NIGHT
DAY
RECEIVER
FIXED DISTANCE
WWV
BEACON
W8EDU
Fig. 2. Signals from radio station WWV reflect off the ionosphere in this illustration.
Space weather affects the path of these high-frequency signals, and the receiving
station detects changes in the path as a change in signal frequency. Credit: Kristina
Collins
Radiosport events, like the one shown here, generate synchronized, coordinated
data on the effects of Earth’s ionosphere on radio signal transmission. Credit: Kris-
tina Collins

SCIENCE NEWS BY AGU // Eos.org 29
WWV was never intended to provide these data, but the station’s exceptional precision, high power, and guaranteed continuous avail-ability make it a perfect beacon. Thanks to the advent of inexpensive GPS- disciplined oscillators and single- board computers, amateur scientists can assemble complete prototype systems to collect such data for less than $200, or they can build systems from existing equipment. Thus, the amateur community, mobilized on a national scale, can generate a novel, large- scale, data set for ionospheric study.
Data collection campaigns during the solar eclipses of 2020 demonstrated the potential for scientists to engage with the amateur community. Dubbed the Eclipse Festivals (Figure 3), these events fol-lowed the template of the WWV centennial event on a global scale, using 10- megahertz time standard stations. The June 2020 Eclipse Festival, built around the annular solar eclipse across eastern Africa and Asia on 21 June, ran for 3 days and included volunteer participa-tion from 50 stations in 19 countries. The December 2020 Eclipse Fes-tival, a 7- day campaign built around the total solar eclipse across South America on 14 December, drew data submissions from more than 80 stations. Both were advertised through the same channels used for radiosport contests and other events. The strong participa-tion in these events demonstrates the community’s interest in com-munity science and the potential for deployment in science cam-paigns.
Making Space Weather PersonalThe personal weather station has become a familiar fixture for mete-orologists. Stations belonging to hobbyists, networked through sites like Weather Underground, provide a dense constellation of sensors reporting air temperature and pressure as well as precipitation. We have better knowledge of terrestrial weather because of these net-works, but no such system exists yet for ionospheric weather.
Through HamSCI, ham radio operators and researchers are bridg-ing this gap by designing hardware for a distributed network of per-sonal space weather stations (PSWSs), accessible to professional and amateur scientists alike. These stations come in two varieties (Fig-ure 4): a low- cost model designed only for observations like those performed during the Festival of Frequency Measurement, and the more powerful, software- defined radio TangerineSDR, a wideband receiver that can be reconfigured for a range of experiments. At the core of both is a single- board computer, which interfaces with a set of modular instruments (e.g., a magnetometer) and uploads data to a central database.
These stations are in the prototyping and testing stage, with plans to deploy a network of PSWSs in the next 3 years in time to record the upcoming 2024 solar eclipse across North America. As the Moon’s shadow travels across Earth’s surface, it will shield the radio stations below from solar extreme ultraviolet radiation, providing an excellent opportunity to collect baseline radio data. We hope to have the net-work up and running in time for Festival of Frequency Measurement 2024, and we invite hams to join in as volunteer scientists to help improve our understanding of Earth’s space environment.
AcknowledgmentsThis research is supported by National Science Foundation grants AGS- 2002278, AGS- 1932997, and AGS- 1932972. The authors thank all HamSCI collaborators, particularly those at the Tucson Amateur Packet Radio Association, MIT Haystack Observatory, the University of Scranton, the New Jersey Institute of Technology, and the Case Amateur Radio Club (W8EDU).
ReferencesCollins, K., et al. (2021), Citizen scientists conduct distributed doppler measurement for ionospheric
remote sensing, IEEE Geosci. Remote Sens. Lett., https://doi.org/10.1109/LGRS.2021.3063361.
Frissell, N. A., et al. (2018), Modeling amateur radio soundings of the ionospheric response to the 2017 Great American Eclipse, Geophys. Res. Lett., 45(10), 4, 665– 4,674, https:// doi .org/ 10 .1029/ 2018GL077324.
Kazdan, D., et al. (2019), A low- cost HamSCI citizen science HF Doppler receiver for measuring iono-spheric variability, Abstract SA43C- 3213 presented at Fall Meeting 2019, AGU, San Francisco, Calif., 9– 13 Dec., https:// agu .confex .com/ agu/ fm19/ meetingapp .cgi/ Paper/602677.
Author InformationKristina Collins ([email protected]; call sign KD8OXT) and David Kazdan (AD8Y), Case Western Reserve University, Cleveland, Ohio; and Nathan-iel A. Frissell (W2NAF), University of Scranton, Scranton, Pa.
uRead the article at bit.ly/Eos-hamradio
Fig. 4. Low- cost personal space weather stations (PSWS) are designed primarily
for measurements of time standard stations, such as WWV and Canadian station
CHU. More powerful software- defined radio (SDR) PSWS systems can be reconfig-
ured for a range of experiments. Credit: Nathaniel Frissell

30 Eos // MAY 2021
Opp
osite
Pag
e: X
XX
XX
X; T
his
Page
: Top
Rig
ht: X
XX
X
30 Eos // MAY 2021
By Maciej K. Obryk, David L. George, and Ben B. Mirus
What do a backhoe, expanding foam, half- ton concrete blocks, and a 100- meter- long hillslope slide have in common? All were part of reviving the U.S. Geological Survey’s experimental debris flow flume.
The large-scale experimental USGS debris fl ow fl ume facility is a 95- by 2-meter-wide concrete channel perched
on a hill with a 31° hillslope. Flows (not shown) discharge onto a concrete run-out pad with a painted 1-meter grid
(foreground). Credit: USGS

Opp
osite
Pag
e: X
XX
XX
X; T
his
Page
: Top
Rig
ht: X
XX
XO
ppos
ite P
age:
XX
XX
XX
; Thi
s Pa
ge: T
op R
ight
: XX
XX

Studying the physics of land-slide initiation and the dynamics of debris flows is challenging, as these phe-nomena occur sponta-neously, commonly in remote locations, and usu-ally during inclement weather. Those who do this work trudge into the muck not only because the unpre-
dictable natures of natural slope failures and landslide runouts are scientifically interest-ing in their own right but also because illu-minating these phenomena can help in hazard mitigation efforts.
Field monitoring of landslide sites plays a big role in helping us understand these haz-ards, and so do reliable data obtained from repeatable experiments. These crucial data
are used in validating landslide models and in understanding the underlying physics of landslide phenomena, and they can be col-lected only in controlled settings.
Rarely do scientists studying landslide hazards have opportunities to do experi-ments. Luckily, as the new keepers of the U.S. Geological Survey (USGS) debris flow flume, we have just such an experimental facility with which to play. After taking over a couple of years ago, we set out to continue the facility’s legacy of revealing new details about landslide processes. Our inaugural experimental plan, however, was perhaps foolishly ambitious and led to har-rowing near misses with enormous con-crete blocks and frequent battles with a crotchety backhoe.
But our persistence paid off and rewarded us with a wealth of data to help in model
validation and in improving our knowledge of debris flow and water interactions and dam breach processes.
This past year, between the ongoing pan-demic and the wildfires that raged across Oregon (coming within half a kilometer of the flume), the survival of the flume and its surrounding facilities was in question. Thanks to courageous work by firefighters in fending off the Holiday Farm Fire in Sep-tember and October, it lives on. Our work there is on hold for the time being, but when conditions improve, the flume will be ready for its next set of experiments—and to continue producing valuable data and insights.
A New Day for the FlumeThree decades ago, Richard Iverson of USGS proposed turning an Oregon mountainside near Blue River in the Western Cascades into a large- scale experimental facility. Through collaboration between USGS and the U.S. Forest Service, this dream was real-ized, and the debris flow flume was con-structed in 1991 and used beginning in 1992 [Iverson et al., 1992; Iverson, 2020].
Located in the 6, 500- hectare H.J. Andrews Experimental Forest, the USGS flume is a 95- meter- long, 2- meter- wide concrete channel perched on a 31° hillslope: Picture the last steep descent on an amuse-ment park log flume ride. With a hopper at the top and extensive instrumentation along its course, this steep channel flattens into a 26- meter- long, 2° depositional runout pad at the bottom of the hill—like the splash zone at the bottom of the log flume.
For many decades, the flume was instru-mental in revealing elusive physical princi-ples underlying debris flow mobilization and runout [e.g., Iverson, 1997; Iverson et al., 1997, 2000, 2010, 2011; Johnson et al., 2012]. Video recordings of the 163 experiments conducted there from 1992 to 2017 are view-able online [see Logan et al., 2018].
Despite the recent retirements of Iverson, the flume’s scientific captain, as well as of instrumentation wizard Richard LaHusen and operational guru Matthew Logan, the flume perseveres. And exciting research continues, such as work exploring alterna-tive methods for debris flow detection like using seismic data to measure basal stresses or off- the- shelf 4K video cameras to deter-mine 3D surface deformation [Allstadt et al., 2020; Rapstine et al., 2020]. We officially took over in November 2018, but the transi-tion of leadership was gradual, allowing us
WE DESIGNED A PROJECT INVOLVING DEBRIS FLOWS HITTING A POOL OF WATER AT THE BASE OF THE FLUME AND GENERATING WAVES THAT OVERTOP AN EARTHEN DAMLIKE HOW A LANDSLIDE MIGHT PRODUCE A TSUNAMI.
Studying the physics of land-slide initiation and the dynamics of debris flows is challenging, as these phe-nomena occur sponta-neously, commonly in remote locations, and usu-ally during inclement weather. Those who do this work trudge into the muck not only because the unpre-
dictable natures of natural slope failures and landslide runouts are scientifically interest-
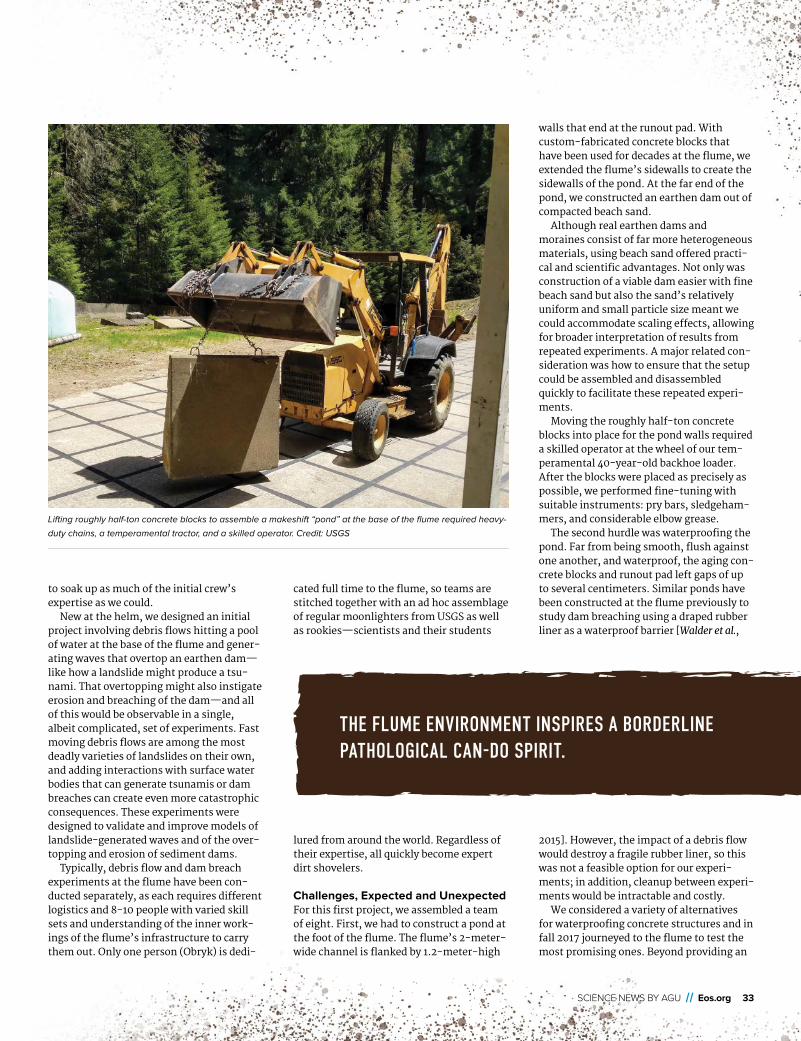
SCIENCE NEWS BY AGU // Eos.org 33
to soak up as much of the initial crew’s expertise as we could.
New at the helm, we designed an initial project involving debris flows hitting a pool of water at the base of the flume and gener-ating waves that overtop an earthen dam—like how a landslide might produce a tsu-nami. That overtopping might also instigate erosion and breaching of the dam—and all of this would be observable in a single, albeit complicated, set of experiments. Fast moving debris flows are among the most deadly varieties of landslides on their own, and adding interactions with surface water bodies that can generate tsunamis or dam breaches can create even more catastrophic consequences. These experiments were designed to validate and improve models of landslide- generated waves and of the over-topping and erosion of sediment dams.
Typically, debris flow and dam breach experiments at the flume have been con-ducted separately, as each requires different logistics and 8- 10 people with varied skill sets and understanding of the inner work-ings of the flume’s infrastructure to carry them out. Only one person (Obryk) is dedi-
cated full time to the flume, so teams are stitched together with an ad hoc assemblage of regular moonlighters from USGS as well as rookies—scientists and their students
lured from around the world. Regardless of their expertise, all quickly become expert dirt shovelers.
Challenges, Expected and UnexpectedFor this first project, we assembled a team of eight. First, we had to construct a pond at the foot of the flume. The flume’s 2- meter- wide channel is flanked by 1. 2- meter- high
walls that end at the runout pad. With custom- fabricated concrete blocks that have been used for decades at the flume, we extended the flume’s sidewalls to create the sidewalls of the pond. At the far end of the pond, we constructed an earthen dam out of compacted beach sand.
Although real earthen dams and moraines consist of far more heterogeneous materials, using beach sand offered practi-cal and scientific advantages. Not only was construction of a viable dam easier with fine beach sand but also the sand’s relatively uniform and small particle size meant we could accommodate scaling effects, allowing for broader interpretation of results from repeated experiments. A major related con-sideration was how to ensure that the setup could be assembled and disassembled quickly to facilitate these repeated experi-ments.
Moving the roughly half- ton concrete blocks into place for the pond walls required a skilled operator at the wheel of our tem-peramental 40- year- old backhoe loader. After the blocks were placed as precisely as possible, we performed fine- tuning with suitable instruments: pry bars, sledgeham-mers, and considerable elbow grease.
The second hurdle was waterproofing the pond. Far from being smooth, flush against one another, and waterproof, the aging con-crete blocks and runout pad left gaps of up to several centimeters. Similar ponds have been constructed at the flume previously to study dam breaching using a draped rubber liner as a waterproof barrier [Walder et al.,
2015]. However, the impact of a debris flow would destroy a fragile rubber liner, so this was not a feasible option for our experi-ments; in addition, cleanup between experi-ments would be intractable and costly.
We considered a variety of alternatives for waterproofing concrete structures and in fall 2017 journeyed to the flume to test the most promising ones. Beyond providing an
Lifting roughly half- ton concrete blocks to assemble a makeshift “pond” at the base of the fl ume required heavy-
duty chains, a temperamental tractor, and a skilled operator. Credit: USGS
THE FLUME ENVIRONMENT INSPIRES A BORDERLINE PATHOLOGICAL CAN DO SPIRIT.

34 Eos // MAY 2021
affordable, durable, and completely water-proof seal, we needed the application to be easy, again, to facilitate rapid assembly and disassembly of the pond for cleaning between experiments. Equipped with a col-lection of commercial samples, we assem-bled a scaled- down version of the pond and began side- by- side waterproofing tests. Four products we tested failed, but com-mercial expandable foam showed promise, despite leaking a little.
The following spring (2018), we arrived at the flume full of optimism, ready to test a full- scale pond with this commercial- grade foam. We sealed and filled the pond and could hardly believe our eyes. There was not a single leak—it was as tight as a drum.
Disassembling the pond sidewalls proved to be more exciting than we had hoped. We planned to lift each concrete block with our backhoe, figuring that the grip of the foam would succumb to gravity and to the back-hoe’s hydraulic power. For the most part, this worked; on a few occasions it did not. While lifting a block at one point, an adja-cent half- ton block came along for the ride, attached solely by the foam! The foam’s strength was impressive and unexpected, and it boosted confidence in our water-proofing efforts. Yet the swinging block was a dangerous surprise, especially for team members standing nearby. Putting safety first, we modified the disassembly protocol by precutting the foam.
Going with the FlowWith a sense of accomplishment and pride, we began planning further proof- of- concept experiments for that summer. We still had to figure out appropriate scaling that would allow us to observe the phenom-ena as we intended. The inclination of the runout pad and the length of the pond dic-tate the water height at the flume’s mouth: the longer the pond, the lower the water level. Predicting how debris flows and water interact is complex, and the dynamics depend on the water height and the flow entry angle. So we ran three simplified experiments, the first without a dam and the next two with an earthen dam at the far end, and adjusted the pond size and water levels based on our observations. With les-sons learned, we scheduled our next experi-ments for spring 2019 to focus on how we would acquire and reproduce data.
After nearly 2 years of planning and tri-als, we were ready for one of the most novel and complex investigations at the flume yet.
We acquired and tested sonic sensors for wave height detection, deployed a depth camera and worked out a photogrammetry setup to capture the sequence of events in 3D, and ordered nearly 40 cubic meters of sediment for debris flows and dams. Our team of scientific and technical recruits from Washington, Oregon, and Colorado assembled at the flume, ready to begin.
There was only one problem.A week before the experiments, with sev-
eral of us at the flume to get a head start on the setup, the trusty, rusty backhoe—our most essential tool—died. No lights, no beeping, no diesel fumes. Without a tractor mechanic available on short order nearby, we found a rental. However, we soon dis-
covered that whereas our ancient backhoe had made light work of hauling big concrete blocks and vast amounts of dirt, these tasks proved far too much for the younger, less rusty rental unit.
Dread came over us because we feared the flume season was doomed. Rescheduling experiments is not trivial, and lodging and personnel availability are limited. But the flume environment inspires a borderline pathological can- do spirit. Our group of highly trained scientists and technicians, now a ragtag team of novice tractor mechanics, pressed on. After hours of frus-tration and thwarted efforts, the tractor begrudgingly succumbed to our pleas and came back to life.
Continuing a LegacyWith the backhoe back in action and the new flume setup planned and assembled, our experiments over the next 2 weeks proved successful. (The tractor died again on the last day of experiments after the final
OUR INAUGURAL EXPERIMENTAL PLAN WAS PERHAPS FOOLISHLY AMBITIOUS AND LED TO HARROWING NEAR MISSES WITH ENORMOUS CONCRETE BLOCKS AND FREQUENT BATTLES WITH A CROTCHETY BACKHOE.
During an experiment in early June 2019, the
earthen dam blocking the pond failed as a result of
a debris fl ow displacing the water in the pond and
generating a tsunami. Instrumentation used to docu-
ment the experiment included sonic sensors
(mounted on wooden crossbeams) for wave height
detection, a depth camera (mounted on an alumi-
num crossbeam) to capture dam erosion, pressure
plates (not visible at the base of the pond), and pore
pressure sensors throughout the dam (not visible).
Credit: USGS

cleanup was finished. What a trooper! It has since been serviced by a professional mechanic and is running great again.) In the end, we generated an exceptional data set that will allow us to study debris flow and water interactions, tsunami generation and propagation, dam overtopping and stability, and dam breach initiation.
Ultimately, novel insights into the phys-ics of damaging and deadly debris flows are the legacy of nearly 3 decades of debris flow research at the flume. As the flume’s new leaders, we aim to preserve its capabilities and continue studies of debris flow initia-tion and runout dynamics. We also see the potential for expanded investigations into related phenomena in the years ahead. Such studies could include testing new geophysi-cal tools for in situ and seismic debris flow detection, looking at water runoff and bed sediment entrainment, and studying inter-
actions between debris flows and bodies of water as well as ice- laden flows and the effects of wildfire—the latter of which has new urgency following 2020.
Through our first project, we came to realize that extending the flume’s legacy requires experience passed down from our predecessors and creativity to push flume experiments in new directions, as well as the dedication and persistence of all team members. It also didn’t hurt to have luck on our side to cajole rusty old equipment to keep working and to spare the flume from wildfire.
ReferencesAllstadt, K. E., et al. (2020), Measuring basal force fl uctuations
of debris fl ows using seismic recordings and empirical Green’s functions, J. Geophys. Res. Earth Surf., 125(9), e2020JF005590, https:// doi .org/ 10 .1029/ 2020JF005590.
Iverson, R. M. (1997), The physics of debris fl ows, Rev. Geophys., 35(3), 245– 296, https:// doi .org/ 10 .1029/ 97RG00426.
Iverson, R. M. (2020), Landslide disparities, fl ume discov-eries, and Oso despair, Perspect. Earth Space Sci., 1(1), e2019CN000117, https:// doi .org/ 10 .1029/ 2019CN000117.
Iverson, R. M., J. E. Costa, and R. G. LaHusen (1992), Debris- fl ow fl ume at H.J. Andrews Experimental Forest, Oregon, U.S. Geol. Surv. Open- File Rep. 92- 483, 2 pp., https:// doi .org/ 10 .3133/ ofr92483.
Iverson, R. M., M. E. Reid, and R. G. LaHusen (1997), Debris- fl ow mobilization from landslides, Annu. Rev. Earth Planet. Sci., 25, 85– 138, https:// doi .org/ 10 .1146/ annurev .earth .25 .1 .85.
Iverson, R. M., et al. (2000), Acute sensitivity of landslide rates to initial soil porosity, Science, 290(5491), 513– 516, https:// doi .org/ 10 .1126/ science .290 .5491 .513.
Iverson, R. M., et al. (2010), The perfect debris fl ow? Aggre-gated results from 28 large- scale experiments, J. Geo-phys. Res. Earth Surf., 115(F3), F03005, https:// doi .org/ 10 .1029/ 2009JF001514.
Iverson, R. M., et al. (2011), Positive feedback and momentum growth during debris- fl ow entrainment of wet bed sediment, Nat. Geosci., 4(2), 116– 121, https:// doi .org/ 10 .1038/ ngeo1040.
Johnson, C. G., et al. (2012), Grain- size segregation and levee formation in geophysical mass fl ows, J. Geophys. Res. Earth Surf., 117(F1), F01032, https:// doi .org/ 10 .1029/ 2011JF002185.
Logan, M., R. M. Iverson, and M. K. Obryk (2018), Video documen-tation of experiments at the USGS debris- fl ow fl ume 1992– 2017 (version 1.4, January 2018), U.S. Geol. Surv. Open- File Rep. 2007- 1315, https:// doi .org/ 10 .3133/ ofr20071315.
Rapstine, T. D., et al. (2020), Reconstructing the velocity and deformation of a rapid landslide using multiview video, J. Geo-phys. Res. Earth Surf., 125(8), e2019JF005348, https:// doi .org/ 10.1029/ 2019JF005348.
Walder, J. S., et al. (2015), Controls on the breach geometry and fl ood hydrograph during overtopping of noncohesive earthen dams, Water Resour. Res., 51(8), 6, 701- 6,724, https:// doi .org/ 10.1002/ 2014WR016620.
Any use of trade, fi rm, or product names is for descriptive purposes only and does not imply endorsement by the U.S. government.
Author InformationMaciej K. Obryk (mobryk @usgs .gov) and David L. George, Cascades Volcano Observa-tory, U.S. Geological Survey, Vancouver, Wash.; and Ben B. Mirus, Geologic Hazards Science Center, U.S. Geological Survey, Golden, Colo.
uRead the article at bit.ly/Eos-debris-fl ow-experiments
The fi lled pond setup with an earthen dam at the far
end is seen in late May 2019 shortly before an
experimental debris fl ow was released. The fl ume is
heavily instrumented during experiments, including
with 4K video cameras and multiple digital still cam-
eras with synchronized shutter releases to enable
photogrammetry. Credit: USGS

ANOBSERVATIONAL GAP
AT THE EDGE OF SPACE
Ongoing climate change in Earth’s middle and upper atmosphere
will affect the rapidly expanding space and telecommunications sectors.
Maintaining observations of this region is more crucial than ever.
By Martin G. Mlynczak, Jia Yue, John McCormack, Ruth S. Liebermann, and Nathaniel J. Livesey
36 Eos // MAY 2021
The setting Sun illuminates the layers of Earth’s atmosphere in this view from the International Space Station. Credit: NASA

SCIENCE NEWS BY AGU // Eos.org 37

38 Eos // MAY 2021
he atmospheric borderland where the sky fades from blue to black is home to a host of satel-lites. This region, known as geospace, spans altitudes between about 45 and 1,000 kilometers
and contains the ionosphere, where high- energy geomagnetic storms can disrupt telecommunica-
tions and navigation technologies. Geospace is also sensitive to long- term effects of increasing atmospheric carbon dioxide (CO2 ). Thus, knowledge and understanding of the upper atmosphere are increas-ingly important for many scientific, societal, and commercial needs in our technological society.
In the past 40 years, many space- based observations have been made of the portion of geospace between 45 and 120 kilometers in altitude—that is, Earth’s mesosphere and lower thermosphere (MLT)—beginning in 1978 with NASA’s Limb Infrared Monitor of the Stratosphere (LIMS) instrument on the Nimbus 7 spacecraft [Gille and Russell, 1984] (Figure 1). The past 2 decades especially have seen a rev-olution in our understanding of the structure and composition of the MLT, largely as a result of these observations. A key example is the satellite data showing long- term cooling of the MLT because of increasing CO2 levels [Garcia et al., 2019], which confirms a funda-mental prediction of climate change theory [Roble and Dickinson, 1989; Solomon et al., 2019, and references therein].
But at present, no new satellite missions or instruments are planned or under development to extend the con-siderable data records collected by past and current missions. This lack threatens the continuity of space- based observations of the MLT. Here we discuss how this situation could affect vital science and societal applications and intro-duce considerations to help develop an observing architecture capable of sustaining high- quality MLT data.
A Looming, Long-Term GapSince 2001, numerous international mis-sions have observed the MLT, six of which are still operating. These include four NASA- led missions—Thermosphere, Ionosphere, Meso-sphere Energetics and Dynamics (TIMED; launched in 2001); Aura (2004); Aeronomy of Ice in the Meso-sphere (AIM; 2007); and the Ionospheric Connection Explorer (ICON; 2019)—as well as the Canadian Atmospheric Chemistry Experiment (ACE)/SciSat mission (2004) and the Swedish- led Odin satellite (2001).
Observations from these missions, including data on temperature and chemical composition, have led to remarkable growth in our knowledge of Earth’s MLT. The TIMED mission alone has produced nearly 2,700 peer- reviewed publications worldwide. In addition to informing our understanding of past and ongoing long- term change in the region, these data have become vital for the development of next- generation whole- atmosphere prediction systems for space weather applications [e.g., McCormack et al., 2017; Pedatella et al., 2019]. The data have also contributed to significant advances in mod-eling the effects of surface weather on the MLT [Sassi et al., 2018].
Three of the four ongoing NASA missions are well past their design lifetimes—for example, TIMED, originally designed as a 2- year mis-sion, is now in its twentieth year. The fourth, ICON, was launched in October 2019 on a 2- year baseline mission to explore sources of vari-ability in the ionosphere. Development of the other active missions
began in the late 1980s and early 1990s, and some are now approach-ing 20 years of on- orbit operations.
The new Mesospheric Airglow/Aerosol Tomography and Spectros-copy (MATS) microsatellite instrument, slated to launch in 2021, will make observations of the MLT with an anticipated 2- year lifetime. The observational timelines of ICON and MATS will overlap existing sensors, and these spacecraft should provide exceptional science returns. However, they are unlikely to significantly extend the cur-rent record of MLT observations. Future missions such as the Euro-pean Space Agency’s Atmospheric Limb Tracker for the Investigation of the Upcoming Stratosphere (ALTIUS), Sweden’s Stratospheric Inferred Winds (SIW), and current and future Ozone Mapping and Profiler Suite instruments flying aboard NOAA satellites do not regu-larly and comprehensively observe the MLT.
Thus, considering the time required to advocate, propose, and develop new satellite missions, a long- term gap in the current set of observations of the MLT seems virtually certain.
Forecast: Continued Cooling with a Chance of DebrisClimate change is almost exclusively thought of as comprising the long- term changes to and warming of the very lowest regions of Earth’s atmosphere, associated with increasing concentrations of CO2 and other greenhouse gases. However, effects of CO2 are manifest
throughout the entire perceptible atmosphere. For example, all available evidence suggests that the MLT has cooled because of rising CO2, and ongo-
ing cooling of the MLT is predicted to significantly reduce density at altitudes where low- Earth-
orbiting satellites fly (about 400- 1,000 kilo-meters) [Roble and Dickinson, 1989]. Evidence for this effect on density already exists [Emmert, 2015].
Above 120 kilometers in altitude in the thermosphere, long- term changes associ-ated with increasing CO2 are largely driven
by physical processes in the “heat sink region” of the MLT between 85 and 125 kilo-
meters in altitude, where radiative cooling by CO2 dominates [Mlynczak et al., 2018]. Thermal
energy at higher altitudes in the thermosphere is naturally transported downward by heat conduction
and is ultimately radiated by CO2 in the heat sink region. As the amount of CO2 increases, more energy from the upper
thermosphere can thus be transported down and radiated from the heat sink, resulting in cooling and decreased density both in the MLT and in the upper thermosphere, the latter stretching from about 120 kilometers up to the edge of space.
The observed rate of CO2 increase in the MLT is the same as it is in the troposphere [Rezac et al., 2018], and as the rate of increase there is accelerating, we expect the rate of cooling and density change in the MLT and in geospace to increase in the mid- 21st century. This sce-nario will increase the orbital lifetime of satellites—and space debris—which could amplify hazards to all low- Earth- orbiting space assets.
Furthermore, besides CO2 and water vapor [Yue et al., 2019], minor chemical species in the MLT such as atomic oxygen, hydroxyl mole-cules, ozone, and atomic hydrogen are also critical components of the energetics of the region [Mlynczak and Solomon, 1993]. Yet we know lit-tle about how concentrations of these species are changing. Along with limited understanding of associated changes in atmospheric dynamics,
T
A long- term gap in the current set of observations
of the mesosphere and lower thermosphere (MLT)
seems virtually certain.

SCIENCE NEWS BY AGU // Eos.org 39
this lack of knowledge complicates the task of predicting the MLT over the long term. Continuous monitoring of the MLT is essential to quan-tify its chemical composition, disentangle different mechanisms at play, and understand how these mechanisms influence decreasing air density and aerodynamic drag in the upper thermosphere.
With envisioned fleets of tens of thousands of satellites—provid-ing, for example, global wireless Internet—space traffic and longer- lived space debris will become increasingly important issues in space policy, space law, and the business of space insurance underwriting. An observationally verified capability to predict long- term change in and above the MLT appears to be essential.
Essential Considerations to Ensure ContinuityThe key to understanding long- term change in the MLT and the envi-rons above is the ability to reliably separate changes and trends due to increasing CO2 in the MLT from the natural variability of the atmo-sphere, such as that driven by the 11- year solar cycle. To do this, we need at least three—and likely four—solar cycles of continuous and accurately calibrated data.
The current continuous missions have observed nearly two cycles, so achieving the needed time series will likely require several succes-sive instruments to follow the ones presently in orbit. We anticipate that future sensors designed to monitor the MLT will be smaller and require lower- cost satellite architectures with life spans much shorter than those of Aura and TIMED. But several questions must be addressed to devise a sustainable, long- term observing system (these will be discussed in detail in a future technical publication):
}} What effect will a gap in the current record have on our ability to understand trends in the MLT and above?
}} What is the required absolute accuracy of measurements from a new observing system to enable their accurate fusion with prior data sets?
}} What spatial and temporal sampling requirements are needed to detect trends confidently in the data, considering the natural variabil-ity in the MLT and anticipated measurement uncertainties?
}} What is the required calibration stability of instruments in a new system to ensure that changes in an instrument are not falsely inter-preted as atmospheric changes?
Fig. 1. This timeline shows satellite missions that have collected observations of the terrestrial mesosphere and lower thermosphere (MLT). The Odin, Thermosphere, Iono-
sphere, Mesosphere Energetics and Dynamics (TIMED), Atmospheric Chemistry Experiment (ACE), and Aeronomy of Ice in the Mesosphere (AIM) missions are all still opera-
tional, but at ages ranging from 13–20 years, they are well beyond their nominal design lifetimes. Ionospheric Connection Explorer (ICON) launched in 2019, with a 2- year
baseline mission; Mesospheric Airglow/Aerosol Tomography and Spectroscopy (MATS) is scheduled to launch in 2021, also on a 2- year mission. As no missions are planned
or in development beyond these, a long- term gap in observations of the MLT is almost certain to occur in the next 3– 5 years. CRISTA = Cryogenic Infrared Spectrometers
and Telescopes for the Atmosphere; SME = Solar Mesosphere Explorer; SNOE = Student Nitric Oxide Explorer; UARS = Upper Atmosphere Research Satellite. Credit: NASA
Langley Research Center

40 Eos // MAY 2021
}} What is the required stability of data processing algorithms and their inputs (i.e., spectral line parameters) from one mission to the next to reduce biases between successive data sets?
}} What orbital stability is required over the lifetime of individual missions to avoid false trends in the data?
The experience of the tropospheric cli-mate research community indicates that for long- term trend detection, temporal and spatial sampling requirements and some instrument performance metrics may be sub-stantially relaxed in comparison with those metrics for short- term “process” missions, which require a higher density of observations. However, much higher calibration accuracy is likely required for long- term missions to reduce small system-atic measurement errors [Wielicki et al., 2013], and gaps in the observation record hinder and may preclude the ability to tie succes-sive data sets together with confidence [Loeb et al., 2009].
Mind the GapIncreasing atmospheric CO2 is driving dramatic changes in Earth’s mesosphere and lower thermosphere that are documented in data sets approaching 2 decades in length. But scientists are just now beginning to grasp the extent of these changes, using observations from aging satellites with no identified successors. Current satellite missions are almost certain to end in the next 3- 5 years, leaving an impending gap in future observations of unknown length.
The physics of the MLT govern changes at higher altitudes in geo-space, up to the edge of space—changes that will ultimately influence space policy and space law regarding regulation of orbital debris and that may factor into underwriting future satellite insurance policies. Long- term, continuous observation of the MLT is essential for these critical scientific and societal issues.
We recommend that NASA and the National Science Foundation commission a geospace- focused continuity study that addresses the
science requirements and architecture consider-ations described above and recommends possible
implementation solutions and agencies. This report would ideally be available as input for
the next heliophysics decadal survey, which is anticipated in the 2023 time frame.
Long- term changes in geospace are now occurring and will continue to alter the geo-space environment for at least the next cen-tury. We are approaching the end of a dra-
matic era in the observation of Earth’s upper atmosphere, but we are only beginning to
understand this critical region.
AcknowledgmentsM.G.M., R.S.L., and J.Y. acknowledge ongoing support
from the NASA Heliophysics Division. Work at the Jet Propulsion Laboratory, California Institute of Technology, was
performed under contract with NASA. J.M. acknowledges support from the U.S. Naval Research Laboratory.
ReferencesEmmert, J. T. (2015), Altitude and solar activity dependence of 1967– 2005 thermospheric density
trends derived from orbital drag, J. Geophys. Res. Space Phys., 120, 2, 940– 2,950, https:// doi .org/ 10 .1002/ 2015JA021047.
Garcia, R. R., J. Yue, and J. M. Russell III (2019), Middle atmosphere temperature trends in the twentieth and twenty-first centuries simulated with the Whole Atmosphere Community Climate Model (WACCM), J. Geophys. Res. Space Phys., 124, 7, 984– 7,993, https:// doi .org/ 10 .1029/ 2019JA026909.
Gille, J. C., and J. M. Russell (1984), The Limb Infrared Monitor of the Stratosphere: Experiment description, performance, and results, J. Geophys. Res., 89, 5, 125– 5,140, https:// doi .org/ 10 .1029/ JD089iD04p05125.
Loeb, N. G., et al. (2009), Impact of data gaps on satellite broadband radiation records, J. Geophys. Res., 114, D11109, https:// doi .org/ 10 .1029/ 2008JD011183.
McCormack, J., et al. (2017), Comparison of mesospheric winds from a high- altitude meteorological analysis system and meteor radar observations during the boreal winters of 2009– 2010 and 2012– 2013, J. Atmos Sol. Terr. Phys., 154, 132– 166, https:// doi .org/ 10 .1016/ j.jastp .2016 .12 .007.
Mlynczak, M. G., and S. Solomon (1993), A detailed evaluation of the heating efficiency in the middle atmosphere, J. Geophys. Res., 98, 10, 517- 10,541, https:// doi .org/ 10 .1029/ 93JD00315.
Mlynczak, M. G., et al. (2018), Space- based sentinels for measurement of infrared cooling in the thermo-sphere for space weather nowcasting and forecasting, Space Weather, 16, 363– 375, https:// doi .org/ 10 .1002/ 2017SW001757.
Pedatella, N. M., et al. (2019), Error growth in the mesosphere and lower thermosphere based on hind-cast experiments in a whole atmosphere model, Space Weather, 17, 1, 442– 1,460, https:// doi .org/ 10 .1029/ 2019SW002221.
Rezac, L., et al. (2018), On long- term SABER CO2 trends and effects due to nonuniform space and time sampling, J. Geophys. Res. Space Phys., 123, 7, 958– 7,967, https:// doi .org/ 10 .1029/ 2018JA025892.
Roble, R. G., and R. E. Dickinson (1989), How will changes in carbon dioxide and methane modify the mean structure of the mesosphere and lower thermosphere?, Geophys. Res. Lett., 16, 1, 441– 1,444, https:// doi .org/ 10 .1029/ GL016i012p01441.
Sassi, F., et al. (2018), Simulations of the boreal winter upper mesosphere and lower thermosphere with meteorological specifications in SD- WACCM- X, J. Geophys. Res., 123, 3, 791– 3,811, https:// doi .org/ 10 .1002/ 2017JD027782.
Solomon, S. C., et al. (2019), Whole atmosphere climate change: Dependence on solar activity, J. Geo-phys. Res. Space Phys., 124, 3, 799– 3,809, https:// doi .org/ 10 .1029/ 2019JA026678.
Wielicki, B. A., et al. (2013), Achieving climate change absolute accuracy in orbit, Bull. Am. Meteorol. Soc., 94, 1, 519- 1,539, https:// doi .org/ 10 .1175/ BAMS- D- 12- 00149.1.
Yue, J., et al. (2019), Increasing water vapor in the stratosphere and mesosphere after 2002, Geophys. Res. Lett., 46, 13, 452- 13,460, https:// doi .org/ 10 .1029/ 2019GL084973.
Author InformationMartin G. Mlynczak ([email protected]), Science Directorate, NASA Langley Research Center, Hampton, Va.; Jia Yue, Catholic Univer-sity of America, Washington, D.C.; also at NASA Goddard Space Flight Center, Greenbelt, Md.; John McCormack, Space Science Division, Naval Research Laboratory, Washington, D.C.; Ruth S. Liebermann, NASA God-dard Space Flight Center, Greenbelt, Md.; and Nathaniel J. Livesey, Jet Propulsion Laboratory, California Institute of Technology, Pasadena
uRead the article at bit.ly/Eos-MLT-gap
Scientists are just now beginning to grasp the extent of ongoing changes in Earth’s MLT, using observations from
aging satellites with no identified successors.
Space Physics and Aeronomy collectionA new fi ve-volume set of books presents our latest understanding of the Sun and solar wind, magneto-spheres in the Solar system, ionospheric dynamics, Earth’s upper atmosphere, and the effects of space weather.
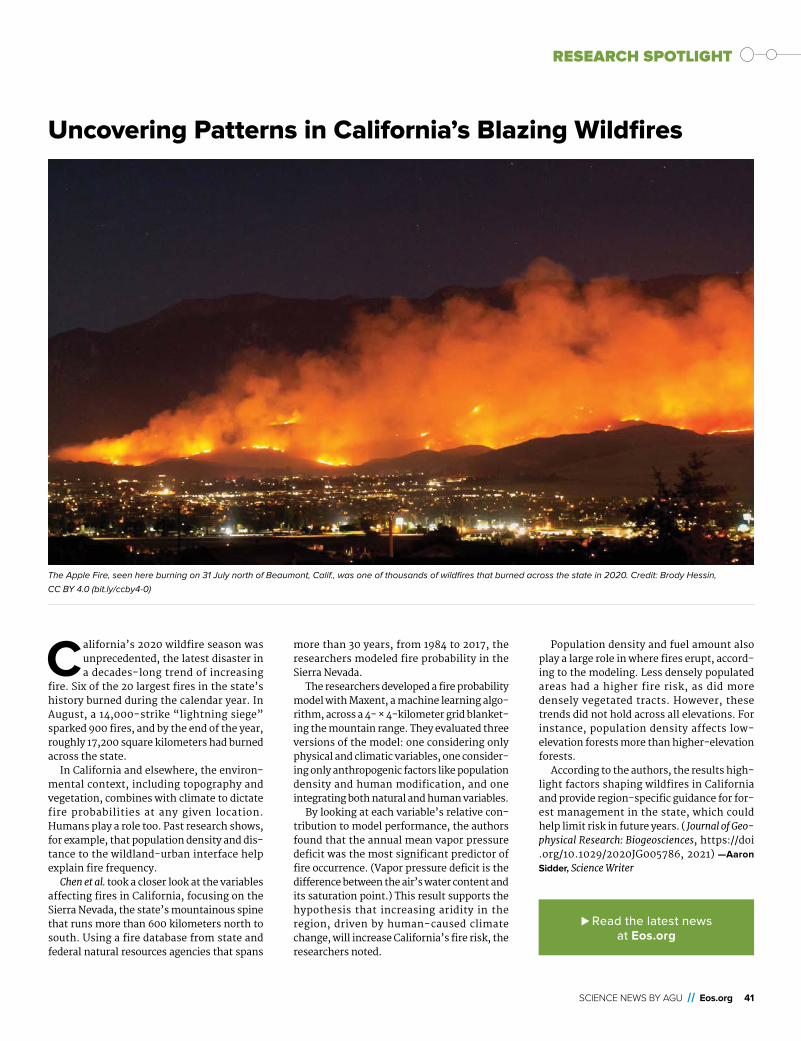
SCIENCE NEWS BY AGU // Eos.org 41
RESEARCH SPOTLIGHT
Uncovering Patterns in California’s Blazing Wildfires
California’s 2020 wildfire season was unprecedented, the latest disaster in a decades- long trend of increasing
fire. Six of the 20 largest fires in the state’s history burned during the calendar year. In August, a 14, 000- strike “lightning siege” sparked 900 fires, and by the end of the year, roughly 17,200 square kilometers had burned across the state.
In California and elsewhere, the environ-mental context, including topography and vegetation, combines with climate to dictate fire probabilities at any given location. Humans play a role too. Past research shows, for example, that population density and dis-tance to the wildland- urban interface help explain fire frequency.
Chen et al. took a closer look at the variables affecting fires in California, focusing on the Sierra Nevada, the state’s mountainous spine that runs more than 600 kilometers north to south. Using a fire database from state and federal natural resources agencies that spans
more than 30 years, from 1984 to 2017, the researchers modeled fire probability in the Sierra Nevada.
The researchers developed a fire probability model with Maxent, a machine learning algo-rithm, across a 4- × 4- kilometer grid blanket-ing the mountain range. They evaluated three versions of the model: one considering only physical and climatic variables, one consider-ing only anthropogenic factors like population density and human modification, and one integrating both natural and human variables.
By looking at each variable’s relative con-tribution to model performance, the authors found that the annual mean vapor pressure deficit was the most significant predictor of fire occurrence. (Vapor pressure deficit is the difference between the air’s water content and its saturation point.) This result supports the hypothesis that increasing aridity in the region, driven by human- caused climate change, will increase California’s fire risk, the researchers noted.
Population density and fuel amount also play a large role in where fires erupt, accord-ing to the modeling. Less densely populated areas had a higher fire risk, as did more densely vegetated tracts. However, these trends did not hold across all elevations. For instance, population density affects low- elevation forests more than higher- elevation forests.
According to the authors, the results high-light factors shaping wildfires in California and provide region- specific guidance for for-est management in the state, which could help limit risk in future years. ( Journal of Geo-physical Research: Biogeosciences, https:// doi .org/ 10 .1029/ 2020JG005786, 2021) —Aaron Sidder, Science Writer
The Apple Fire, seen here burning on 31 July north of Beaumont, Calif., was one of thousands of wildfires that burned across the state in 2020. Credit: Brody Hessin,
CC BY 4.0 (bit .ly/ ccby4- 0)
uRead the latest news at Eos.org
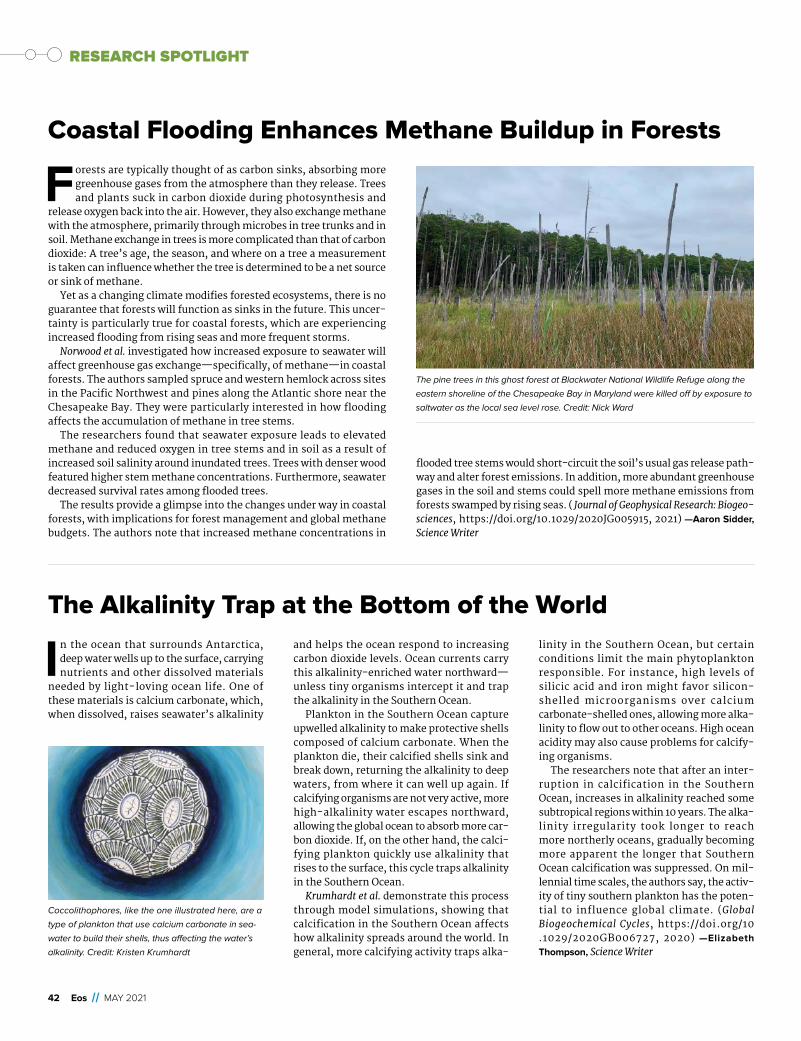
42 Eos // MAY 2021
RESEARCH SPOTLIGHT
Coastal Flooding Enhances Methane Buildup in Forests
Forests are typically thought of as carbon sinks, absorbing more greenhouse gases from the atmosphere than they release. Trees and plants suck in carbon dioxide during photosynthesis and
release oxygen back into the air. However, they also exchange methane with the atmosphere, primarily through microbes in tree trunks and in soil. Methane exchange in trees is more complicated than that of carbon dioxide: A tree’s age, the season, and where on a tree a measurement is taken can influence whether the tree is determined to be a net source or sink of methane.
Yet as a changing climate modifies forested ecosystems, there is no guarantee that forests will function as sinks in the future. This uncer-tainty is particularly true for coastal forests, which are experiencing increased flooding from rising seas and more frequent storms.
Norwood et al. investigated how increased exposure to seawater will affect greenhouse gas exchange—specifically, of methane—in coastal forests. The authors sampled spruce and western hemlock across sites in the Pacific Northwest and pines along the Atlantic shore near the Chesapeake Bay. They were particularly interested in how flooding affects the accumulation of methane in tree stems.
The researchers found that seawater exposure leads to elevated methane and reduced oxygen in tree stems and in soil as a result of increased soil salinity around inundated trees. Trees with denser wood featured higher stem methane concentrations. Furthermore, seawater decreased survival rates among flooded trees.
The results provide a glimpse into the changes under way in coastal forests, with implications for forest management and global methane budgets. The authors note that increased methane concentrations in
flooded tree stems would short- circuit the soil’s usual gas release path-way and alter forest emissions. In addition, more abundant greenhouse gases in the soil and stems could spell more methane emissions from forests swamped by rising seas. ( Journal of Geophysical Research: Biogeo-sciences, https:// doi.org/ 10 .1029/ 2020JG005915, 2021) —Aaron Sidder, Science Writer
The Alkalinity Trap at the Bottom of the World
In the ocean that surrounds Antarctica, deep water wells up to the surface, carrying nutrients and other dissolved materials
needed by light- loving ocean life. One of these materials is calcium carbonate, which, when dissolved, raises seawater’s alkalinity
and helps the ocean respond to increasing carbon dioxide levels. Ocean currents carry this alkalinity- enriched water northward—unless tiny organisms intercept it and trap the alkalinity in the Southern Ocean.
Plankton in the Southern Ocean capture upwelled alkalinity to make protective shells composed of calcium carbonate. When the plankton die, their calcified shells sink and break down, returning the alkalinity to deep waters, from where it can well up again. If calcifying organisms are not very active, more high- alkalinity water escapes northward, allowing the global ocean to absorb more car-bon dioxide. If, on the other hand, the calci-fying plankton quickly use alkalinity that rises to the surface, this cycle traps alkalinity in the Southern Ocean.
Krumhardt et al. demonstrate this process through model simulations, showing that calcification in the Southern Ocean affects how alkalinity spreads around the world. In general, more calcifying activity traps alka-
linity in the Southern Ocean, but certain conditions limit the main phytoplankton responsible. For instance, high levels of silicic acid and iron might favor silicon- shelled microorganisms over calcium carbonate- shelled ones, allowing more alka-linity to flow out to other oceans. High ocean acidity may also cause problems for calcify-ing organisms.
The researchers note that after an inter-ruption in calcification in the Southern Ocean, increases in alkalinity reached some subtropical regions within 10 years. The alka-linity irregularity took longer to reach more northerly oceans, gradually becoming more apparent the longer that Southern Ocean calcification was suppressed. On mil-lennial time scales, the authors say, the activ-ity of tiny southern plankton has the poten-tial to influence global climate. (Global Biogeochemical Cycles, https:// doi .org/ 10 .1029/ 2020GB006727, 2020) —Elizabeth Thompson, Science Writer
The pine trees in this ghost forest at Blackwater National Wildlife Refuge along the
eastern shoreline of the Chesapeake Bay in Maryland were killed off by exposure to
saltwater as the local sea level rose. Credit: Nick Ward
Coccolithophores, like the one illustrated here, are a
type of plankton that use calcium carbonate in sea-
water to build their shells, thus affecting the water’s
alkalinity. Credit: Kristen Krumhardt
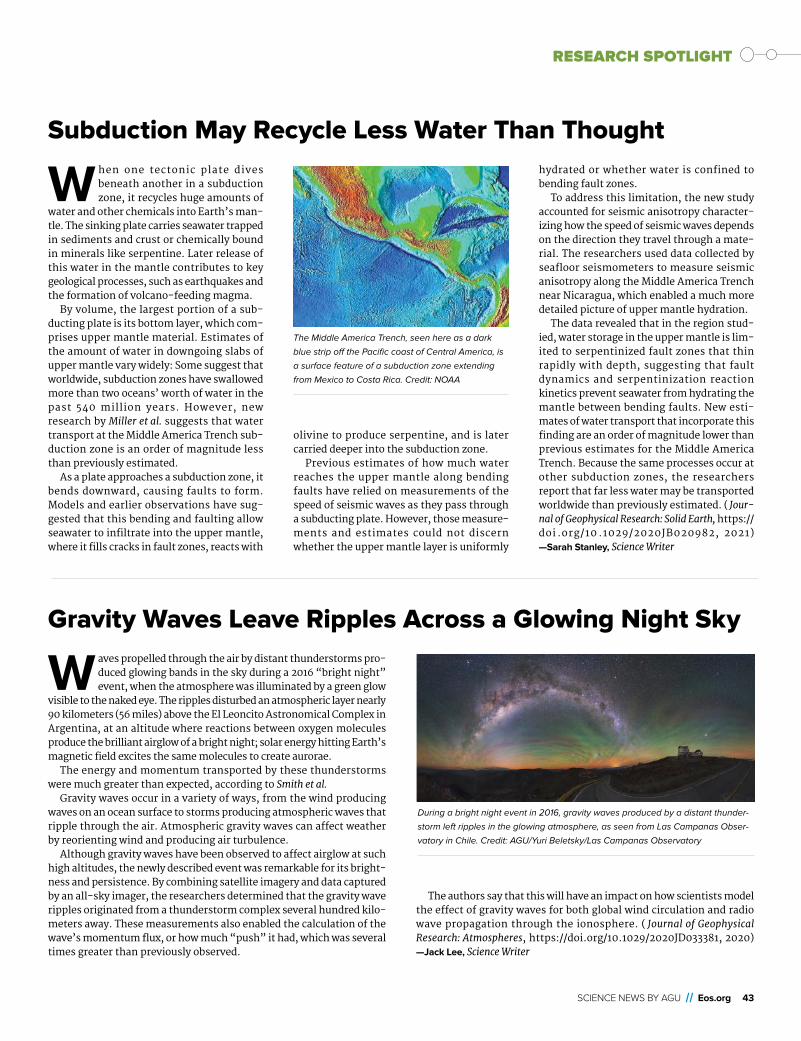
SCIENCE NEWS BY AGU // Eos.org 43
RESEARCH SPOTLIGHT
Subduction May Recycle Less Water Than Thought
W hen one tectonic plate dives beneath another in a subduction zone, it recycles huge amounts of
water and other chemicals into Earth’s man-tle. The sinking plate carries seawater trapped in sediments and crust or chemically bound in minerals like serpentine. Later release of this water in the mantle contributes to key geological processes, such as earthquakes and the formation of volcano- feeding magma.
By volume, the largest portion of a sub-ducting plate is its bottom layer, which com-prises upper mantle material. Estimates of the amount of water in downgoing slabs of upper mantle vary widely: Some suggest that worldwide, subduction zones have swallowed more than two oceans’ worth of water in the past 540 million years. However, new research by Miller et al. suggests that water transport at the Middle America Trench sub-duction zone is an order of magnitude less than previously estimated.
As a plate approaches a subduction zone, it bends downward, causing faults to form. Models and earlier observations have sug-gested that this bending and faulting allow seawater to infiltrate into the upper mantle, where it fills cracks in fault zones, reacts with
olivine to produce serpentine, and is later carried deeper into the subduction zone.
Previous estimates of how much water reaches the upper mantle along bending faults have relied on measurements of the speed of seismic waves as they pass through a subducting plate. However, those measure-ments and estimates could not discern whether the upper mantle layer is uniformly
hydrated or whether water is confined to bending fault zones.
To address this limitation, the new study accounted for seismic anisotropy character-izing how the speed of seismic waves depends on the direction they travel through a mate-rial. The researchers used data collected by seafloor seismometers to measure seismic anisotropy along the Middle America Trench near Nicaragua, which enabled a much more detailed picture of upper mantle hydration.
The data revealed that in the region stud-ied, water storage in the upper mantle is lim-ited to serpentinized fault zones that thin rapidly with depth, suggesting that fault dynamics and serpentinization reaction kinetics prevent seawater from hydrating the mantle between bending faults. New esti-mates of water transport that incorporate this finding are an order of magnitude lower than previous estimates for the Middle America Trench. Because the same processes occur at other subduction zones, the researchers report that far less water may be transported worldwide than previously estimated. ( Jour-nal of Geophysical Research: Solid Earth, https:// doi .org/ 10 .1029/ 2020JB020982, 2021) —Sarah Stanley, Science Writer
The Middle America Trench, seen here as a dark
blue strip off the Pacific coast of Central America, is
a surface feature of a subduction zone extending
from Mexico to Costa Rica. Credit: NOAA
Gravity Waves Leave Ripples Across a Glowing Night Sky
W aves propelled through the air by distant thunderstorms pro-duced glowing bands in the sky during a 2016 “bright night” event, when the atmosphere was illuminated by a green glow
visible to the naked eye. The ripples disturbed an atmospheric layer nearly 90 kilometers (56 miles) above the El Leoncito Astronomical Complex in Argentina, at an altitude where reactions between oxygen molecules produce the brilliant airglow of a bright night; solar energy hitting Earth’s magnetic field excites the same molecules to create aurorae.
The energy and momentum transported by these thunderstorms were much greater than expected, according to Smith et al.
Gravity waves occur in a variety of ways, from the wind producing waves on an ocean surface to storms producing atmospheric waves that ripple through the air. Atmospheric gravity waves can affect weather by reorienting wind and producing air turbulence.
Although gravity waves have been observed to affect airglow at such high altitudes, the newly described event was remarkable for its bright-ness and persistence. By combining satellite imagery and data captured by an all- sky imager, the researchers determined that the gravity wave ripples originated from a thunderstorm complex several hundred kilo-meters away. These measurements also enabled the calculation of the wave’s momentum flux, or how much “push” it had, which was several times greater than previously observed.
The authors say that this will have an impact on how scientists model the effect of gravity waves for both global wind circulation and radio wave propagation through the ionosphere. ( Journal of Geophysical Research: Atmospheres, https:// doi .org/ 10 .1029/2020JD033381, 2020) —Jack Lee, Science Writer
During a bright night event in 2016, gravity waves produced by a distant thunder-
storm left ripples in the glowing atmosphere, as seen from Las Campanas Obser-
vatory in Chile. Credit: AGU/Yuri Beletsky/Las Campanas Observatory

44 Eos // MAY 2021
Decoding the Age of the Ice at Mars’s North Pole
Mars’s north pole contains a large ice cap made up of many layers of frozen water. Like ice cores on Earth, those layers offer a tantalizing record of climate on Mars over the past
several million years. The first step in decoding that climate record is to figure out how those layers form and how old each one might be—a task difficult to perform from orbit.
In a new study, Wilcoski and Hayne used high- resolution surface topog-raphy data captured by the High Resolution Imaging Science Experiment (HiRISE) aboard the Mars Reconnaissance Orbiter to attempt to chart the evolution of the ice over time. The researchers looked at the roughness of the top layer of ice—which shows a variety of regular ripples and ridges of various sizes and shapes—and used the satellite imagery to validate a model that simulated interactions with the Martian polar climate and that reproduced the rough topography of the ice cap.
The model works by simulating how solar radiation can give rise to the ripples observed by the orbiter. It indicates that small bumps in the
ice’s surface tend to become exaggerated over time as insolation ablates the Sun- facing side of the bump but not the backside, creating a series of ridges and valleys that become more pronounced over time.
Once the model was able to replicate this behavior, the researchers used it to show that the resultant ripples should be about 10 meters across and 1 meter deep. As the features age, the wavelength—the dis-tance between each ripple—increases, and the ripples move toward the pole. This behavior held constant regardless of whether the researchers increased the atmospheric water vapor density or dialed it to zero, sug-gesting that the pattern forms regardless of whether the total amount of ice is increasing or decreasing.
If the new model is accurate, the surface roughness observed on the ice cap at Mars’s north pole should form in 1, 000- 10,000 years, the authors say, providing a starting point for understanding the climate history of the planet. ( Journal of Geophysical Research: Planets, https:// doi .org/ 10 .1029/ 2020JE006570, 2020) —David Shultz, Science Writer
Ice at the north pole of Mars is seen from orbit in this image captured by Mars Express in May 2014. Credit: ESA/DLR/FU Berlin/J. Cowart, CC BY- SA 3.0 IGO (bit .ly/
ccbysaigo3- 0)
RESEARCH SPOTLIGHT

SCIENCE NEWS BY AGU // Eos.org 45
RESEARCH SPOTLIGHT
SCIENCE NEWS BY AGU // Eos.org 45
Modeling Gravity Waves with Machine Learning
Gravity waves ripple outward from dis-turbances in the atmosphere, much like the ripples formed from tossing
a stone into a still pond. Researchers know that these waves play a critical role in global atmospheric circulation, moving momentum between different layers. But gravity waves are still not well understood. Their small spa-tial scale and the low resolution of most atmospheric models have historically made modeling the distribution and effects of grav-ity waves difficult.
In a new study, Matsuoka et al. sought to better define gravity wave parameterizations using machine learning. Gravity waves can be generated by a variety of disturbances, including convection, jet streams, and phys-ical barriers. The researchers focused on oro-graphic gravity waves, or those that radiate out from mountains, in a 1,000- square- kilometer area of the Hokkaido region of Japan. The team trained a convolutional neu-ral network to understand the relationship between conditions in the troposphere, such as temperature, humidity, and low-resolution horizontal wind, and high-resolution wind fluctuations in the lower stratosphere, using a 29-year atmospheric reanalysis data set.
The neural network estimated gravity wave structure, wave number, and the magnitude of the momentum flux. It was most accurate in winter, when gravity waves tend to be stronger. Although most previous models considered only vertical propagation of grav-ity waves, the researchers note that the deep learning strategy provides a computationally cost- effective way to evaluate horizontal propagation as well. (Geophysical Research Let-ters, https:// doi .org/ 10 .1029/ 2020GL089436, 2020) —Kate Wheeling, Science Writer
Himawari-8 satellite image of atmospheric gravity
waves above Japan. Credit: National Institute of
Information and Communications Technology
Evaluating Environmental Predictors of Western U.S. Wildfires
A s the western United States becomes hotter and drier, wildfires in the region are becoming more frequent
and severe. In addition to causing acute, local impacts on people and property, the fires can adversely affect the respiratory health of the millions of people who inhale tiny smoke particles that drift downwind. But what drives wildfire activity from year to year across this diverse region and how these factors could change in the future have been difficult to ascertain.
Now Brey et al. report results from a series of statistical analyses examining which envi-ronmental variables are likely to be the best predictors of future wildfire burn area, a met-ric that is proportional to the air quality impacts of smoke. The team first used Lasso regression to determine which combinations of environmental conditions best explained the variability in burn areas listed in the Mon-itoring Trends in Burn Severity database, which includes data for western U.S. wildfires larger than 404 hectares (1,000 acres) that occurred between 1984 and 2016. The researchers then used results from Phase 5 of the Coupled Model Intercomparison Project
(CMIP5) to estimate how future wildfire activ-ity could change in various ecoregions on the basis of these objectively selected environ-mental variables.
The results reveal that factors related to aridity and flammability, including relative humidity, precipitation, wind speed, and root zone soil moisture, can explain the historical variability in burn area as well as, or better than, vapor pressure deficit (VPD). But because VPD, a measure of aridity, is generally consid-ered the most important determinant of future wildfire activity, the team also found that using these other variables to predict future burn area yielded less certain results.
Collectively, the new findings show that predictions of wildfire activity in the western United States are very sensitive to which environmental predictors are used to control the burn area. The study results highlight the dominant role that aridity plays in these fore-casts, the authors say, and emphasize the importance of carefully selecting the envi-ronmental variables used to drive future change in climate models. (Earth’s Future, https:// doi .org/ 10 .1029/ 2020EF001645, 2021) —Terri Cook, Science Writer
Smoke billowing from the Cameron Peak Fire in the mountains west of Fort Collins, Colo., is seen here on
13 August 2020, soon after the fire began. Credit: Emily Fischer

46 Eos // MAY 2021
EDITORS' HIGHLIGHTS // AGU ADVANCES EDITORS PRESENT THE LATEST RESEARCH
Deep Decarbonization? Yes We Can!
Staying within the 1.5°C global warming limit established as the goal of member states of the Paris Agreement will require trans-formation of our economy to net- zero emissions by 2050, which
seems like an enormously ambitious goal. And yet, with new in- depth modeling analysis, Williams et al. illuminate several technologically and economically feasible pathways to this required deep decarbon-ization. All pathways require enhanced energy efficiency, decarbon-ized electricity, electrification, and carbon capture. Interestingly, a
modest role for natural gas in 2050 to ensure continuous reliability of electricity supplies is part of the least- cost pathway that still meets the emissions goals. Demonstrating the feasibility of these urgently needed transitions could not come at a more important time, as discussions on appropriate policy instruments to speed the journey to climate stabilization are front and center since the United States rejoined the Paris Agreement. (https:// doi .org/ 10/ 1029/ 2020AV000284, 2021) —Eric A. Davidson
Modeling Interactions Between Cities and Climate Across Scales
C ities now house more than half of humanity and consume the majority of energy resources. Urban areas alter
climate and atmospheric chemistry in ways that can be important at regional to global scales. However, processes influencing cli-mate, as well as the impacts of climate extremes, are often important at the scale of individual buildings. For example, in the
heat map of Sacramento, Calif. street- level variations in temperatures integrate a num-ber of causes and in turn influence local chemical reaction rates that affect climate and atmospheric chemistry at larger scales. In a Commentary, Sharma, et al. emphasize the need for urban- resolving climate models to assess the complex and multiple interac-tions across these spatial scales. They suggest strategies to move the field forward to pro-vide modeling needed for a range of applica-tions, including designing healthier and more sustainable city landscapes. (https:// doi .org/ 10 .1029/ 2020AV000271, 2021) —Susan Trumbore
uSign up for the AGU Advances digest:
agu.org/advances-digest
This Sankey diagram shows how each source of energy is converted to usable forms and finally consumed by end uses for the lowest- cost decarbonization scenario. Credit:
Williams et al., 2021
A snapshot of visible light (left) and thermal radia-
tion (right) shows surface temperature in Sacra-
mento. Surface temperatures vary on the scale of
individual building. Credit: NASA/Goddard Space
Flight Center

SCIENCE NEWS BY AGU // Eos.org 47
POSITIONS AVAILABLE
Atmospheric Sciences
Employer: Princeton UniversityPosition: Research Position on Pre-
cipitation TrendsLocation: Princeton, New Jersey
Modeling and Understanding the Observed Multidecadal to Century- Scale Trends at Regional- to- Global Scales
The Cooperative Institute for Mod-eling the Earth System (CIMES) at Princeton University, in cooperation with NOAA’s Geophysical Fluid Dynamics Laboratory (GFDL), seeks a postdoctoral or more senior scien-tist for research related to modeling and understanding the causes of observed multi- decadal to century- scale trends of precipitation at regional- to- global scales. A promi-nent issue with simulated precipita-tion in current climate models is the inability of the models to reproduce observed strong rising trends in pre-
cipitation since 1900 over middle and higher latitude land regions around the globe. The position will be focused specifically on improved understand-ing of the physical mechanisms responsible for biases in NOAA/GFDL models. Analysis of existing and new numerical simulations will further document the biases and will focus on testing potential mechanisms for explaining them. Both recent gradu-ates and more senior candidates will be considered for this position. The selected candidate will have a Ph.D. and one or more of the following attri-butes: (a) a strong background in cli-mate/atmospheric dynamics (b) expe-rience using and analyzing coupled climate models and (c) strong diag-nostic skills in analyzing simulated and observed data sets.
This appointment is for one year subject to renewal for a second year based on satisfactory performance and funding. Successful candidates will be based at GFDL in Princeton, New Jersey. For further information, please contact (Tom .Knutson @noaa .gov) or Elena Shevliakova (Elena .Shevliakova @noaa .gov).
Complete applications, including a CV, publication list, three references in order for CIMES/GFDL to solicit let-ters of recommendation if needed, and a one- to- two page statement of research interests should be submit-ted by May 1, 2021 11:59 p.m. EST to ensure full consideration; evaluation will be ongoing until the position is filled. Princeton is interested in can-didates who, through their research, will contribute to the diversity and excellence of the academic commu-nity. Applicants should apply online https:// www .princeton .edu/ acad -positions/position/19942.
This position is subject to the Uni-versity’s background check policy. Princeton University is an equal opportunity/affirmative action employer, and all qualified applicants will receive consideration for employ-ment without regard to age, race, color, religion, sex, sexual orientation, gender identity or expression, national origin, disability status, pro-tected veteran status, or any other characteristic protected by law.
Employer: Princeton UniversityPosition: Postdoctoral Research
Associate on Decadal to Centen-nial Scale Sea Level Rise
Location: Princeton, New JerseyThe Atmospheric and Oceanic Sci-
ences Program at Princeton Univer-sity, in association with NOAA’s Geo-physical Fluid Dynamics Laboratory (GFDL) and Center for Operational Oceanographic Products and Services ( CO- OPS), seeks a postdoctoral or more senior researchers to conduct research on decadal to centennial scale sea level rise. The overall goal
of the project is to contextualize pro-jections of sea level rise from the lat-est generation of coupled global cli-mate models developed at NOAA- GFDL against previous generation simula-tions. The research at Princeton Uni-versity/GFDL will focus on potential areas that include the role of different model horizontal resolutions, differ-ences among climate forcing scenar-ios, ocean heat uptake and exchange between the upper ocean and deep ocean, and global climate sensitivity to greenhouse gas forcing. The research will require analysis and interpretation of model output, man-agement of large datasets, and the development of mean- state and process- level model diagnostics of sea level rise. The postdoc will be expected to collaborate with research-ers at Princeton, GFDL, and CO- OPS.
In addition to a quantitative back-ground, the selected candidates will ideally have one or more of the fol-lowing attributes: a) a strong back-ground in physical oceanography, sea level rise dynamics, ocean heat uptake, or a closely related field, b) demonstrated experience in conduct-ing analysis of ocean- only and cou-pled climate model output, and
c) experience in ocean model devel-opment or conducting model simu-lations.
Candidates must have a Ph.D. and preferably in Oceanography, or a closely related field. The initial appointment is for one year with the possibility of a second- year renewal subject to satisfactory performance and available funding.
Complete applications, including a cover letter, CV, publication list, research statement (no more than 2 pages incl. references), and 3 letters of recommendation should be sub-mitted by May 1, 2021, 11:59 pm EST for full consideration. Princeton is interested in candidates who, through their research, will contribute to the diversity and excellence of the aca-demic community. Applicants should apply online https:// www .princeton .edu/ acad -positions/ position/19943. For additional information about the project contact Dr. John Krasting (John .Krasting @noaa.gov).
This position is subject to Prince-ton University’s background check policy.
Princeton University is an equal opportunity/affirmative action employer and all qualified applicants
The Career Center (findajob.agu.org) is AGU’s main resource for recruitment advertising.
AGU offers online and printed recruitment advertising in Eos to reinforce your online job visibility and your brand. Visit employers .agu.org for more information.
Eos is published monthly.
Deadlines for ads in each issue are published at sites . agu.org/media-kits/eos-advertising -deadlines/.
Eos accepts employment and open position advertisements from governments, individuals, organizations, and academic institutions. We reserve the right to accept or reject ads at our discretion.
Eos is not responsible for typographical errors.
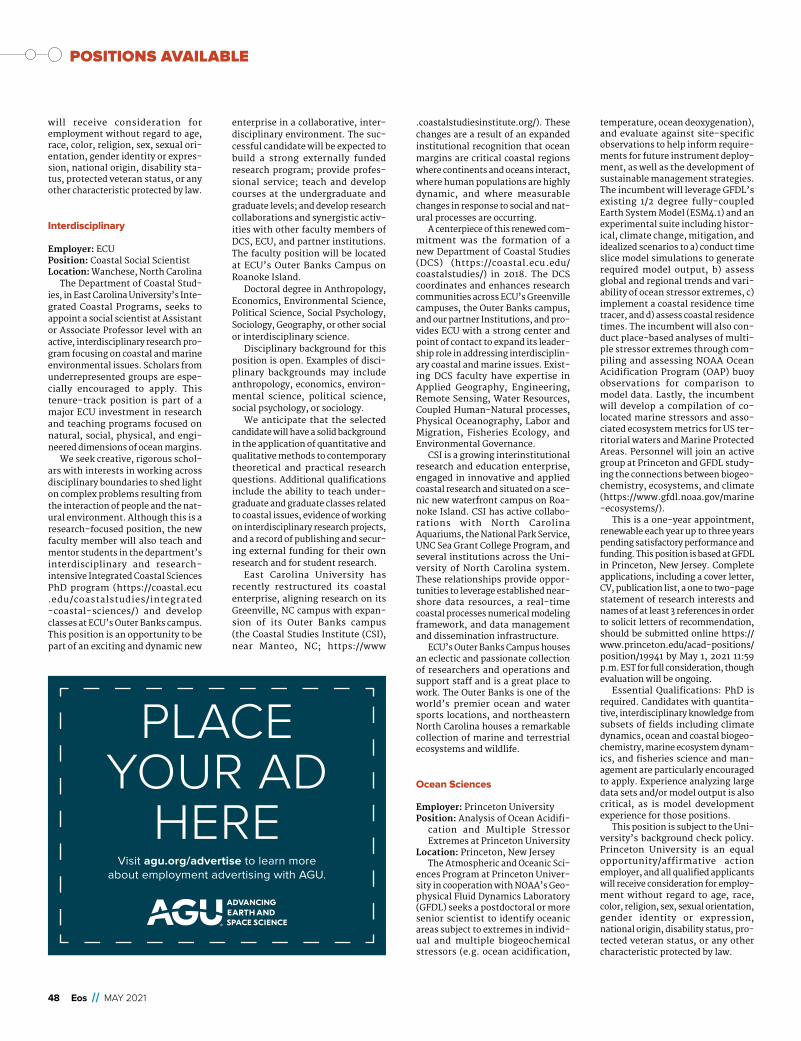
48 Eos // MAY 2021
POSITIONS AVAILABLE
will receive consideration for employment without regard to age, race, color, religion, sex, sexual ori-entation, gender identity or expres-sion, national origin, disability sta-tus, protected veteran status, or any other characteristic protected by law.
Interdisciplinary
Employer: ECUPosition: Coastal Social ScientistLocation: Wanchese, North Carolina
The Department of Coastal Stud-ies, in East Carolina University’s Inte-grated Coastal Programs, seeks to appoint a social scientist at Assistant or Associate Professor level with an active, interdisciplinary research pro-gram focusing on coastal and marine environmental issues. Scholars from underrepresented groups are espe-cially encouraged to apply. This tenure- track position is part of a major ECU investment in research and teaching programs focused on natural, social, physical, and engi-neered dimensions of ocean margins.
We seek creative, rigorous schol-ars with interests in working across disciplinary boundaries to shed light on complex problems resulting from the interaction of people and the nat-ural environment. Although this is a research- focused position, the new faculty member will also teach and mentor students in the department’s interdisciplinary and research- intensive Integrated Coastal Sciences PhD program (https:// coastal .ecu .edu/ coastalstudies/ integrated -coastal- sciences/) and develop classes at ECU’s Outer Banks campus. This position is an opportunity to be part of an exciting and dynamic new
enterprise in a collaborative, inter-disciplinary environment. The suc-cessful candidate will be expected to build a strong externally funded research program; provide profes-sional service; teach and develop courses at the undergraduate and graduate levels; and develop research collaborations and synergistic activ-ities with other faculty members of DCS, ECU, and partner institutions. The faculty position will be located at ECU’s Outer Banks Campus on Roanoke Island.
Doctoral degree in Anthropology, Economics, Environmental Science, Political Science, Social Psychology, Sociology, Geography, or other social or interdisciplinary science.
Disciplinary background for this position is open. Examples of disci-plinary backgrounds may include anthropology, economics, environ-mental science, political science, social psychology, or sociology.
We anticipate that the selected candidate will have a solid background in the application of quantitative and qualitative methods to contemporary theoretical and practical research questions. Additional qualifications include the ability to teach under-graduate and graduate classes related to coastal issues, evidence of working on interdisciplinary research projects, and a record of publishing and secur-ing external funding for their own research and for student research.
East Carolina University has recently restructured its coastal enterprise, aligning research on its Greenville, NC campus with expan-sion of its Outer Banks campus (the Coastal Studies Institute (CSI), near Manteo, NC; https:// www
.coastalstudiesinstitute .org/). These changes are a result of an expanded institutional recognition that ocean margins are critical coastal regions where continents and oceans interact, where human populations are highly dynamic, and where measurable changes in response to social and nat-ural processes are occurring.
A centerpiece of this renewed com-mitment was the formation of a new Department of Coastal Studies (DCS) (https:// coastal.ecu .edu/ coastalstudies/) in 2018. The DCS coordinates and enhances research communities across ECU’s Greenville campuses, the Outer Banks campus, and our partner Institutions, and pro-vides ECU with a strong center and point of contact to expand its leader-ship role in addressing interdisciplin-ary coastal and marine issues. Exist-ing DCS faculty have expertise in Applied Geography, Engineering, Remote Sensing, Water Resources, Coupled Human- Natural processes, Physical Oceanography, Labor and Migration, Fisheries Ecology, and Environmental Governance.
CSI is a growing interinstitutional research and education enterprise, engaged in innovative and applied coastal research and situated on a sce-nic new waterfront campus on Roa-noke Island. CSI has active collabo-rations with North Carolina Aquariums, the National Park Service, UNC Sea Grant College Program, and several institutions across the Uni-versity of North Carolina system. These relationships provide oppor-tunities to leverage established near-shore data resources, a real- time coastal processes numerical modeling framework, and data management and dissemination infrastructure.
ECU’s Outer Banks Campus houses an eclectic and passionate collection of researchers and operations and support staff and is a great place to work. The Outer Banks is one of the world’s premier ocean and water sports locations, and northeastern North Carolina houses a remarkable collection of marine and terrestrial ecosystems and wildlife.
Ocean Sciences
Employer: Princeton UniversityPosition: Analysis of Ocean Acidifi-
cation and Multiple Stressor Extremes at Princeton University
Location: Princeton, New JerseyThe Atmospheric and Oceanic Sci-
ences Program at Princeton Univer-sity in cooperation with NOAA’s Geo-physical Fluid Dynamics Laboratory (GFDL) seeks a postdoctoral or more senior scientist to identify oceanic areas subject to extremes in individ-ual and multiple biogeochemical stressors (e.g. ocean acidification,
temperature, ocean deoxygenation), and evaluate against site- specific observations to help inform require-ments for future instrument deploy-ment, as well as the development of sustainable management strategies. The incumbent will leverage GFDL’s existing 1/2 degree fully- coupled Earth System Model (ESM4.1) and an experimental suite including histor-ical, climate change, mitigation, and idealized scenarios to a) conduct time slice model simulations to generate required model output, b) assess global and regional trends and vari-ability of ocean stressor extremes, c) implement a coastal residence time tracer, and d) assess coastal residence times. The incumbent will also con-duct place- based analyses of multi-ple stressor extremes through com-piling and assessing NOAA Ocean Acidification Program (OAP) buoy observations for comparison to model data. Lastly, the incumbent will develop a compilation of co- located marine stressors and asso-ciated ecosystem metrics for US ter-ritorial waters and Marine Protected Areas. Personnel will join an active group at Princeton and GFDL study-ing the connections between biogeo-chemistry, ecosystems, and climate (https:// www .gfdl .noaa .gov/ marine - ecosystems/).
This is a one- year appointment, renewable each year up to three years pending satisfactory performance and funding. This position is based at GFDL in Princeton, New Jersey. Complete applications, including a cover letter, CV, publication list, a one to two- page statement of research interests and names of at least 3 references in order to solicit letters of recommendation, should be submitted online https:// www .princeton .edu/ acad- positions/position/ 19941 by May 1, 2021 11:59 p.m. EST for full consideration, though evaluation will be ongoing.
Essential Qualifications: PhD is required. Candidates with quantita-tive, interdisciplinary knowledge from subsets of fields including climate dynamics, ocean and coastal biogeo-chemistry, marine ecosystem dynam-ics, and fisheries science and man-agement are particularly encouraged to apply. Experience analyzing large data sets and/or model output is also critical, as is model development experience for those positions.
This position is subject to the Uni-versity’s background check policy. Princeton University is an equal opportunity/affirmative action employer, and all qualified applicants will receive consideration for employ-ment without regard to age, race, color, religion, sex, sexual orientation, gender identity or expression, national origin, disability status, pro-tected veteran status, or any other characteristic protected by law.
PLACE YOUR AD
HEREVisit agu.org/advertise to learn more
about employment advertising with AGU.
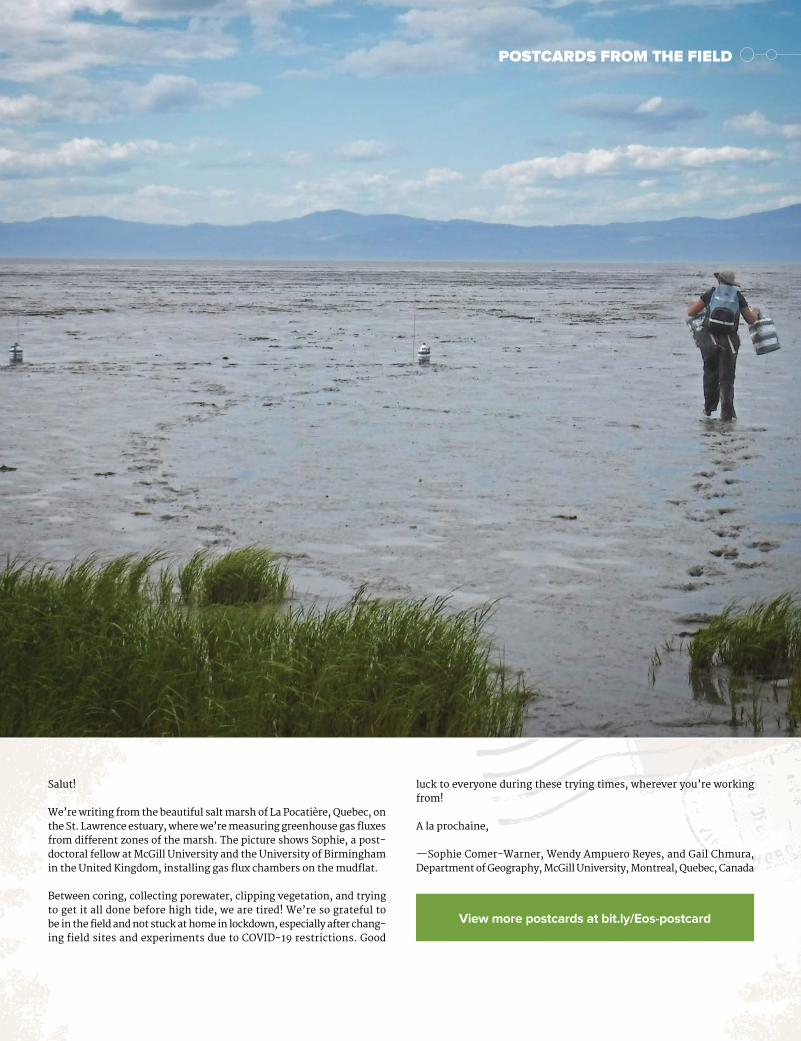
Salut!
We’re writing from the beautiful salt marsh of La Pocatière, Quebec, on the St. Lawrence estuary, where we’re measuring greenhouse gas fluxes from different zones of the marsh. The picture shows Sophie, a post-doctoral fellow at McGill University and the University of Birmingham in the United Kingdom, installing gas flux chambers on the mudflat.
Between coring, collecting porewater, clipping vegetation, and trying to get it all done before high tide, we are tired! We’re so grateful to be in the field and not stuck at home in lockdown, especially after chang-ing field sites and experiments due to COVID-19 restrictions. Good
luck to everyone during these trying times, wherever you’re working from!
A la prochaine,
—Sophie Comer-Warner, Wendy Ampuero Reyes, and Gail Chmura, Department of Geography, McGill University, Montreal, Quebec, Canada
POSTCARDS FROM THE FIELD
View more postcards at bit.ly/Eos-postcard