What’s Cooking in Your Food System? - Rural Grocery the FEAST model • FEAST was developed as a...
19
Community FEAST Food-Education-Agriculture-Solutions-Together Presented by: Sharon Thornberry Community Food Systems Manager Oregon Food Bank [email protected]
Transcript of What’s Cooking in Your Food System? - Rural Grocery the FEAST model • FEAST was developed as a...

Community FEAST
Food-Education-Agriculture-Solutions-Together
Presented by Sharon Thornberry Community Food Systems Manager
Oregon Food Bank sthornberryoregonfoodbankorg
We envision communities across Oregon and SW Washington where citizens are empowered and actively engaged across sectors to attain personal and community food security
About the FEAST model bull FEAST was developed as a response to the need
to help communities move to action around community food systems work
bull These events are organized by a local steering committee and feature local organizations
bull A FEAST convenes a conversation that leads to a self-determined organizing plan for food systems work in the community
bull Currently OFB staff serve as facilitators provide suggestions feedback and support but do not direct the outcomes
Food Education Agriculture Solutions Together
Presenter
Presentation Notes
FEAST was developed as a response to the need to help communities move to action around to community food systems work These events feature local organizations and convene a conversation that leads to a self-determined organizing plan for food systems work Currently OFB staff serve as facilitators provide suggestions feedback and support but do not direct the outcomes We are planning to develop a Trainndashthe ndashFacilitator program within the next year13
Community members tell the story of their local food system
Participants are introduced to Community Food Systems Organizing and Language
Priorities are identified through a group visioning process
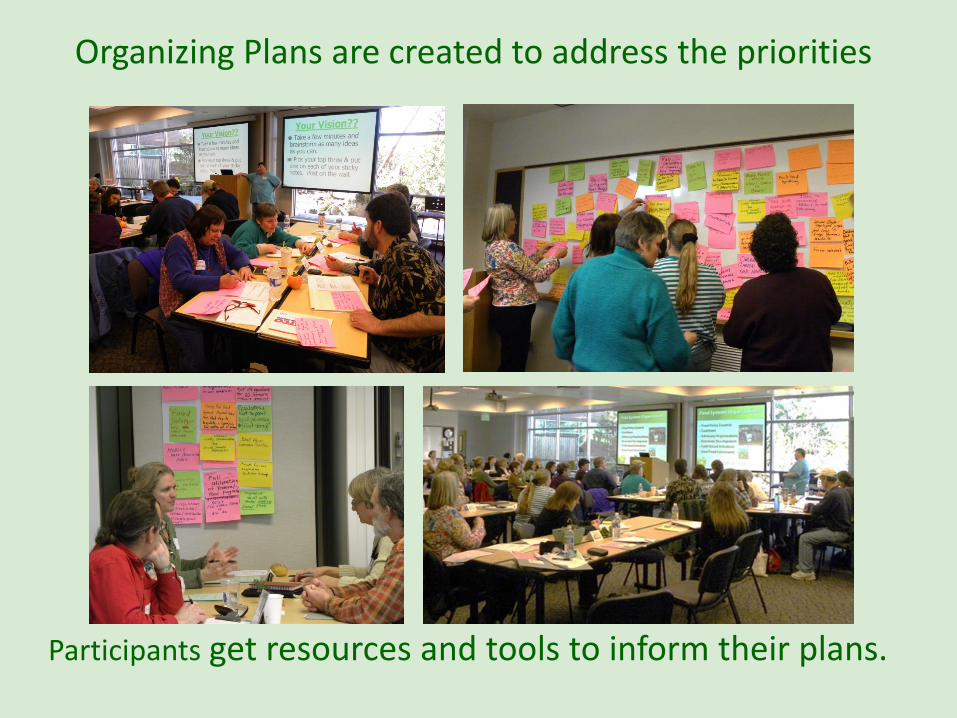
Participants get resources and tools to inform their plans
Organizing Plans are created to address the priorities
Cannon Beach
Lewiston ID Emmett ID
Hermiston
Ontario
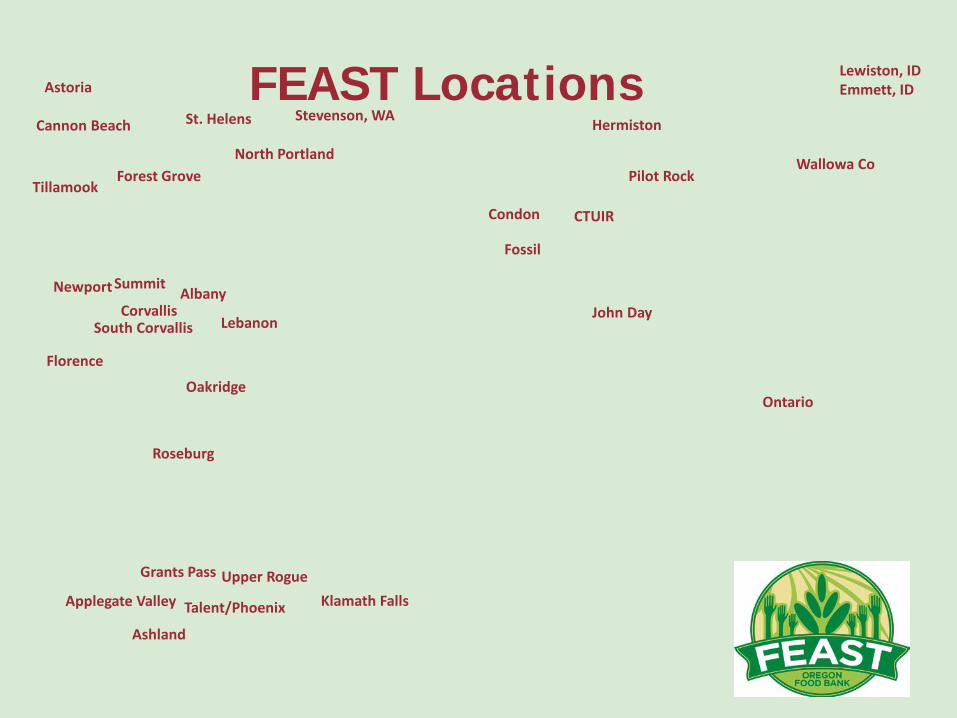
FEAST Locations
Lebanon
Condon
Fossil
Pilot Rock
John Day
North Portland Forest Grove
South Corvallis
Wallowa Co
Albany Summit
Klamath Falls
CTUIR
Newport Corvallis
TalentPhoenix
St Helens
Tillamook
Florence
Oakridge
Applegate Valley
Grants Pass
Stevenson WA
Upper Rogue
Roseburg
Ashland
Astoria
IMPACT Attendees represent Emergency Food Pantry FarmerProducer Food Retailer Elected Official Health Care Provider GleanerFood rescue Farmers Market Gardener OSU Extension Agents Farm-School Economic Development Nutrition Education Public Health Food Processor Nonprofit Faith-Based Organization FisheriesAquaculture
bull 33 Events to date engaging over 1000 people
bull New Farm-to-school partnerships
bull New farmersrsquo markets amp SNAP incentives
bull Increased awareness of food insecurity in local communities
bull Food systems coalitions amp organizations have been established
bull New food donors are partnering with emergency food providers
bull Positive media coverage
bull Increased community engagement
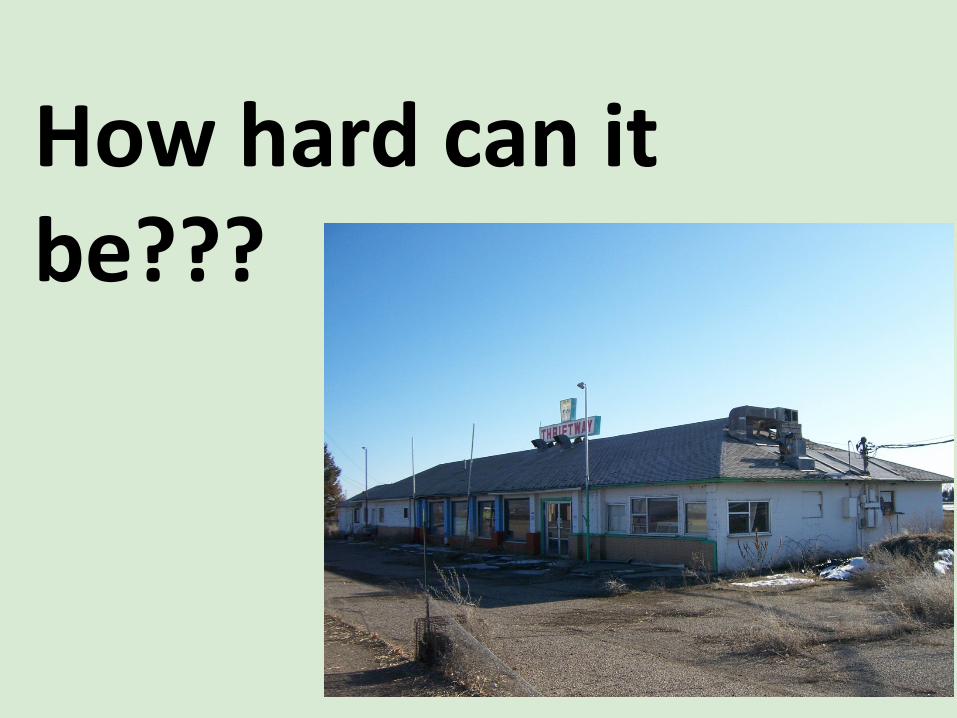
How hard can it be
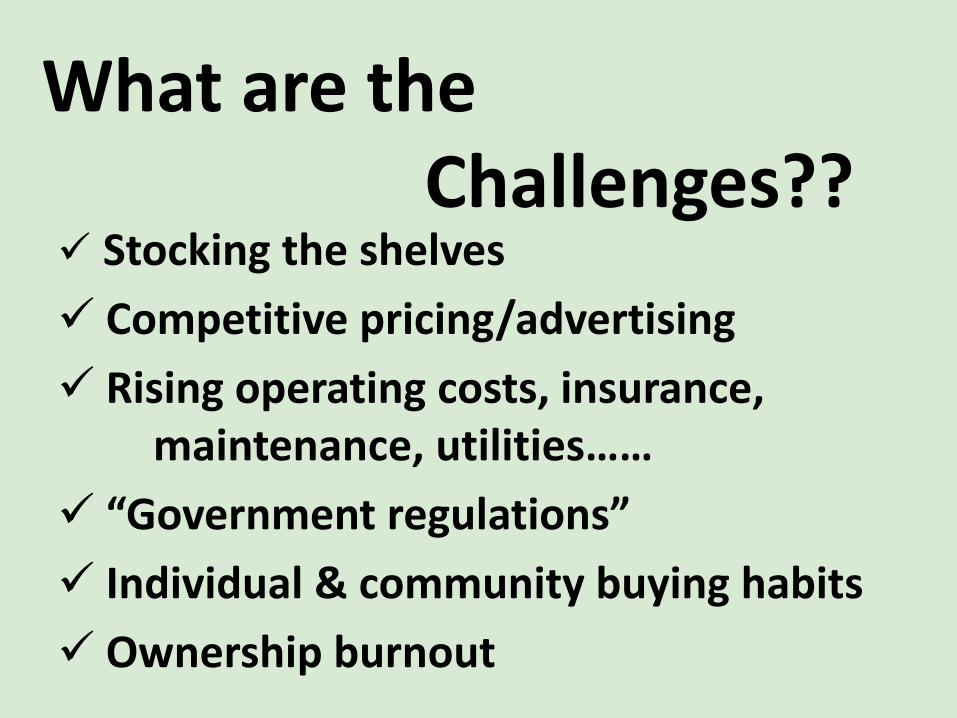
What are the Challenges Stocking the shelves Competitive pricingadvertising Rising operating costs insurance
maintenance utilitieshelliphellip ldquoGovernment regulationsrdquo Individual amp community buying habits Ownership burnout
Finding Solutionshelliphellip Community conversations Building awareness Educating policymakers Commitment gt community businesses Harnessing community buying power Realistic expectations
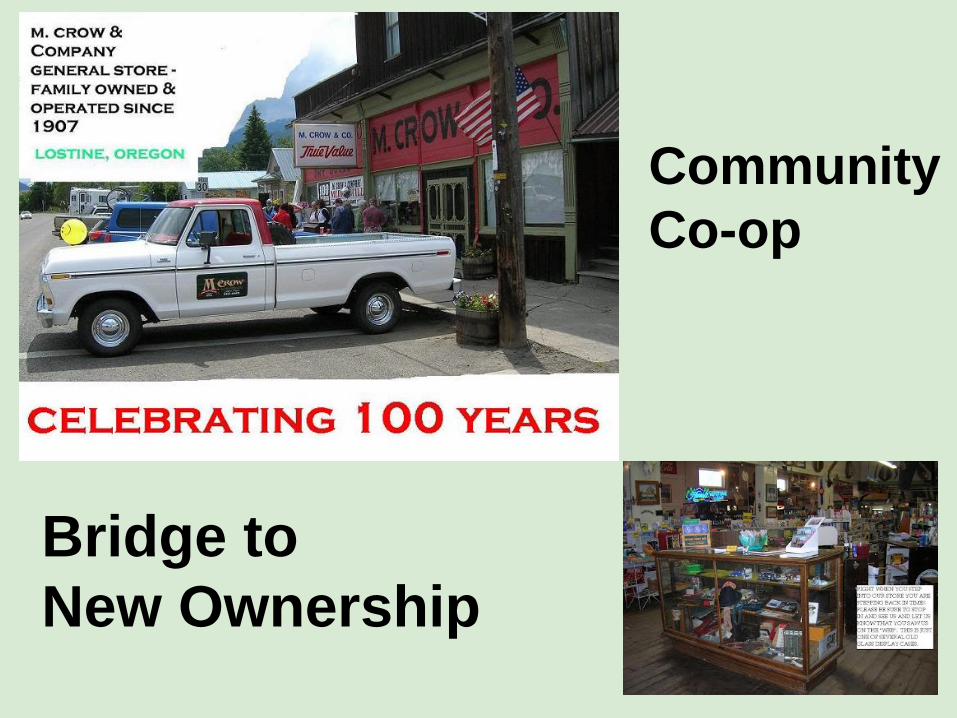
History amp Community Integrity
Community Co-op
Bridge to New Ownership
Best Practices
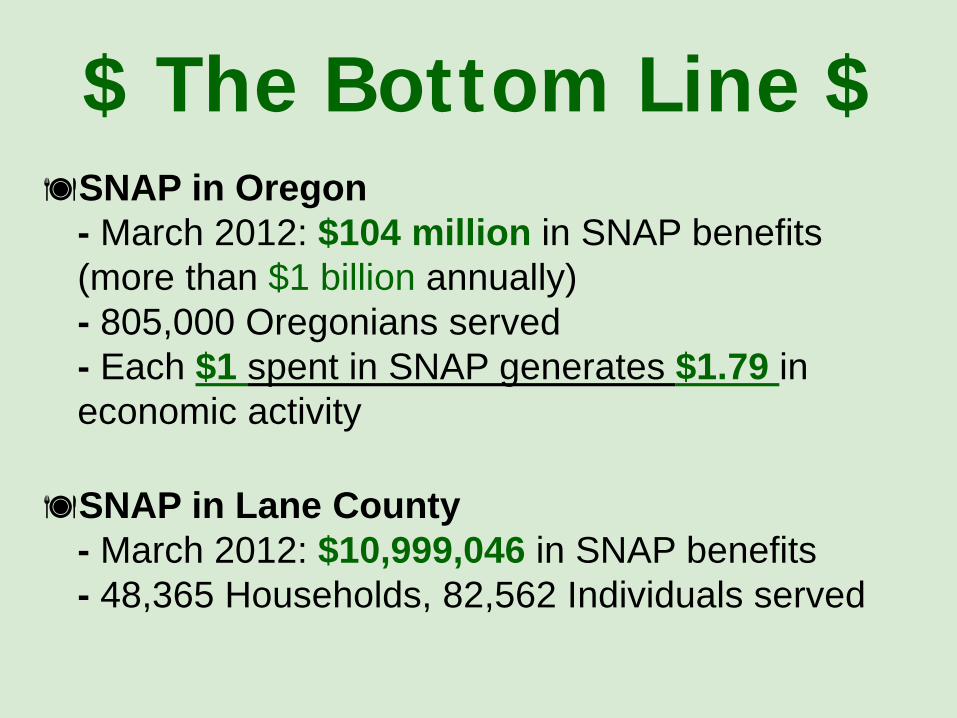
SNAP in Oregon - March 2012 $104 million in SNAP benefits (more than $1 billion annually) - 805000 Oregonians served - Each $1 spent in SNAP generates $179 in economic activity
SNAP in Lane County - March 2012 $10999046 in SNAP benefits - 48365 Households 82562 Individuals served
$ The Bottom Line $
Yes Magazine 2006
Buying Local Economic Multiplier
Sharon Thornberry Megan Newell-Ching Community Food Systems Manager Community Resource Developer Cell 503-703-2198 Cell 503-702-7579 1-800-777-7427 x2228 (voice mail) Office 503-419-4186 sthornberryoregonfoodbankorg mnewellchingoregonfoodbankorg
Oregon Food Bank PO Box 55370
Portland OR 97238
Connect With Us on Social Media httpwwwfacebookcomoregonfoodbankcfs httpstwittercomOFB_SharonT
- Community FEASTFood-Education-Agriculture-Solutions-Together
- Slide Number 2
- About the FEAST model
- Slide Number 4
- Slide Number 5
- Slide Number 6
- Slide Number 7
- Slide Number 8
- Impact
- Slide Number 10
- Slide Number 11
- Slide Number 12
- History amp Community Integrity
- Slide Number 14
- Slide Number 15
- Best Practices
- Slide Number 17
- Slide Number 18
- Slide Number 19
-
We envision communities across Oregon and SW Washington where citizens are empowered and actively engaged across sectors to attain personal and community food security
About the FEAST model bull FEAST was developed as a response to the need
to help communities move to action around community food systems work
bull These events are organized by a local steering committee and feature local organizations
bull A FEAST convenes a conversation that leads to a self-determined organizing plan for food systems work in the community
bull Currently OFB staff serve as facilitators provide suggestions feedback and support but do not direct the outcomes
Food Education Agriculture Solutions Together
Presenter
Presentation Notes
FEAST was developed as a response to the need to help communities move to action around to community food systems work These events feature local organizations and convene a conversation that leads to a self-determined organizing plan for food systems work Currently OFB staff serve as facilitators provide suggestions feedback and support but do not direct the outcomes We are planning to develop a Trainndashthe ndashFacilitator program within the next year13
Community members tell the story of their local food system
Participants are introduced to Community Food Systems Organizing and Language
Priorities are identified through a group visioning process
Participants get resources and tools to inform their plans
Organizing Plans are created to address the priorities
Cannon Beach
Lewiston ID Emmett ID
Hermiston
Ontario
FEAST Locations
Lebanon
Condon
Fossil
Pilot Rock
John Day
North Portland Forest Grove
South Corvallis
Wallowa Co
Albany Summit
Klamath Falls
CTUIR
Newport Corvallis
TalentPhoenix
St Helens
Tillamook
Florence
Oakridge
Applegate Valley
Grants Pass
Stevenson WA
Upper Rogue
Roseburg
Ashland
Astoria
IMPACT Attendees represent Emergency Food Pantry FarmerProducer Food Retailer Elected Official Health Care Provider GleanerFood rescue Farmers Market Gardener OSU Extension Agents Farm-School Economic Development Nutrition Education Public Health Food Processor Nonprofit Faith-Based Organization FisheriesAquaculture
bull 33 Events to date engaging over 1000 people
bull New Farm-to-school partnerships
bull New farmersrsquo markets amp SNAP incentives
bull Increased awareness of food insecurity in local communities
bull Food systems coalitions amp organizations have been established
bull New food donors are partnering with emergency food providers
bull Positive media coverage
bull Increased community engagement
How hard can it be
What are the Challenges Stocking the shelves Competitive pricingadvertising Rising operating costs insurance
maintenance utilitieshelliphellip ldquoGovernment regulationsrdquo Individual amp community buying habits Ownership burnout
Finding Solutionshelliphellip Community conversations Building awareness Educating policymakers Commitment gt community businesses Harnessing community buying power Realistic expectations
History amp Community Integrity
Community Co-op
Bridge to New Ownership
Best Practices
SNAP in Oregon - March 2012 $104 million in SNAP benefits (more than $1 billion annually) - 805000 Oregonians served - Each $1 spent in SNAP generates $179 in economic activity
SNAP in Lane County - March 2012 $10999046 in SNAP benefits - 48365 Households 82562 Individuals served
$ The Bottom Line $
Yes Magazine 2006
Buying Local Economic Multiplier
Sharon Thornberry Megan Newell-Ching Community Food Systems Manager Community Resource Developer Cell 503-703-2198 Cell 503-702-7579 1-800-777-7427 x2228 (voice mail) Office 503-419-4186 sthornberryoregonfoodbankorg mnewellchingoregonfoodbankorg
Oregon Food Bank PO Box 55370
Portland OR 97238
Connect With Us on Social Media httpwwwfacebookcomoregonfoodbankcfs httpstwittercomOFB_SharonT
- Community FEASTFood-Education-Agriculture-Solutions-Together
- Slide Number 2
- About the FEAST model
- Slide Number 4
- Slide Number 5
- Slide Number 6
- Slide Number 7
- Slide Number 8
- Impact
- Slide Number 10
- Slide Number 11
- Slide Number 12
- History amp Community Integrity
- Slide Number 14
- Slide Number 15
- Best Practices
- Slide Number 17
- Slide Number 18
- Slide Number 19
-