Save money, energy, and the planet! Welcome Greece! Let’s be a Cool Community! TheChallenge.
ANNUAL REPORT 2016
WHATEVER THECHALLENGE
WELLTEC INTERNATIONAL APS CENTRAL BUSINESS REGISTRATION NO: 30 69 50 03GYDEVANG 25, 3450 ALLERØD, DENMARK
2 / MANAGEMENT COMMENTARYWELLTEC® ANNUAL REPORT 2016
CONTENTS
Company Profile 2
Management Commentary 3
Consolidated Key Figures and Ratios 3
Financial Review 4
Outlook 5
Risks 7
Corporate Social Responsibility 9
Company Details 16
Statement by Management on the Annual Report 17
Independent Auditor’s Reports 18
Financial Statements 20
Consolidated Group 20
Parent Company 61
Branches 74
COMPANY PROFILE
Welltec® is a global service provider which develops and deliv-
ers technology and services intended to transform the oil and
gas industry. Our game-changing solutions are dedicated to
optimizing the construction and management of our clients’
well stock, from well completion design and construction to
the intervention services required to ensure performance and
integrity.
We address the factors that maximize value creation, continu-
ously innovating to reduce well construction time, speed up
access to the hydrocarbons and reduce the capital expenditure
compared to more conventional methods. This results in maxi-
mized hydrocarbon production and increased total recovery
while minimizing operating downtime.
It’s Welltec’s philosophy to challenge existing conventions and
think laterally in order to develop products and services which
increase oil and gas recovery while improving the sustainable,
economic, environmental and safety aspects of our industry.
In practice we develop, test and manufacture state-of-the-
art technology to enhance the production and recovery rates
for our clients, thereby improving their profitability through a
longer term revenue stream, while at the same time improving
upon health, safety and environmental attributes.
In an industry challenged by low oil prices, our Flex-Well®
design provides new perspective to drilling and completing
wells, adopting a holistic approach which adds value continu-
ously over the life-cycle of the well. From reducing geological
uncertainty, accelerating first production, minimizing CAPEX,
reducing costs and simplifying P&A our approach can boost
cash flow now and over the life of the well.
Our value proposition is compelling; our technology enables
clients to unlock more production from their assets and
to address reservoir complexities and uncertainties with a
greater number of options, which are cleaner, safer and more
sustainable

3 MANAGEMENT COMMENTARY / WELLTEC® ANNUAL REPORT 2016
CONSOLIDATED KEY FIGURES AND RATIOS
Welltec International ApS – group 2016 2015 2014 2013 2012
STATEMENT OF COMPREHENSIVE INCOME (USD in millions)
Revenue 189 246 345 321 295
Earnings before interest, tax, depreciation and amortization (EBITDA)* 68 96 155 135 140
Operating profit (EBIT) before special items (50) 23 76 72 86
Operating profit (EBIT) (53) 14 76 68 86
Net financial expenses (29) (32) (21) (26) (38)
Profit / (loss) before tax (81) (18) 54 42 48
Net profit / (loss) for the year (70) (33) 21 21 24
CASH FLOWS (USD in millions)
Cash flows from operating activities 62 80 121 100 95
Cash flows from investing activities (19) (51) (76) (86) (79)
Cash flows from financing activities (49) (9) (38) (18) 12
Total cash flows (6) 20 7 (4) 29
BALANCE (USD in millions)
Trade receivables 45 61 84 83 85
Equity 177 242 282 279 246
Total assets 570 687 735 712 692
Investments in intangible assets** 12 19 38 34 31
Investments in tangible assets** 20 26 46 55 51
KEY RATIOS (%)
EBITDA margin* 36.1 38.9 45.0 42.1 47.3
EBIT margin before special items (26.6) 9.3 21.9 22.5 29.2
ROIC excl. goodwill 14.4 17.2 32.2 29.2 36.7
Return on equity (33.2) (12.5) 7.6 7.9 8.6
Number of employees, average 736 894 1,013 1,055 916
EBIT margin before special items = Operating profit [EBIT] before special items x 100
Revenue
*EBITDA margin = Operating profit before special items, depreciation, amortization and impairment and adjusted for issued warrants (non-cash) x 100
Revenue
Return on equity = Profit / (loss) for the year x 100
Average equity
ROIC excl. goodwill = EBITA
Average capital investment excl. goodwill
*EBITDA is defined by Welltec as reported operating profit (EBIT) before special items, amortization, depreciation, impairment losses and issued warrants (non-cash). Depreciation for these purposes includes depreciation attributable to development and manufacturing which is capitalized because it is considered a part of the costs that are directly attributable to the manufacturing of products. Welltec’s definition of EBITDA may differ from the definition of EBITDA used by other companies. EBITDA as defined by Welltec is reported to allow for a more accurate assessment of the busi-ness operations. Welltec’s definition of EBITDA should not be considered in isolation from, as substitutes for, or superior to the reported results prepared in accordance with International Financial Reporting Standards (IFRS). **Investments in intangible and tangible assets are defined as addition of fixed assets including additions from financial leasing and additions through business combinations.
4 / MANAGEMENT COMMENTARYWELLTEC® ANNUAL REPORT 2016
Administrative expenses and sales costs
Administrative expenses and sales costs were USD 53 million,
a decrease of 18% compared to last year. The decrease was
primarily driven by lower staff costs as a natural consequence
of the lower activity levels. SG&A staff costs decreased by
19%, with average SG&A headcount 15% lower, reflecting a
more streamlined organizational structure.
Earnings before interest, tax, depreciation, amortization and
special items (EBITDA)
EBITDA decreased to USD 68 million, representing a margin of
36% against 39% in 2015. The decline in EBITDA was mainly
attributable to the fall through of lower revenues partly offset
by the implementation of cost efficiencies. Currency fluctua-
tions affected EBITDA negatively with USD 1 million compared
to 2015.
Amortization of acquired intangibles in a business
combination
In Q1 2016 it was decided to write-down Technology and
Customer relationship with USD 53 million due to uncertain
market conditions.
Operating profit before special items (EBIT)
EBIT decreased to USD (50) million from 23 million in 2015.
The EBIT margin was (27)% against 9% in 2015, reflecting
an overall reduction in earnings and write-down of intangible
assets.
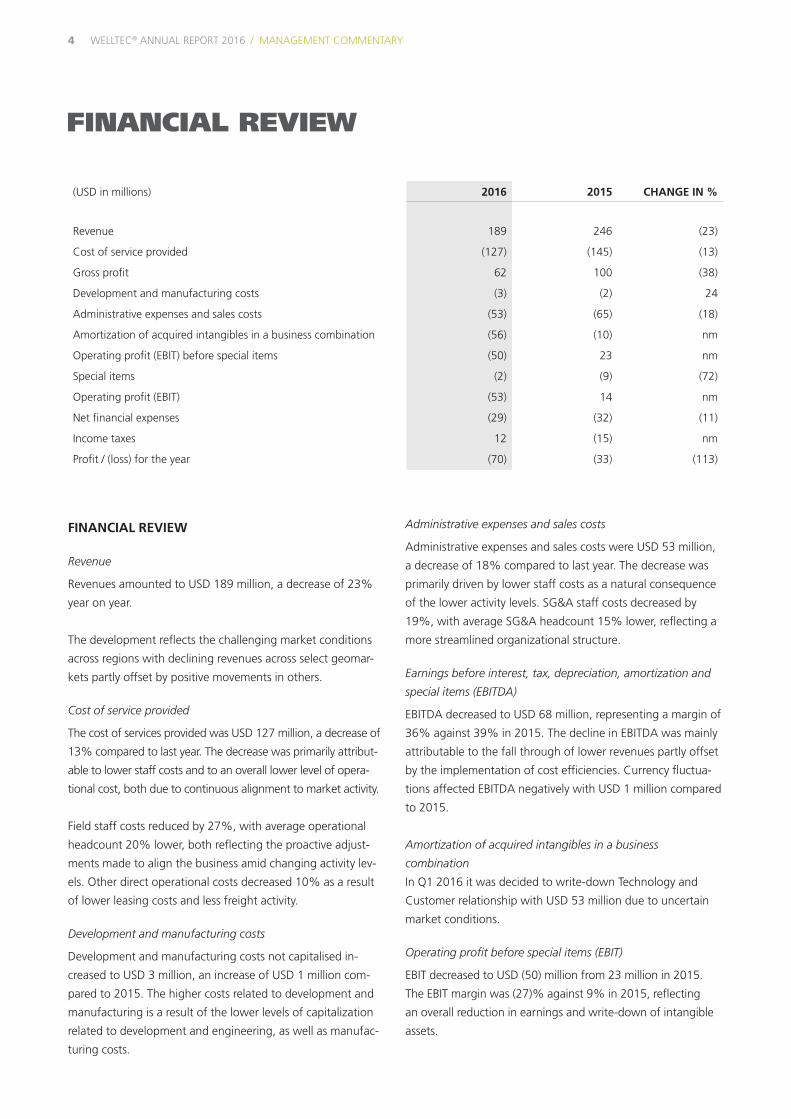
FINANCIAL REVIEW
Revenue
Revenues amounted to USD 189 million, a decrease of 23%
year on year.
The development reflects the challenging market conditions
across regions with declining revenues across select geomar-
kets partly offset by positive movements in others.
Cost of service provided
The cost of services provided was USD 127 million, a decrease of
13% compared to last year. The decrease was primarily attribut-
able to lower staff costs and to an overall lower level of opera-
tional cost, both due to continuous alignment to market activity.
Field staff costs reduced by 27%, with average operational
headcount 20% lower, both reflecting the proactive adjust-
ments made to align the business amid changing activity lev-
els. Other direct operational costs decreased 10% as a result
of lower leasing costs and less freight activity.
Development and manufacturing costs
Development and manufacturing costs not capitalised in-
creased to USD 3 million, an increase of USD 1 million com-
pared to 2015. The higher costs related to development and
manufacturing is a result of the lower levels of capitalization
related to development and engineering, as well as manufac-
turing costs.
(USD in millions) 2016 2015 CHANGE IN %
Revenue 189 246 (23)
Cost of service provided (127) (145) (13)
Gross profit 62 100 (38)
Development and manufacturing costs (3) (2) 24
Administrative expenses and sales costs (53) (65) (18)
Amortization of acquired intangibles in a business combination (56) (10) nm
Operating profit (EBIT) before special items (50) 23 nm
Special items (2) (9) (72)
Operating profit (EBIT) (53) 14 nm
Net financial expenses (29) (32) (11)
Income taxes 12 (15) nm
Profit / (loss) for the year (70) (33) (113)
FINANCIAL REVIEW
5 MANAGEMENT COMMENTARY / WELLTEC® ANNUAL REPORT 2016
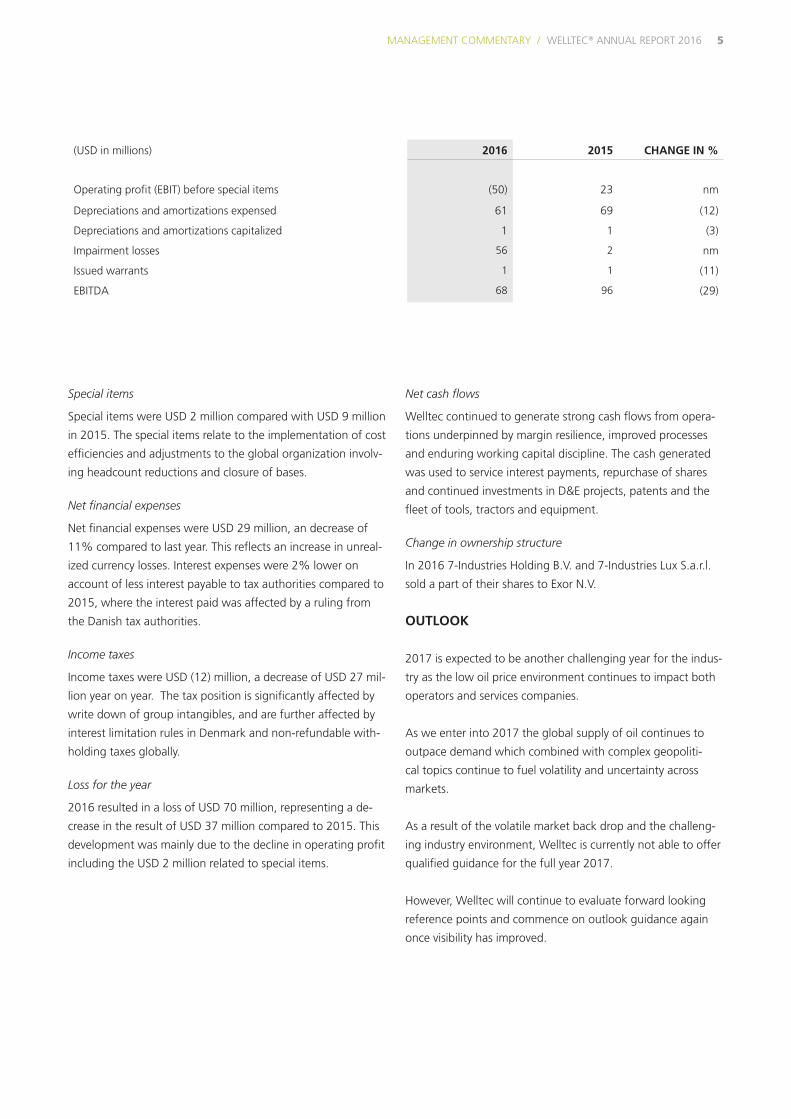
Special items
Special items were USD 2 million compared with USD 9 million
in 2015. The special items relate to the implementation of cost
efficiencies and adjustments to the global organization involv-
ing headcount reductions and closure of bases.
Net financial expenses
Net financial expenses were USD 29 million, an decrease of
11% compared to last year. This reflects an increase in unreal-
ized currency losses. Interest expenses were 2% lower on
account of less interest payable to tax authorities compared to
2015, where the interest paid was affected by a ruling from
the Danish tax authorities.
Income taxes
Income taxes were USD (12) million, a decrease of USD 27 mil-
lion year on year. The tax position is significantly affected by
write down of group intangibles, and are further affected by
interest limitation rules in Denmark and non-refundable with-
holding taxes globally.
Loss for the year
2016 resulted in a loss of USD 70 million, representing a de-
crease in the result of USD 37 million compared to 2015. This
development was mainly due to the decline in operating profit
including the USD 2 million related to special items.
Net cash flows
Welltec continued to generate strong cash flows from opera-
tions underpinned by margin resilience, improved processes
and enduring working capital discipline. The cash generated
was used to service interest payments, repurchase of shares
and continued investments in D&E projects, patents and the
fleet of tools, tractors and equipment.
Change in ownership structure
In 2016 7-Industries Holding B.V. and 7-Industries Lux S.a.r.l.
sold a part of their shares to Exor N.V.
OUTLOOK
2017 is expected to be another challenging year for the indus-
try as the low oil price environment continues to impact both
operators and services companies.
As we enter into 2017 the global supply of oil continues to
outpace demand which combined with complex geopoliti-
cal topics continue to fuel volatility and uncertainty across
markets.
As a result of the volatile market back drop and the challeng-
ing industry environment, Welltec is currently not able to offer
qualified guidance for the full year 2017.
However, Welltec will continue to evaluate forward looking
reference points and commence on outlook guidance again
once visibility has improved.
(USD in millions) 2016 2015 CHANGE IN %
Operating profit (EBIT) before special items (50) 23 nm
Depreciations and amortizations expensed 61 69 (12)
Depreciations and amortizations capitalized 1 1 (3)
Impairment losses 56 2 nm
Issued warrants 1 1 (11)
EBITDA 68 96 (29)

6 / MANAGEMENT COMMENTARYWELLTEC® ANNUAL REPORT 2016

7 MANAGEMENT COMMENTARY / WELLTEC® ANNUAL REPORT 2016
RISKS
Risks Related to Our Business
Business and Industry Related Risks
While we believe our business to be relatively unaffected by
macro-economic factors, it is ultimately affected by the level of
expenditures of companies engaged in the production, explo-
ration and development of oil and gas.
Cyclical Market
The oil and gas industry is cyclical and while demand for
Welltec’s products and services is primarily dependent on cus-
tomer’s operating expenditures, demand for Welltec’s products
and services also depends somewhat on the capital expendi-
tures of customers. A decrease in operating expenditures may
have adverse effects on Welltec’s revenue and profits in the
shorter term, while a decrease in the capital expenditures may
have adverse effects on Welltec’s revenue and profits in the
longer term.
Customers
Welltec’s clients are typically not required to make minimum
purchases under sales contracts and customers can typi-
cally terminate contracts without cause and on short notice.
Notwithstanding our broad customer base, Welltec has one
customer that accounted for more than 15% of our revenue,
hence termination of this relationship would have an adverse
effect on our revenue and profits. As such, visibility with
respect to future revenues is limited and there can be no as-
surance that a trading relationship with important customers
will continue.
Competitors
Welltec competes with large multinational companies that
can offer a broader portfolio of integrated serviced compared
to Welltec. Further, Welltec is, to some extent, dependent on
equipment provided by our competitors and acts or omissions
by such competitors could restrict us from accessing wells
using their equipment. In general, competition can result in
pricing pressures, lower sales and reduced margins that could
have an adverse effect on Welltec’s revenue and profits.
Operational Risks
Service Quality
Welltec’s ability to provide a high quality product and service
provision is paramount to secure repeat sales with new and
existing clients. Our service quality can be negatively affected
by an inability to attract, train and retain highly skilled and
qualified personnel to develop, manufacture and operate our
equipment, with an adverse effect on Welltec’s revenue.
Supply Chain
Welltec may experience constraints, anomalies or interrup-
tions in our supply chain, ultimately restricting Welltec’s ability
to meet customer expectations. Such constraints may be due
to supply chain bottlenecks, delays or disruptions in clearing
goods from customs or events restricting Welltec’s ability to
procure, develop or manufacture new equipment or spare
parts or maintain the existing fleet, and such could negatively
affect our results of operations.
Catastrophic Events
Welltec’s business operations could be subject to various
catastrophic events, including blow outs, explosions, damage
to or loss of third party property, injury to personnel, repu-
tational damage and oil and hazardous substance spills into
the environment, both on and off shore. Such events could, if
the impact of such event is not covered by Welltec’s insurance
or are not subjected to Welltec’s contractual indemnification
protection, have an adverse effect on Welltec’s revenue and
profits.
Financial Risks
Financial Exposure
Due to Welltec’s foreign activities in foreign currencies, its
profit/loss, cash flows and equity are affected by changes in
exchange rates for a number of currencies.
Foreign exchange fluctuations
The reporting currency of the Group is US Dollars and the
functional currency for most of the Group’s subsidiaries is
that of the country in which the subsidiary is domiciled. The
functional currency of the Danish operation and operations in
some other countries is US dollars. This reflects the revenue
and principal source of financing. A significant proportion of
the Group’s revenues, expenses and other liabilities are de-
nominated in currencies other than the US Dollar, in particular
Norwegian Kroner, Danish Kroner and Canadian Dollar. Fluc-
tuations in the value of other currencies as compared with the
US Dollar could result in translation losses or gains.

8 / MANAGEMENT COMMENTARYWELLTEC® ANNUAL REPORT 2016
Taxes
Welltec files income tax returns in multiple jurisdictions.
Welltec’s effective tax rate could be adversely affected by
several factors, including changes in the income taxed by or
allocated to the various jurisdictions with differing statutory
tax rates; changing tax laws, regulations and interpretations
of such tax laws in multiple jurisdictions; and the resolution of
issues arising from tax audits or examinations together with
any related interest or penalties. The determination of local tax
liability is always subject to review or examination by authori-
ties in operating jurisdictions. If a tax authority in any jurisdic-
tion reviews filed tax returns and based on filing proposes an
adjustment, including adjustments of transfer prices and terms
applied, such an adjustment could have a negative impact on
Welltec’s net profit.
Liquidity Risk
Welltec’s ability to make payments, refinance indebtedness,
fund planned capital expenditures and other strategic invest-
ments will depend on our ability to generate cash in the
future. This is, to a certain extent subject to general economic,
financial, competitive, legislative, regulatory and other factors
that are beyond our control. Welltec expects to continue mak-
ing capital investments in order to develop and purchase addi-
tional equipment to expand our services, increase our capacity
and replace existing equipment. Such capital investments
require cash that could otherwise be applied to other business
needs. However, if Welltec does not incur these expenditures
our competitive strength may decline and our business may be
adversely affected.
Legal Risks
Regulatory
Welltec conducts business in multiple jurisdictions in a highly
regulated industry. As such, Welltec is, directly or indirectly,
subject to a variety of federal, provincial, state and local laws,
regulations and guidelines, in all such jurisdictions, including
laws and regulations relating to health and safety, the conduct
of operations including business ethics and trade compliance,
taxation, the protection of the environment and the manufac-
ture, management, transportation and disposal of certain ma-
terials used in operations. Accordingly, Welltec could become
subject to liabilities relating to the violation of such regulations
in multiple jurisdictions, with an adverse effect on profits.
Technology
Welltec is a technology company, constantly challenging the
operational boundaries in the industry. However, third parties
may assert that our products, services, solutions and other
intellectual property may infringe, on their proprietary rights.
Any such potential future claims, regardless of merit, could
result in multi-jurisdictional litigation, which could result in
substantial expenses, causes significant delays and materially
disrupt the conduct of business and have an adverse effect on
our financial condition and results of operations.
BRANCHES
An overview of the branches in the Welltec Group can be
found on page 74.
9 MANAGEMENT COMMENTARY / WELLTEC® ANNUAL REPORT 2016
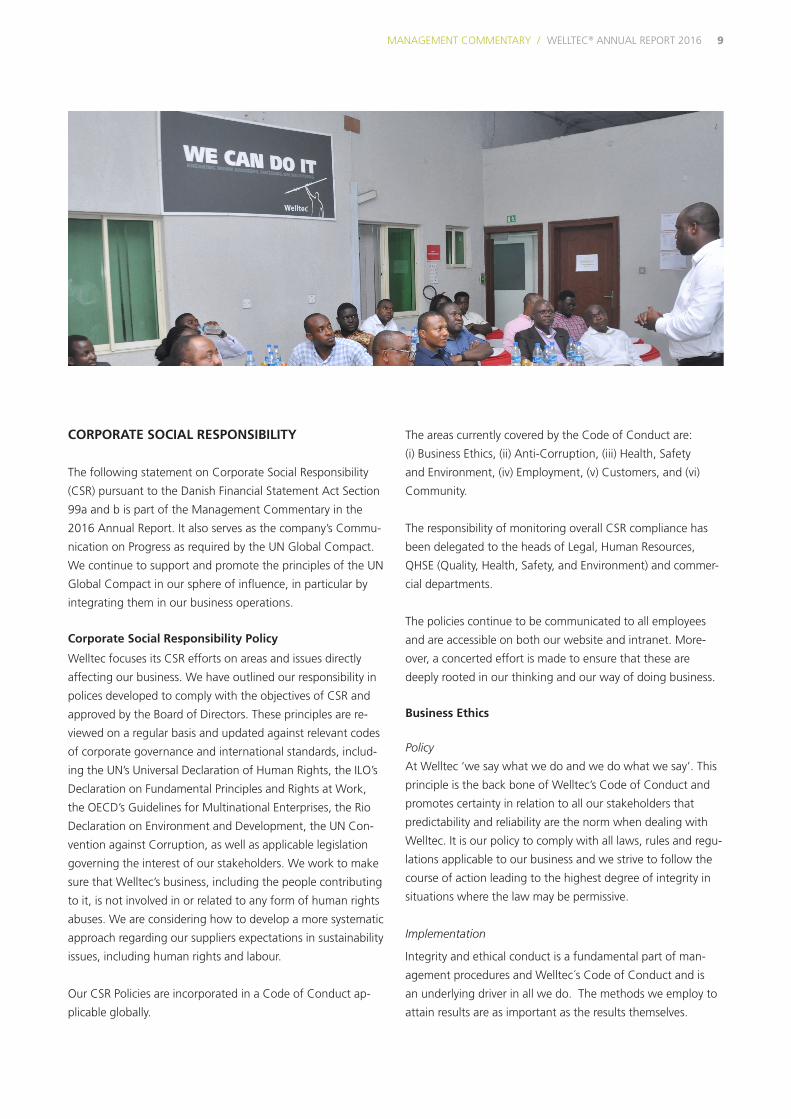
CORPORATE SOCIAL RESPONSIBILITY
The following statement on Corporate Social Responsibility
(CSR) pursuant to the Danish Financial Statement Act Section
99a and b is part of the Management Commentary in the
2016 Annual Report. It also serves as the company’s Commu-
nication on Progress as required by the UN Global Compact.
We continue to support and promote the principles of the UN
Global Compact in our sphere of influence, in particular by
integrating them in our business operations.
Corporate Social Responsibility Policy
Welltec focuses its CSR efforts on areas and issues directly
affecting our business. We have outlined our responsibility in
polices developed to comply with the objectives of CSR and
approved by the Board of Directors. These principles are re-
viewed on a regular basis and updated against relevant codes
of corporate governance and international standards, includ-
ing the UN’s Universal Declaration of Human Rights, the ILO’s
Declaration on Fundamental Principles and Rights at Work,
the OECD’s Guidelines for Multinational Enterprises, the Rio
Declaration on Environment and Development, the UN Con-
vention against Corruption, as well as applicable legislation
governing the interest of our stakeholders. We work to make
sure that Welltec’s business, including the people contributing
to it, is not involved in or related to any form of human rights
abuses. We are considering how to develop a more systematic
approach regarding our suppliers expectations in sustainability
issues, including human rights and labour.
Our CSR Policies are incorporated in a Code of Conduct ap-
plicable globally.
The areas currently covered by the Code of Conduct are:
(i) Business Ethics, (ii) Anti-Corruption, (iii) Health, Safety
and Environment, (iv) Employment, (v) Customers, and (vi)
Community.
The responsibility of monitoring overall CSR compliance has
been delegated to the heads of Legal, Human Resources,
QHSE (Quality, Health, Safety, and Environment) and commer-
cial departments.
The policies continue to be communicated to all employees
and are accessible on both our website and intranet. More-
over, a concerted effort is made to ensure that these are
deeply rooted in our thinking and our way of doing business.
Business Ethics
Policy
At Welltec ‘we say what we do and we do what we say’. This
principle is the back bone of Welltec’s Code of Conduct and
promotes certainty in relation to all our stakeholders that
predictability and reliability are the norm when dealing with
Welltec. It is our policy to comply with all laws, rules and regu-
lations applicable to our business and we strive to follow the
course of action leading to the highest degree of integrity in
situations where the law may be permissive.
Implementation
Integrity and ethical conduct is a fundamental part of man-
agement procedures and Welltec´s Code of Conduct and is
an underlying driver in all we do. The methods we employ to
attain results are as important as the results themselves.

10 / MANAGEMENT COMMENTARYWELLTEC® ANNUAL REPORT 2016
Welltec employees are expected to perform their work with
honesty, truthfulness and integrity, and conduct their business
affairs fairly. All employees are responsible for the immediate
and accurate reporting to higher management of work-related
information of importance to the governing guidelines. We
strongly encourage dialogue to make each other aware of
situations that give rise to ethical questions and to articulate
acceptable ways of handling those situations.
Key Results in 2016 and Future Plans
With the development of the Code of Conduct came also
a training program for all existing employees. The training
program was continued as mandatory for all new employees
during their onboarding process.
To the extent deemed relevant, Welltec has performed appro-
priate internal investigations into possible non-ethical behavior
by employees following internal controls or whistle-blowing.
We have in continuation of the investigative findings applied
consequences towards the employees when relevant and
further strengthened internal communication in respect of
compliance programs.
To improve our efforts to facilitate sound business ethics, we
emphasize the use of our whistle-blower program. One case
has been submitted. It was not substantiated, why no reme-
dial actions have been initiated.
We have further developed and implemented an anti-trust
training program for all relevant employees.
Anti-Corruption
Policy
Our conviction to uphold ethical standards in all our corporate
activities is a common mindset of all our employees and we
strive to do business with customers and suppliers of sound
business character and reputation. We have strict guidelines
covering facilitation payments, bribery, entertainment and
gifts, and our screening processes provide full transparency to
mitigate the risk of corruption.
Implementation
Welltec maintains a general Partner Screening Program ap-
plicable for agents, representatives and joint venture partners
in territories where transparency and corruption are imminent
issues. This comprise of questionnaire combined with a review
process under which a potential partner is vetted for undue
relationships and channels of influence.
Furthermore, Welltec operates a zero-tolerance policy towards
corruptive behavior of employees and representatives.
Each year we prompt all employees to read the Code of Con-
duct including the sections on anti-corruption. The review is
monitored by the Legal Department.
Key Results in 2016 and Future Plans
Five partner screening were performed in 2016 and the part-
nerships were endorsed.
We have strengthened our screening abilities by the applica-
tion of external screening partners and their databases.
We have further developed and initiated our Anti-Bribery and
Corruption program. We continue to improve the screening

11 MANAGEMENT COMMENTARY / WELLTEC® ANNUAL REPORT 2016
procedures, review processes and further incorporate addi-
tional initiatives based on US and UK anti-corruption legisla-
tion, including incorporating appropriate measures in our
contracts. We also carry on screening vendors. Furthermore,
we continue to monitor the initiatives and guidelines issued by
OECD (Organization for Economic Cooperation and Develop-
ment), Transparency International and other relevant bodies to
identify policies and procedures that could improve our anti-
corruption measures.
We strongly oppose facilitation payments. However, facili-
tation payments are still a challenge to some parts of our
business, and we continue to train our employees in how to
handle these situations and avoid facilitation payments. We
focus in particular on employees in high risk countries and
where interaction with public authorities is frequent.
Health, Safety and Environment (HSE)
Policy
Our paramount concern is the health and safety of our em-
ployees, customers and everyone else that comes into contact
with our activities. This concern reaches far beyond such
measures required under applicable law. Health and safety
underpins all our operations and we continuously monitor HSE
performance and work to identify improvement initiatives.
All our employees are aware that the health and safety of peo-
ple and protection of the environment is an absolute priority.
We strive to continuously improve our environmental perfor-
mance by efficient waste management, maintenance manage-
ment, recycling programs and the prevention of pollution from
our activities. Our lightweight solutions are based on a vision
to improve safety while reducing environmental risks, fuel con-
sumption and carbon footprint. Respect for and preservation
of the environment is a key element of our business proposi-
tion and as such an integrated way of thinking in Welltec.
The company does not have a separate climate policy, because
the company’s business model in itself implies less use of en-
ergy and focuses on sustainability.
Implementation
HSE is an integral part of decision-making, processes and
training. Comprehensive incident reporting systems are in
place to review and address:
∙ Any injury or near miss in relation to our activities. Perfor-
mance statistics are kept and analyzed to ensure adop-
tion of best practices protecting the health and safety of
individuals.
∙ Any unintentional discharge into the environment of dam-
aging substances or near misses in relation to one of our
operations. These are carefully analyzed to ensure adoption
of best practices in order to protect the environment to the
benefit of us all.
Weekly corporate management meetings are opened with a
review on any health and safety issues which may have oc-
curred. All locations have an HSE Officer employed to lead the
HSE effort, ensure compliance with Welltec’s policies and local
legislation and conduct monthly meetings where all employ-
ees are required to attend.

12 / MANAGEMENT COMMENTARYWELLTEC® ANNUAL REPORT 2016
Senior level management commitment is displayed by ac-
tive participation of the CEO and select, senior management
members in a QHSE Committee that reviews direction and
implementation.
In 2015, the QHSE Community was formed to link the activi-
ties of Corporate QHSE with those in the regions. It also acts
as a link between the core company directives and their imple-
mentation in the regions.
All new hires attend an HSE introduction program and partici-
pate in a Safety Card Observation Program (SCOP) to report
on and proactively encourage safe working practices.
Welltec’s facilities are audited by the relevant government au-
thority. At any local operation, we ensure that respect for the
environment is applied such that sustainability and recycling is
promoted and secured to the greatest extent reasonably pos-
sible, while at the same time closely monitoring consumption
of chemicals, waste, electricity, heat and water.
The corporate QHSE function performs internal HSE audits at
the headquarters and local bases worldwide in order to assess
the effectiveness of the internal QHSE Management System
of Welltec. The audits are the prime instrument for reviewing
the business interfaces internally between headquarters and
bases, and externally with customers to create specific action
points for the cycle of continuous improvement.
Key Results in 2016 and Future Plans
In 2016, no environmental accident occurred.
The number of recordable accidents (so-called MTO, LTI, RWC
and FTL) is decreasing together with the Total Recordable In-
cident Frequency (TRCF). The improved HSE performance was
overshadowed by the unfortunate loss of a Welltec colleague
in a helicopter crash while on duty. Even though the drivers
behind the incident were out of the control of Welltec, true
safety can be achieved by a culture, within and without, which
ensures that the safety of people and protection of the envi-
ronment is an absolute priority.
This was followed up through audits, training and the imple-
mentation of processes, designed to share knowledge and
analyze trends and root causes.
Quality
Quality is, and has always been, deeply ingrained in all pro-
cesses at Welltec. Welltec is ISO 9001 certified by “Det Norske
Veritas” (DNV), with periodic recertification audits every 3
years. The latest recertification took place during the second
quarter of 2015.
Furthermore, oil operators, service partners and authorities
perform external audits to assess Welltec’s ability to effectively
manage the hazards associated with the services provided. In
2016, Welltec Denmark was audited by DNV and the Welltec
Transformation Center in Esbjerg was ISO 9001:2008 certified.
Local bases were audited by Total, Sakhalin Energy (SEIC), BP
Halliburton, Tullow Oil and Repsol.
Employment
Policy
Welltec believes that its employees, both as individuals and as
part of a team, are the most important assets of the business.
Hence, and with due consideration to the often challeng-
ing working conditions in the field, Welltec applies measures
which ‘go beyond the norm’ to safeguard and maximize the
health and safety aspects of the employees performing their
duties.
Welltec recognizes a shared responsibility on behalf of all em-
ployees to exercise the human rights principles of mutual re-
spect and dignity in all working relationships and consequently
enforces a policy of zero tolerance with regard to harassment
or discrimination. All employees have access to the whistle-
blower system and complaints regarding discrimination can be
filed there.
Welltec adheres to a Diversity and Equal Opportunity Employ-
ment Policy approved by the Board of Directors in 2014. The
policy formalizes our commitment to always choosing the best
person for the job regardless of that person’s race, color, reli-
gion, disability, gender, sexual orientation, age or nationality.
Furthermore, Welltec will actively work to increase the share of
females in management positions, for example, by putting the
needed extra effort into identifying relevant female candidates
when recruiting.

13 MANAGEMENT COMMENTARY / WELLTEC® ANNUAL REPORT 2016
Implementation
Welltec actively recruits employees from many sources, includ-
ing first-tier academic institutions as well as leading compa-
nies in the industry, depending on the requirements of a given
position. A variety of objective profiling tools are used to help
assess the candidates. Furthermore, we actively encourage
mobility and career progression within Welltec.
Welltec operates an extensive in-house training program
covering core operational aspects as well as sales skills and
programs aimed at legal compliance. Participation is registered
and tracked in the HR system, enabling on-going identification
of training needs and supporting work-force planning.
For long-term ill employees, we work closely and actively with
local authorities and community centers in order to define
individual solutions, including definition of flex jobs (perma-
nently reduced work time), temporarily reduced work time,
redefinition of work area, etc.
Our Workforce
The employee population is very diverse with respect to na-
tionalities, reflecting the truly global nature of the company.
As such there are around 50 nationalities employed in Welltec.
As is common in the oil and gas industry, the share of females
is low in Welltec. Women make up 14% of the total em-
ployee population which is an increase of 2 percentage points
compared to 2015. Of management level employees women
make up 10% which is also an increase of 2 percentage points
compared to 2015. As stated in the section of policies, Welltec
actively works to increase the share of females in management
positions for example by putting the needed extra efforts into
identifying relevant female candidates when recruiting. The
recent numbers show that these measures have proven to be
successful.
Key Results in 2016 and Future Plans
2016 has seen significant focus throughout the organization
on the central importance of our employees as Welltec works
towards its mission of transforming the up-stream oil and gas
industry.
The third global survey of Employee Motivation and Satisfac-
tion was carried out in the spring of 2016 with the aim of
understanding the current state of our employee group as well
as identifying areas improvements to improve motivation. The
survey was well received with 83% of employees respond-
ing, a minor decrease from 2016. The survey showed that in
spite of a challenging year 83% of the employees are proud to
work in Welltec, and 64% of the employees are excited about
their future career in Welltec. The average job satisfaction is
3.9 on a scale from 1 to 5 which is a slight decrease from 4.0
compared to 2015.
There has been no cases reported in the whistleblower system
regarding discrimination or harassment.
In 2016 Welltec has continued to focus on registration and
tracking of employee skills and competencies. All internal
courses and Welltec operational experience are captured in
the HR database as well as the majority of our employees’ pre-
vious job experience, education and participation in external
courses. This enables improved performance in areas such as
operational planning and mobility.
Women make up 10% of employees in management posi-
tions, which is a minor increase (2015: 8.7%). This thus shows
the results of the efforts made to increase the share of women
in management positions. In December 2015, the first woman
was elected to the Board of Directors and as such the target
of having at least one female member of the Board of Direc-
tors by April 1st 2017 was reached. The Board consists of four
members elected by the shareholders.
14 / MANAGEMENT COMMENTARYWELLTEC® ANNUAL REPORT 2016
Customers
Policy
Welltec views customers as business partners and pursues an
open and transparent relationship characterized by frequent
dialogue and a focus on serving their best interests.
It is our policy to provide solutions that excel in quality, con-
form to industry best practice, and adhere to responsible stan-
dards of performance, including taking due care and consid-
eration to protection of the environment and the health and
safety of all people involved.
We operate an open door policy in situations where a custom-
er or regulatory body wishes to investigate a non-successful
operation or an issue of regulatory non-compliance. All non-
optimal or non-compliant findings from the internal Welltec
investigation are openly disclosed to achieve maximum trans-
parency and optimal lessons learned.
Implementation
In certain situations, a failure investigation is initiated to
ensure:
∙ that investigations requested by the clients are performed.
∙ that conformed and controlled methods are followed when
handling misruns, covering from job planning, equipment,
procedures, communication to human factors.
∙ lessons learned are properly communicated throughout the
organization in order to minimize the risk of re-occurrence.
∙ A failure report is prepared on a timely manner for the cli-
ent, prior to officially closing the investigation.
Key Results in 2016 and Future Plans
Welltec’s corporate QHSE department continuing its involve-
ment, to ensure the highest standards are applied to match
heightened expectations from customers as the scope and
complexity of services increase. An improved quality related
investigation procedure was implemented and put into prac-
tice to streamline the process. The Number of investigations,
which required involvement from corporate QHSE depart-
ment, has decreased in 2016 compared to 2015.
A global training program continues to increase expertise in
the use of our operational planning software to ensure con-
tinuous improvement of service quality on jobs performed.
The program underlines the constant focus on maintaining the
very highest levels of service quality and is reflected in the con-
tinued service quality delivery at or above 96%. Although, this
is a high percentage, we strive to reach a higher level.
Community
Policy
At Welltec, we inherently share a responsibility that reaches
beyond our immediate business and has an impact on the
interests of all our stakeholders. These encompass not only
our shareholders but also our customers, employees, suppliers,
the local communities in which we operate, as well as the sur-
rounding environment and the human beings occupying it.
Improving the environment in and around our operations is
an integral part of our business. We operate from a significant
number of properties in a variety of countries, and we have
responsibility to our employees, to the people living and work-
ing nearby as well as the environment. It is our policy there-
fore to engage with the local community as both a neighbor
and resident and support efforts to improve the local area, for
example by addressing antisocial behavior, crime and vandal-
ism as well as promoting road safety.
Implementation and Future Plans
We actively promote engagement between our staff and the
community, supporting local community-based projects and
charities, including fund-raising and initiatives for the develop-
ment and education of young people in the areas where we
operate.

15 MANAGEMENT COMMENTARY / WELLTEC® ANNUAL REPORT 2016
WE INHERENTLY SHARE
A RESPONSIBILITY THAT REACHES BEYOND OUR IMMEDIATE
BUSINESS

16 / MANAGEMENT COMMENTARYWELLTEC® ANNUAL REPORT 2016
Company Welltec International ApS
Gydevang 25
3450 Allerød
Denmark
Phone: +45 48 14 35 14
Fax: +45 48 14 35 18
Website: www.welltec.com
E-mail: [email protected]
Central Business Registration No: 30 69 50 03
Registered in: Allerød
Financial year: January 1, 2016 – December 31, 2016
Executive Board Jørgen Hallundbæk, Chief Executive Officer
Board of Directors Niels Harald De Coninck-Smith, Chairman
Annalisa Stupenengo
Jørgen Hallundbæk
Michael Bricker
Company auditors PricewaterhouseCoopers Statsautoriseret Revisionspartnerselskab
COMPANY DETAILS

17 MANAGEMENT COMMENTARY / WELLTEC® ANNUAL REPORT 2016
STATEMENT BY MANAGEMENT ON THE ANNUAL REPORT
We have today considered and approved the annual report
of Welltec International ApS for the financial year January 1,
2016 to December 31, 2016.
The consolidated financial statements and parent financial
statements are prepared in accordance with International Fi-
nancial Reporting Standards as adopted by the EU and further
requirements in the Danish Financial Statement act.
In our opinion, the consolidated financial statements and the
parent financial statements give a true and fair view of the
group’s and the parent’s financial position at December 31,
2016 as well as of their financial performance and their cash
flows for the financial year January 1, 2016, to December 31,
2016.
We also believe that the management commentary contains a
fair review of the development of the group’s and the parent
company’s activities and financial position, together with a de-
scription of the principal risks and uncertainties that the group
and the parent company face.
We recommend the annual report for adoption at the Annual
General Meeting.
Allerød, March 30, 2017
Executive Board:
Jørgen Hallundbæk
Chief Executive Officer
Board of Directors:
Niels Harald De Coninck-Smith Jørgen Hallundbæk
Chairman
Annalisa Stupenengo Michael Bricker

18 / MANAGEMENT COMMENTARYWELLTEC® ANNUAL REPORT 2016
INDEPENDENT AUDITOR’S REPORTS
To the shareholders of Welltec International ApS
Opinion
In our opinion, the Consolidated Financial Statements and the
Parent Company Financial Statements give a true and fair view
of the Group’s and the Parent Company’s financial position at
31 December 2016 and of the results of the Group’s and the
Parent Company’s operations and cash flows for the financial
year 1 January to 31 December 2016 in accordance with Inter-
national Financial Reporting Standards as adopted by the EU
and further requirements in the Danish Financial Statements
Act.
We have audited the Consolidated Financial Statements and
the Parent Company Financial Statements of Welltec Inter-
national ApS for the financial year 1 January - 31 December
2016, which comprise statement of comprehensive income,
statement of financial position, statement of changes in eq-
uity, statement of cash flows and notes, including a summary
of significant accounting policies, for both the Group and the
Parent Company (“financial statements”).
Basis for Opinion
We conducted our audit in accordance with International
Standards on Auditing (ISAs) and the additional requirements
applicable in Denmark. Our responsibilities under those stan-
dards and requirements are further described in the Auditor’s
Responsibilities for the Audit of the Financial Statements sec-
tion of our report. We are independent of the Group in ac-
cordance with the International Ethics Standards Board for Ac-
countants’ Code of Ethics for Professional Accountants (IESBA
Code) and the additional requirements applicable in Denmark,
and we have fulfilled our other ethical responsibilities in ac-
cordance with these requirements. We believe that the audit
evidence we have obtained is sufficient and appropriate to
provide a basis for our opinion.
Statement on Management Commentary
Management is responsible for the Management
Commentary.
Our opinion on the financial statements does not cover the
Management Commentary, and we do not express any form
for assurance conclusion thereon.
In connection with our audit of the financial statements, our
responsibility is to read the Management Commentary and,
in doing so, consider whether the Management Commentary
is materially inconsistent with the financial statements or our
knowledge obtained during the audit, or otherwise appears to
be materially misstated.
Moreover, it is our responsibility to consider whether the
Management Commentary provides the information required
under the Danish Financial Statements Act.
Based on the work we have performed, in our view, the
Management Commentary is in accordance with the Financial
Statements and has been prepared in accordance with the
requirements of the Danish Financial Statements Act. We did
not identify any material misstatement in the Management
Commentary.
Management’s Responsibilities for the Financial Statements
Management is responsible for the preparation of Consoli-
dated Financial Statements and Parent Company Financial
Statements that give a true and fair view in accordance with
International Financial Reporting Standards as adopted by the
EU and further requirements in the Danish Financial State-
ments Act, and for such internal control as Management
determines is necessary to enable the preparation of financial
statements that are free from material misstatement, whether
due to fraud or error.
In preparing the financial statements, Management is respon-
sible for assessing the Group’s and the Parent Company’s abil-
ity to continue as a going concern, disclosing, as applicable,
matters related to going concern and using the going concern
basis of accounting in preparing the financial statements un-
less Management either intends to liquidate the Group or the
Parent Company or to cease operations, or has no realistic
alternative but to do so.
WELLTEC® ANNUAL REPORT 2016 FINANCIAL STATEMENTS / 19
Copenhagen, March 30, 2017
PricewaterhouseCoopers Statsautoriseret Revisionspartnerselskab Central Business Registration No. 33 77 12 31
Mikkel Sthyr Tue Stensgård Sørensen State Authorized State Authorized Public Accountant Public Accountant
Auditor’s Responsibilities for the Audit of the Financial
Statements
Our objectives are to obtain reasonable assurance about
whether the financial statements as a whole are free from
material misstatement, whether due to fraud or error, and to
issue an auditor’s report that includes our opinion. Reasonable
assurance is a high level of assurance, but is not a guarantee
that an audit conducted in accordance with ISAs and the addi-
tional requirements applicable in Denmark will always detect a
material misstatement when it exists. Misstatements can arise
from fraud or error and are considered material if, individu-
ally or in the aggregate, they could reasonably be expected to
influence the economic decisions of users taken on the basis
of these financial statements.
As part of an audit conducted in accordance with ISAs and the
additional requirements applicable in Denmark, we exercise
professional judgment and maintain professional skepticism
throughout the audit. We also:
∙ Identify and assess the risks of material misstatement of the
financial statements, whether due to fraud or error, design
and perform audit procedures responsive to those risks,
and obtain audit evidence that is sufficient and appropriate
to provide a basis for our opinion. The risk of not detecting
a material misstatement resulting from fraud is higher than
for one resulting from error as fraud may involve collusion,
forgery, intentional omissions, misrepresentations, or the
override of internal control.
∙ Obtain an understanding of internal control relevant to
the audit in order to design audit procedures that are ap-
propriate in the circumstances, but not for the purpose of
expressing an opinion on the effectiveness of the Group’s
and the Parent Company’s internal control.
∙ Evaluate the appropriateness of accounting policies used
and the reasonableness of accounting estimates and re-
lated disclosures made by Management.
∙ Conclude on the appropriateness of Management’s use
of the going concern basis of accounting in preparing the
financial statements and, based on the audit evidence
obtained, whether a material uncertainty exists related to
events or conditions that may cast significant doubt on the
Group’s and the Parent Company’s ability to continue as a
going concern. If we conclude that a material uncertainty
exists, we are required to draw attention in our auditor’s re-
port to the related disclosures in the financial statements or,
if such disclosures are inadequate, to modify our opinion.
Our conclusions are based on the audit evidence obtained
up to the date of our auditor’s report. However, future
events or conditions may cause the Group and the Parent
Company to cease to continue as a going concern.
∙ Evaluate the overall presentation, structure and contents
of the financial statements, including the disclosures, and
whether the financial statements represent the underlying
transactions and events in a manner that gives a true and
fair view.
∙ Obtain sufficient appropriate audit evidence regarding the
financial information of the entities or business activities
within the Group to express an opinion on the Consolidat-
ed Financial Statements. We are responsible for the direc-
tion, supervision and performance of the group audit. We
remain solely responsible for our audit opinion.
We communicate with those charged with governance re-
garding, among other matters, the planned scope and timing
of the audit and significant audit findings, including any sig-
nificant deficiencies in internal control that we identify during
our audit.
20 WELLTEC® ANNUAL REPORT 2016 / FINANCIAL STATEMENTS
FINANCIAL STATEMENTS
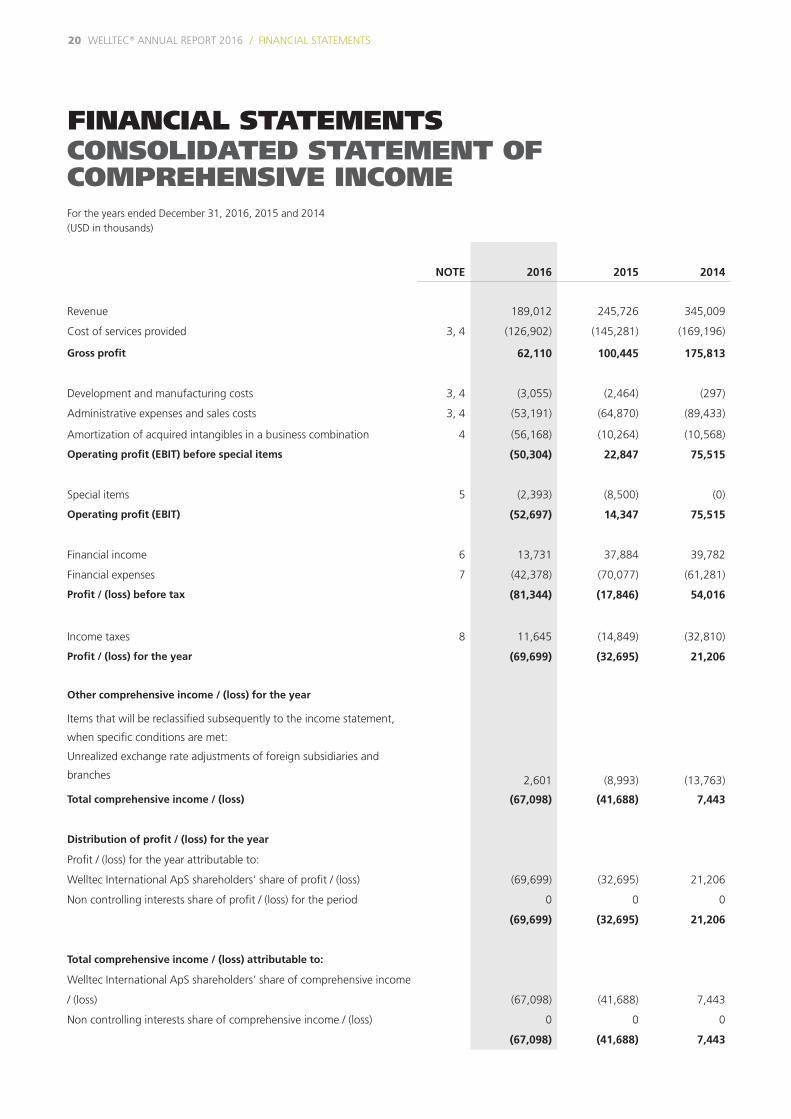
For the years ended December 31, 2016, 2015 and 2014 (USD in thousands)
NOTE 2016 2015 2014
Revenue 189,012 245,726 345,009
Cost of services provided 3, 4 (126,902) (145,281) (169,196)
Gross profit 62,110 100,445 175,813
Development and manufacturing costs 3, 4 (3,055) (2,464) (297)
Administrative expenses and sales costs 3, 4 (53,191) (64,870) (89,433)
Amortization of acquired intangibles in a business combination 4 (56,168) (10,264) (10,568)
Operating profit (EBIT) before special items (50,304) 22,847 75,515
Special items 5 (2,393) (8,500) (0)
Operating profit (EBIT) (52,697) 14,347 75,515
Financial income 6 13,731 37,884 39,782
Financial expenses 7 (42,378) (70,077) (61,281)
Profit / (loss) before tax (81,344) (17,846) 54,016
Income taxes 8 11,645 (14,849) (32,810)
Profit / (loss) for the year (69,699) (32,695) 21,206
Other comprehensive income / (loss) for the year
Items that will be reclassified subsequently to the income statement,
when specific conditions are met:
Unrealized exchange rate adjustments of foreign subsidiaries and
branches 2,601 (8,993) (13,763)
Total comprehensive income / (loss) (67,098) (41,688) 7,443
Distribution of profit / (loss) for the year
Profit / (loss) for the year attributable to:
Welltec International ApS shareholders’ share of profit / (loss) (69,699) (32,695) 21,206
Non controlling interests share of profit / (loss) for the period 0 0 0
(69,699) (32,695) 21,206
Total comprehensive income / (loss) attributable to:
Welltec International ApS shareholders’ share of comprehensive income
/ (loss) (67,098) (41,688) 7,443
Non controlling interests share of comprehensive income / (loss) 0 0 0
(67,098) (41,688) 7,443
CONSOLIDATED STATEMENT OF COMPREHENSIVE INCOME
WELLTEC® ANNUAL REPORT 2016 FINANCIAL STATEMENTS / 21
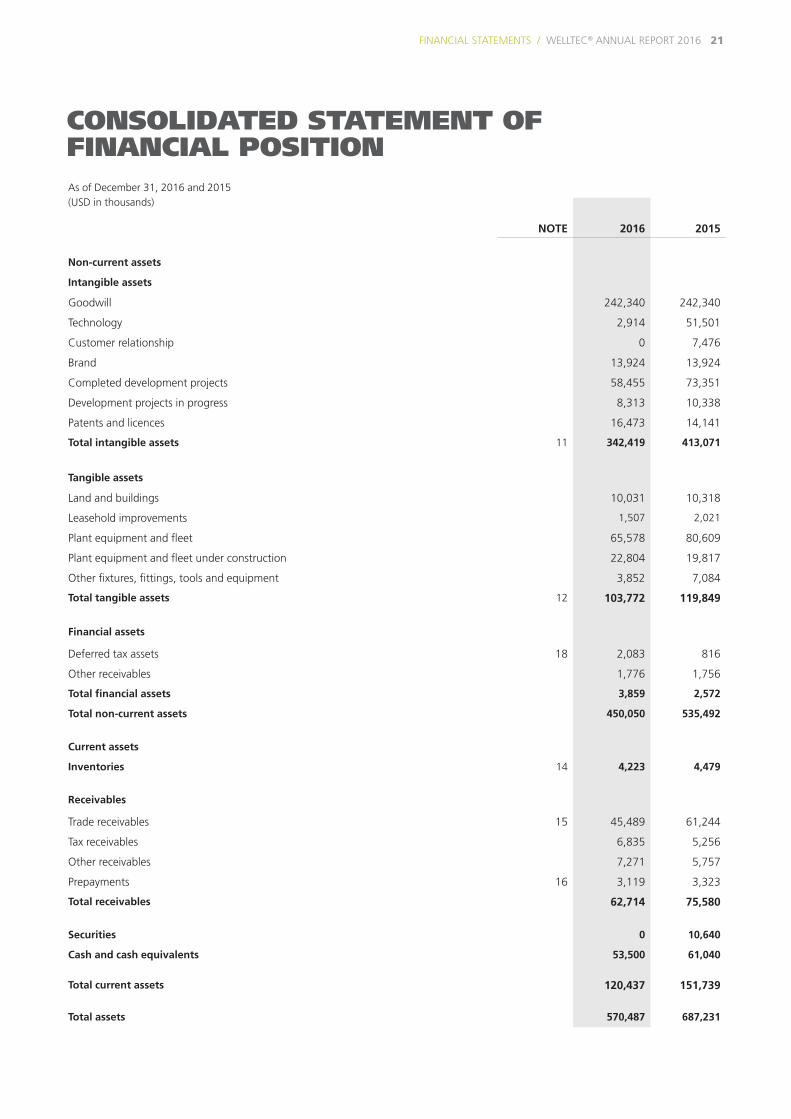
As of December 31, 2016 and 2015(USD in thousands)
NOTE 2016 2015
Non-current assets
Intangible assets
Goodwill 242,340 242,340
Technology 2,914 51,501
Customer relationship 0 7,476
Brand 13,924 13,924
Completed development projects 58,455 73,351
Development projects in progress 8,313 10,338
Patents and licences 16,473 14,141
Total intangible assets 11 342,419 413,071
Tangible assets
Land and buildings 10,031 10,318
Leasehold improvements 1,507 2,021
Plant equipment and fleet 65,578 80,609
Plant equipment and fleet under construction 22,804 19,817
Other fixtures, fittings, tools and equipment 3,852 7,084
Total tangible assets 12 103,772 119,849
Financial assets
Deferred tax assets 18 2,083 816
Other receivables 1,776 1,756
Total financial assets 3,859 2,572
Total non-current assets 450,050 535,492
Current assets
Inventories 14 4,223 4,479
Receivables
Trade receivables 15 45,489 61,244
Tax receivables 6,835 5,256
Other receivables 7,271 5,757
Prepayments 16 3,119 3,323
Total receivables 62,714 75,580
Securities 0 10,640
Cash and cash equivalents 53,500 61,040
Total current assets 120,437 151,739
Total assets 570,487 687,231
CONSOLIDATED STATEMENT OF FINANCIAL POSITION

22 WELLTEC® ANNUAL REPORT 2016 / FINANCIAL STATEMENTS
As of December 31, 2016 and 2015(USD in thousands)
NOTE 2016 2015
Equity
Share capital 17 850 835
Currency translation reserve (32,990) (35,591)
Retained earnings 209,180 277,249
Total equity 177,040 242,493
Non-current liabilities
Deferred tax liabilities 18 24,778 44,060
Finance lease commitments 19 7,465 8,011
Issued bonds 19 293,241 309,948
Bank debt 19 26,029 26,813
Total non-current liabilities 351,513 388,832
Current liabilities
Current portion of non-current liabilities 19 1,398 1,357
Trade payables 8,354 12,111
Current tax liabilities 4,228 7,256
Other payables 20 27,954 35,182
Total current liabilities 41,934 55,906
Total liabilities 393,447 444,738
Total equity and liabilities 570,487 687,231
CONSOLIDATED STATEMENT OF FINANCIAL POSITION
WELLTEC® ANNUAL REPORT 2016 FINANCIAL STATEMENTS / 23
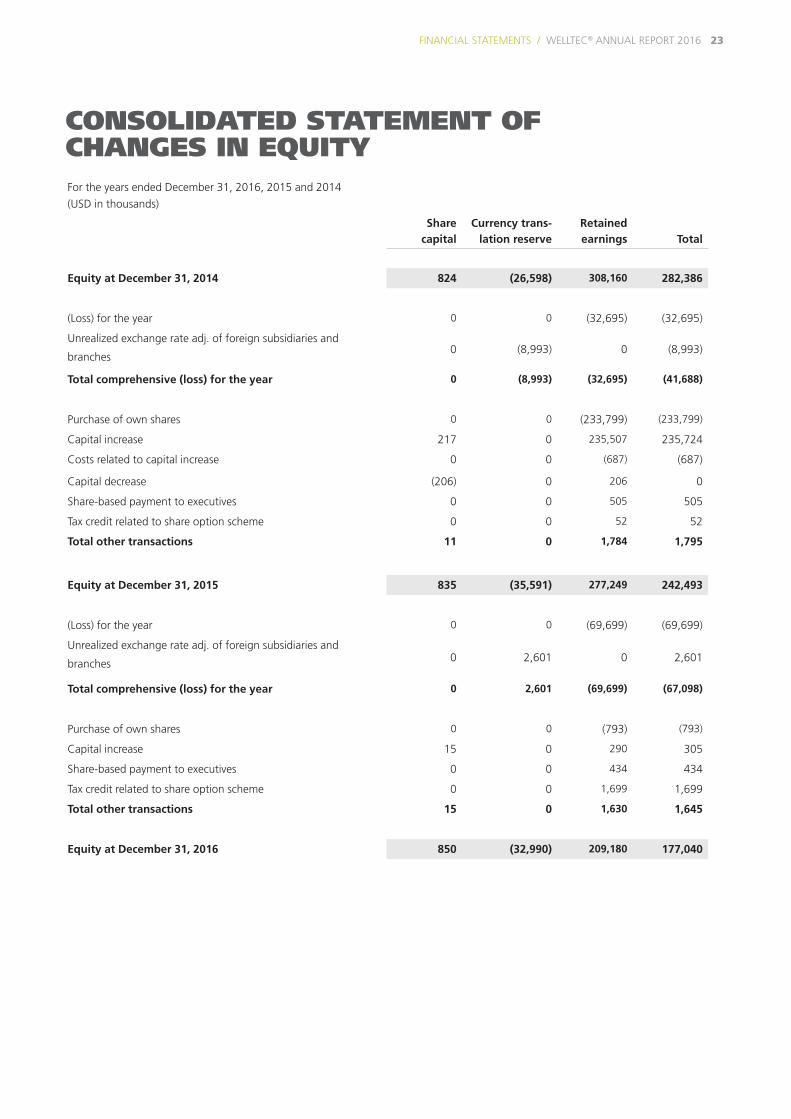
For the years ended December 31, 2016, 2015 and 2014
(USD in thousands)
Share capital
Currency trans-lation reserve
Retained earnings Total
Equity at December 31, 2014 824 (26,598) 308,160 282,386
(Loss) for the year 0 0 (32,695) (32,695)
Unrealized exchange rate adj. of foreign subsidiaries and
branches0 (8,993) 0 (8,993)
Total comprehensive (loss) for the year 0 (8,993) (32,695) (41,688)
Purchase of own shares 0 0 (233,799) (233,799)
Capital increase 217 0 235,507 235,724
Costs related to capital increase 0 0 (687) (687)
Capital decrease (206) 0 206 0
Share-based payment to executives 0 0 505 505
Tax credit related to share option scheme 0 0 52 52
Total other transactions 11 0 1,784 1,795
Equity at December 31, 2015 835 (35,591) 277,249 242,493
(Loss) for the year 0 0 (69,699) (69,699)
Unrealized exchange rate adj. of foreign subsidiaries and
branches 0 2,601 0 2,601
Total comprehensive (loss) for the year 0 2,601 (69,699) (67,098)
Purchase of own shares 0 0 (793) (793)
Capital increase 15 0 290 305
Share-based payment to executives 0 0 434 434
Tax credit related to share option scheme 0 0 1,699 1,699
Total other transactions 15 0 1,630 1,645
Equity at December 31, 2016 850 (32,990) 209,180 177,040
CONSOLIDATED STATEMENT OF CHANGES IN EQUITY
24 WELLTEC® ANNUAL REPORT 2016 / FINANCIAL STATEMENTS
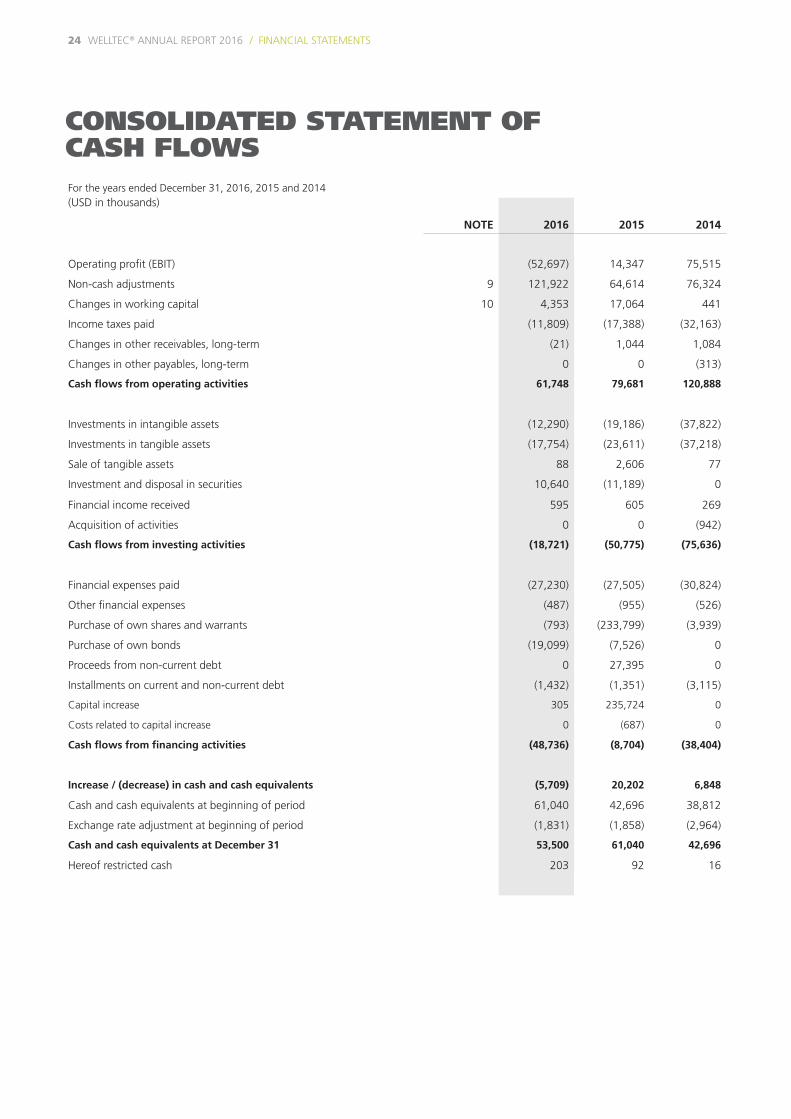
For the years ended December 31, 2016, 2015 and 2014 (USD in thousands)
NOTE 2016 2015 2014
Operating profit (EBIT) (52,697) 14,347 75,515
Non-cash adjustments 9 121,922 64,614 76,324
Changes in working capital 10 4,353 17,064 441
Income taxes paid (11,809) (17,388) (32,163)
Changes in other receivables, long-term (21) 1,044 1,084
Changes in other payables, long-term 0 0 (313)
Cash flows from operating activities 61,748 79,681 120,888
Investments in intangible assets (12,290) (19,186) (37,822)
Investments in tangible assets (17,754) (23,611) (37,218)
Sale of tangible assets 88 2,606 77
Investment and disposal in securities 10,640 (11,189) 0
Financial income received 595 605 269
Acquisition of activities 0 0 (942)
Cash flows from investing activities (18,721) (50,775) (75,636)
Financial expenses paid (27,230) (27,505) (30,824)
Other financial expenses (487) (955) (526)
Purchase of own shares and warrants (793) (233,799) (3,939)
Purchase of own bonds (19,099) (7,526) 0
Proceeds from non-current debt 0 27,395 0
Installments on current and non-current debt (1,432) (1,351) (3,115)
Capital increase 305 235,724 0
Costs related to capital increase 0 (687) 0
Cash flows from financing activities (48,736) (8,704) (38,404)
Increase / (decrease) in cash and cash equivalents (5,709) 20,202 6,848
Cash and cash equivalents at beginning of period 61,040 42,696 38,812
Exchange rate adjustment at beginning of period (1,831) (1,858) (2,964)
Cash and cash equivalents at December 31 53,500 61,040 42,696
Hereof restricted cash 203 92 16
CONSOLIDATED STATEMENT OF CASH FLOWS
WELLTEC® ANNUAL REPORT 2016 FINANCIAL STATEMENTS / 25
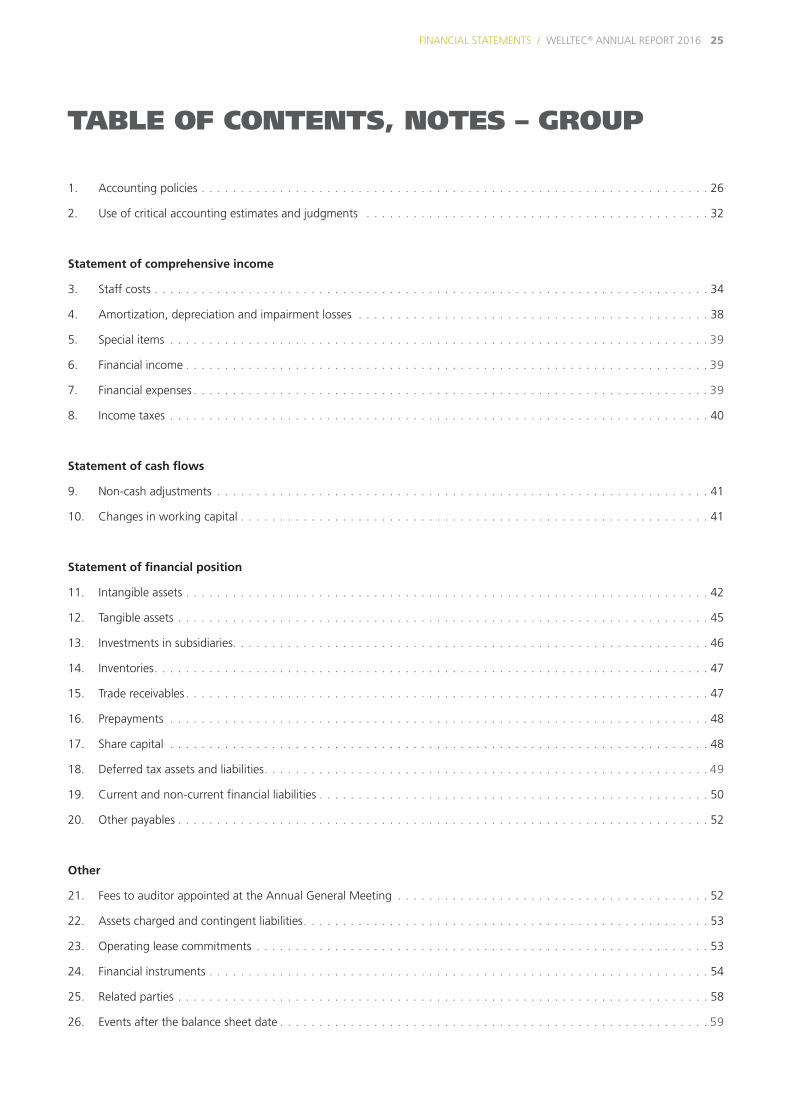
TABLE OF CONTENTS, NOTES – GROUP
1. Accounting policies . . . . . . . . . . . . . . . . . . . . . . . . . . . . . . . . . . . . . . . . . . . . . . . . . . . . . . . . . . . . . . . . . 26
2. Use of critical accounting estimates and judgments . . . . . . . . . . . . . . . . . . . . . . . . . . . . . . . . . . . . . . . . . . . . 32
Statement of comprehensive income
3. Staff costs . . . . . . . . . . . . . . . . . . . . . . . . . . . . . . . . . . . . . . . . . . . . . . . . . . . . . . . . . . . . . . . . . . . . . . . 34
4. Amortization, depreciation and impairment losses . . . . . . . . . . . . . . . . . . . . . . . . . . . . . . . . . . . . . . . . . . . . . 38
5. Special items . . . . . . . . . . . . . . . . . . . . . . . . . . . . . . . . . . . . . . . . . . . . . . . . . . . . . . . . . . . . . . . . . . . . . 39
6. Financial income . . . . . . . . . . . . . . . . . . . . . . . . . . . . . . . . . . . . . . . . . . . . . . . . . . . . . . . . . . . . . . . . . . . 39
7. Financial expenses . . . . . . . . . . . . . . . . . . . . . . . . . . . . . . . . . . . . . . . . . . . . . . . . . . . . . . . . . . . . . . . . . . 39
8. Income taxes . . . . . . . . . . . . . . . . . . . . . . . . . . . . . . . . . . . . . . . . . . . . . . . . . . . . . . . . . . . . . . . . . . . . . 40
Statement of cash flows
9. Non-cash adjustments . . . . . . . . . . . . . . . . . . . . . . . . . . . . . . . . . . . . . . . . . . . . . . . . . . . . . . . . . . . . . . . 41
10. Changes in working capital . . . . . . . . . . . . . . . . . . . . . . . . . . . . . . . . . . . . . . . . . . . . . . . . . . . . . . . . . . . . 41
Statement of financial position
11. Intangible assets . . . . . . . . . . . . . . . . . . . . . . . . . . . . . . . . . . . . . . . . . . . . . . . . . . . . . . . . . . . . . . . . . . . 42
12. Tangible assets . . . . . . . . . . . . . . . . . . . . . . . . . . . . . . . . . . . . . . . . . . . . . . . . . . . . . . . . . . . . . . . . . . . . 45
13. Investments in subsidiaries. . . . . . . . . . . . . . . . . . . . . . . . . . . . . . . . . . . . . . . . . . . . . . . . . . . . . . . . . . . . . 46
14. Inventories . . . . . . . . . . . . . . . . . . . . . . . . . . . . . . . . . . . . . . . . . . . . . . . . . . . . . . . . . . . . . . . . . . . . . . . 47
15. Trade receivables . . . . . . . . . . . . . . . . . . . . . . . . . . . . . . . . . . . . . . . . . . . . . . . . . . . . . . . . . . . . . . . . . . . 47
16. Prepayments . . . . . . . . . . . . . . . . . . . . . . . . . . . . . . . . . . . . . . . . . . . . . . . . . . . . . . . . . . . . . . . . . . . . . 48
17. Share capital . . . . . . . . . . . . . . . . . . . . . . . . . . . . . . . . . . . . . . . . . . . . . . . . . . . . . . . . . . . . . . . . . . . . . 48
18. Deferred tax assets and liabilities . . . . . . . . . . . . . . . . . . . . . . . . . . . . . . . . . . . . . . . . . . . . . . . . . . . . . . . . . 49
19. Current and non-current financial liabilities . . . . . . . . . . . . . . . . . . . . . . . . . . . . . . . . . . . . . . . . . . . . . . . . . . 50
20. Other payables . . . . . . . . . . . . . . . . . . . . . . . . . . . . . . . . . . . . . . . . . . . . . . . . . . . . . . . . . . . . . . . . . . . . 52
Other
21. Fees to auditor appointed at the Annual General Meeting . . . . . . . . . . . . . . . . . . . . . . . . . . . . . . . . . . . . . . . . 52
22. Assets charged and contingent liabilities . . . . . . . . . . . . . . . . . . . . . . . . . . . . . . . . . . . . . . . . . . . . . . . . . . . . 53
23. Operating lease commitments . . . . . . . . . . . . . . . . . . . . . . . . . . . . . . . . . . . . . . . . . . . . . . . . . . . . . . . . . . 53
24. Financial instruments . . . . . . . . . . . . . . . . . . . . . . . . . . . . . . . . . . . . . . . . . . . . . . . . . . . . . . . . . . . . . . . . 54
25. Related parties . . . . . . . . . . . . . . . . . . . . . . . . . . . . . . . . . . . . . . . . . . . . . . . . . . . . . . . . . . . . . . . . . . . . 58
26. Events after the balance sheet date . . . . . . . . . . . . . . . . . . . . . . . . . . . . . . . . . . . . . . . . . . . . . . . . . . . . . . . 59

NOTES
26 WELLTEC® ANNUAL REPORT 2016 / FINANCIAL STATEMENTS
Basis of accounting
The consolidated financial statements for 2016 are presented
in accordance with International Financial Reporting Standards
(‘IFRS’) as adopted by the EU and additional Danish disclosure
requirements for annual reports of reporting class C (large) en-
terprises. Please see the Danish Executive Order on IFRS adoption
issued in accordance with the Danish Financial Statement Act.
The consolidated financial statements are presented in thousands
of US dollar (USD), which is regarded as the primary currency in
relation to the group’s activities and the functional currency of the
parent company.
The consolidated financial statements are prepared on the histori-
cal cost basis, except for certain derivative financial instruments
which are measured at fair value. The principal accounting policies
adopted are set out below.
The consolidated financial statements are presented in accordance
with the new and revised standards (IFRS/IAS) and Interpretations
(IFRIC) which apply for the financial year which had no effect on
the consolidated financial statement.
The accounting policies are unchanged compared to 2015.
Future IFRS changes
At the date of the publication of these consolidated financial
statements, a number of new and amended standards and inter-
pretations have not yet entered into force or have not yet been
adopted by the EU. Therefore, they are not incorporated in the
consolidated financial statements.
IFRS 15 “Revenue from Contracts with Customers” is effective for
annual periods beginning on or after 1 January 2018.
Welltec(R) is currently analyzing the potential effects of IFRS 15,
however, since the analysis is at a preliminary stage, it is not pos-
sible to provide an estimate of the expected consequences. The
preliminary analysis indicates that the more detailed requirements
on identifying performance obligations as well as the require-
ments on determining whether revenue should be recognized
over time or at a point in time, may to some extent affect the
timing of future revenue recognition, however it is not expected
to have any material impact on future consolidated financial
statements.
IASB has also issued IFRS 9 “Financial Instruments”. IFRS 9 “Fi-
nancial Instruments” is part of IASB’s project to replace IAS 39
“Financial Instruments: Recognition and Measurement”, and
the new standard will change the classification, presentation
and measurement of financial instruments and hedging require-
ments. Welltec is assessing the impact of the standard, but it is
not expected to have any material impact on future consolidated
financial statements.
IFRS 16 ”Leasing” is effective for annual periods beginning on or
after 1 January 2019. The standard has not yet been endorsed by
the EU.
Welltec has not begun analyzing the possible effects of IFRS 16
yet, however, as Welltec has some operating lease commitments,
IFRS 16 is expected to increase non-current assets (“Right-of-use
assets) as well as lease liabilities, and will also impact profit & loss,
cash flow statement and equity to a lesser degree.
Recognition and measurement
Assets are recognized in the statement of financial position if it is
probable that future financial benefits will flow to the group and
the value of the asset can be measured reliably.
Liabilities are recognized in the statement of financial position
if they are probable and can be measured reliably. On initial rec-
ognition assets and liabilities are measured at cost or fair value.
Subsequently assets and liabilities are measured as described for
each item below.
Income is recognized in the statement of comprehensive income
as earned and includes value adjustments of financial assets and
liabilities measured at fair value or amortized cost.
Consolidated financial statements
The consolidated financial statements comprise the parent com-
pany and the group enterprises (subsidiaries) that are controlled
by the parent company. Control is achieved where the parent
company, either directly or indirectly, holds more than 50% of the
voting rights or in any other way possibly or actually exercises con-
trolling influence over a subsidiary. If the parent company holds
less than 50% of the share capital, control exists when the parent
company under agreement has more than 50% of the voting
rights, has the power to govern financial and operating policies of
the subsidiary, to appoint members of the Board of Directors or to
cast the majority of votes at meetings of the Board of Directors of
the subsidiary.
1. ACCOUNTING POLICIES
WELLTEC® ANNUAL REPORT 2016 FINANCIAL STATEMENTS / 27
NOTES
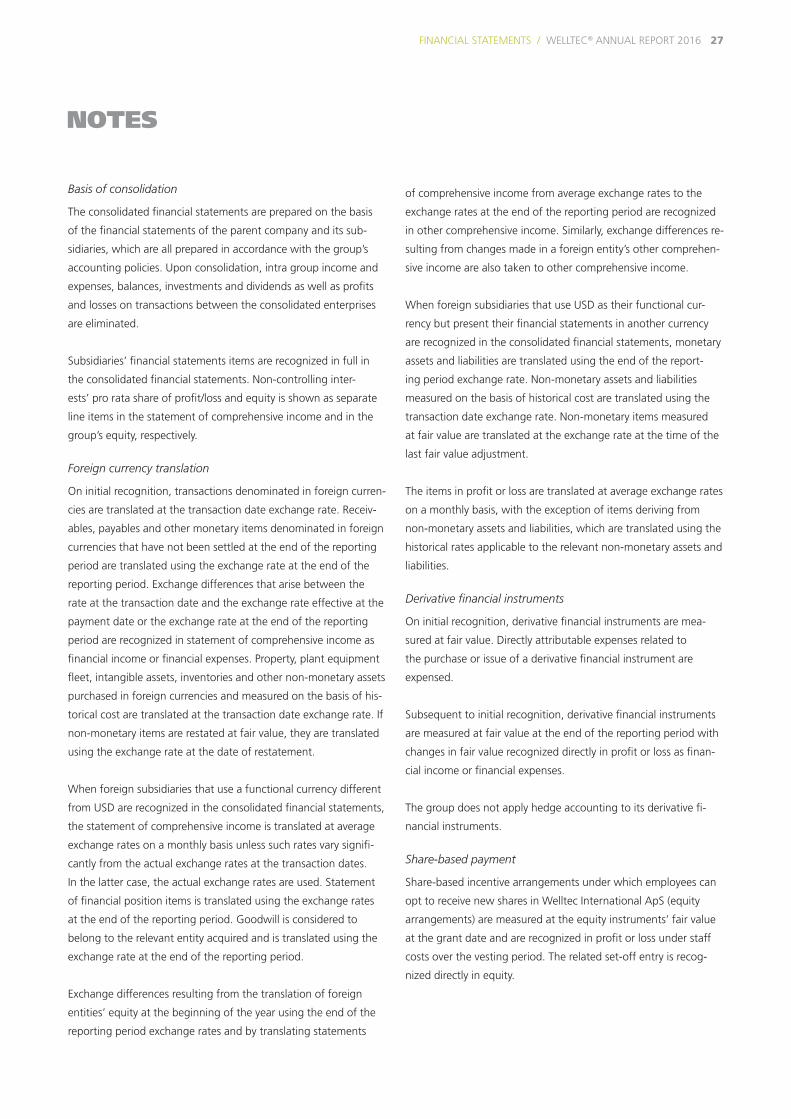
Basis of consolidation
The consolidated financial statements are prepared on the basis
of the financial statements of the parent company and its sub-
sidiaries, which are all prepared in accordance with the group’s
accounting policies. Upon consolidation, intra group income and
expenses, balances, investments and dividends as well as profits
and losses on transactions between the consolidated enterprises
are eliminated.
Subsidiaries’ financial statements items are recognized in full in
the consolidated financial statements. Non-controlling inter-
ests’ pro rata share of profit/loss and equity is shown as separate
line items in the statement of comprehensive income and in the
group’s equity, respectively.
Foreign currency translation
On initial recognition, transactions denominated in foreign curren-
cies are translated at the transaction date exchange rate. Receiv-
ables, payables and other monetary items denominated in foreign
currencies that have not been settled at the end of the reporting
period are translated using the exchange rate at the end of the
reporting period. Exchange differences that arise between the
rate at the transaction date and the exchange rate effective at the
payment date or the exchange rate at the end of the reporting
period are recognized in statement of comprehensive income as
financial income or financial expenses. Property, plant equipment
fleet, intangible assets, inventories and other non-monetary assets
purchased in foreign currencies and measured on the basis of his-
torical cost are translated at the transaction date exchange rate. If
non-monetary items are restated at fair value, they are translated
using the exchange rate at the date of restatement.
When foreign subsidiaries that use a functional currency different
from USD are recognized in the consolidated financial statements,
the statement of comprehensive income is translated at average
exchange rates on a monthly basis unless such rates vary signifi-
cantly from the actual exchange rates at the transaction dates.
In the latter case, the actual exchange rates are used. Statement
of financial position items is translated using the exchange rates
at the end of the reporting period. Goodwill is considered to
belong to the relevant entity acquired and is translated using the
exchange rate at the end of the reporting period.
Exchange differences resulting from the translation of foreign
entities’ equity at the beginning of the year using the end of the
reporting period exchange rates and by translating statements
of comprehensive income from average exchange rates to the
exchange rates at the end of the reporting period are recognized
in other comprehensive income. Similarly, exchange differences re-
sulting from changes made in a foreign entity’s other comprehen-
sive income are also taken to other comprehensive income.
When foreign subsidiaries that use USD as their functional cur-
rency but present their financial statements in another currency
are recognized in the consolidated financial statements, monetary
assets and liabilities are translated using the end of the report-
ing period exchange rate. Non-monetary assets and liabilities
measured on the basis of historical cost are translated using the
transaction date exchange rate. Non-monetary items measured
at fair value are translated at the exchange rate at the time of the
last fair value adjustment.
The items in profit or loss are translated at average exchange rates
on a monthly basis, with the exception of items deriving from
non-monetary assets and liabilities, which are translated using the
historical rates applicable to the relevant non-monetary assets and
liabilities.
Derivative financial instruments
On initial recognition, derivative financial instruments are mea-
sured at fair value. Directly attributable expenses related to
the purchase or issue of a derivative financial instrument are
expensed.
Subsequent to initial recognition, derivative financial instruments
are measured at fair value at the end of the reporting period with
changes in fair value recognized directly in profit or loss as finan-
cial income or financial expenses.
The group does not apply hedge accounting to its derivative fi-
nancial instruments.
Share-based payment
Share-based incentive arrangements under which employees can
opt to receive new shares in Welltec International ApS (equity
arrangements) are measured at the equity instruments’ fair value
at the grant date and are recognized in profit or loss under staff
costs over the vesting period. The related set-off entry is recog-
nized directly in equity.
NOTES
28 WELLTEC® ANNUAL REPORT 2016 / FINANCIAL STATEMENTS
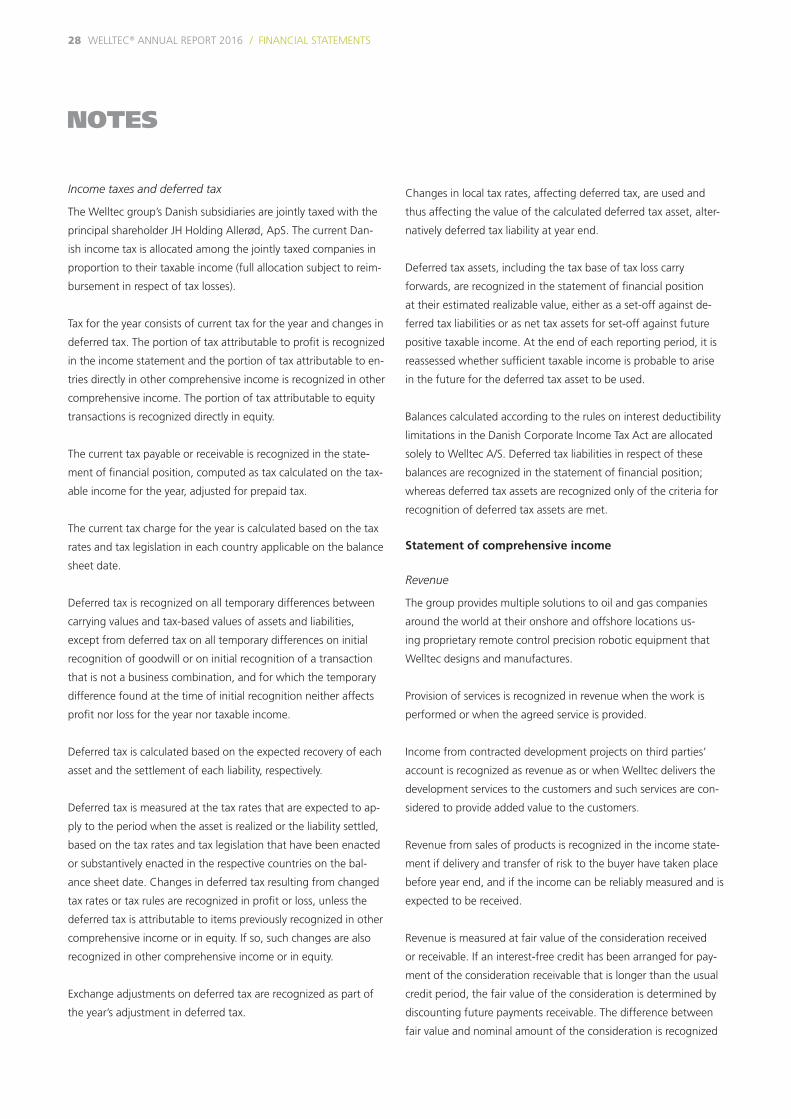
Income taxes and deferred tax
The Welltec group’s Danish subsidiaries are jointly taxed with the
principal shareholder JH Holding Allerød, ApS. The current Dan-
ish income tax is allocated among the jointly taxed companies in
proportion to their taxable income (full allocation subject to reim-
bursement in respect of tax losses).
Tax for the year consists of current tax for the year and changes in
deferred tax. The portion of tax attributable to profit is recognized
in the income statement and the portion of tax attributable to en-
tries directly in other comprehensive income is recognized in other
comprehensive income. The portion of tax attributable to equity
transactions is recognized directly in equity.
The current tax payable or receivable is recognized in the state-
ment of financial position, computed as tax calculated on the tax-
able income for the year, adjusted for prepaid tax.
The current tax charge for the year is calculated based on the tax
rates and tax legislation in each country applicable on the balance
sheet date.
Deferred tax is recognized on all temporary differences between
carrying values and tax-based values of assets and liabilities,
except from deferred tax on all temporary differences on initial
recognition of goodwill or on initial recognition of a transaction
that is not a business combination, and for which the temporary
difference found at the time of initial recognition neither affects
profit nor loss for the year nor taxable income.
Deferred tax is calculated based on the expected recovery of each
asset and the settlement of each liability, respectively.
Deferred tax is measured at the tax rates that are expected to ap-
ply to the period when the asset is realized or the liability settled,
based on the tax rates and tax legislation that have been enacted
or substantively enacted in the respective countries on the bal-
ance sheet date. Changes in deferred tax resulting from changed
tax rates or tax rules are recognized in profit or loss, unless the
deferred tax is attributable to items previously recognized in other
comprehensive income or in equity. If so, such changes are also
recognized in other comprehensive income or in equity.
Exchange adjustments on deferred tax are recognized as part of
the year’s adjustment in deferred tax.
Changes in local tax rates, affecting deferred tax, are used and
thus affecting the value of the calculated deferred tax asset, alter-
natively deferred tax liability at year end.
Deferred tax assets, including the tax base of tax loss carry
forwards, are recognized in the statement of financial position
at their estimated realizable value, either as a set-off against de-
ferred tax liabilities or as net tax assets for set-off against future
positive taxable income. At the end of each reporting period, it is
reassessed whether sufficient taxable income is probable to arise
in the future for the deferred tax asset to be used.
Balances calculated according to the rules on interest deductibility
limitations in the Danish Corporate Income Tax Act are allocated
solely to Welltec A/S. Deferred tax liabilities in respect of these
balances are recognized in the statement of financial position;
whereas deferred tax assets are recognized only of the criteria for
recognition of deferred tax assets are met.
Statement of comprehensive income
Revenue
The group provides multiple solutions to oil and gas companies
around the world at their onshore and offshore locations us-
ing proprietary remote control precision robotic equipment that
Welltec designs and manufactures.
Provision of services is recognized in revenue when the work is
performed or when the agreed service is provided.
Income from contracted development projects on third parties’
account is recognized as revenue as or when Welltec delivers the
development services to the customers and such services are con-
sidered to provide added value to the customers.
Revenue from sales of products is recognized in the income state-
ment if delivery and transfer of risk to the buyer have taken place
before year end, and if the income can be reliably measured and is
expected to be received.
Revenue is measured at fair value of the consideration received
or receivable. If an interest-free credit has been arranged for pay-
ment of the consideration receivable that is longer than the usual
credit period, the fair value of the consideration is determined by
discounting future payments receivable. The difference between
fair value and nominal amount of the consideration is recognized

WELLTEC® ANNUAL REPORT 2016 FINANCIAL STATEMENTS / 29
NOTES
as financial income in profit or loss by applying the effective inter-
est method.
Revenue is recorded net of VAT, duties, etc. collected on behalf of
a third party.
Cost of services provided
Cost of services provided comprises direct and indirect expenses
incurred to realize revenue, including salaries, depreciation and
amortization.
Development and manufacturing costs
Development and manufacturing costs comprise all development
and engineering costs that are not capitalized, including related
impairment losses.
Administrative and sales costs
Administrative and sales costs comprise costs required to sustain
the business including finance, IT, legal, HR and other overhead
costs.
Special items
Special items consist of costs of a special nature in relation to the
activities of the group, including costs of structural changes and
other significant amounts of a one-off nature. These items are
shown separately to facilitate the comparability of the profit or
loss and provide a better picture of the operational results.
Financial income and expenses
These items comprise interest income and expenses, the interest
portion of finance lease payments, realized and unrealized capital
gains and losses on payables and transactions in foreign curren-
cies, amortization premium/allowance on debt, etc. as well as
interest on tax.
Statement of financial position
Intangible assets
Goodwill
Upon initial recognition, goodwill is recognized in the statement
of financial position and measured as the difference between cost
of the enterprise acquired and the fair value of the assets, liabili-
ties and contingent liabilities acquired.
When goodwill is recognized, the goodwill amount is distributed
on those of the group’s activities generating separate payments
(cash-generating units). Determination of cash-generating units
follows the management structure and internal finance manage-
ment and reporting of the group.
Subsequently, goodwill is measured at cost less accumulated write
downs. There is no amortization of goodwill but the carrying
value of goodwill is tested for impairment at least once a year to-
gether with the other long-term assets in the cash-generating unit
to which the goodwill is allocated. It is written down to recover-
able amount in profit or loss if the accounting value exceeds the
recoverable amount, this representing the higher of the fair value
of the asset less expected disposal costs and the value in use. The
recoverable amount is generally determined as the present value
of the expected future net cash flows from the cash-generating
unit to which the goodwill is allocated. Impairment losses of
goodwill are included in profit or loss under amortization and im-
pairment losses of intangible assets.
Development projects
Development projects on clearly defined and identifiable service
equipment and processes are recognized as intangible assets if it
is probable that the service equipment or process will generate
future financial benefits for the group, and the development costs
of each asset can be measured reliably. Other development costs
are recognized as costs in the profit or loss as incurred.
On initial recognition, development costs are measured at cost.
The cost of development projects comprises costs such as salaries
and other costs that are directly attributable to the development
projects (e.g. field tests) and are needed to complete the project,
calculated from the time at which the development project first
meets the specific criteria for being recognized as an asset.
Completed development projects are amortized on a straight-line
basis using the estimated useful lives of the assets. The amortiza-
tion period is usually 5 years, but in certain cases it may be up to
20 years if the longer amortization period is considered to better
reflect the group’s benefit from the developed product, etc. For
development projects protected by intellectual property rights, the
maximum amortization period is the remaining duration of the
relevant rights, however, no more than 20 years.
Development projects and other intangible assets are written
down to their recoverable amounts. Development projects in
progress are tested at least once a year for impairment. Borrowing

NOTES
30 WELLTEC® ANNUAL REPORT 2016 / FINANCIAL STATEMENTS
costs to finance the investments in development projects are rec-
ognized in cost of these assets if such expenses relate to qualify-
ing assets for which their development period last longer than 12
months. Other borrowing costs are included in finance expenses
in the statement of comprehensive income.
Other intangible assets
Acquired intellectual property rights in the form of patents and
licenses are measured at cost less accumulated amortization and
impairment losses. Patents are amortized over their remaining
duration, usually 20 years, and licenses are amortized over the
term of the agreement. If the actual useful life is shorter than the
remaining duration and the term of the agreement, respectively,
amortization is made over such shorter useful life.
Separable intangible assets acquired through business combina-
tions are brand, customer relationship and technology. Brand is
not amortized as the useful life is considered indefinite. Customer
relationship is amortized on a straight-line basis over its estimated
useful life of 10 years. Technology is amortized on a straight-line
basis over its estimated useful life of 10 to 20 years.
Tangible assets
Land and buildings, plant and machinery as well as other fixtures
and fittings, tools and equipment are measured at cost less accumu-
lated depreciation and impairment losses. Land is not depreciated.
Cost comprises the acquisition price, costs directly attributable to
the acquisition and preparation costs of the asset until the time
when it is ready to be put into operation. For assets manufac-
tured and owned by the group, cost comprises expenses directly
attributable to the manufacturing of the asset, including materi-
als, components, sub-suppliers rent, electricity and laboring costs.
In the year when the tool is completed and ready to generate
income, it is recognized under ‘Plant equipment and fleet’. During
construction, the asset is recognized under ‘Plant equipment and
fleet under construction’.
For assets held under finance leases, cost is measured as the lower
of the asset’s fair value or present value of future lease payments.
The basis of depreciation is cost less estimated residual value after
the end of useful life. The residual value is the estimated amount
that would be earned if selling the asset today net of selling costs
if the asset is of an age and a condition that is expected after the
end of useful life straight-line depreciation is made on the basis of
the following estimated useful lives of the assets:
Buildings: 50 years
Leasehold improvements: 3-10 years
Plant equipment and fleet: 3-10 years
Other fixtures and fittings, tools and equipment: 3-5 years
Leased assets are depreciated according to the lease term period.
Depreciation methods, useful lives and residual amounts are reas-
sessed annually.
Property, plant equipment and fleet are written down to the lower
of recoverable amount and carrying amount.
Impairment of property, plant equipment and fleet and intan-
gible assets
The carrying amounts of property, plant equipment and fleet and
intangible assets with definite useful lives are tested at the end of
the reporting period for any indication of impairment. If impaired,
the recoverable amount of the asset is estimated to determine the
need for any write-down and the extent thereof.
The recoverable amount of intangible assets with indefinite use-
ful lives, development projects in progress, brand and goodwill
is estimated annually irrespective of any recorded indications of
impairment.
If the asset does not generate cash flows separately from other as-
sets, an estimate is made of the recoverable amount of the small-
est cash-generating unit of which the asset forms part.
The recoverable amount is calculated as the higher of the asset’s
and the cash-generating unit’s fair value less selling costs and
net present value. When the net present value is determined,
estimated future cash flows are discounted at present value using
a discount rate that reflects current market estimates of the value
of money in terms of time, as well as the particular risks related to
the asset and the cash-generating unit, respectively, and for which
no adjustment is made in the estimated future cash flows.
If the recoverable amount of the asset or the cash-generating unit
is estimated to be lower than the carrying amount, the asset is
written down to this lower recoverable amount. For cash-gener-
ating units, write-down is allocated in such a way that goodwill
amounts are written down first and then any remaining need for
write-down is allocated to other assets of the unit, however, the
individual asset is not written down to an amount that is lower
than its fair value net of estimated selling costs.
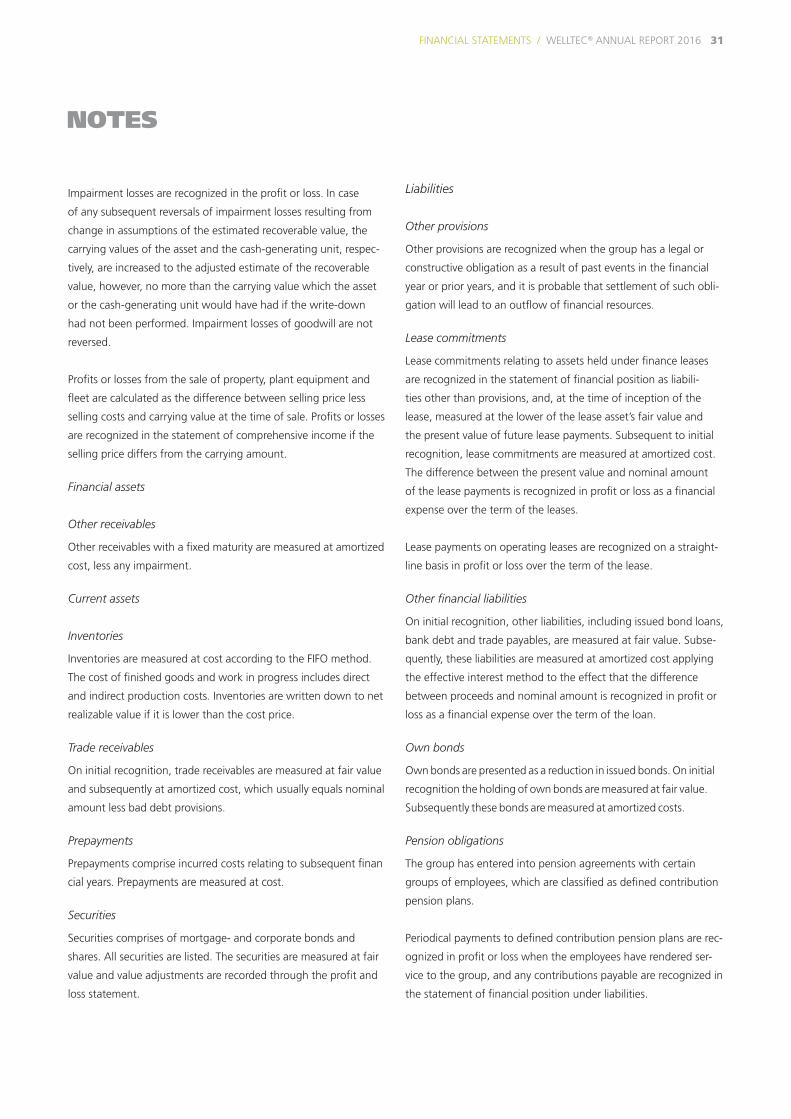
WELLTEC® ANNUAL REPORT 2016 FINANCIAL STATEMENTS / 31
NOTES
Impairment losses are recognized in the profit or loss. In case
of any subsequent reversals of impairment losses resulting from
change in assumptions of the estimated recoverable value, the
carrying values of the asset and the cash-generating unit, respec-
tively, are increased to the adjusted estimate of the recoverable
value, however, no more than the carrying value which the asset
or the cash-generating unit would have had if the write-down
had not been performed. Impairment losses of goodwill are not
reversed.
Profits or losses from the sale of property, plant equipment and
fleet are calculated as the difference between selling price less
selling costs and carrying value at the time of sale. Profits or losses
are recognized in the statement of comprehensive income if the
selling price differs from the carrying amount.
Financial assets
Other receivables
Other receivables with a fixed maturity are measured at amortized
cost, less any impairment.
Current assets
Inventories
Inventories are measured at cost according to the FIFO method.
The cost of finished goods and work in progress includes direct
and indirect production costs. Inventories are written down to net
realizable value if it is lower than the cost price.
Trade receivables
On initial recognition, trade receivables are measured at fair value
and subsequently at amortized cost, which usually equals nominal
amount less bad debt provisions.
Prepayments
Prepayments comprise incurred costs relating to subsequent finan
cial years. Prepayments are measured at cost.
Securities
Securities comprises of mortgage- and corporate bonds and
shares. All securities are listed. The securities are measured at fair
value and value adjustments are recorded through the profit and
loss statement.
Liabilities
Other provisions
Other provisions are recognized when the group has a legal or
constructive obligation as a result of past events in the financial
year or prior years, and it is probable that settlement of such obli-
gation will lead to an outflow of financial resources.
Lease commitments
Lease commitments relating to assets held under finance leases
are recognized in the statement of financial position as liabili-
ties other than provisions, and, at the time of inception of the
lease, measured at the lower of the lease asset’s fair value and
the present value of future lease payments. Subsequent to initial
recognition, lease commitments are measured at amortized cost.
The difference between the present value and nominal amount
of the lease payments is recognized in profit or loss as a financial
expense over the term of the leases.
Lease payments on operating leases are recognized on a straight-
line basis in profit or loss over the term of the lease.
Other financial liabilities
On initial recognition, other liabilities, including issued bond loans,
bank debt and trade payables, are measured at fair value. Subse-
quently, these liabilities are measured at amortized cost applying
the effective interest method to the effect that the difference
between proceeds and nominal amount is recognized in profit or
loss as a financial expense over the term of the loan.
Own bonds
Own bonds are presented as a reduction in issued bonds. On initial
recognition the holding of own bonds are measured at fair value.
Subsequently these bonds are measured at amortized costs.
Pension obligations
The group has entered into pension agreements with certain
groups of employees, which are classified as defined contribution
pension plans.
Periodical payments to defined contribution pension plans are rec-
ognized in profit or loss when the employees have rendered ser-
vice to the group, and any contributions payable are recognized in
the statement of financial position under liabilities.

NOTES
32 WELLTEC® ANNUAL REPORT 2016 / FINANCIAL STATEMENTS
Statement of cash flows
The group’s statement of cash flows is presented using the indi-
rect method and shows cash flows from operating, investing and
financing activities as well as the group’s cash and cash equiva-
lents at the beginning and end of the financial year.
Cash flows from operating activities are calculated as EBIT ad-
justed for non-cash operating items, working capital changes
and income taxes paid. In the adjustment for non-cash operating
items, depreciations and amortizations capitalized on tangible and
intangible assets are included.
Cash flows from investing activities comprise payments in connec-
tion with the acquisition and divestment of enterprises, tangible
fixed asset investments, and purchase, development, improve-
ment and sale, etc. of intangible assets, and property, plant equip-
ment and fleet as well as acquisition of securities. Depreciations
and amortizations capitalized on tangible and intangible assets
are included in cash-flow from investing activities.
If any, cash flows from acquired and divested enterprises are
shown as separate line items within cash flows from investing
activities. Cash flows related to acquired enterprises are recog-
nized in the statement of cash flow from their date of acquisition,
and cash flows from divested enterprises are recognized up to the
date of sale.
Cash flows from financing activities comprise financial expenses
paid and changes in the size or composition of the parent com-
pany’s share capital and related costs, the raising of loans, install-
ments on interest-bearing debt, purchase of own shares, and
payment of dividends.
Cash and cash equivalents comprise cash.
2. USE OF CRITICAL ACCOUNTING ESTIMATES AND JUDGMENTS
The group prepares its consolidated financial statements in ac-
cordance with IFRS as adopted by the EU, the application of which
often requires judgments to be made by Management when
preparing the group’s financial position and results. Under IFRS,
Management are required to adopt those accounting policies
most appropriate to the group’s circumstances for the purpose of
presenting fairly the group’s financial position, financial perfor-
mance and cash flows.
In determining and applying accounting policies, judgment is of-
ten required in respect of items where the choice of specific policy,
accounting estimate or assumption to be followed could materi-
ally affect the reported results or net asset position of the group; it
may later be determined that a different choice would have been
more appropriate. Actual results may differ from the accounting
estimates.
Estimates and assumptions are reviewed on an ongoing basis
and have been prepared taking the market situation into con-
sideration, but still ensuring that one-off effects which are not
expected to exist in the long term do not affect estimation and
determination of these key factors, including discount rates and
expectations about the future.
Management considers that certain accounting estimates and as-
sumptions relating to assets, liabilities and expenses are its critical
accounting estimates and judgment.
A discussion of these critical accounting estimates and judgments are
provided below and should be read in conjunction with the disclo-
sure of the group’s significant IFRS accounting policies provided in
note 1. Accounting policies to the consolidated financial statements.
2.1 Capitalization of tool fleet
Welltec’s major activity is to provide services related to interven-
tions and completion solutions to the oil and gas industry, using
tools developed and produced by Welltec. The tools are used
commercially in more than one accounting period, and are thus
considered tangible assets and not inventories.
Costs directly attributable to bringing the tools to the condition
necessary for them to be capable of operating in the manner
intended by Management are capitalized as part of the costs of
plant equipment and fleet. Costs directly related to performing
commercial services with the tools are expensed as they occur.

WELLTEC® ANNUAL REPORT 2016 FINANCIAL STATEMENTS / 33
NOTES
Cost of the tools include some variable indirect costs of bringing
the tools to their working condition that can be allocated to the
tools on a systematic and reasonable basis (e.g. rent, electricity
and laboring costs).
Determining directly attributable costs is an accounting judgment.
At December 31, 2016, Welltec has capitalized USD 88,382 thou-
sand as plant equipment and fleet – completed and under con-
struction compared to USD 100,426 thousand at December 31,
2015. Plant equipment and fleet is depreciated over their useful
lives, Plant equipment over 3-10 years and fleet over 5 years.
2.2 Capitalization of development projects
An internally generated intangible asset arising from development
is recognized if, and only if, all of the criteria in IAS 38 have been
meet. Development costs not meeting these criteria are expensed
as incurred.
Development costs recognized as self-constructed intangible as-
sets comprise all directly attributable costs necessary to create and
prepare the asset to be capable of operating in the manner in-
tended by Management. Such costs include costs of materials and
services used in producing prototypes, salaries, fees to register
legal rights as well as costs of field testing the developed tool.
Welltec only engage in development activities aimed at develop-
ing new or improved tools for use in providing services to the oil
and gas industry, and has no intention of selling developed tech-
nology, IP rights etc.
Welltec does not initiate a development project unless a specific
need within the oil and gas industry has been identified or antici-
pated, and consequently that it can be demonstrated how the
intangible asset will generate probable future economic benefits.
It is the opinion of Management that due to a short and market-
oriented development process, development costs would normally
be capitalized.
At December 31, 2016, Welltec has capitalized USD 66,768
thousands as development projects – completed and in progress
– compared to USD 83,689 thousand at December 31, 2015.
Completed development projects are amortized over their useful
lives of usually 5 years.
2.3 Impairment test of goodwill and other intangible assets
Goodwill represents USD 242,340 thousand equalizing 42 % of
total assets and 137 % of total equity at December 31, 2016,
which is significant to the consolidated financial statements.
For purposes of assessing the carrying amount of goodwill and
other intangible assets of USD 342,419 thousand at December
31, 2016, compared to USD 413,071 thousand at December 31,
2015, Management prepared its annual impairment test.
In performing the impairment test Management makes an assess-
ment of whether the Welltec International ApS Group will be able
to generate positive net cash flows sufficient to support the value
of the goodwill, intangible assets and other net assets of the en-
tity. This assessment is based on estimates of expected future cash
flows (value-in-use) made on the basis of financial budgets and
long-term forecasts until the end of 2025. In addition to these the
key assumptions used to estimate expected future cash flows are
discount rates and growth rates. In 2015 and 2016 the sudden
decline in oil prices has left the industry under pressure to reduce
spending which generally has increased the estimation uncertainty
and reduced the market value of Welltec.
The measurement of goodwill may be significantly impacted by
changes in the estimates made when calculating the value in use
of the entity in connection with impairment test.
For a further description of goodwill, the cash-generating unit,
the impairment test and related key assumptions (being expecta-
tions about future earnings, growth rate and discount rate), refer
to note 11. Intangible assets.
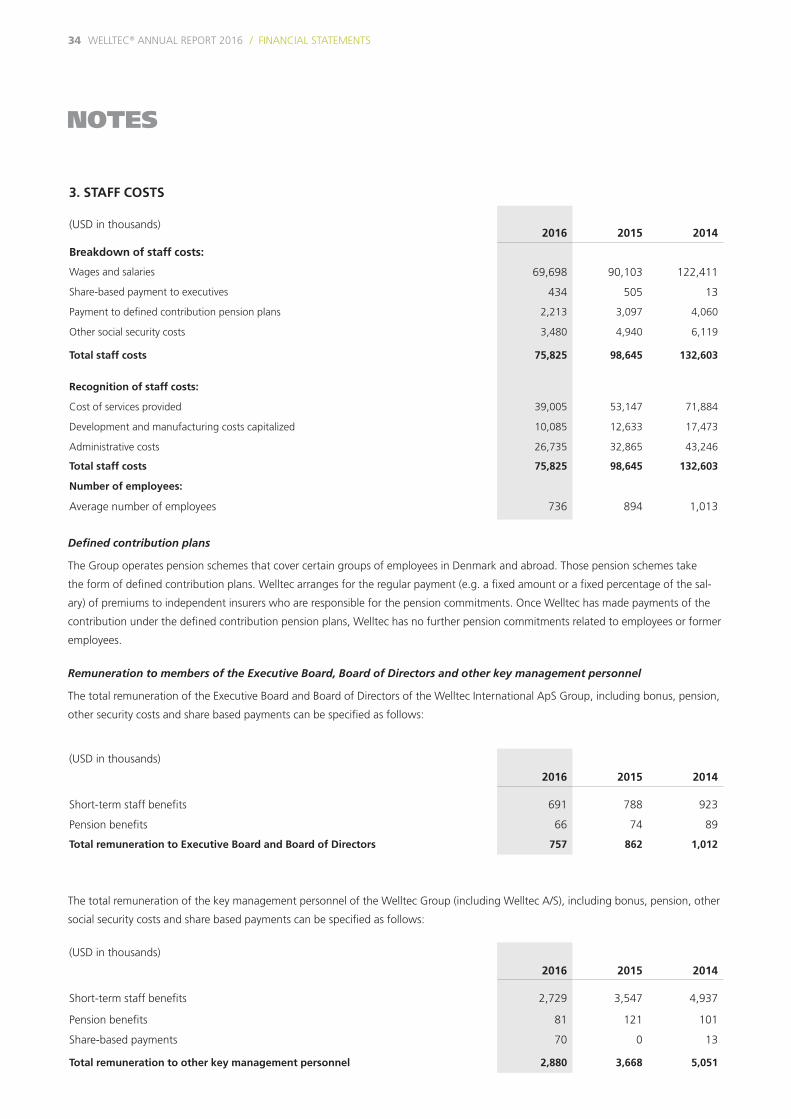
NOTES
34 WELLTEC® ANNUAL REPORT 2016 / FINANCIAL STATEMENTS
(USD in thousands)
2016 2015 2014
Short-term staff benefits 691 788 923
Pension benefits 66 74 89
Total remuneration to Executive Board and Board of Directors 757 862 1,012
(USD in thousands)2016 2015 2014
Breakdown of staff costs:
Wages and salaries 69,698 90,103 122,411
Share-based payment to executives 434 505 13
Payment to defined contribution pension plans 2,213 3,097 4,060
Other social security costs 3,480 4,940 6,119
Total staff costs 75,825 98,645 132,603
Recognition of staff costs:
Cost of services provided 39,005 53,147 71,884
Development and manufacturing costs capitalized 10,085 12,633 17,473
Administrative costs 26,735 32,865 43,246
Total staff costs 75,825 98,645 132,603
Number of employees:
Average number of employees 736 894 1,013
3. STAFF COSTS
(USD in thousands)
2016 2015 2014
Short-term staff benefits 2,729 3,547 4,937
Pension benefits 81 121 101
Share-based payments 70 0 13
Total remuneration to other key management personnel 2,880 3,668 5,051
Defined contribution plans
The Group operates pension schemes that cover certain groups of employees in Denmark and abroad. Those pension schemes take
the form of defined contribution plans. Welltec arranges for the regular payment (e.g. a fixed amount or a fixed percentage of the sal-
ary) of premiums to independent insurers who are responsible for the pension commitments. Once Welltec has made payments of the
contribution under the defined contribution pension plans, Welltec has no further pension commitments related to employees or former
employees.
Remuneration to members of the Executive Board, Board of Directors and other key management personnel
The total remuneration of the Executive Board and Board of Directors of the Welltec International ApS Group, including bonus, pension,
other security costs and share based payments can be specified as follows:
The total remuneration of the key management personnel of the Welltec Group (including Welltec A/S), including bonus, pension, other
social security costs and share based payments can be specified as follows:
WELLTEC® ANNUAL REPORT 2016 FINANCIAL STATEMENTS / 35
NOTES
(USD in thousands)2016 2015 2014
Breakdown of staff costs:
Wages and salaries 69,698 90,103 122,411
Share-based payment to executives 434 505 13
Payment to defined contribution pension plans 2,213 3,097 4,060
Other social security costs 3,480 4,940 6,119
Total staff costs 75,825 98,645 132,603
Recognition of staff costs:
Cost of services provided 39,005 53,147 71,884
Development and manufacturing costs capitalized 10,085 12,633 17,473
Administrative costs 26,735 32,865 43,246
Total staff costs 75,825 98,645 132,603
Number of employees:
Average number of employees 736 894 1,013
Incentive programs
The group operates incentive schemes in the form of warrants
(Equity-settled) to the Board of Directors of Welltec International
ApS, Executive Board of Welltec A/S, certain senior executives
(VPs) and other key personnel in the Welltec group. The purpose
is to retain and motivate the said persons. The schemes are based
on the shares of Welltec International ApS, and the warrants have
no voting rights attached.
In 2006, Welltec Holding ApS issued 105,820 warrants to senior
executives (VPs) in the Welltec group. The warrants vested over
an employment period until 2009. If employment ceased before
a warrant is vested, the warrant would be reduced proportion-
ally. The warrant scheme is exercisable not earlier than 1 year (for
warrants that vest first), and not later than 9 years, after the grant
date.
In 2007, Welltec International ApS took over from Welltec
Holding ApS 185,900 warrants issued to the Executive Board
of Welltec A/S and senior executives (VPs) in the Welltec group.
This number of warrants was converted to 400,052 warrants in
Welltec International ApS and the exercise price was adjusted
accordingly.
In 2009, a new warrants scheme to key management personnel
was granted. The warrant scheme consists of 68,000 warrants
vested over an employment period until 2012. The warrants are
exercisable not earlier than 3 years and not later than 6 years
after the grant date. The total fair value of these warrants was at
grant date USD 229 thousand of which USD 115 thousand was
recognized in the statement of comprehensive income in 2009,
USD 84 thousand in 2010 and USD 30 thousand in 2011. The
issued warrants were exercised in 2015.
In November 2011, new warrants schemes to the Board of Direc-
tors, the Executive Board of Welltec group and key management
personnel were granted. The warrant schemes consist of 290,850
warrants of which 50,000 warrants did not have any vesting
conditions, and the remaining warrants vest over an employment
period between one and four years until the end of 2014. The to-
tal fair value of these warrants was at grant date USD 8.5 million
of which USD 5.9 million was recognized in statement of compre-
hensive income in 2011, USD 2.3 million was recognized in the
statement of comprehensive income in 2012 and USD 0.3 million
in 2013. The fair value of the warrants schemes at grant date was
calculated on the basis of the Black-Scholes model. The calcula-
tion for the 2011 schemes is based on an expected volatility of
33%, a risk-free interest rate at 0.85%, a share price of USD 143
before deducting an estimated illiquidity discount, the exercise
price, an average option life of 60 month and no annual payment
of dividends. The expected volatility has been determined using
a historical volatility for a five-year period for comparable listed
companies adjusted for a small-cap factor.
In September 2013, warrants schemes to key management per-
sonnel was granted. The warrant schemes consist of 50,800 war-
rants and vest over an employment period between one and four
years until the end of 2017. The total fair value of these warrants
was at grant date USD 3.7 million of which USD 2.4 million was
recognized in the statement of comprehensive income in 2013,
USD (63) thousand was recognized in the statement of compre-
hensive income in 2014, and USD (677) thousand was recognized
in the statement of the comprehensive income in 2015. The
negative amount is due to cancellation of warrant on employees
leaving the group resulting in costs from earlier periods being
reversed. The fair value of the warrants schemes at grant date
was calculated on the basis of the Black-Scholes model. The cal-
culation for the 2013 schemes is based on an expected volatility
of 45%, a risk-free interest rate at 0.01%, a share price of USD
174-309, the exercise price, an average option life of 36 month
and no annual payment of dividends. The expected volatility has
been determined using a historical volatility for a five-year period
for comparable listed companies adjusted for a small-cap factor.
In December 2014, warrants schemes to key management
personnel was granted. The warrant schemes consist of 42,300
warrants and vest over an employment period between one and
four years until the end of 2017. The total fair value of these
warrants was at grant date USD 5.4 million of which USD 70
thousand was recognized in the statement of comprehensive
income in 2015 and USD 1,182 thousand was recognized in the
statement of the comprehensive income in 2015. The fair value of
the warrants schemes at grant date was calculated on the basis of
the Black-Scholes model. The calculation for the 2014 schemes is
based on an expected volatility of 45%, a risk-free interest rate at
0.14%, a share price of USD 294, the exercise price, an average
option life of 36 month and no annual payment of dividends. The
expected volatility has been determined using a historical volatility
for a five-year period for comparable listed companies adjusted
for a small-cap factor.

NOTES
36 WELLTEC® ANNUAL REPORT 2016 / FINANCIAL STATEMENTS
In the event of an IPO or certain changes in the ownership struc-
ture (e.g. listing or sale of the company) all warrants will vest and
become exercisable.
As a result of the dividend distribution in 2012, the exercise prices
of outstanding warrant schemes from 2011 and before, were
adjusted in 2012 to avoid a dilution of the fair values of those
warrants. The new exercise prices were adjusted to ensure that
the fair values before and after the dividend pay-out were the
same. Therefore these adjustments had no effect on the consoli-
dated financial statements in 2012.
The following schemes were in existence during the current and
prior year:
Warrant scheme Number(1) Grant date Vesting date Expiry date
Exercise price per warrant USD (2)(3)
Fair value per warrant
at grant date USD
Outstanding at 31.12.2016
Granted in 2006 227,721 Feb. 2006 2007–2009 Jun. 2016 0.15 0.9 0
Granted in 2009 68,000 Sept. 2009 2010–2012 Sep. 2015 33 3.7 0
Granted in 2011 290,850 Nov. 2011 2011–2014 Nov. 2016 34 -147 29.7 0
Granted in 2013 50,800 Sep. 2013 2013–2017 Jun. 2020 136 - 241 44 - 103 20,200
Granted in 2014 42,300 Dec. 2014 2014–2017Dec. 2020 - Dec. 2021
223 - 255 125 - 130 31,000
51,200
1) The numbers for the 2005 and 2006 grant are after the conversion to warrants on shares in Welltec International ApS.
2) The exercise prices are adjusted for the dilution impact from dividend paid in 2012.
3) The exercise prices are contracted in DKK and translated above to USD based on the year end rate.

WELLTEC® ANNUAL REPORT 2016 FINANCIAL STATEMENTS / 37
NOTES
Warrant schemeNumber
exercised Exercise dateWeighted average share
price at exercise date USD
Granted in 2005 172,331 Mar. 2012 143
Granted in 2006 30,773 Aug. 2009 143
Granted in 2006 49,237 Dec. 2012 143
Granted in 2009 68,000 Jul. 2015 144
Granted in 2011 6,300 Dec. 2012 143
The total expense recognized in the statement of comprehensive income for all warrants schemes amounted to USD 434 thousand for
2016. The total expense recognized in the statement of comprehensive income for all warrants schemes amounted to USD 505 thou-
sand in 2015 and USD 13 thousand in 2014.
The following reconciles the warrants outstanding at the beginning and at the end of the year:
NUMBER OF WARRANTSBoard of Directors
of Welltec Interna-
tional ApS
Executive Board of
Welltec A/S
Senior executives
and key management
personnel Total
Weighted average exercise
price USD (1)
Balance at 01.01.2014 10,000 50,000 485,261 545,261 88
Granted 0 0 42,300 42,300 307
Forfeited 0 0 (8,100) (8,100) 252
Balance at 31.12.2014 10,000 50,000 519,461 579,461 104
Exercised 0 0 (68,000) (68,000) 35
Forfeited 0 0 (40,900) (40,900) 190
Balance at 31.12.2015 10,000 50,000 410,561 470,561 80
Exercised 0 0 (102,474) (102,474) 3
Forfeited (10,000) (50,000) (256,887) (316,887) 79
Balance at 31.12.2016 0 0 51,200 51,200 221
These warrants are exercisable as of 31.12.2016 45,200 45,200
1) The exercise prices in 2013 are adjusted for the dilution impact from dividend paid in 2012.
The weighted average remaining contractual life and range of exercise price of outstanding warrants was 37 months and a price of USD 141 – 235 (adjusted for dilution impact) at December 31, 2016, 10 months and a price of USD 0.15-264 (adjusted for dilution impact) at December 31, 2015, and 22 months and a price of USD 0.16 -265 at December 31, 2014.
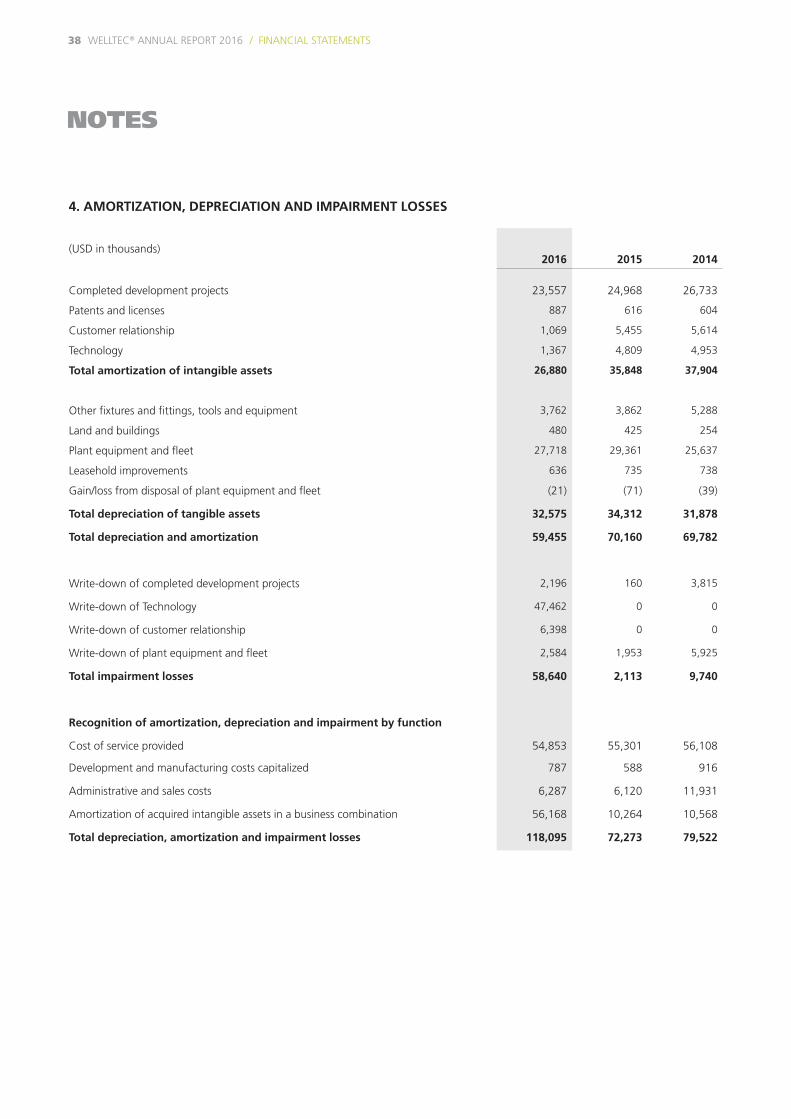
NOTES
38 WELLTEC® ANNUAL REPORT 2016 / FINANCIAL STATEMENTS
4. AMORTIZATION, DEPRECIATION AND IMPAIRMENT LOSSES
(USD in thousands)2016 2015 2014
Completed development projects 23,557 24,968 26,733
Patents and licenses 887 616 604
Customer relationship 1,069 5,455 5,614
Technology 1,367 4,809 4,953
Total amortization of intangible assets 26,880 35,848 37,904
Other fixtures and fittings, tools and equipment 3,762 3,862 5,288
Land and buildings 480 425 254
Plant equipment and fleet 27,718 29,361 25,637
Leasehold improvements 636 735 738
Gain/loss from disposal of plant equipment and fleet (21) (71) (39)
Total depreciation of tangible assets 32,575 34,312 31,878
Total depreciation and amortization 59,455 70,160 69,782
Write-down of completed development projects 2,196 160 3,815
Write-down of Technology 47,462 0 0
Write-down of customer relationship 6,398 0 0
Write-down of plant equipment and fleet 2,584 1,953 5,925
Total impairment losses 58,640 2,113 9,740
Recognition of amortization, depreciation and impairment by function
Cost of service provided 54,853 55,301 56,108
Development and manufacturing costs capitalized 787 588 916
Administrative and sales costs 6,287 6,120 11,931
Amortization of acquired intangible assets in a business combination 56,168 10,264 10,568
Total depreciation, amortization and impairment losses 118,095 72,273 79,522
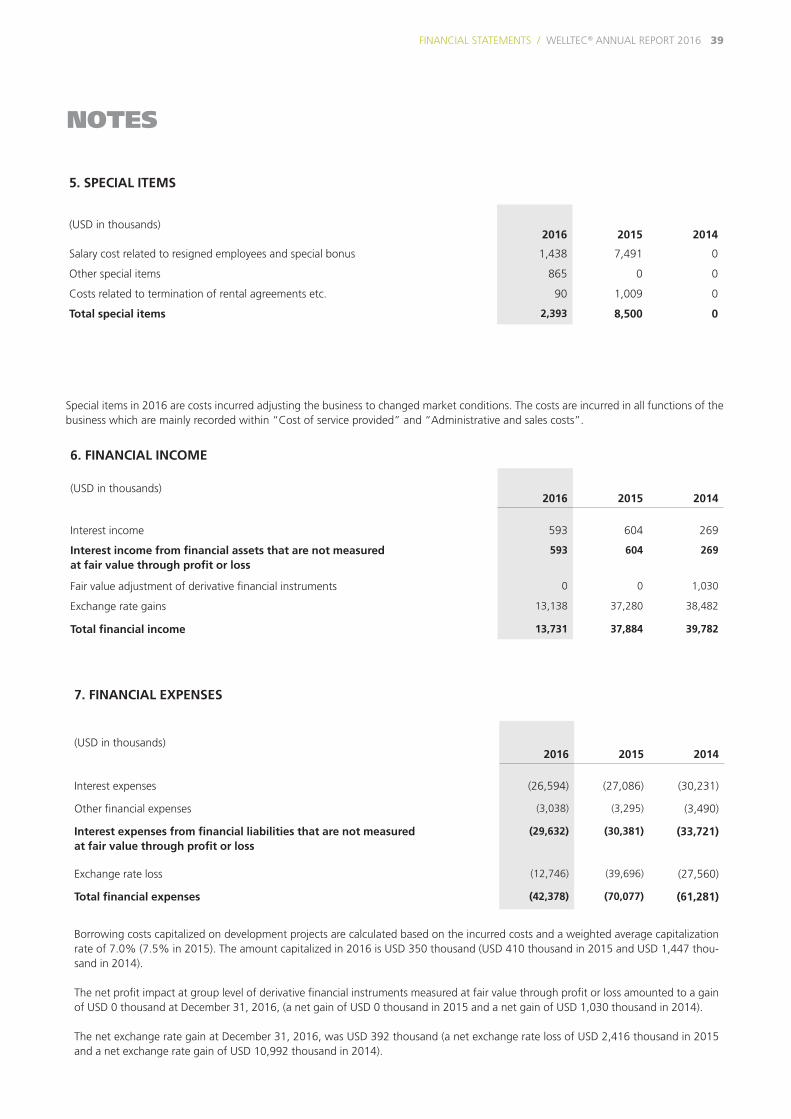
WELLTEC® ANNUAL REPORT 2016 FINANCIAL STATEMENTS / 39
NOTES
6. FINANCIAL INCOME
(USD in thousands)2016 2015 2014
Interest income 593 604 269
Interest income from financial assets that are not measured at fair value through profit or loss
593 604 269
Fair value adjustment of derivative financial instruments 0 0 1,030
Exchange rate gains 13,138 37,280 38,482
Total financial income 13,731 37,884 39,782
7. FINANCIAL EXPENSES
(USD in thousands)2016 2015 2014
Interest expenses (26,594) (27,086) (30,231)
Other financial expenses (3,038) (3,295) (3,490)
Interest expenses from financial liabilities that are not measured at fair value through profit or loss
(29,632) (30,381) (33,721)
Exchange rate loss (12,746) (39,696) (27,560)
Total financial expenses (42,378) (70,077) (61,281)
Borrowing costs capitalized on development projects are calculated based on the incurred costs and a weighted average capitalization rate of 7.0% (7.5% in 2015). The amount capitalized in 2016 is USD 350 thousand (USD 410 thousand in 2015 and USD 1,447 thou-sand in 2014).
The net profit impact at group level of derivative financial instruments measured at fair value through profit or loss amounted to a gain of USD 0 thousand at December 31, 2016, (a net gain of USD 0 thousand in 2015 and a net gain of USD 1,030 thousand in 2014).
The net exchange rate gain at December 31, 2016, was USD 392 thousand (a net exchange rate loss of USD 2,416 thousand in 2015 and a net exchange rate gain of USD 10,992 thousand in 2014).
5. SPECIAL ITEMS
(USD in thousands)2016 2015 2014
Salary cost related to resigned employees and special bonus 1,438 7,491 0
Other special items 865 0 0
Costs related to termination of rental agreements etc. 90 1,009 0
Total special items 2,393 8,500 0
Special items in 2016 are costs incurred adjusting the business to changed market conditions. The costs are incurred in all functions of the business which are mainly recorded within “Cost of service provided” and “Administrative and sales costs”.

NOTES
40 WELLTEC® ANNUAL REPORT 2016 / FINANCIAL STATEMENTS
8. INCOME TAXES
(USD in thousands)2016 2015 2014
Current tax 4,432 13,349 19,591
Adjustment in corporation tax previous years (1,449) 14 10,595
Current tax incl. adj. in corporation tax previous years 2,983 13,363 30,186
Adjustment in deferred tax previous years 1,324 (395) (8,146)
Change in deferred tax (18,959) 384 4,685
Effect from change in tax rate, deferred tax 9 437 43
Tax effect from tax provision (802) (2,750) 3,253
Other taxes 3,800 3.810 2,789
Total (11,645) 14,849 32,810
A breakdown of tax:
Profit before tax (81,344) (17,846) 54,016
(81,344) (17,846) 54,016
Reconciliation of tax expense USD
Danish corporation tax (17,896) (4,193) 13,234
Effect of exchange rate adjustment in USD and DKK on Danish corporation tax (288) 1,491 (540)
Effect of difference between tax rate for subsidiaries outside Denmark and Danish tax rate (749) 1,958 0
Tax effect from tax provision (802) (2,750) 3,253
Non-taxable income and non-deductible expenses 1,697 7,020 8,102
Interest limitation, thin capitalization etc 2,547 5,269 3,241
Withholding taxes non-deductible 3,476 5,400 3.229
Change in corporate income tax rate, current and coming years 9 437 0
Other taxes, including adjustment to previous years 361 217 2,291
Total (11,645) 14,849 32,810
In 2013, Management decided to change the presentation currency of its consolidated financial statements to USD, however, tax returns for the Danish companies are still submitted in DKK with numbers based on consolidation in DKK.
Effect of exchange rate adjustment in USD and DKK on Danish corporation tax is caused by the exchange rate adjustments between USD and DKK in the USD account.
No income tax has been recognized in other comprehensive income in 2016. In 2016 USD 1,699 thousand (2015 USD 52 thousand, 2014 USD 254 thousand) was recognized directly in equity related to tax credit arising upon exercise of warrants.
Denmark – credit for taxes paid abroad
The Danish tax authorities have in 2014 issued tax assessment notices for the financial years 2009 to 2011 following the assessment made regarding the financial year 2008. The new assessments adjust the tax payable due to non-recognition of credit relief calculated on withholding taxes paid abroad. The additional tax payable has been paid and expensed. The decisions are appealed to the National Tax Tribunal.
The tax credit calculations for the financial years 2013 to 2015 and the preliminary tax calculation for 2016 have been made up based on
similar principles as applied by the Danish tax authorities for previous years.
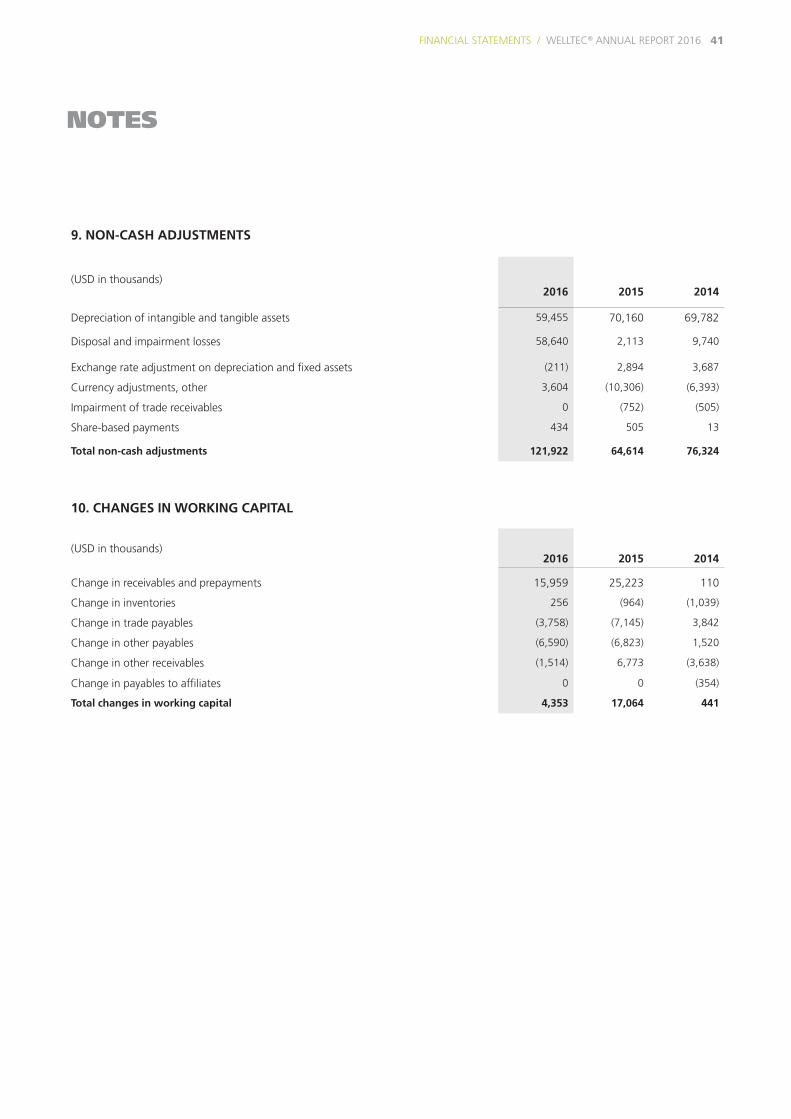
WELLTEC® ANNUAL REPORT 2016 FINANCIAL STATEMENTS / 41
NOTES
10. CHANGES IN WORKING CAPITAL
(USD in thousands)2016 2015 2014
Change in receivables and prepayments 15,959 25,223 110
Change in inventories 256 (964) (1,039)
Change in trade payables (3,758) (7,145) 3,842
Change in other payables (6,590) (6,823) 1,520
Change in other receivables (1,514) 6,773 (3,638)
Change in payables to affiliates 0 0 (354)
Total changes in working capital 4,353 17,064 441
9. NON-CASH ADJUSTMENTS
(USD in thousands)2016 2015 2014
Depreciation of intangible and tangible assets 59,455 70,160 69,782
Disposal and impairment losses 58,640 2,113 9,740
Exchange rate adjustment on depreciation and fixed assets (211) 2,894 3,687
Currency adjustments, other 3,604 (10,306) (6,393)
Impairment of trade receivables 0 (752) (505)
Share-based payments 434 505 13
Total non-cash adjustments 121,922 64,614 76,324
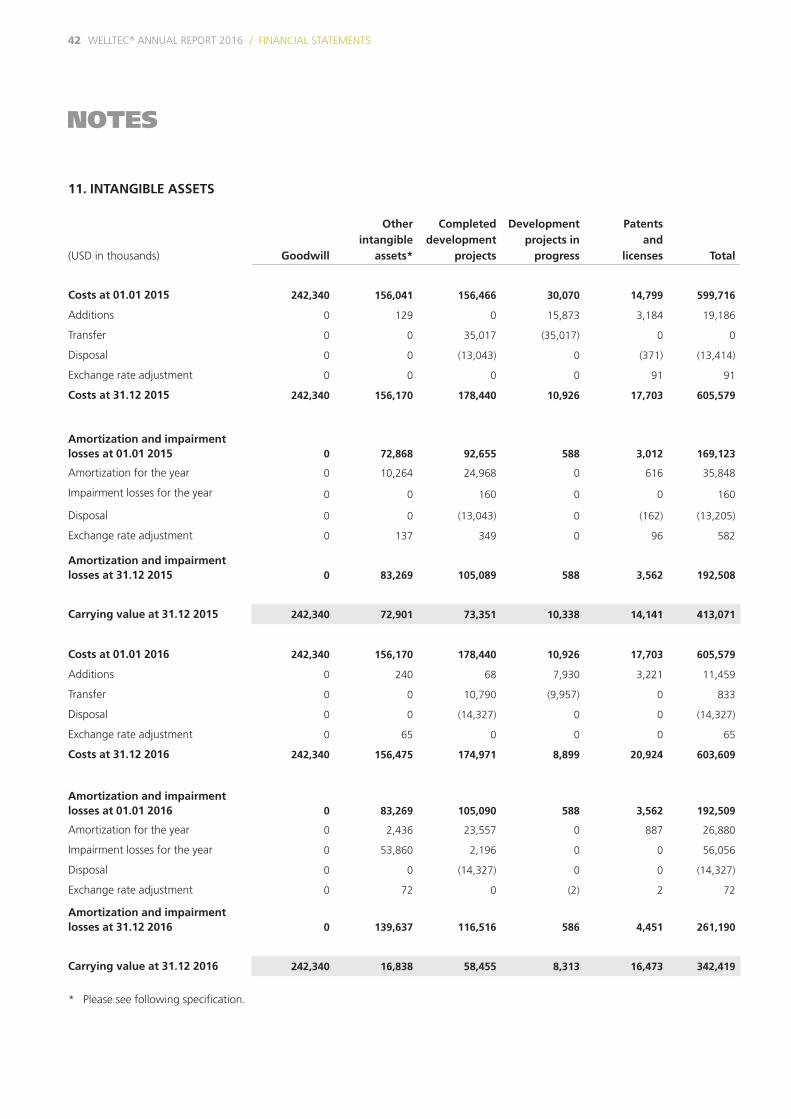
NOTES
42 WELLTEC® ANNUAL REPORT 2016 / FINANCIAL STATEMENTS
11. INTANGIBLE ASSETS
(USD in thousands) Goodwill
Other intangible
assets*
Completed development
projects
Development projects in
progress
Patents and
licenses Total
Costs at 01.01 2015 242,340 156,041 156,466 30,070 14,799 599,716
Additions 0 129 0 15,873 3,184 19,186
Transfer 0 0 35,017 (35,017) 0 0
Disposal 0 0 (13,043) 0 (371) (13,414)
Exchange rate adjustment 0 0 0 0 91 91
Costs at 31.12 2015 242,340 156,170 178,440 10,926 17,703 605,579
Amortization and impairment losses at 01.01 2015 0 72,868 92,655 588 3,012 169,123
Amortization for the year 0 10,264 24,968 0 616 35,848
Impairment losses for the year 0 0 160 0 0 160
Disposal 0 0 (13,043) 0 (162) (13,205)
Exchange rate adjustment 0 137 349 0 96 582
Amortization and impairment losses at 31.12 2015 0 83,269 105,089 588 3,562 192,508
Carrying value at 31.12 2015 242,340 72,901 73,351 10,338 14,141 413,071
Costs at 01.01 2016 242,340 156,170 178,440 10,926 17,703 605,579
Additions 0 240 68 7,930 3,221 11,459
Transfer 0 0 10,790 (9,957) 0 833
Disposal 0 0 (14,327) 0 0 (14,327)
Exchange rate adjustment 0 65 0 0 0 65
Costs at 31.12 2016 242,340 156,475 174,971 8,899 20,924 603,609
Amortization and impairment losses at 01.01 2016 0 83,269 105,090 588 3,562 192,509
Amortization for the year 0 2,436 23,557 0 887 26,880
Impairment losses for the year 0 53,860 2,196 0 0 56,056
Disposal 0 0 (14,327) 0 0 (14,327)
Exchange rate adjustment 0 72 0 (2) 2 72
Amortization and impairment losses at 31.12 2016 0 139,637 116,516 586 4,451 261,190
Carrying value at 31.12 2016 242,340 16,838 58,455 8,313 16,473 342,419
* Please see following specification.

WELLTEC® ANNUAL REPORT 2016 FINANCIAL STATEMENTS / 43
NOTES
Other intangible assets:
(USD in thousands) TechnologyCustomer
relationship Brand Total
Costs at 01.01 2015 90,181 51,936 13,924 156,041
Additions 129 0 0 129
Costs at 31.12 2015 90,310 51,936 13,924 156,170
Amortization and impairment losses at 01.01 2015 33,984 38,884 0 72,868
Amortization for the year 4,809 5,455 0 10,264
Exchange rate adjustment 16 121 0 137
Amortization and impairment losses at 31.12 2015 38,809 44,460 0 83,269
Carrying value at 31.12 2015 51,501 7,476 13,924 72,901
Costs at 01.01 2016 90,310 51,936 13,924 156,170
Additions 240 0 0 240
Exchange rate adjustment 65 65
Costs at 31.12 2016 90,550 52,001 13,924 156,475
Amortization and impairment losses at 01.01 2016 38,809 44,460 0 83,269
Amortization for the year 1,367 1,069 0 2,436
Impairment losses for the year 47,462 6,398 0 53,860
Exchange rate adjustment (2) 74 0 72
Amortization and impairment losses at 31.12 2016 87,636 52,001 0 139,637
Carrying value at 31.12 2016 2,914 0 13,924 16,838
NOTES
44 WELLTEC® ANNUAL REPORT 2016 / FINANCIAL STATEMENTS
Goodwill and intangible assets with indefinite useful life
Goodwill of USD 242,340 thousand is related to the acquisition
of Welltec Holding ApS in 2007, and has been subject to an
annual impairment test. The impairment test performed in 2016
revealed no need for impairment of goodwill.
Goodwill has been tested at the aggregated level. The Welltec In-
ternational ApS Group is considered as one cash-generating unit
as the acquisition in 2007 related to the whole Group. It is the
opinion of Management that the carrying amount for goodwill
does not exceed its recoverable value based on an estimate of
present value of expected future net cash flows from the Welltec
International ApS Group (value-in-use).
The calculation of the value-in-use is based on the following key
assumptions; expectations about future earnings, growth rates
and discount rates.
Expectations about future earnings are based on financial budg-
ets and long-term forecasts until the end of 2025, including long-
term growth rates. A budget period exceeding 5 years has been
applied as Management deems a longer budget period needed in
order to reflect the growth rates of the Welltec International ApS
Group prior to the Group entering into a more steady growth
situation. This is a result of the historic growth rates realized by
the group as well as the future expected growth rates for the
years included in the budget period, which Management has
deemed to be 9 years. A growth rate of 2.0% has been applied in
the terminal period from 2026 and onwards.
The discount rate applied is based on a risk-adjusted after tax
discount rate (weighted average cost of capital) of 10.0%. The
weighted average cost of capital before tax is 11.1%. In 2015
the weighted average cost of capital used was 10.3% which
equals a before tax discount rate of 11.4%.
Impairment test is based on following assumptions and market
views.
Consensus suggests that the overall demand for Oil & Gas is
expected to continue to increase as a result of a growing world
economy. The global oversupply of oil gradually diminished dur-
ing the course of 2016 amid production declines and reduced
investments. The weakening supply fundamentals coupled with
a resilient demand paved the way for higher oil prices and more
importantly a more stable oil price environment by the end of
2016. Looking into 2017, market consensus suggest a continued
stabilization albeit with risk of increased volatility should geopoliti-
cal unrest or the OPEC production coordination yet again fail. For
Welltec, the market potential remains unchanged, as the global
demand continues to increase. In addition the current oil price
environment requires the industry to adopt new technology that
reduces cost of production and ultimately help operators create
sustainable businesses.
Although the prevailing climate is challenging for the industry
and Welltec with global E&P spend dramatically reduced, above
supports that the long term market potential for Welltec is un-
changed.
Impairment of other intangible assets
Impairment of development projects amounted to USD 2.2 million
(2015: USD 0.2 million), which has been recognized in the state-
ment of comprehensive income under “cost of services provided”
as the projects are closed. The recoverable amount was calculated
on the basis of Management’s re-assessed estimate of the value in
use of the assets.
Due to uncertain market conditions, impairment of Technol-
ogy amounted to USD 47.5 million and Customer relationship
amounted to USD 6.4 million, which have been recognized in
the statement of comprehensive income under “amortization
af acquired intangibles in a business combination”. The recov-
erable amount was calculated on the basis of Management’s
re-assessed estimate of the value in use of the assets.
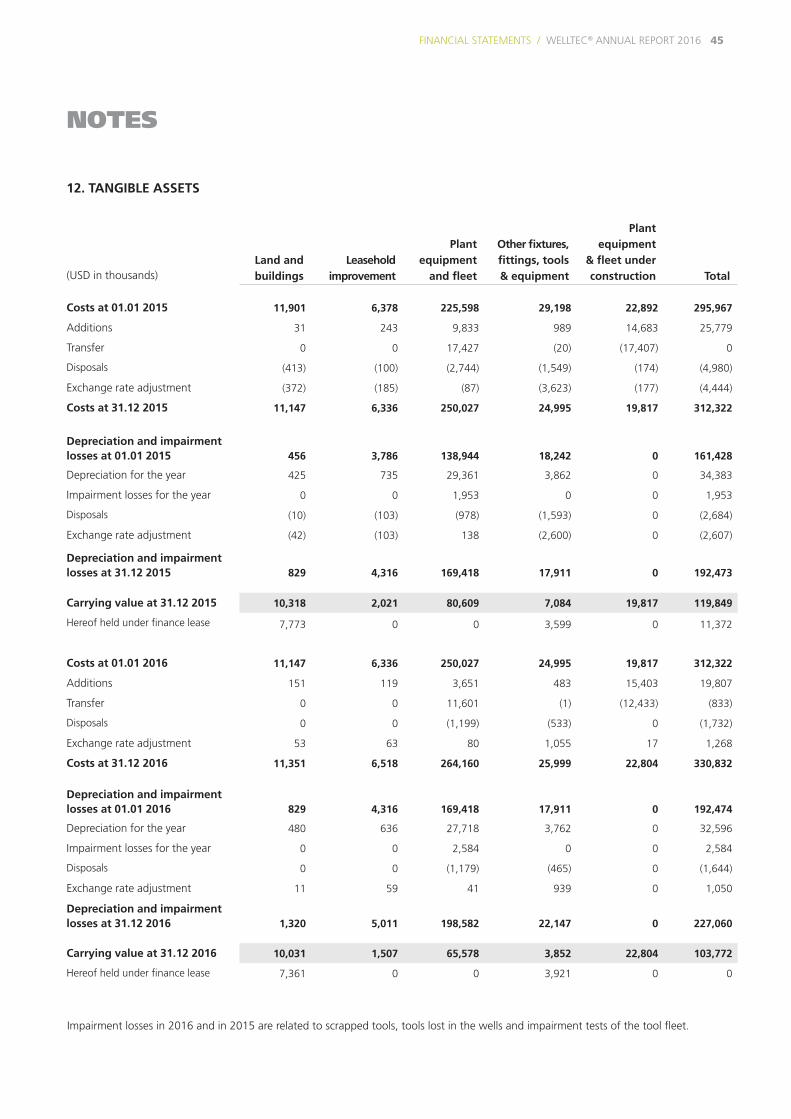
WELLTEC® ANNUAL REPORT 2016 FINANCIAL STATEMENTS / 45
NOTES
12. TANGIBLE ASSETS
(USD in thousands)Land andbuildings
Leasehold improvement
Plantequipment
and fleet
Other fixtures,fittings, tools & equipment
Plant equipment
& fleet underconstruction Total
Costs at 01.01 2015 11,901 6,378 225,598 29,198 22,892 295,967
Additions 31 243 9,833 989 14,683 25,779
Transfer 0 0 17,427 (20) (17,407) 0
Disposals (413) (100) (2,744) (1,549) (174) (4,980)
Exchange rate adjustment (372) (185) (87) (3,623) (177) (4,444)
Costs at 31.12 2015 11,147 6,336 250,027 24,995 19,817 312,322
Depreciation and impairment losses at 01.01 2015 456 3,786 138,944 18,242 0 161,428
Depreciation for the year 425 735 29,361 3,862 0 34,383
Impairment losses for the year 0 0 1,953 0 0 1,953
Disposals (10) (103) (978) (1,593) 0 (2,684)
Exchange rate adjustment (42) (103) 138 (2,600) 0 (2,607)
Depreciation and impairment losses at 31.12 2015 829 4,316 169,418 17,911 0 192,473
Carrying value at 31.12 2015 10,318 2,021 80,609 7,084 19,817 119,849
Hereof held under finance lease 7,773 0 0 3,599 0 11,372
Costs at 01.01 2016 11,147 6,336 250,027 24,995 19,817 312,322
Additions 151 119 3,651 483 15,403 19,807
Transfer 0 0 11,601 (1) (12,433) (833)
Disposals 0 0 (1,199) (533) 0 (1,732)
Exchange rate adjustment 53 63 80 1,055 17 1,268
Costs at 31.12 2016 11,351 6,518 264,160 25,999 22,804 330,832
Depreciation and impairment losses at 01.01 2016 829 4,316 169,418 17,911 0 192,474
Depreciation for the year 480 636 27,718 3,762 0 32,596
Impairment losses for the year 0 0 2,584 0 0 2,584
Disposals 0 0 (1,179) (465) 0 (1,644)
Exchange rate adjustment 11 59 41 939 0 1,050
Depreciation and impairment losses at 31.12 2016 1,320 5,011 198,582 22,147 0 227,060
Carrying value at 31.12 2016 10,031 1,507 65,578 3,852 22,804 103,772
Hereof held under finance lease 7,361 0 0 3,921 0 0
Impairment losses in 2016 and in 2015 are related to scrapped tools, tools lost in the wells and impairment tests of the tool fleet.
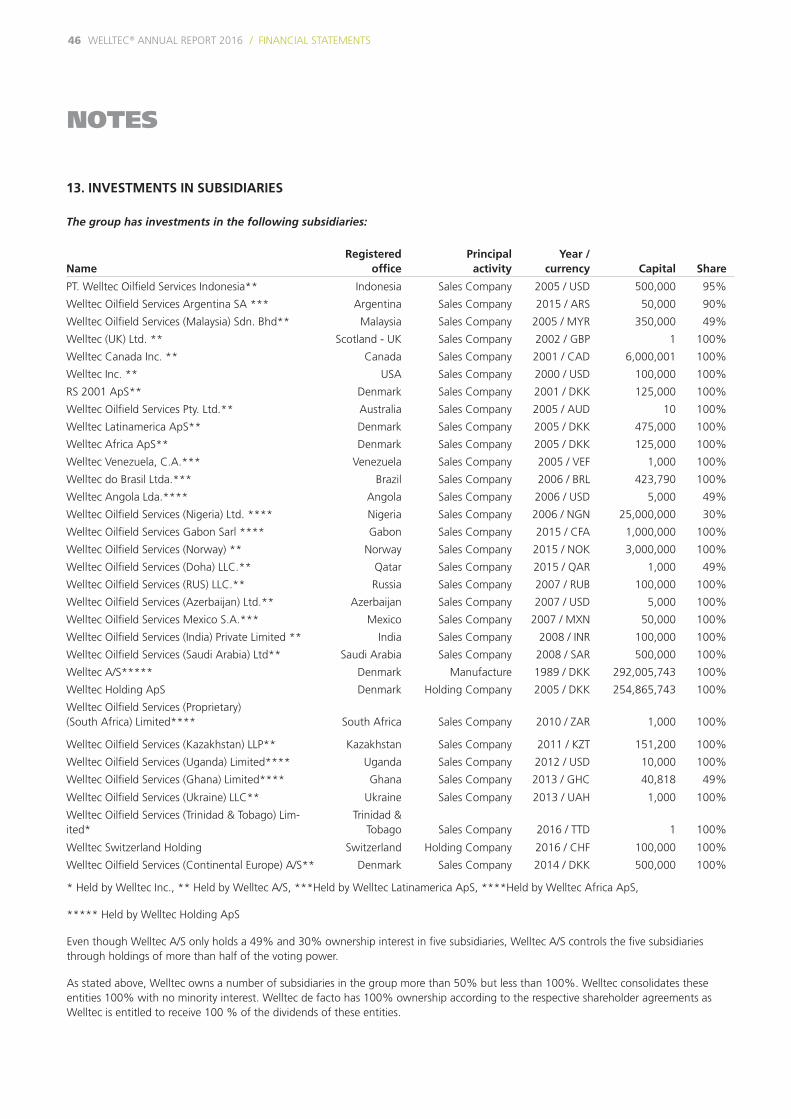
NOTES
46 WELLTEC® ANNUAL REPORT 2016 / FINANCIAL STATEMENTS
13. INVESTMENTS IN SUBSIDIARIES
The group has investments in the following subsidiaries:
NameRegistered
officePrincipalactivity
Year /currency Capital Share
PT. Welltec Oilfield Services Indonesia** Indonesia Sales Company 2005 / USD 500,000 95%
Welltec Oilfield Services Argentina SA *** Argentina Sales Company 2015 / ARS 50,000 90%
Welltec Oilfield Services (Malaysia) Sdn. Bhd** Malaysia Sales Company 2005 / MYR 350,000 49%
Welltec (UK) Ltd. ** Scotland - UK Sales Company 2002 / GBP 1 100%
Welltec Canada Inc. ** Canada Sales Company 2001 / CAD 6,000,001 100%
Welltec Inc. ** USA Sales Company 2000 / USD 100,000 100%
RS 2001 ApS** Denmark Sales Company 2001 / DKK 125,000 100%
Welltec Oilfield Services Pty. Ltd.** Australia Sales Company 2005 / AUD 10 100%
Welltec Latinamerica ApS** Denmark Sales Company 2005 / DKK 475,000 100%
Welltec Africa ApS** Denmark Sales Company 2005 / DKK 125,000 100%
Welltec Venezuela, C.A.*** Venezuela Sales Company 2005 / VEF 1,000 100%
Welltec do Brasil Ltda.*** Brazil Sales Company 2006 / BRL 423,790 100%
Welltec Angola Lda.**** Angola Sales Company 2006 / USD 5,000 49%
Welltec Oilfield Services (Nigeria) Ltd. **** Nigeria Sales Company 2006 / NGN 25,000,000 30%
Welltec Oilfield Services Gabon Sarl **** Gabon Sales Company 2015 / CFA 1,000,000 100%
Welltec Oilfield Services (Norway) ** Norway Sales Company 2015 / NOK 3,000,000 100%
Welltec Oilfield Services (Doha) LLC.** Qatar Sales Company 2015 / QAR 1,000 49%
Welltec Oilfield Services (RUS) LLC.** Russia Sales Company 2007 / RUB 100,000 100%
Welltec Oilfield Services (Azerbaijan) Ltd.** Azerbaijan Sales Company 2007 / USD 5,000 100%
Welltec Oilfield Services Mexico S.A.*** Mexico Sales Company 2007 / MXN 50,000 100%
Welltec Oilfield Services (India) Private Limited ** India Sales Company 2008 / INR 100,000 100%
Welltec Oilfield Services (Saudi Arabia) Ltd** Saudi Arabia Sales Company 2008 / SAR 500,000 100%
Welltec A/S***** Denmark Manufacture 1989 / DKK 292,005,743 100%
Welltec Holding ApS Denmark Holding Company 2005 / DKK 254,865,743 100%
Welltec Oilfield Services (Proprietary) (South Africa) Limited**** South Africa Sales Company 2010 / ZAR 1,000 100%
Welltec Oilfield Services (Kazakhstan) LLP** Kazakhstan Sales Company 2011 / KZT 151,200 100%
Welltec Oilfield Services (Uganda) Limited**** Uganda Sales Company 2012 / USD 10,000 100%
Welltec Oilfield Services (Ghana) Limited**** Ghana Sales Company 2013 / GHC 40,818 49%
Welltec Oilfield Services (Ukraine) LLC** Ukraine Sales Company 2013 / UAH 1,000 100%
Welltec Oilfield Services (Trinidad & Tobago) Lim-ited*
Trinidad & Tobago Sales Company 2016 / TTD 1 100%
Welltec Switzerland Holding Switzerland Holding Company 2016 / CHF 100,000 100%
Welltec Oilfield Services (Continental Europe) A/S** Denmark Sales Company 2014 / DKK 500,000 100%
* Held by Welltec Inc., ** Held by Welltec A/S, ***Held by Welltec Latinamerica ApS, ****Held by Welltec Africa ApS,
***** Held by Welltec Holding ApS
Even though Welltec A/S only holds a 49% and 30% ownership interest in five subsidiaries, Welltec A/S controls the five subsidiaries through holdings of more than half of the voting power.
As stated above, Welltec owns a number of subsidiaries in the group more than 50% but less than 100%. Welltec consolidates these entities 100% with no minority interest. Welltec de facto has 100% ownership according to the respective shareholder agreements as Welltec is entitled to receive 100 % of the dividends of these entities.

WELLTEC® ANNUAL REPORT 2016 FINANCIAL STATEMENTS / 47
14. INVENTORIES
(USD in thousands)2016 2015
Raw materials 3,680 3,698
Finished goods 543 781
Total inventories 4,223 4,479
NOTES
15. TRADE RECEIVABLES
(USD in thousands)2016 2015
Trade receivables before allowance for doubtful accounts 45,752 61,507
Write-downs (263) (263)
Total trade receivables 45,489 61,244
Trade receivables – average fixed time of credit (days) 92 108
Development in write-downs of trade receivables
Write-downs at 01.01 (263) (1,014)
Reversed, unrealized write-downs 0 752
Amounts written off during the year as uncollectible 35 0
Write-down in profit or loss (35) (1)
Write-downs at 31.12 (263) (263)
Specification of trade receivables by due date
Not due 29,024 37,337
Up to 30 days 5,445 9,082
30-60 days 3,796 3,478
60-90 days 3,525 6,297
90-120 days 1,861 1,713
120+ days 1,838 3,337
Total trade receivables 45,489 61,244
In 2016, the write-down on receivables of USD 263 thousand are all related to trade receivables due more than 120+ days
(2015: USD 263 thousand).
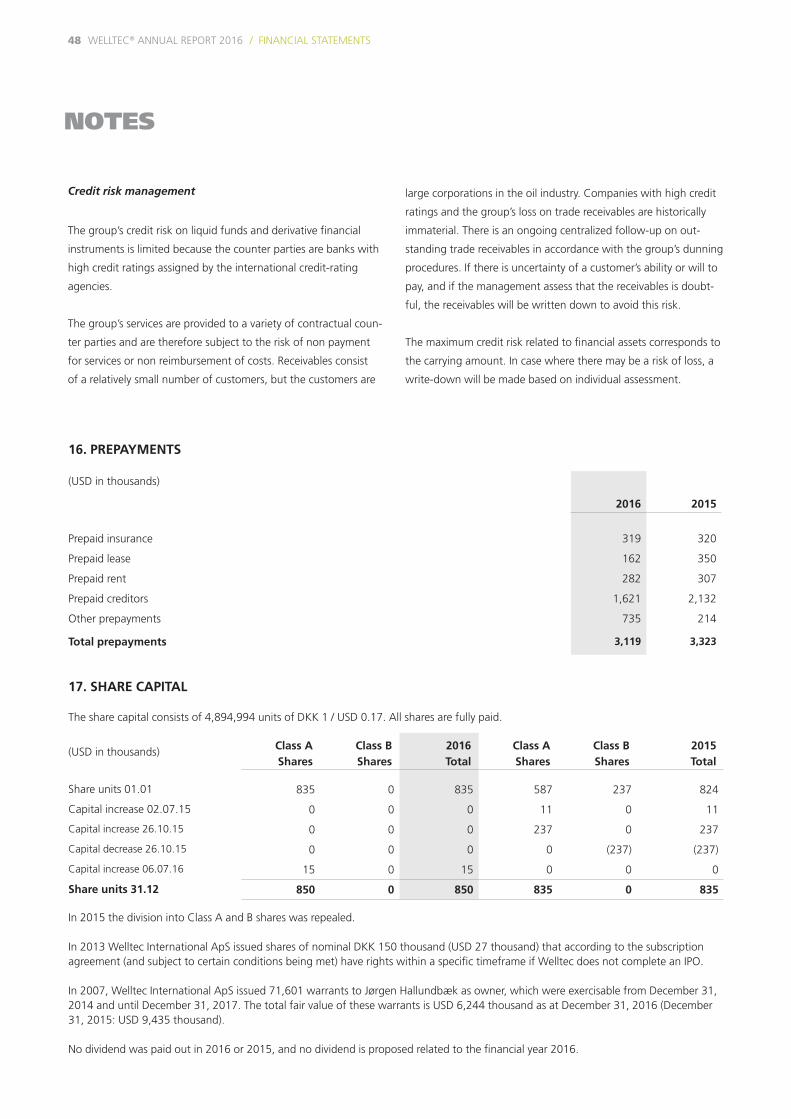
48 WELLTEC® ANNUAL REPORT 2016 / FINANCIAL STATEMENTS
NOTES
Credit risk management
The group’s credit risk on liquid funds and derivative financial
instruments is limited because the counter parties are banks with
high credit ratings assigned by the international credit-rating
agencies.
The group’s services are provided to a variety of contractual coun-
ter parties and are therefore subject to the risk of non payment
for services or non reimbursement of costs. Receivables consist
of a relatively small number of customers, but the customers are
16. PREPAYMENTS
(USD in thousands)
2016 2015
Prepaid insurance 319 320
Prepaid lease 162 350
Prepaid rent 282 307
Prepaid creditors 1,621 2,132
Other prepayments 735 214
Total prepayments 3,119 3,323
17. SHARE CAPITAL
The share capital consists of 4,894,994 units of DKK 1 / USD 0.17. All shares are fully paid.
(USD in thousands) Class A Shares
Class B Shares
2016 Total
Class A Shares
Class B Shares
2015 Total
Share units 01.01 835 0 835 587 237 824
Capital increase 02.07.15 0 0 0 11 0 11
Capital increase 26.10.15 0 0 0 237 0 237
Capital decrease 26.10.15 0 0 0 0 (237) (237)
Capital increase 06.07.16 15 0 15 0 0 0
Share units 31.12 850 0 850 835 0 835
In 2015 the division into Class A and B shares was repealed.
In 2013 Welltec International ApS issued shares of nominal DKK 150 thousand (USD 27 thousand) that according to the subscription agreement (and subject to certain conditions being met) have rights within a specific timeframe if Welltec does not complete an IPO.
In 2007, Welltec International ApS issued 71,601 warrants to Jørgen Hallundbæk as owner, which were exercisable from December 31, 2014 and until December 31, 2017. The total fair value of these warrants is USD 6,244 thousand as at December 31, 2016 (December 31, 2015: USD 9,435 thousand).
No dividend was paid out in 2016 or 2015, and no dividend is proposed related to the financial year 2016.
large corporations in the oil industry. Companies with high credit
ratings and the group’s loss on trade receivables are historically
immaterial. There is an ongoing centralized follow-up on out-
standing trade receivables in accordance with the group’s dunning
procedures. If there is uncertainty of a customer’s ability or will to
pay, and if the management assess that the receivables is doubt-
ful, the receivables will be written down to avoid this risk.
The maximum credit risk related to financial assets corresponds to
the carrying amount. In case where there may be a risk of loss, a
write-down will be made based on individual assessment.

WELLTEC® ANNUAL REPORT 2016 FINANCIAL STATEMENTS / 49
NOTES
Number of
sharesNominal
value in DKK
Share of
capital in %
Own shares 01.01.2015 195,281 195,281 4.1
Purchase of shares 35,388 35,388 0.7
Own shares 31.12.2015 230,669 230,669 4.8
Purchase of shares 5,328 5,328 0.0
Own shares 31.12.2016 235,997 235,997 4.8
The group holds 0 own warrants at December 31, 2016 (December 31, 2015: 14,500 warrants).
During 2016 Welltec has purchased 5,328 own shares at a value of USD 771 thousand.
Welltec invests in own shares using excess liquidity to reduce the number of shareholders.
18. DEFERRED TAX ASSETS AND LIABILITIES
(USD in thousands)2016 2015
Deferred tax 01.01 43,244 45,365
Exchange rate adjustments (2.121) 203
Adjustment in deferred tax previous years 1,324 (395)
Change in deferred tax for the year (19,761) (2,366)
Effect of change in income tax rate, current year 9 437
Effect of change in income tax rate, coming years 0 0
Deferred tax assets (-)/liabilities 31.12 22,695 43,244
Deferred tax breakdown:
Intangible assets 25,250 36,847
Tangible assets (352) 4,314
Current and non-current liabilities (297) 2,040
Current assets (91) 173
Change in tax rate, coming years 0 0
Tax loss carried forward (1,815) (130)
Deferred tax assets (-)/liabilities 31.12 22,695 43,244
Deferred tax is recognized in the statement of financial position with:
Deferred tax assets (2,083) (816)
Deferred tax liabilities 24,778 44,060
Deferred tax assets (-)/liabilities 31.12 22,695 43,244
The group does not recognize deferred tax assets that are unlikely to be realized or otherwise exposed to major risk or uncertainty. The tax value of the tax asset not capitalized has been estimated at December 31, 2016, to be approx. USD 0 thousand (December 31, 2015 USD 8,903 thousand).

50 WELLTEC® ANNUAL REPORT 2016 / FINANCIAL STATEMENTS
19. CURRENT AND NON-CURRENT FINANCIAL LIABILITIES
(USD in thousands)2016 2015
Issued bonds 320,250 317,741
Holding of own bonds (27,009) (7,793)
Bank debt 26,029 26,813
Finance lease commitments 8,863 9,368
328,133 346,129
Due within 1 year 1,398 1,357
Due within 1-2 years 27,138 1,237
Due within 2-3 years 294,199 27,737
Due within 3-4 years 1,034 310,724
Due within 4-5 years 620 854
Due after 5 years 3,744 4,220
328,133 346,129
Recognition of short-term and long-term financial liabilities in the statement of financial position:
Non-current financial liabilities — lease commitments 7,465 8,011
Non-current financial liabilities — issued bonds (incl. holding of own bonds) 293,241 309,948
Non-current financial liabilities — bank debt 26,029 26,813
Current financial liabilities 1,398 1,357
328,133 346,129
NOTES
2015
Currency Expiry
Fixed or
floating
interest
Effective
interest
rate %
Carrying
amount local
(thousands)
Carrying
amount USD
(thousands)
DKK 2024 floating 0.95-6.89 63,982 9,368
EUR 2018 floating 2.1 25,000 26,813
USD 2019 fixed 8.5 309,948 309,948
346,129
2016
Currency Expiry
Fixed or
floating
interest
Effective
interest
rate %
Carrying
amount local
(thousands)
Carrying
amount USD
(thousands)
DKK 2024 floating 0.95-6.89 62,509 8,863
EUR 2018 floating 2.1 25,000 26,029
USD 2019 fixed 8.5 293,241 293,241
328,133Issued bonds and bank debtIn February 2012, Welltec A/S issued bonds of a value of USD 325 million. The bonds have a fixed interest of 8% and an effective rate of 8.5%. The bonds are repayable in full in February 2019. The fair value of issued bonds at December 31 2016, is USD 328 million (December 31, 2015 USD 309 million). The fair value is based on the OTC quoted market price 101.00 USD per. note (December 31, 2015 95.00 USD per note) (level 1). Welltec has in 2016 purchased own bonds for a nominal value of USD 19,230 thousand.
In April 2015, Welltec A/S obtained a bank loan through the European Investment Bank of EUR 25 million (USD 28 million). The bank loan has a variable interest of 2.2% + 6 months EURIBOR. The bank loan is repayable in December 2018. The carrying amount of the bank debt is approximately equal to the fair value as of December 31, 2016.

WELLTEC® ANNUAL REPORT 2016 FINANCIAL STATEMENTS / 51
19.1 Finance lease obligations
Finance lease relates to a building with a lease term of 10.5 years and manufacturing equipment with lease terms of 3-5 years. The
group has options to purchase the building and equipment for a nominal amount at the end of the lease agreements. The group’s obli-
gations under finance leases are secured by the lessors’ title to the leased assets.
2016 2015
(USD in thousands)Minimum lease
payments
Present value of minimum lease
paymentMinimum lease
payments
Present value of minimum lease
payment
Maturity of finance lease obligations:
Within 1 year 1,448 1,398 1,408 1,357
Between 1 and 5 years 3,868 3,722 3,942 3,791
Over 5 years 4,721 3,743 5,309 4,220
Total finance lease obligations 10,037 8,863 10,659 9,368
(USD in thousands)
2016 2015
Interest from finance lease, expensed (547) (496)
The fair value of the finance lease liabilities is approximately equal to their carrying amount as of December 31, 2016, and December 31, 2015.
NOTES
19.2 Maturity dates for financial liabilities
2015
(USD in thousands) Less than 1 yearBetween 1 and
5 yearsLater than 5
years Total
Finance lease commitments 1,357 3,791 4,220 9,368
Issued bonds (incl. holding of own bonds) 0 309,948 0 309,948
Bank debt 0 26,813 0 26,813
Trade payables 12,111 0 0 12,111
Other payables 35,182 0 0 35,182
Total financial liabilities 48,650 340,552 4,220 393,422
All debt is measured at amortized cost, except from derivative financial instruments of USD 1,030 thousand that are measured at fair value through profit or loss. Derivative financial instruments are included in ‘Other non-current liabilities’. The amounts in the table above are exclusive of interest.
Interest on issued bonds mature on an annual basis with USD 26 million until maturity on February 1, 2019.
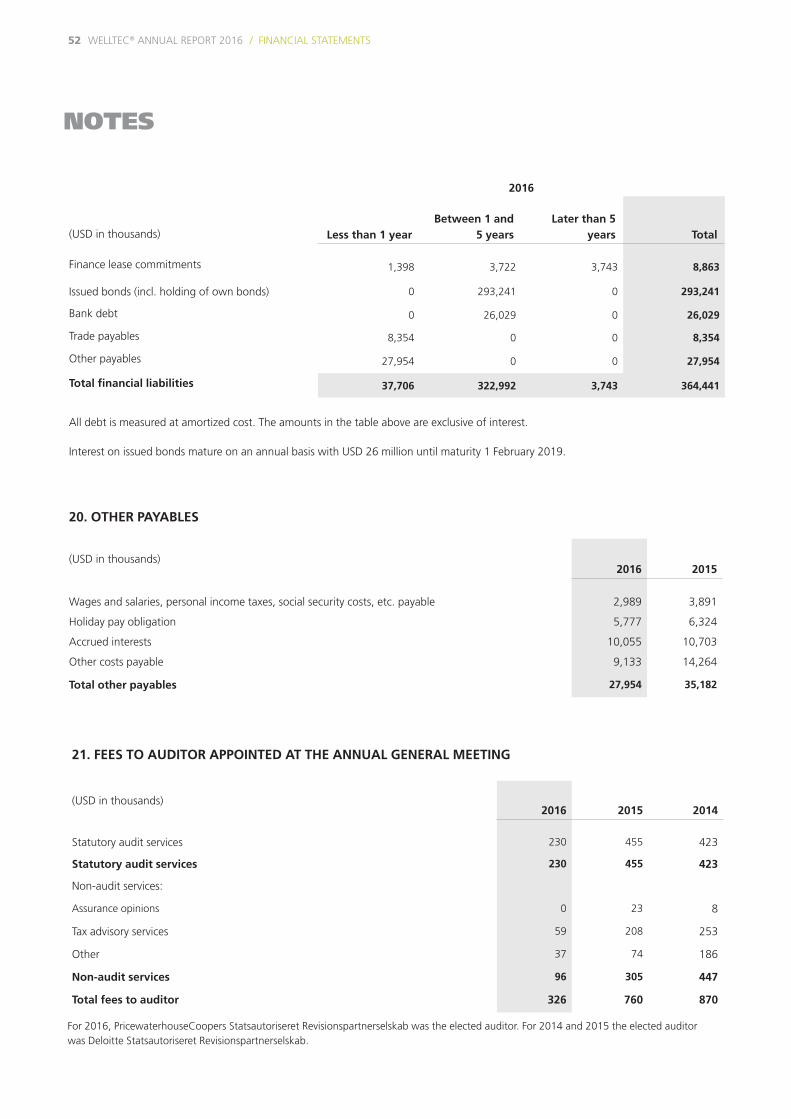
52 WELLTEC® ANNUAL REPORT 2016 / FINANCIAL STATEMENTS
2016
(USD in thousands) Less than 1 yearBetween 1 and
5 yearsLater than 5
years Total
Finance lease commitments 1,398 3,722 3,743 8,863
Issued bonds (incl. holding of own bonds) 0 293,241 0 293,241
Bank debt 0 26,029 0 26,029
Trade payables 8,354 0 0 8,354
Other payables 27,954 0 0 27,954
Total financial liabilities 37,706 322,992 3,743 364,441
All debt is measured at amortized cost. The amounts in the table above are exclusive of interest.
Interest on issued bonds mature on an annual basis with USD 26 million until maturity 1 February 2019.
NOTES
20. OTHER PAYABLES
(USD in thousands)2016 2015
Wages and salaries, personal income taxes, social security costs, etc. payable 2,989 3,891
Holiday pay obligation 5,777 6,324
Accrued interests 10,055 10,703
Other costs payable 9,133 14,264
Total other payables 27,954 35,182
21. FEES TO AUDITOR APPOINTED AT THE ANNUAL GENERAL MEETING
(USD in thousands)2016 2015 2014
Statutory audit services 230 455 423
Statutory audit services 230 455 423
Non-audit services:
Assurance opinions 0 23 8
Tax advisory services 59 208 253
Other 37 74 186
Non-audit services 96 305 447
Total fees to auditor 326 760 870
For 2016, PricewaterhouseCoopers Statsautoriseret Revisionspartnerselskab was the elected auditor. For 2014 and 2015 the elected auditor was Deloitte Statsautoriseret Revisionspartnerselskab.
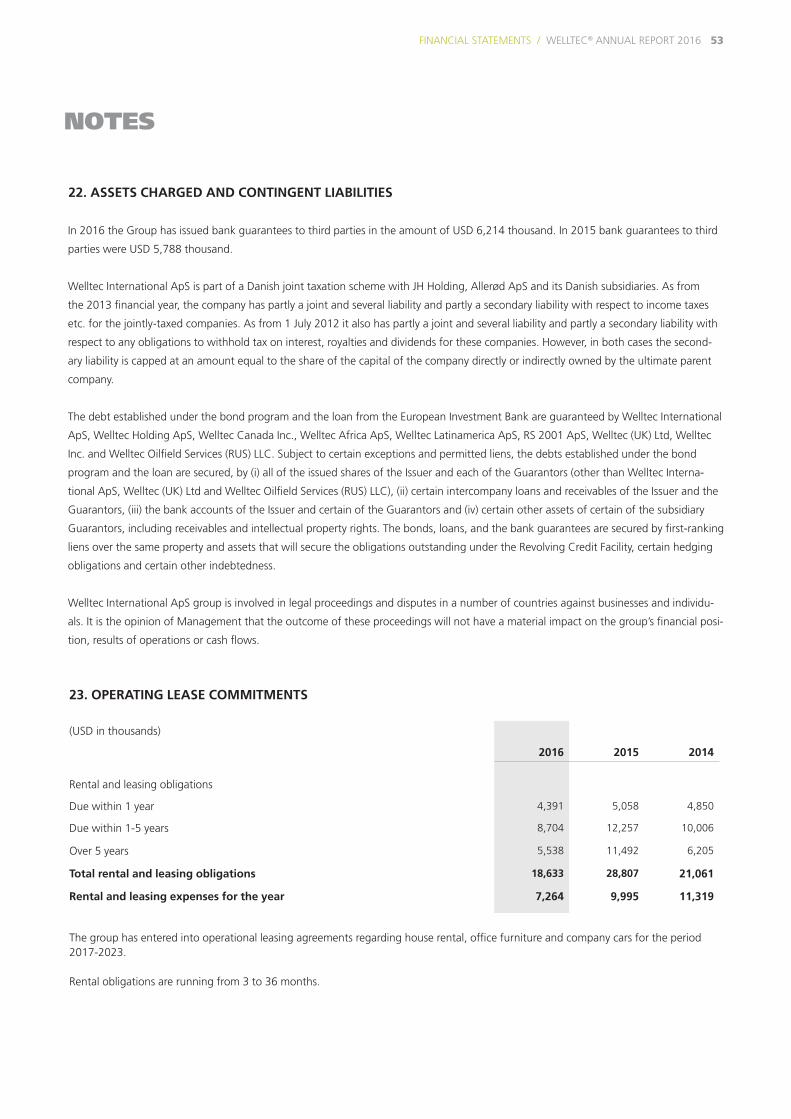
WELLTEC® ANNUAL REPORT 2016 FINANCIAL STATEMENTS / 53
NOTES
In 2016 the Group has issued bank guarantees to third parties in the amount of USD 6,214 thousand. In 2015 bank guarantees to third
parties were USD 5,788 thousand.
Welltec International ApS is part of a Danish joint taxation scheme with JH Holding, Allerød ApS and its Danish subsidiaries. As from
the 2013 financial year, the company has partly a joint and several liability and partly a secondary liability with respect to income taxes
etc. for the jointly-taxed companies. As from 1 July 2012 it also has partly a joint and several liability and partly a secondary liability with
respect to any obligations to withhold tax on interest, royalties and dividends for these companies. However, in both cases the second-
ary liability is capped at an amount equal to the share of the capital of the company directly or indirectly owned by the ultimate parent
company.
The debt established under the bond program and the loan from the European Investment Bank are guaranteed by Welltec International
ApS, Welltec Holding ApS, Welltec Canada Inc., Welltec Africa ApS, Welltec Latinamerica ApS, RS 2001 ApS, Welltec (UK) Ltd, Welltec
Inc. and Welltec Oilfield Services (RUS) LLC. Subject to certain exceptions and permitted liens, the debts established under the bond
program and the loan are secured, by (i) all of the issued shares of the Issuer and each of the Guarantors (other than Welltec Interna-
tional ApS, Welltec (UK) Ltd and Welltec Oilfield Services (RUS) LLC), (ii) certain intercompany loans and receivables of the Issuer and the
Guarantors, (iii) the bank accounts of the Issuer and certain of the Guarantors and (iv) certain other assets of certain of the subsidiary
Guarantors, including receivables and intellectual property rights. The bonds, loans, and the bank guarantees are secured by first-ranking
liens over the same property and assets that will secure the obligations outstanding under the Revolving Credit Facility, certain hedging
obligations and certain other indebtedness.
Welltec International ApS group is involved in legal proceedings and disputes in a number of countries against businesses and individu-
als. It is the opinion of Management that the outcome of these proceedings will not have a material impact on the group’s financial posi-
tion, results of operations or cash flows.
22. ASSETS CHARGED AND CONTINGENT LIABILITIES
23. OPERATING LEASE COMMITMENTS
(USD in thousands)
2016 2015 2014
Rental and leasing obligations
Due within 1 year 4,391 5,058 4,850
Due within 1-5 years 8,704 12,257 10,006
Over 5 years 5,538 11,492 6,205
Total rental and leasing obligations 18,633 28,807 21,061
Rental and leasing expenses for the year 7,264 9,995 11,319
The group has entered into operational leasing agreements regarding house rental, office furniture and company cars for the period 2017-2023.
Rental obligations are running from 3 to 36 months.

54 WELLTEC® ANNUAL REPORT 2016 / FINANCIAL STATEMENTS
NOTES
24.1 General capital structure
The group is financed partly through equity and partly through long-term debt. Management assesses on a regular basis whether the
group’s capital structure is in accordance with the group’s and shareholders’ interests. The overall objective is to ensure a capital struc-
ture that supports long-term growth and also maximizes returns to the shareholders of the group by optimizing the debt to equity
ratio. The group’s overall objective remains the same.
24.2 Market risk
Due to the group’s foreign activities and credit facilities in foreign currencies, its profit/loss, cash flows and equity are affected by
changes in exchange rates and interest rates for a number of currencies.
A significant part of this change in exchange rates has been eliminated by changing functional currency for the Danish companies to
US Dollar from 2012.
24.2.1 Foreign currency risk management
The reporting currency of the group is US dollars. The functional currency of the Danish companies is considered to be US dollars, and
the rest of the group’s subsidiaries have the functional currency of the country in which the subsidiary is domiciled. A proportion of
the group’s revenues, expenses and other liabilities are denominated in currencies other than US dollars, in particular Danish kroner,
Norwegian kroner and British pounds. Exchange rate exposures are managed within approved policy parameters.
24. FINANCIAL INSTRUMENTS
The carrying amounts of the group’s foreign currency denominated monetary assets and monetary liabilities at the end of the re-
porting period are as follows stated in the material currencies affecting the group:
Assets Liabilities
(USD in thousands) 2016 2015 2016 2015
DKK 235,915 171,293 (210,091) (117,730)
GBP 14,759 7,341 (9,900) (4,190)
NOK 6,484 27,011 (3,791) (15,140)
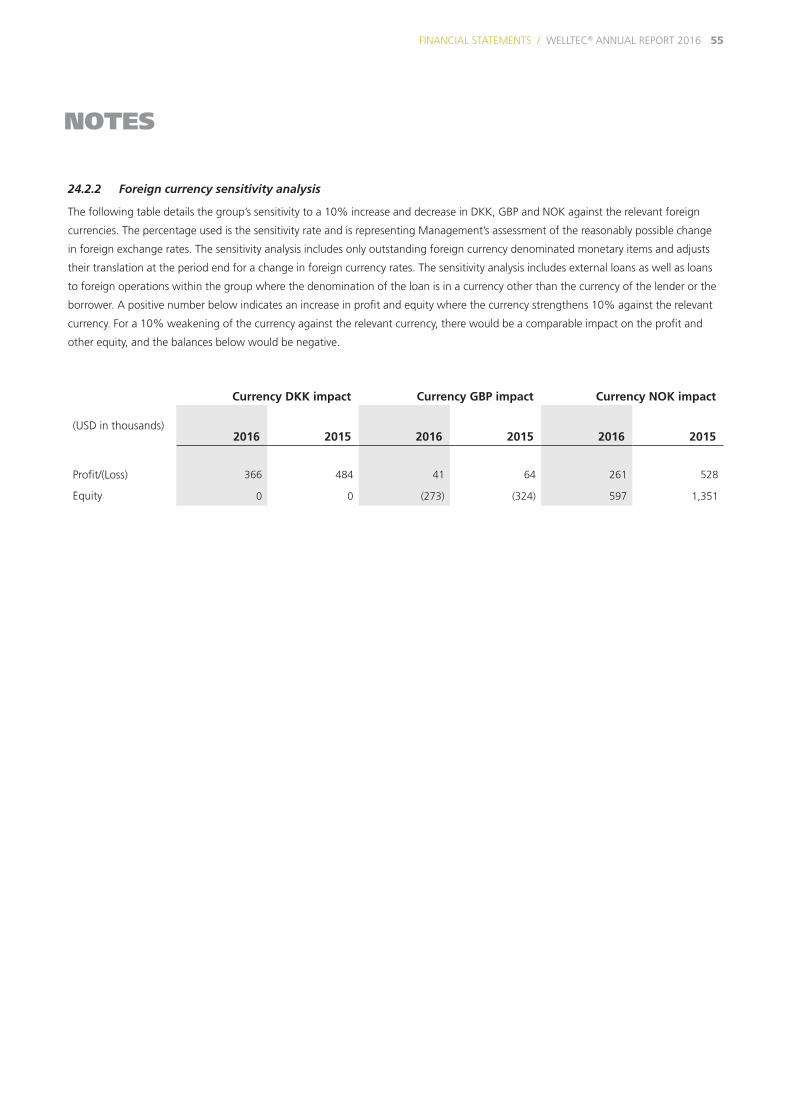
WELLTEC® ANNUAL REPORT 2016 FINANCIAL STATEMENTS / 55
NOTES
24.2.2 Foreign currency sensitivity analysis
The following table details the group’s sensitivity to a 10% increase and decrease in DKK, GBP and NOK against the relevant foreign
currencies. The percentage used is the sensitivity rate and is representing Management’s assessment of the reasonably possible change
in foreign exchange rates. The sensitivity analysis includes only outstanding foreign currency denominated monetary items and adjusts
their translation at the period end for a change in foreign currency rates. The sensitivity analysis includes external loans as well as loans
to foreign operations within the group where the denomination of the loan is in a currency other than the currency of the lender or the
borrower. A positive number below indicates an increase in profit and equity where the currency strengthens 10% against the relevant
currency. For a 10% weakening of the currency against the relevant currency, there would be a comparable impact on the profit and
other equity, and the balances below would be negative.
Currency DKK impact Currency GBP impact Currency NOK impact
(USD in thousands)2016 2015 2016 2015 2016 2015
Profit/(Loss) 366 484 41 64 261 528
Equity 0 0 (273) (324) 597 1,351
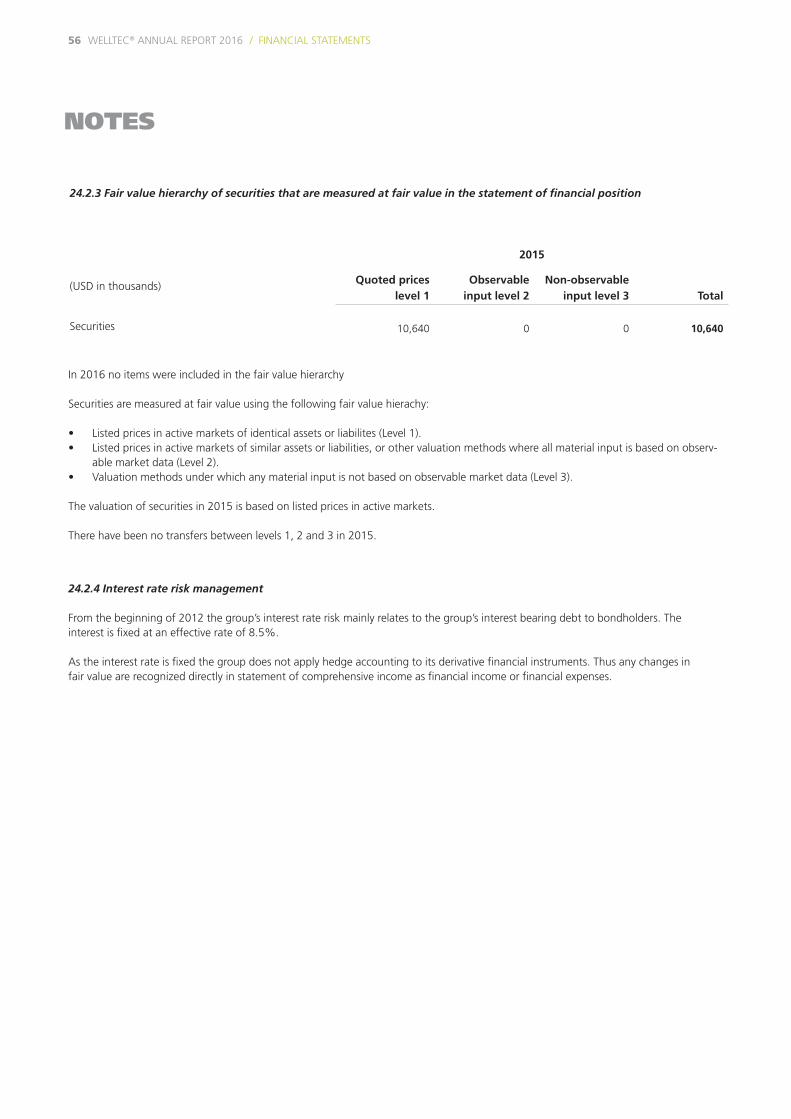
56 WELLTEC® ANNUAL REPORT 2016 / FINANCIAL STATEMENTS
NOTES
24.2.3 Fair value hierarchy of securities that are measured at fair value in the statement of financial position
2015
(USD in thousands) Quoted prices level 1
Observable input level 2
Non-observable input level 3 Total
Securities 10,640 0 0 10,640
24.2.4 Interest rate risk management
From the beginning of 2012 the group’s interest rate risk mainly relates to the group’s interest bearing debt to bondholders. The interest is fixed at an effective rate of 8.5%.
As the interest rate is fixed the group does not apply hedge accounting to its derivative financial instruments. Thus any changes in fair value are recognized directly in statement of comprehensive income as financial income or financial expenses.
In 2016 no items were included in the fair value hierarchy
Securities are measured at fair value using the following fair value hierachy:
• Listed prices in active markets of identical assets or liabilites (Level 1).• Listed prices in active markets of similar assets or liabilities, or other valuation methods where all material input is based on observ-
able market data (Level 2).• Valuation methods under which any material input is not based on observable market data (Level 3).
The valuation of securities in 2015 is based on listed prices in active markets.
There have been no transfers between levels 1, 2 and 3 in 2015.

WELLTEC® ANNUAL REPORT 2016 FINANCIAL STATEMENTS / 57
24.2.3 Fair value hierarchy of securities that are measured at fair value in the statement of financial position
2015
(USD in thousands) Quoted prices level 1
Observable input level 2
Non-observable input level 3 Total
Securities 10,640 0 0 10,640
NOTES
24.2.5 Interest rate sensitivity analysis
The group’s interest-bearing debt for 2016 is primarily fixed to 8.5% due to the bond loan, however the EIB loan has a variable interest of 2.2% + 6 months EURIBOR.
A 250 basis point increase or decrease represents Management’s assessment of the reasonably possible change in interest rates.
If interest rates had been 250 basis points higher/lower and all other variables were held constant, the group’s:
Profit for the year and equity as of December 31, 2016 would be affected with USD 675 thousand (2015: 675 thousand).
24.3 Liquidity risk management
It is the group’s policy that capital raising and distribution of cash are managed centrally by the group’s finance department to the extent
it is deemed appropriate. The group manages liquidity risk by maintaining adequate reserves, banking facilities and reserve borrowing
facilities, by continuously monitoring forecast and actual cash flows.
The group is adjusting centrally the cash outflow in investments in intangible assets and property, plant and equipment in Denmark.
Please see note 19.2. Maturity dates for financial liabilities.
24.4 Categories of financial instruments
(USD in thousands) 2016 2015
Other receivables 1,776 1,756
Trade receivables 45,489 61,244
Other receivables 7,271 5,757
Prepayments 3,119 3,323
Cash and cash equivalents 53,500 61,040
Receivables and loans 111,155 133,120
Securities 0 10,640
Fair value through profit and loss 0 10,640
Finance lease commitments 8,863 9,368
Issued bonds 293,241 309,948
Trade payables 8,354 12,111
Current tax liabilities 4,228 7,256
Other payables 27,954 35,182
Financial liabilities measured at amortized cost 342,640 373,865
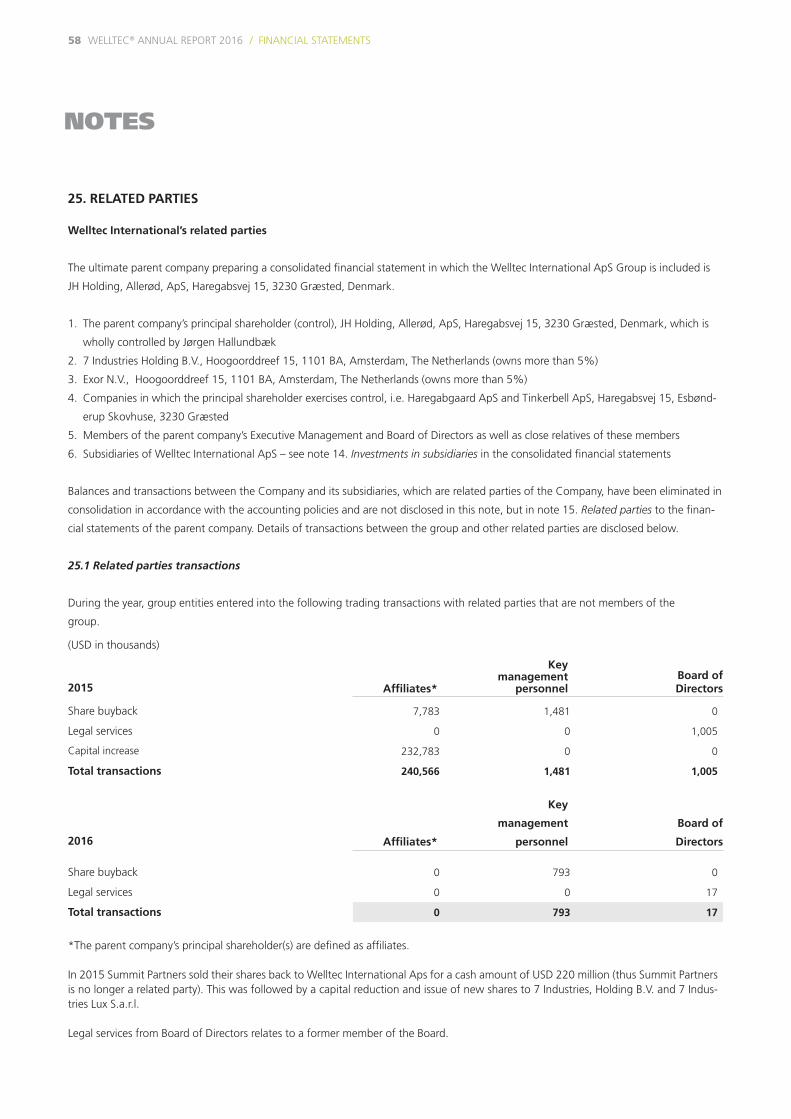
58 WELLTEC® ANNUAL REPORT 2016 / FINANCIAL STATEMENTS
NOTES
25. RELATED PARTIES
Welltec International’s related parties
The ultimate parent company preparing a consolidated financial statement in which the Welltec International ApS Group is included is
JH Holding, Allerød, ApS, Haregabsvej 15, 3230 Græsted, Denmark.
1. The parent company’s principal shareholder (control), JH Holding, Allerød, ApS, Haregabsvej 15, 3230 Græsted, Denmark, which is
wholly controlled by Jørgen Hallundbæk
2. 7 Industries Holding B.V., Hoogoorddreef 15, 1101 BA, Amsterdam, The Netherlands (owns more than 5%)
3. Exor N.V., Hoogoorddreef 15, 1101 BA, Amsterdam, The Netherlands (owns more than 5%)
4. Companies in which the principal shareholder exercises control, i.e. Haregabgaard ApS and Tinkerbell ApS, Haregabsvej 15, Esbønd-
erup Skovhuse, 3230 Græsted
5. Members of the parent company’s Executive Management and Board of Directors as well as close relatives of these members
6. Subsidiaries of Welltec International ApS – see note 14. Investments in subsidiaries in the consolidated financial statements
Balances and transactions between the Company and its subsidiaries, which are related parties of the Company, have been eliminated in
consolidation in accordance with the accounting policies and are not disclosed in this note, but in note 15. Related parties to the finan-
cial statements of the parent company. Details of transactions between the group and other related parties are disclosed below.
25.1 Related parties transactions
During the year, group entities entered into the following trading transactions with related parties that are not members of the
group.
(USD in thousands)
2015 Affiliates*
Key management
personnelBoard of Directors
Share buyback 7,783 1,481 0
Legal services 0 0 1,005
Capital increase 232,783 0 0
Total transactions 240,566 1,481 1,005
2016 Affiliates*
Key
management
personnel
Board of
Directors
Share buyback 0 793 0
Legal services 0 0 17
Total transactions 0 793 17
*The parent company’s principal shareholder(s) are defined as affiliates.
In 2015 Summit Partners sold their shares back to Welltec International Aps for a cash amount of USD 220 million (thus Summit Partners is no longer a related party). This was followed by a capital reduction and issue of new shares to 7 Industries, Holding B.V. and 7 Indus-tries Lux S.a.r.l.
Legal services from Board of Directors relates to a former member of the Board.

WELLTEC® ANNUAL REPORT 2016 FINANCIAL STATEMENTS / 59
NOTES
The following balances were outstanding at the end of the reporting period:
(USD in thousands)Amounts owed by related parties Amounts owed to related parties
2016 2015 2016 2015
Executive Board and Board of Directors 0 0 (3) (563)
Total balances 0 0 (3) (563)
26. EVENTS AFTER THE BALANCE SHEET DATE
No other significant events regarding the group’s activities have occurred since December 31, 2016.

60 WELLTEC® ANNUAL REPORT 2016 / FINANCIAL STATEMENTS
FINANCIAL STATEMENTS FINANCIAL STATEMENTS
2016

WELLTEC® ANNUAL REPORT 2016 FINANCIAL STATEMENTS / 61
2016
FINANCIAL STATEMENTS PARENT COMPANY

62 WELLTEC® ANNUAL REPORT 2016 / FINANCIAL STATEMENTS
For the years ended December 31, 2016, 2015 and 2014
(USD in thousands)NOTE 2016 2015 2014
Administrative costs 3 (163) (469) (285)
Operating loss (EBIT) (163) (469) (285)
Financial income 4 2,940 8,453 12,712
Financial expenses 5 (4,302) (4,326) (6,098)
Profit/(loss) before tax (1,525) 3,658 6,329
Income taxes 6 (171) 570 (21)
Profit/(loss) for the year (1,696) 4,228 6,308
Total comprehensive income/(loss) (1,696) 4,228 6,308
Allocation of total comprehensive income/(loss)
Transferred to retained earnings (1,696) 4,228 6,308
PARENT STATEMENT OF COMPREHENSIVE INCOME

WELLTEC® ANNUAL REPORT 2016 FINANCIAL STATEMENTS / 63
As of December 31, 2016 and 2015
(USD in thousands)NOTE 2016 2015
Non-current assets
Financial assets
Deferred tax assets 40 0
Loan to subsidiaries 15 0 17,394
Investments in subsidiaries 9 392,678 392,576
Total financial assets 392,718 409,970
Total non-current assets 392,718 409,970
Current assets
Receivables
Tax receivables 0 351
Receivables from subsidiaries and affiliates 15 772 3,015
Total receivables 772 3,366
Cash and cash equivalents 1,007 738
Total current assets 1,779 4,104
Total assets 394,497 414,074
PARENT STATEMENT OF FINANCIAL POSITION
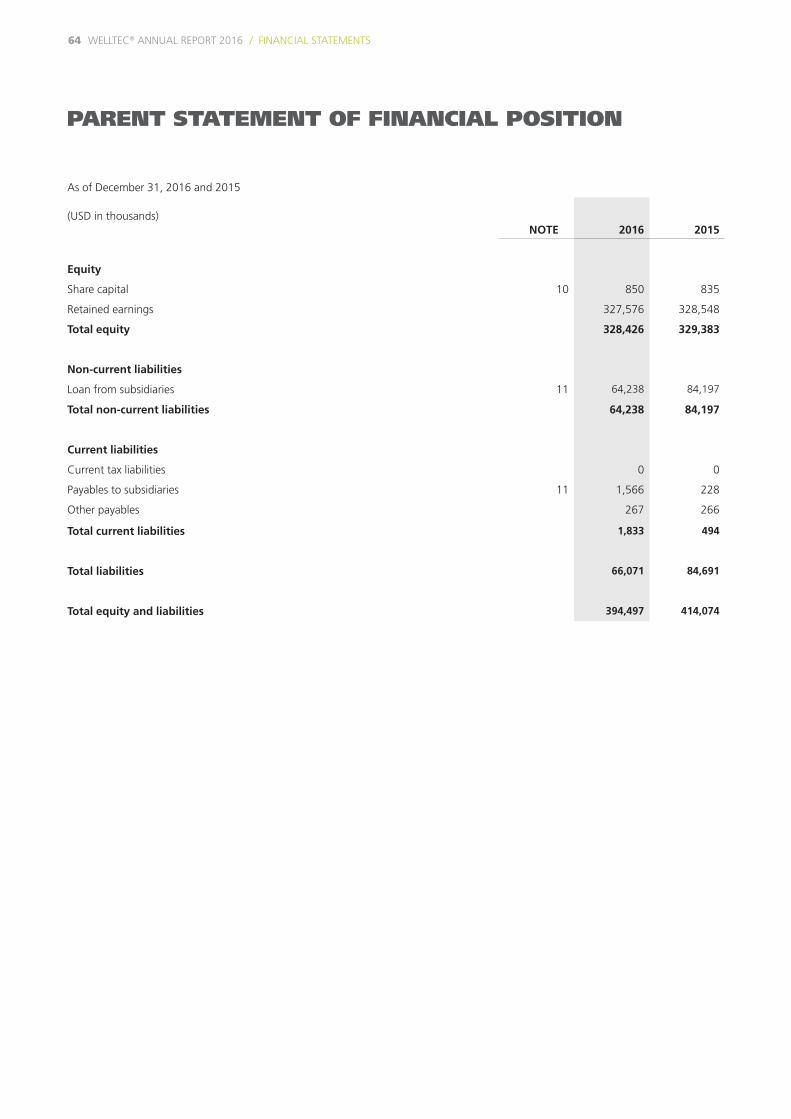
64 WELLTEC® ANNUAL REPORT 2016 / FINANCIAL STATEMENTS
As of December 31, 2016 and 2015
(USD in thousands)NOTE 2016 2015
Equity
Share capital 10 850 835
Retained earnings 327,576 328,548
Total equity 328,426 329,383
Non-current liabilities
Loan from subsidiaries 11 64,238 84,197
Total non-current liabilities 64,238 84,197
Current liabilities
Current tax liabilities 0 0
Payables to subsidiaries 11 1,566 228
Other payables 267 266
Total current liabilities 1,833 494
Total liabilities 66,071 84,691
Total equity and liabilities 394,497 414,074
PARENT STATEMENT OF FINANCIAL POSITION
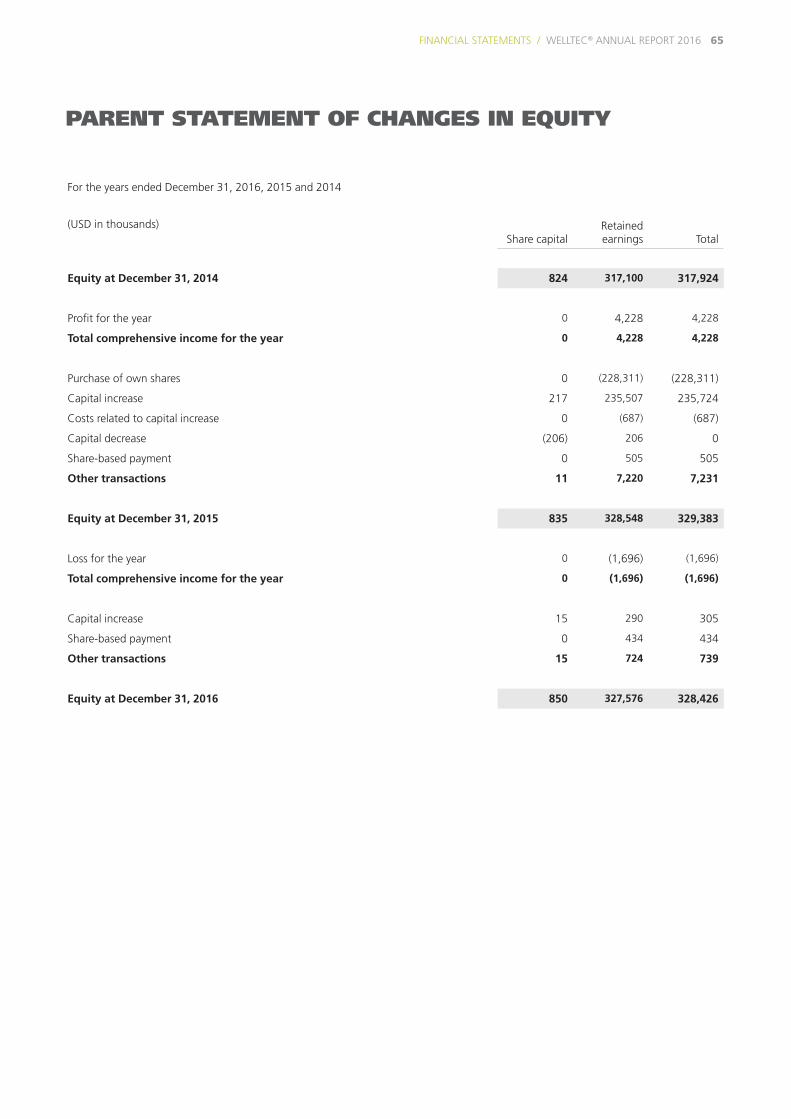
WELLTEC® ANNUAL REPORT 2016 FINANCIAL STATEMENTS / 65
For the years ended December 31, 2016, 2015 and 2014
(USD in thousands)Share capital
Retained earnings Total
Equity at December 31, 2014 824 317,100 317,924
Profit for the year 0 4,228 4,228
Total comprehensive income for the year 0 4,228 4,228
Purchase of own shares 0 (228,311) (228,311)
Capital increase 217 235,507 235,724
Costs related to capital increase 0 (687) (687)
Capital decrease (206) 206 0
Share-based payment 0 505 505
Other transactions 11 7,220 7,231
Equity at December 31, 2015 835 328,548 329,383
Loss for the year 0 (1,696) (1,696)
Total comprehensive income for the year 0 (1,696) (1,696)
Capital increase 15 290 305
Share-based payment 0 434 434
Other transactions 15 724 739
Equity at December 31, 2016 850 327,576 328,426
PARENT STATEMENT OF CHANGES IN EQUITY

66 WELLTEC® ANNUAL REPORT 2016 / FINANCIAL STATEMENTS
For the years ended December 31, 2016, 2015 and 2014
(USD in thousands)NOTE 2016 2015 2014
Operating loss (EBIT) (163) (469) (285)
Non-cash adjustments 7 2,556 1,142 285
Changes in working capital 8 3,582 (598) 16
Income taxes received (paid) 140 0 0
Cash flows from operating activities 6,115 75 16
Repayment of loan from affiliates (6,150) (7,413) 0
Dividend received from subsidiaries 0 0 0
Cash flows from investing activities (6,150) (7,413) 0
Financial expenses paid (1) 0 0
Purchase of own shares 0 (228,311) 0
Capital increase 305 235,724 0
Cash flows from financing activities 304 7,413 0
Increase/decrease in cash and cash equivalents 269 75 16
Exchange rate adjustment at beginning of period 0 (74) (94)
Cash and cash equivalents at beginning of period 738 737 815
Cash and cash equivalents at December 31 1,007 738 737
Hereof restricted cash 203 92 16
PARENT STATEMENT OF CASH FLOWS
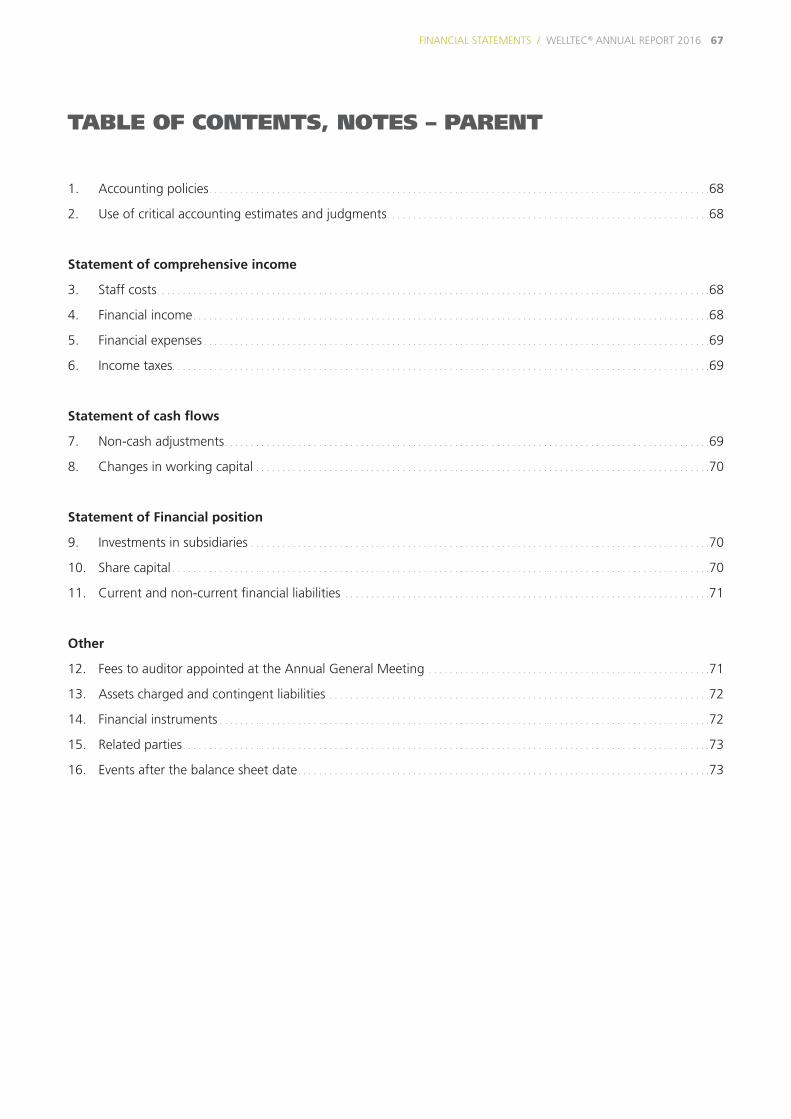
WELLTEC® ANNUAL REPORT 2016 FINANCIAL STATEMENTS / 67
TABLE OF CONTENTS, NOTES – PARENT
1. Accounting policies . . . . . . . . . . . . . . . . . . . . . . . . . . . . . . . . . . . . . . . . . . . . . . . . . . . . . . . . . . . . . . . . . . . . . . . . . . . . . . . . . . . . . . . . . . . . . . . .68
2. Use of critical accounting estimates and judgments . . . . . . . . . . . . . . . . . . . . . . . . . . . . . . . . . . . . . . . . . . . . . . . . . . . . . . . . . . . . . .68
Statement of comprehensive income
3. Staff costs . . . . . . . . . . . . . . . . . . . . . . . . . . . . . . . . . . . . . . . . . . . . . . . . . . . . . . . . . . . . . . . . . . . . . . . . . . . . . . . . . . . . . . . . . . . . . . . . . . . . . . . . . .68
4. Financial income . . . . . . . . . . . . . . . . . . . . . . . . . . . . . . . . . . . . . . . . . . . . . . . . . . . . . . . . . . . . . . . . . . . . . . . . . . . . . . . . . . . . . . . . . . . . . . . . . . .68
5. Financial expenses . . . . . . . . . . . . . . . . . . . . . . . . . . . . . . . . . . . . . . . . . . . . . . . . . . . . . . . . . . . . . . . . . . . . . . . . . . . . . . . . . . . . . . . . . . . . . . . . .69
6. Income taxes . . . . . . . . . . . . . . . . . . . . . . . . . . . . . . . . . . . . . . . . . . . . . . . . . . . . . . . . . . . . . . . . . . . . . . . . . . . . . . . . . . . . . . . . . . . . . . . . . . . . . . .69
Statement of cash flows
7. Non-cash adjustments . . . . . . . . . . . . . . . . . . . . . . . . . . . . . . . . . . . . . . . . . . . . . . . . . . . . . . . . . . . . . . . . . . . . . . . . . . . . . . . . . . . . . . . . . . . . .69
8. Changes in working capital . . . . . . . . . . . . . . . . . . . . . . . . . . . . . . . . . . . . . . . . . . . . . . . . . . . . . . . . . . . . . . . . . . . . . . . . . . . . . . . . . . . . . . .70
Statement of Financial position
9. Investments in subsidiaries . . . . . . . . . . . . . . . . . . . . . . . . . . . . . . . . . . . . . . . . . . . . . . . . . . . . . . . . . . . . . . . . . . . . . . . . . . . . . . . . . . . . . . . .70
10. Share capital . . . . . . . . . . . . . . . . . . . . . . . . . . . . . . . . . . . . . . . . . . . . . . . . . . . . . . . . . . . . . . . . . . . . . . . . . . . . . . . . . . . . . . . . . . . . . . . . . . . . . . .70
11. Current and non-current financial liabilities . . . . . . . . . . . . . . . . . . . . . . . . . . . . . . . . . . . . . . . . . . . . . . . . . . . . . . . . . . . . . . . . . . . . . .71
Other
12. Fees to auditor appointed at the Annual General Meeting . . . . . . . . . . . . . . . . . . . . . . . . . . . . . . . . . . . . . . . . . . . . . . . . . . . . . .71
13. Assets charged and contingent liabilities . . . . . . . . . . . . . . . . . . . . . . . . . . . . . . . . . . . . . . . . . . . . . . . . . . . . . . . . . . . . . . . . . . . . . . . . .72
14. Financial instruments . . . . . . . . . . . . . . . . . . . . . . . . . . . . . . . . . . . . . . . . . . . . . . . . . . . . . . . . . . . . . . . . . . . . . . . . . . . . . . . . . . . . . . . . . . . . . .72
15. Related parties . . . . . . . . . . . . . . . . . . . . . . . . . . . . . . . . . . . . . . . . . . . . . . . . . . . . . . . . . . . . . . . . . . . . . . . . . . . . . . . . . . . . . . . . . . . . . . . . . . . . .73
16. Events after the balance sheet date . . . . . . . . . . . . . . . . . . . . . . . . . . . . . . . . . . . . . . . . . . . . . . . . . . . . . . . . . . . . . . . . . . . . . . . . . . . . . . .73
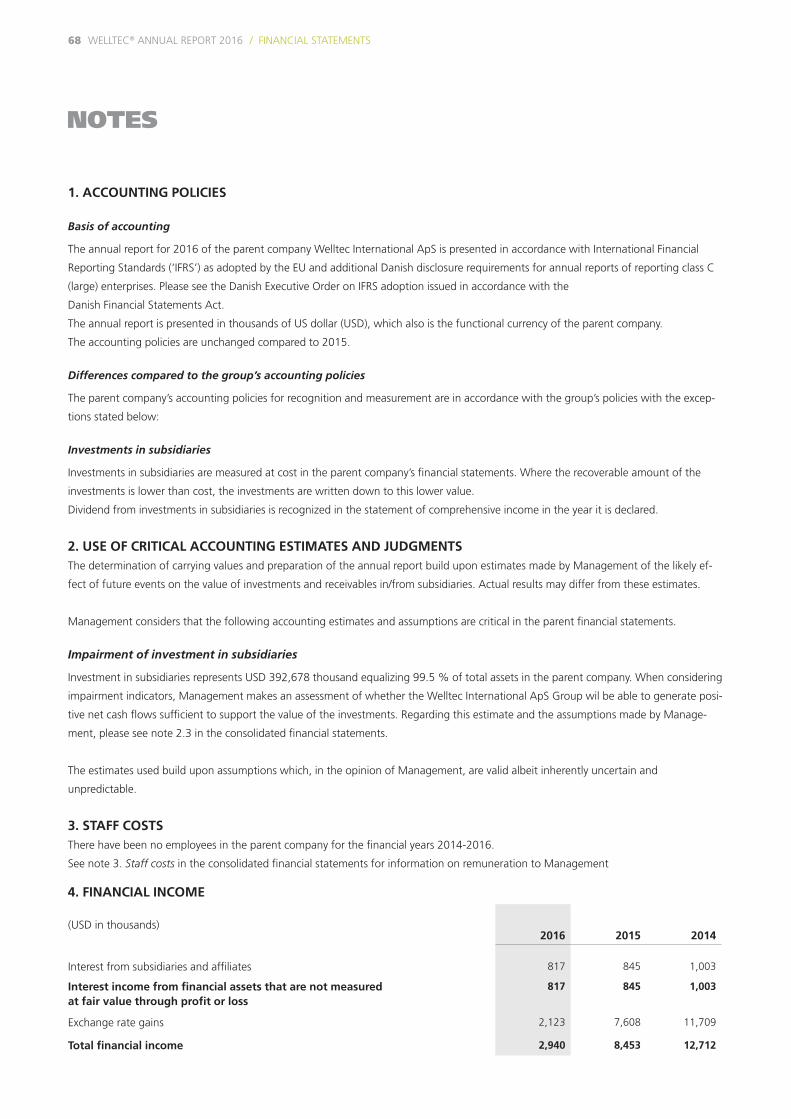
NOTES
68 WELLTEC® ANNUAL REPORT 2016 / FINANCIAL STATEMENTS
1. ACCOUNTING POLICIES
Basis of accounting
The annual report for 2016 of the parent company Welltec International ApS is presented in accordance with International Financial
Reporting Standards (‘IFRS’) as adopted by the EU and additional Danish disclosure requirements for annual reports of reporting class C
(large) enterprises. Please see the Danish Executive Order on IFRS adoption issued in accordance with the
Danish Financial Statements Act.
The annual report is presented in thousands of US dollar (USD), which also is the functional currency of the parent company.
The accounting policies are unchanged compared to 2015.
Differences compared to the group’s accounting policies
The parent company’s accounting policies for recognition and measurement are in accordance with the group’s policies with the excep-
tions stated below:
Investments in subsidiaries
Investments in subsidiaries are measured at cost in the parent company’s financial statements. Where the recoverable amount of the
investments is lower than cost, the investments are written down to this lower value.
Dividend from investments in subsidiaries is recognized in the statement of comprehensive income in the year it is declared.
2. USE OF CRITICAL ACCOUNTING ESTIMATES AND JUDGMENTSThe determination of carrying values and preparation of the annual report build upon estimates made by Management of the likely ef-
fect of future events on the value of investments and receivables in/from subsidiaries. Actual results may differ from these estimates.
Management considers that the following accounting estimates and assumptions are critical in the parent financial statements.
Impairment of investment in subsidiaries
Investment in subsidiaries represents USD 392,678 thousand equalizing 99.5 % of total assets in the parent company. When considering
impairment indicators, Management makes an assessment of whether the Welltec International ApS Group wil be able to generate posi-
tive net cash flows sufficient to support the value of the investments. Regarding this estimate and the assumptions made by Manage-
ment, please see note 2.3 in the consolidated financial statements.
The estimates used build upon assumptions which, in the opinion of Management, are valid albeit inherently uncertain and
unpredictable.
3. STAFF COSTSThere have been no employees in the parent company for the financial years 2014-2016.
See note 3. Staff costs in the consolidated financial statements for information on remuneration to Management
4. FINANCIAL INCOME
(USD in thousands)2016 2015 2014
Interest from subsidiaries and affiliates 817 845 1,003
Interest income from financial assets that are not measured at fair value through profit or loss
817 845 1,003
Exchange rate gains 2,123 7,608 11,709
Total financial income 2,940 8,453 12,712
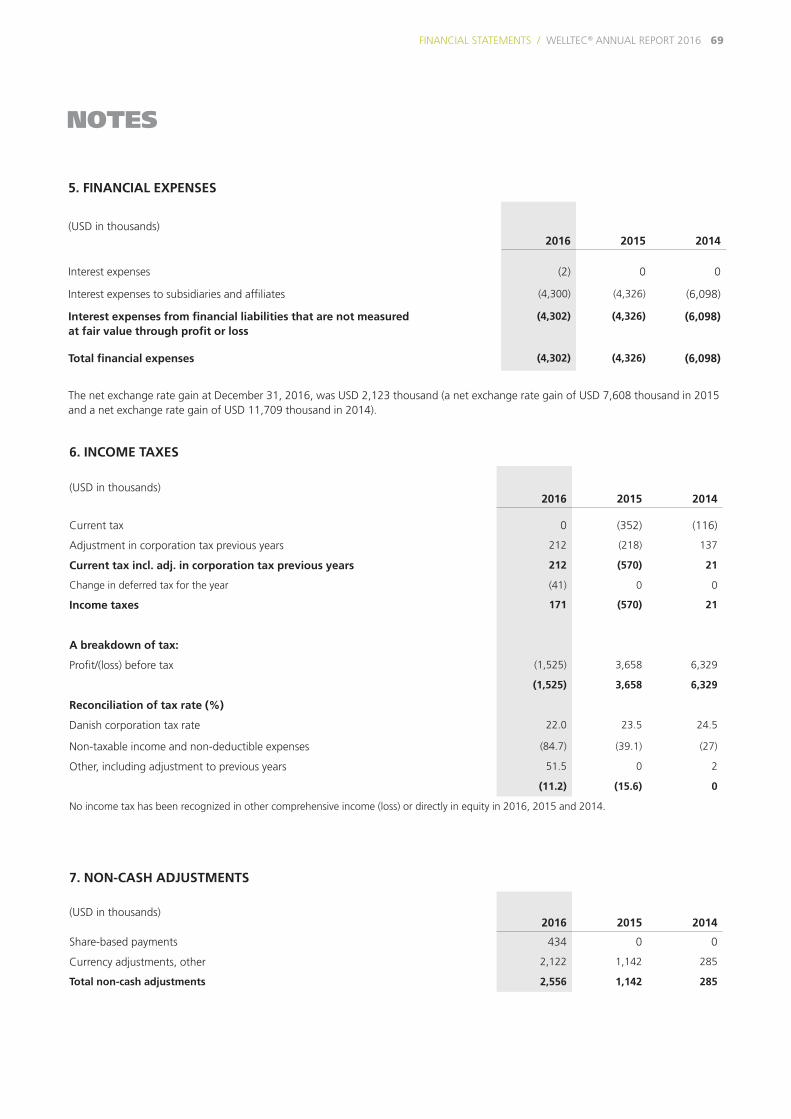
WELLTEC® ANNUAL REPORT 2016 FINANCIAL STATEMENTS / 69
NOTES
6. INCOME TAXES
(USD in thousands)2016 2015 2014
Current tax 0 (352) (116)
Adjustment in corporation tax previous years 212 (218) 137
Current tax incl. adj. in corporation tax previous years 212 (570) 21
Change in deferred tax for the year (41) 0 0
Income taxes 171 (570) 21
A breakdown of tax:
Profit/(loss) before tax (1,525) 3,658 6,329
(1,525) 3,658 6,329
Reconciliation of tax rate (%)
Danish corporation tax rate 22.0 23.5 24.5
Non-taxable income and non-deductible expenses (84.7) (39.1) (27)
Other, including adjustment to previous years 51.5 0 2
(11.2) (15.6) 0
No income tax has been recognized in other comprehensive income (loss) or directly in equity in 2016, 2015 and 2014.
5. FINANCIAL EXPENSES
(USD in thousands)2016 2015 2014
Interest expenses (2) 0 0
Interest expenses to subsidiaries and affiliates (4,300) (4,326) (6,098)
Interest expenses from financial liabilities that are not measured at fair value through profit or loss
(4,302) (4,326) (6,098)
Total financial expenses (4,302) (4,326) (6,098)
The net exchange rate gain at December 31, 2016, was USD 2,123 thousand (a net exchange rate gain of USD 7,608 thousand in 2015 and a net exchange rate gain of USD 11,709 thousand in 2014).
7. NON-CASH ADJUSTMENTS
(USD in thousands)2016 2015 2014
Share-based payments 434 0 0
Currency adjustments, other 2,122 1,142 285
Total non-cash adjustments 2,556 1,142 285

NOTES
70 WELLTEC® ANNUAL REPORT 2016 / FINANCIAL STATEMENTS
8. CHANGES IN WORKING CAPITAL
(USD in thousands)2016 2015 2014
Change in trade payables (8) 0 0
Change in receivables from subsidiaries and affiliates (net) 3,582 (847) 16
Change in other payables 8 249 0
Total changes in working capital 3,582 (598) 16
9. INVESTMENTS IN SUBSIDIARIES
(USD in thousands)2016 2015
Acquisition cost 01.01 392,576 392,576
Addition 102 0
Acquisition cost 31.12 392,678 392,576
The carrying amount of the investment in the subsidiary is pledged as security for issued bonds.
The parent company has an investment in the following subsidiary:
Name
Registered
country 2016 2015
Welltec Holding ApS Denmark 100%* 100%*
Welltec Switzerland (Holding) AG Switzerland 100%
* Welltec Holding ApS was acquired on July 27, 2007.
10. SHARE CAPITAL See note 17. Share capital in the consolidated financial statements.
The parent company Welltec International ApS holds no own shares and no own warrants.

WELLTEC® ANNUAL REPORT 2016 FINANCIAL STATEMENTS / 71
NOTES
11. CURRENT AND NON-CURRENT FINANCIAL LIABILITIES
11.1 Maturity dates for financial liabilities
2015
(USD in thousands)
Less than 1 year
Between 1 and 5 years
Later than 5 years
Total
Loan from subsidiary 0 84,197 0 84,197
Payables to subsidiaries 228 0 0 228
Other payables 266 0 0 266
Total financial liabilities 494 84,197 0 84,691
All liabilities shown in the table above are measured at amortized cost. The amounts are exclusive of interest.
2016
(USD in thousands)
Less than 1 year
Between 1 and 5 years
Later than 5 years
Total
Loan from subsidiary 0 64,238 0 64,238
Payables to subsidiaries 1,566 0 0 1,566
Other payables 267 0 0 267
Total financial liabilities 1,833 64,238 0 66,071
All liabilities shown in the table above are measured at amortized cost. The amounts are exclusive of interest.
12. FEES TO AUDITOR APPOINTED AT THE ANNUAL GENERAL MEETING
(USD in thousands)
2016 2015 2014
Statutory audit services 11 14 16
Statutory audit services 11 14 16
Non-audit services:
Non-audit services 0 0 0
Total fees to auditors 11 14 16
For 2016, PricewaterhouseCoopers Statsautoriseret Revisionspartnerselskab was the elected auditor. For 2014 and 2015 the elected auditor was Deloitte Statsautoriseret Revisionspartnerselskab.
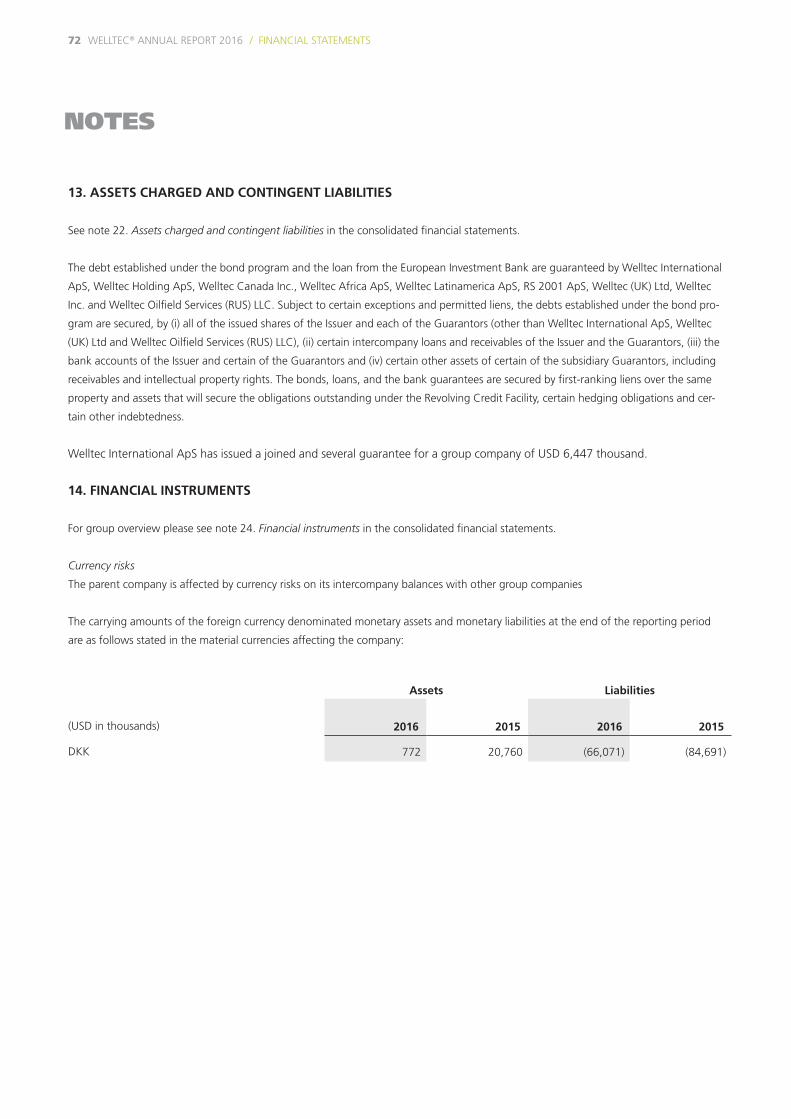
72 WELLTEC® ANNUAL REPORT 2016 / FINANCIAL STATEMENTS
NOTES
13. ASSETS CHARGED AND CONTINGENT LIABILITIES
See note 22. Assets charged and contingent liabilities in the consolidated financial statements.
The debt established under the bond program and the loan from the European Investment Bank are guaranteed by Welltec International
ApS, Welltec Holding ApS, Welltec Canada Inc., Welltec Africa ApS, Welltec Latinamerica ApS, RS 2001 ApS, Welltec (UK) Ltd, Welltec
Inc. and Welltec Oilfield Services (RUS) LLC. Subject to certain exceptions and permitted liens, the debts established under the bond pro-
gram are secured, by (i) all of the issued shares of the Issuer and each of the Guarantors (other than Welltec International ApS, Welltec
(UK) Ltd and Welltec Oilfield Services (RUS) LLC), (ii) certain intercompany loans and receivables of the Issuer and the Guarantors, (iii) the
bank accounts of the Issuer and certain of the Guarantors and (iv) certain other assets of certain of the subsidiary Guarantors, including
receivables and intellectual property rights. The bonds, loans, and the bank guarantees are secured by first-ranking liens over the same
property and assets that will secure the obligations outstanding under the Revolving Credit Facility, certain hedging obligations and cer-
tain other indebtedness.
Welltec International ApS has issued a joined and several guarantee for a group company of USD 6,447 thousand.
14. FINANCIAL INSTRUMENTS
For group overview please see note 24. Financial instruments in the consolidated financial statements.
Currency risks
The parent company is affected by currency risks on its intercompany balances with other group companies
The carrying amounts of the foreign currency denominated monetary assets and monetary liabilities at the end of the reporting period
are as follows stated in the material currencies affecting the company:
Assets Liabilities
(USD in thousands) 2016 2015 2016 2015
DKK 772 20,760 (66,071) (84,691)

WELLTEC® ANNUAL REPORT 2016 FINANCIAL STATEMENTS / 73
15. RELATED PARTIES
The ultimate parent company preparing a consolidated financial statement in which the Welltec International ApS Group is included is
JH Holding, Allerød, ApS, Haregabsvej 15, 3230 Græsted, Denmark.
See note 25. Related parties in the consolidated financial statements.
15.1 Related party transactions
During the year, the company entered into the following transactions with related parties:
2016 2015
(USD in thousands) Subsidiaries Affiliates Subsidiaries Affiliates
Interest income/-(expenses) (3,483) 0 (3,481) 0
Total transactions (3,483) 0 (3,481) 0
NOTES
The following balances were outstanding at the end of the reporting period:
(USD in thousands) Amounts owed by related parties Amounts owed to related parties
2016 2015 2016 2015
Subsidiaries 772 20,409 65,804 84,425
Total balances 772 20,409 65,804 84,425
16. EVENTS AFTER THE BALANCE SHEET DATE
See note 26. Events after the balance sheet date in the consolidated financial statements.

74 WELLTEC® ANNUAL REPORT 2016 / FINANCIAL STATEMENTS
BRANCHES
The group holds the following branches:
NameRegistered
officePrincipalactivity
Year /currency
Welltec A/S (Azerbaijan Branch)* Azerbaijan Sales Branch 2008 / AZN
Welltec A/S India Project Office* India Sales Branch 2008 / INR
Welltec Africa ApS E.G.***Equatorial
Guinea Sales Branch 2010 / XAF
Welltec A/S - Abu Dhabi* UAE Sales Branch 2011 / AED
Welltec Latin America ApS Sucursal Columbiana* Columbia Sales Branch 2011 / COP
Welltec A/S (Gabon Branch)* Gabon Sales Branch 2012 / CFA
Welltec Africa ApS Congo*** Congo Sales Branch 2013 / CFA
Welltec Latinamerica ApS (Ecuador Branch)** Ecuador Sales Branch 2014 / USD
Welltec Africa ApS (Ivory Coast Branch)*** Ivory Coast Sales Branch 2015 / XOF
* Held by Welltec A/S, ** Held by Welltec Latinamerica ApS, ***Held by Welltec Africa ApS