What We’ll Cover …wpc.0b0c.edgecastcdn.net/000B0C/sap_insider/Downloads/Thornton_2… · 12...
24
0 © 2009 Wellesley Information Services. All rights reserved. Demand Planning with SAP Solutions: A Detailed Guide to Features, Functions, Implementation, and Best Practices Rick Anderson Deloitte Alistair Thornton Deloitte Consulting 2 In This Session… • Demand Planning is usually a critical process in a planning environment • Understand what SAP Demand Planning can do to support your forecasting process • Get some best practices for implementing SAP APO in your organization Supply Demand S&OP Cycle 1. Functional Planning Analysis 3. Cost Impact Assess 5. S&OP Meeting 4. Collection & Aggregation of Inputs 2. Integrated Analysis 3 What We’ll Cover … • The importance of a good forecast • SAP Demand Planning (DP) – What it can do Demand Planning overview Creating a forecast using DP’s Statistical Models Enhancing a forecast with key DP tools • SAP Demand Planning – How to implement it Planning and designing your DP solution Configuring and testing your DP solution • Wrap-up 4 Modern Enterprises Have Unique Forecasting Challenges • Satisfy all customer requests (right product, right quantity, right time) without carrying excess inventory • Create and analyze forecast data at different levels Sales might want to create a forecast for customers Operations might want to create a forecast for a plant Marketing might want to create a forecast for product brands • Enable communication across business units within an organization Forecasts should not be produced in isolated “silos” • Incorporate forecast data from supply chain partners into the demand planning process Share data with customers, suppliers, contractors, etc. 5 But There Are Compelling Reasons to Improve … • In a recent article, Gartner says that using a robust forecasting process: Improves forecast accuracy by 54% Increases inventory turns by 33% Reduces inventory safety stock by 25% Increases profit margins by reducing discounts • In another article, AMR Research comes to similar conclusions: Organizations can expect a 10-25% improvement in forecast accuracy through the implementation of better forecasting tools and processes
Transcript of What We’ll Cover …wpc.0b0c.edgecastcdn.net/000B0C/sap_insider/Downloads/Thornton_2… · 12...

0© 2009 Wellesley Information Services. All rights reserved.
Demand Planning with SAP Solutions: A Detailed Guide to Features, Functions, Implementation, and Best Practices
Rick AndersonDeloitte Alistair ThorntonDeloitte Consulting
2
In This Session…
• Demand Planning is usually a critical process in a planning environment
• Understand what SAP Demand Planning can do to support your forecasting process
• Get some best practices for implementing SAP APO in your organization
Supply
Demand
S&OP Cycle
1. Functional Planning Analysis
3. Cost Impact Assess
5. S&OP Meeting
4. Collection &
Aggregation of Inputs
2. Integrated Analysis
3
What We’ll Cover …
• The importance of a good forecast• SAP Demand Planning (DP) – What it can do
Demand Planning overviewCreating a forecast using DP’s Statistical ModelsEnhancing a forecast with key DP tools
• SAP Demand Planning – How to implement itPlanning and designing your DP solutionConfiguring and testing your DP solution
• Wrap-up
4
Modern Enterprises Have Unique Forecasting Challenges
• Satisfy all customer requests (right product, right quantity, right time) without carrying excess inventory
• Create and analyze forecast data at different levelsSales might want to create a forecast for customersOperations might want to create a forecast for a plantMarketing might want to create a forecast for product brands
• Enable communication across business units within an organization
Forecasts should not be produced in isolated “silos”• Incorporate forecast data from supply chain partners into the
demand planning processShare data with customers, suppliers, contractors, etc.
5
But There Are Compelling Reasons to Improve …
• In a recent article, Gartner says that using a robust forecasting process:
Improves forecast accuracy by 54% Increases inventory turns by 33% Reduces inventory safety stock by 25% Increases profit margins by reducing discounts
• In another article, AMR Research comes to similar conclusions:Organizations can expect a 10-25% improvement in forecast accuracy through the implementation of better forecasting tools and processes

6
Customer Service• Fill rates• Percentage of orders
shipped complete • Back orders leading to
customer service issues• On-time shipment
performance• Customer complaints
Inventory Management• Supply not aligned with
demand• Low inventory turns• High obsolescence
Finance• Inventory carrying cost
Manufacturing• Production schedule
disruptions through rush orders
• Increased outsourcing • Increased overtime expense
Warehousing• Excess space/storage cost• Inconsistent shipping/
receiving volumes
Transportation• Inconsistent shipment
volumes and sizes • Heavy use of premium/
expensive space/storage costSales and Marketing• Lost sales opportunities • Tarnished brand image and
questionable customer loyalty
ForecastErrorInput
The Value Proposition – Reduced Forecast Error• Reducing forecast error has a positive financial impact that
propagates throughout the entire supply chain
7
Some Organizations Still Don’t Get It
• Despite this potential benefit, many demand planning processes suffer from these symptoms
Demand Planning is isolated, and not well integrated with other planning and execution processesPlanning and execution processes do not explicitly account for forecast errorsThe demand planning system is reactive, due to limited information and visibility of future demandMultiple systems used for forecasting, planning, and execution and are not integrated
8
Modern Demand Planning Processes …
• Drive all planning and scheduling activities in the downstream supply chain
• Are fully integrated with other forecasting processes, driving a consensus-oriented approach
• Measure and track accuracy/error accurately and frequently to drive improvement
• Are tightly integrated with other forecasting, planning, and execution systems in an operational environment
Demand Planning
Supply Network
Planning
Production
Planning
9
What We’ll Cover …
• The importance of a good forecast• SAP Demand Planning (DP) – What it can do
Demand Planning overviewCreating a forecast using DP’s Statistical ModelsEnhancing a forecast with key DP tools
• SAP Demand Planning – How to implement itPlanning and designing your DP solutionConfiguring and testing your DP solution
• Wrap-up
10
Demand PlanningForecasting
Simulating
Collaboration
Monitoring
Production Planning/ Detailed SchedulingPlanning
Scheduling
Monitoring
Transportation Planning/ Vehicle Scheduling
Route Optimization
Consolidation
Carrier Selection
Tendering
SAP SCM
Supply Network Planning (SNP)Network Modeling
Master Scheduling
Deployment
Trans. Load Builder
Vendor ManagedInventory (VMI)
Global Available-to-PromiseCapable-to-Promise
Allocation
Substitution
DP SNP PP/DS gATP TP/VS
SAP Demand Planning Is Part of SAP SCM 2007
11
SAP Demand Planning – The 50,000 Foot View
SAP BI
DP
SAP APO
SNP/PP/DS
Historical Data(Shipments, Orders)
Planned Orders(Production, Transport)
Non-SAP
SAP ERP

12
Demand Planning Tools:• Collaborative Forecasting• Consensus-based Forecasting• Promotional Planning• Lifecycle Management• Advanced Macros• Accuracy Reporting
Demand Planning Tools:• Collaborative Forecasting• Consensus-based Forecasting• Promotional Planning• Lifecycle Management• Advanced Macros• Accuracy Reporting
Statistical Methods:Multi-Model Approach• Average Models• Seasonal• Causal Factors• Trend, Seasonal Trend• Composite Models• Pick Best
Demand Planning Data MartAnticipation ofFuture Demand
Input DataCollaborative ForecastsHistory – Orders/ Shipments, etc.Point of Sale(POS) DataNielsen/InformationResources, Inc. (IRI) DataFlat File
SAP Demand Planning – The 5,000 Foot View
13
SAP Demand Planning Requirements and Misconceptions
MISCONCEPTIONS• I need BW in order to use DP• I need SAP ERP in order to use DP• I need to implement the other SAP APO
modules in order to use DP• I can only use DP to create a quantity-
based forecast• I can’t do any reporting out of DP
MISCONCEPTIONS• I need BW in order to use DP• I need SAP ERP in order to use DP• I need to implement the other SAP APO
modules in order to use DP• I can only use DP to create a quantity-
based forecast• I can’t do any reporting out of DP
REQUIREMENTS• Good, clean data• DEV, QA, and PROD servers• Due to use of liveCache, servers must have adequate memory (more on this later)
• If using with SAP ERP or SNP/PP/DS, integration models must be generated in SAP ERP and all needed master data must be transported to SAP APO
• If using with SAP NetWeaver BI, the SAP NetWeaver BI system must be created as a source system in SAP APO (same for SAP ERP)
14
SAP Demand Planning Comparison
Area FunctionalitySAP Demand
Planning SAP ERP
Forecasting
Basic Methods (trend, seasonality, etc.)Advanced Methods (multiple linear regression)Collaborative Forecasting (over Internet)Characteristics-Based Forecasting (CBF)Multiple Levels of Forecasting (Top Down, Bottom Up, Middle Out)Ease of Consensus Forecasting
AccuracyPredefined MetricsEx-post AnalysisOutlier Corrections
Life Cycle PlanningPhase InPhase OutLike Profiles
Promotion PlanningBasic PromotionsCannibalization
ReportingStandard SAP BW ConnectionAd Hoc SAP Business Explorer (SAP BEx) Analyzer
15
What We’ll Cover …
• The importance of a good forecast• SAP Demand Planning (DP) – What it can do
Demand Planning overviewCreating a forecast using DP’s Statistical ModelsEnhancing a forecast with key DP tools
• SAP Demand Planning – How to implement itPlanning and designing your DP solutionConfiguring and testing your DP solution
• Wrap-up
16
Creating a Forecast Using DP’s Statistical Models
1 – Univariate/Time Series models2 – Multivariate/Causal analysis3 – Composite models
17
1 – Univariate/Time Series Forecasting Models
• Univariate forecasting is better known as “time series”forecasting
A time series consists of data collected, recorded, or observed over successive increments of time
• Univariate models detect and project the following statistical patterns
ConstantTrendSeasonal

18
1 – Univariate/Time Series Forecasting Models (cont.)
• Univariate models use only one independent and one dependent variable
The independent variable is time (day, week, month, etc.)The dependent variable is something like sales or shipments
• Time series are analyzed to discover past patterns of variability that can be used to forecast future values
The assumption is that past patterns will continue in the future
19
Good for products that are inherently seasonal
Fair for products that have low or sporadic sales
Poor for products that have long lead times, are promotion driven, are competitor influenced, or are new products
1 – Univariate/Time Series Forecasting Models (cont.)
• The purpose is to model the patterns of past demands in order toproject them into the future
• Good in very short-term horizon• Requires past, internal data to forecast the future• Most cost effective and easily systematized• Forecaster should have an understanding of statistics
20
1 – Univariate/Time Series Models: Types of Approaches
• Types of time series approaches in SAP Demand PlanningConstant
Varies very little from a stable mean value Trend
Falls or rises constantly over a long period of time with only occasional deviations
SeasonalPeriodically recurring peaks and troughs differ significantly from a stable mean value
Seasonal trendPeriodically recurring peaks and troughs, but with a continual increase or decrease in the mean value
IntermittentDemand is sporadic 21
1 – Selecting the Right Univariate/Time Series Model
• General criteria for time series model selection
Croston’s ModelWith Sporadic/Intermittent Demand
Auto Model Selection 1Auto Model Selection 2
No Knowledge of Patterns in Historical Data
Winter’s ModelTrend and SeasonalityHolt’s ModelTrend, No Seasonality
Moving AverageExponential Smoothing
No Trend, No Seasonality
Model to SelectPattern of Data
22
1 – Univariate/Time Series Forecast Strategies
23
1 – Univariate/Time Series Forecasting Models: Advantages
• Well suited to situations where sales forecast is needed for a large number of products
• Work very well for products with fairly stable sales Can smooth out small random fluctuations, however
• Easy to understand and use, and can easily be automated• Good for short-term forecasting• Only requires past observations of demand
24
1 – Univariate/Time Series Forecasting Models: Disadvantages• Require a large amount of historical data• Adjust slowly to changes in sales
This can cause significant forecast error if large fluctuations exist in current data
• Not well suited for forecasts with long-term horizons
25
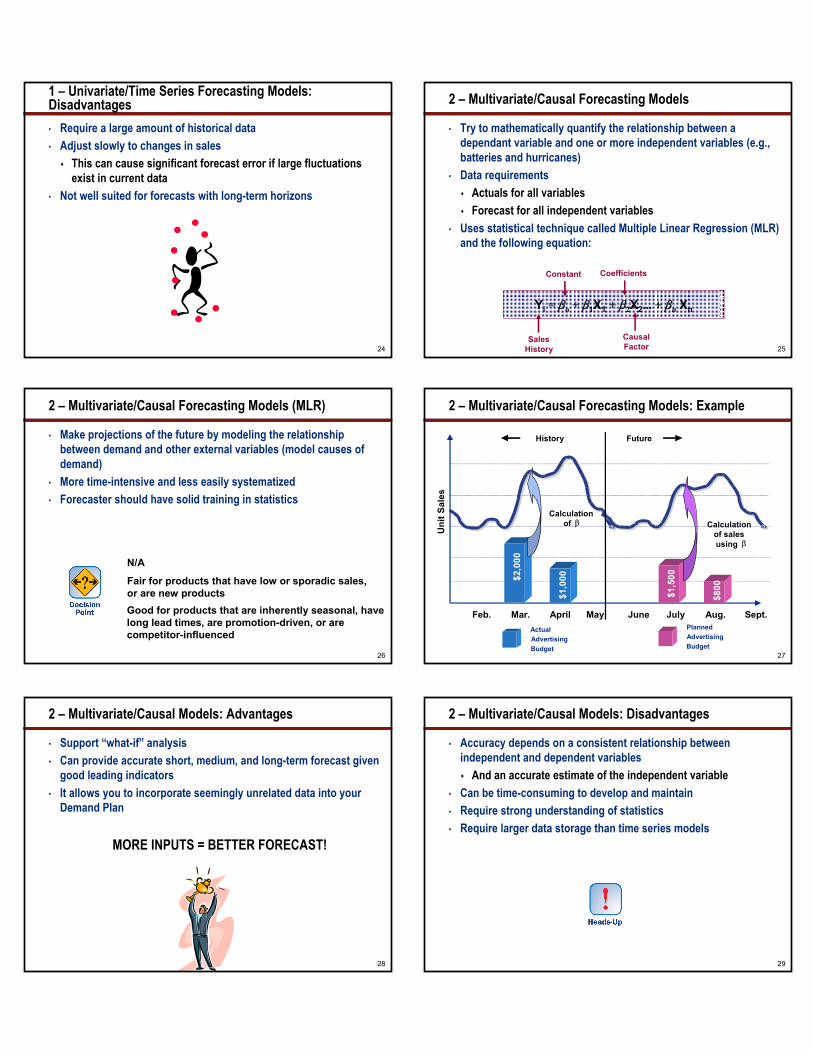
2 – Multivariate/Causal Forecasting Models
• Try to mathematically quantify the relationship between a dependant variable and one or more independent variables (e.g., batteries and hurricanes)
• Data requirementsActuals for all variablesForecast for all independent variables
• Uses statistical technique called Multiple Linear Regression (MLR) and the following equation:
Yi = βo + β1X1 + β2X2... + βn Xn
SalesHistory
Constant Coefficients
CausalFactor
26
2 – Multivariate/Causal Forecasting Models (MLR)
• Make projections of the future by modeling the relationship between demand and other external variables (model causes of demand)
• More time-intensive and less easily systematized• Forecaster should have solid training in statistics
Good for products that are inherently seasonal, have long lead times, are promotion-driven, or are competitor-influenced
Fair for products that have low or sporadic sales, or are new products
N/A
27
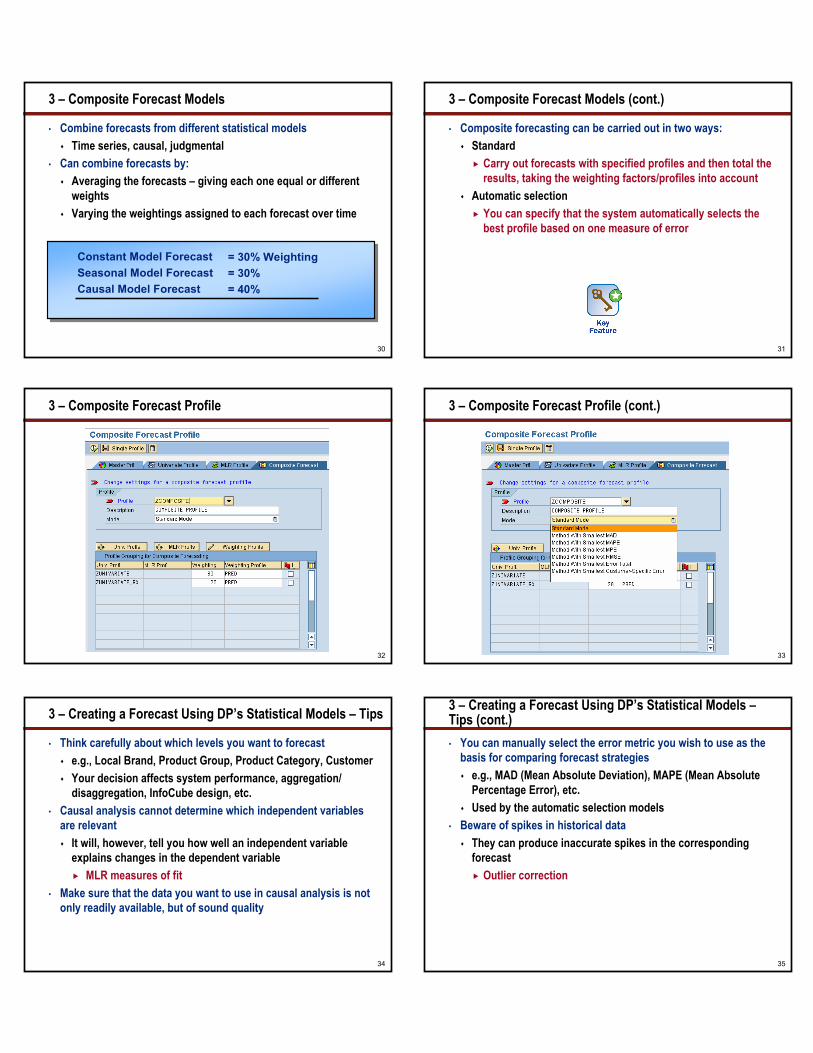
2 – Multivariate/Causal Forecasting Models: Example
Uni
t Sal
es
Feb. Mar. April May June July Aug. Sept.
$2,0
00
$1,0
00
$1,5
00
$800
History Future
Calculationof β Calculation
of salesusing β
PlannedAdvertisingBudget
ActualAdvertisingBudget
28
2 – Multivariate/Causal Models: Advantages
• Support “what-if” analysis• Can provide accurate short, medium, and long-term forecast given
good leading indicators• It allows you to incorporate seemingly unrelated data into your
Demand Plan
MORE INPUTS = BETTER FORECAST!
29
2 – Multivariate/Causal Models: Disadvantages
• Accuracy depends on a consistent relationship between independent and dependent variables
And an accurate estimate of the independent variable• Can be time-consuming to develop and maintain• Require strong understanding of statistics• Require larger data storage than time series models
30
3 – Composite Forecast Models
• Combine forecasts from different statistical modelsTime series, causal, judgmental
• Can combine forecasts by: Averaging the forecasts – giving each one equal or different weightsVarying the weightings assigned to each forecast over time
Constant Model ForecastSeasonal Model ForecastCausal Model Forecast
= 30% Weighting= 30%= 40%
31
3 – Composite Forecast Models (cont.)
• Composite forecasting can be carried out in two ways: Standard
Carry out forecasts with specified profiles and then total the results, taking the weighting factors/profiles into account
Automatic selectionYou can specify that the system automatically selects the best profile based on one measure of error
32
3 – Composite Forecast Profile
33
3 – Composite Forecast Profile (cont.)
34
3 – Creating a Forecast Using DP’s Statistical Models – Tips
• Think carefully about which levels you want to forecaste.g., Local Brand, Product Group, Product Category, CustomerYour decision affects system performance, aggregation/ disaggregation, InfoCube design, etc.
• Causal analysis cannot determine which independent variables are relevant
It will, however, tell you how well an independent variable explains changes in the dependent variable
MLR measures of fit• Make sure that the data you want to use in causal analysis is not
only readily available, but of sound quality
35
3 – Creating a Forecast Using DP’s Statistical Models –Tips (cont.) • You can manually select the error metric you wish to use as the
basis for comparing forecast strategiese.g., MAD (Mean Absolute Deviation), MAPE (Mean Absolute Percentage Error), etc.Used by the automatic selection models
• Beware of spikes in historical data They can produce inaccurate spikes in the corresponding forecast
Outlier correction

36
What We’ll Cover …
• The importance of a good forecast• SAP Demand Planning (DP) – What it can do
Demand Planning overviewCreating a forecast using DP’s Statistical ModelsEnhancing a forecast with key DP tools
• SAP Demand Planning – How to implement itPlanning and designing your DP solutionConfiguring and testing your DP solution
• Wrap-up
37
Forecasting and Simulating Demand: Four Key Tools
1 – Consensus-based forecasting2 – Collaborative forecasting3 – Promotions planning4 – Life cycle planning
38
1 – Consensus-Based Forecasting
• Allows different organizational units to generate their own demand plans
According to their unique goals, time horizons, and forecasting philosophies
• Each forecast can then intelligently be reconciled into a singleconsensus forecast
• The result is a one-number demand plan that has been agreed to and is owned by all stakeholders
39
1 – Consensus-Based Forecasting (cont.)
1Planning Creates Statistical/CausalForecast for all SKUs using Historical Data
2Marketing Adjusts Statistical Forecastand Plans Promotions
3Sales Adjusts Statistical Forecast 4
Customer Adjusts Statistical Forecastvia Internet
5Forecasts Are Reconciledinto a Single Consensus Forecast
40
1 – Consensus-Based Forecasting (cont.)
• TipsWhen reconciling all of your different forecasts, start with a simple technique (like average or weighted average)
You can then progress to more advanced methods, like weighting based on forecast accuracy
Properly designing planning book/data views is criticalKey figures used in the consensus process must be assigned to each planning book/data view involved
41
DemandPlanner
SAP Demand Planning
SAP Demand PlanningInsert forecast
21
4 Alert broadcasting (e.g., email)
6 Forecast adjustment
Create statisticalforecast
CHANNEL PARTNER MANUFACTURER
AccountManager
Internet
5Review
forecasts
Internet
3Create
consensusforecast
2 – Collaborative Forecasting: Typical Process
Source: SAP

42
2 – Collaborative Forecasting
• TipsAgree on the process
Define role of each partnerEstablish confidentiality of shared infoCommit resourcesAgree on exception handling and performance measurement
Create a joint business plan and establish products To be jointly managed, including category role, strategy, and tactics
Jointly agree on control techniques
43
3 – Promotions Planning
• Lets you create, monitor, and include promotional activities into your demand planning process
Promotional activities can be one-time events or repeated events Examples of one-time events include the 2000 MillenniumExamples of repeated events include coupon campaigns, new advertising spots, and price cuts
• Can model promotions at a variety of different levelsFor specific customers or a group of customersFor specific products or a subset of productsFor a specific region of a national sales campaign
44
3 – Promotions Planning (cont.)
• The advantages of planning promotions separately are:You can compare forecasts with promotions to those without promotionsYou can correct the sales history by extracting past promotions from it
Thus obtaining unpromoted historical data for the baseline forecast
The processes of interactive planning and promotion planning can be kept completely separate
e.g., the sales force might be responsible for interactive planning while marketing is responsible for promotions planning
45
3 – Promotions Planning: Cannibalization
• Cannibalization is the negative impact that promoting one material can have on similar materials
• In Demand Planning, we use Cannibalization Groups to model these effects
46
3 – Promotions Planning: Collaboration• Collaborative Promotion Planning enables sales department and
its respective customers to jointly develop a promotion planCustomers can review, approve/reject online promotionsSales representatives will monitor promotions and activate them upon customers’ approval
47
4 – Life Cycle Planning
• Like ModelingUse historical sales patterns for new products
• Phase In/OutRamp down for discontinued products Ramp up for newer products
Actuals of the old product
Forecasting of the new product
Life Cycle
Time
Sales
Like
Actuals
Product BProduct A

48
5 – Seasonal Planning
• Prior to SAP APO 5.0, the system defined seasons based on periodicity of a Planning Area
• Starting with SAP APO 5.0, seasons can be defined at a more granular level: CVC or a group of CVCs
49
What We’ll Cover …
• The importance of a good forecast• SAP Demand Planning (DP) – What it can do
Demand Planning overviewCreating a forecast using DP’s Statistical ModelsEnhancing a forecast with key DP tools
• SAP Demand Planning – How to implement itPlanning and designing your DP solutionConfiguring and testing your DP solution
• Wrap-up
50
Some SAP Demand Planning Facts
• Hundreds and hundreds of companies are using itIt’s very mature, very stable
• SAP Demand Planning has been implemented in nearly all industries
It offers some limited industry-specific functionality• SAP Demand Planning can be used with SAP ERP, with SAP BW,
or bothIt can also be used in a standalone environment with no other SAP applications
• But: You do NOT have to be using SAP NetWeaver BI/SAP BW to use SAP Demand Planning
SAP Demand Planning comes with an embedded SAP NetWeaver BI/SAP BW that can be used to do some basic DP reporting (with the BEx Analyzer/Explorer)
DP projects generally take between 3-6 months, depending on complexity, scope, etc. 51
Common Pitfalls on SAP Demand Planning Projects
• Not enough attention given to the business processFocus should be on improving how you do Demand PlanningSAP Demand Planning is an enabler – it won’t fix the problems by itself
• Project is owned by IT, not the business users• Inadequate resourcing
Not having enough capacityMissed deadlines, overworked resources, poor quality
Not having the right mix of skills
52
Common Pitfalls on SAP Demand Planning Projects (cont.)
• Poor InfoCube designAffects system performance, synchronization with other systems (SAP NetWeaver BI/SAP BW), availability of needed data, format of needed data, etc.
• Inadequate time given to understanding statistics behind SAP Demand Planning
Can lead to using wrong forecast models, coefficients, etc.
53
Planning and Designing Your Demand Planning Solution
• There are many implementation options to considerFunctional scope
Which parts of SAP Demand Planning to implementOrganizational scope
Which parts of the business to implementWhich products to include
TimingWhen each part of the organization will implement it
• So, how do I figure this out?Blueprint/Design phase“Value Assessments”Prototypes
Developing a prototype of your proposed DP solution BEFORE the realization phase of your project is a great way to validate your overall design

54
Planning and Designing Your Demand Planning Solution (cont.)• Another way to compare
implementation options is to assess each one against (four) key factors:
Time-to-Benefit
Project Duration
Time required to achieve full benefit potential; is impacted by technology, processes adherence, data quality, and organization alignment
The elapsed time required to implement the solution throughout the business; key drivers are usually the resource skill sets and mix, use of accelerators, and business acceptance
Cost
Risk
The total cost of implementing the solution (process and technology); key variables are the lapsed time and mix of external versus internal resources
The probability that significant issues delay project progress and/or result in additional cost; key drivers are usually the number of concurrent tasks, interdependencies, and resources
55
Evaluating SAP Demand Planning Implementation Options
Risk Time-to-Benefit DurationCost
3. No Pilot, full DP Low High Short Long Short LongLow High
• Higher external support partially offset by compressed timeline
• Higher business risk• Higher change
management risk
• Shortest time-to-benefit• Steep benefits realization
curve expected
• Shortest duration• Single implementation
phase
• Cost savings from smaller scope off-set by longer timeline
• Higher change management risk
2. DP Pilot, then ProductLine
Low High Short Long Short LongLow High
• Projected longest time to benefit
• Longer duration due to staged implementation
1. DP Pilot, then BU Low High Short Long Short LongLow High
• Least amount of change management risk
• Benefits realization could begin sooner than alternative number two
• Longer duration due to staged implementation
• Cost savings from smaller scope are offset by longer timeline
56
• Three most important things to consider (once scoping decisions have been made):
1 – Your team2 – Your methodology and timeline3 – Your process
Planning and Designing Your Demand Planning Solution
57
1 – Your Team
• Ideally, your project team should consist of representatives from management, the business, and IT
• This ensures the proper mix of skills/experiences Management skills
Project sponsorship, project managementBusiness skills
Statistical forecasting methodsProduct/brand specialists
Technical skillsBasisSAP BW, SAP ERPExisting systems
Communication and knowledge transfer are CRITICAL. Small, isolated teams keep internal knowledge and expertise concentrated to a few individuals.
58
2 – Your Methodology and Timeline
• Typical methodologyPhase 1 – Analysis/Blueprint
Requirements gatheringProcess definitionProcess blueprinting
Phase 2 – Pilot DesignSystem buildSystem configuration
Phase 3 – Final Design BuildFinal design buildFinal design configuration
Phase 4 – Testing Unit TestingIntegration TestingTraining Documentation
Phase 5 – Go-Live Prep/Go-LivePhase 6 – Post Go-Live Support
59
2 – Your Methodology and Timeline (cont.)
• A typical project timeline
Phase Task Activities Month 1 Month 2 Month 3 Month 4 Month 5 Month 6Blueprint Definition Confirm business requirements
Application workshopsIntegration workshops
Realization: Prototype Functional Pilot Process and role modelsAPO DP buildIntegration designFunctional unit configuration
Realization: Integration System Pilot Build value-adding scenariosBuild interfacesBuild data conversion
User & System Acceptance Testing Complete unit test scriptsComplete integration test scriptsComplete stress tests
Final Prep & Go-live Integrate and Go-live Data conversion and testing Detailed cutover and go-live prep
Final end-user training Go-live and support

60
3 – Your Process
• Remember – SAP Demand Planning is being implemented to support a business process
• Properly analyzing the “as-is” and designing the “to-be” demand planning process drives how much value you’ll get out of a DP project
InfoCube/Planning AreaDesign/Maintenance
InfoCube/Planning AreaDesign/Maintenance
Forecast ProfilesDesign/MaintenanceForecast Profiles
Design/Maintenance
Creation ofStatistical forecast
Creation ofStatistical forecast
Creation of promotions
Creation of promotions
Reconciliation ofDemand Plans
Reconciliation ofDemand Plans
Historical dataupdates
Historical dataupdates
Monitoringforecast accuracy
Monitoringforecast accuracy
Planning BookDesign/Maintenance
Planning BookDesign/Maintenance
Manual adjustments
Manual adjustments
Release of Demand PlanRelease of
Demand Plan
Evaluate/UpdatePlanning Area/Planning Books
Evaluate/UpdatePlanning Area/Planning Books
Create new master data
Create new master data
Generate new CVCs/prop factorsGenerate new
CVCs/prop factors
Load newmaster data to planning area
Load newmaster data to planning area
Data MaintenanceActivities
Business ProcessActivities
61
A Typical Demand Planning Process
InfoCube/Planning AreaDesign/Maintenance
InfoCube/Planning AreaDesign/Maintenance
Forecast ProfilesDesign/MaintenanceForecast Profiles
Design/Maintenance
Creation ofStatistical forecast
Creation ofStatistical forecast
Creation of promotions
Creation of promotions
Reconciliation ofDemand Plans
Reconciliation ofDemand Plans
Historical dataupdates
Historical dataupdates
Monitoringforecast accuracy
Monitoringforecast accuracy
Planning BookDesign/Maintenance
Planning BookDesign/Maintenance
Manual adjustments
Manual adjustments
Release of Demand PlanRelease of
Demand Plan
Evaluate/UpdatePlanning Area/Planning Books
Evaluate/UpdatePlanning Area/Planning Books
Create new master data
Create new master data
Generate new CVCs/prop factors
Generate new CVCs/prop factors
Load newmaster data to planning area
Load newmaster data to planning area
Data MaintenanceActivities
Business ProcessActivities
62
InfoCube/Planning Area Design/Maintenance
• InfoCubes are multi-dimensional relational database structures that store planning data for use in Demand Planning
• InfoCubes consist of:Characteristics – Planning objects that represent levels at which a forecast might be created
Product Brand, Region, Customer Group
Key Figures – Planning objects that contain data representing a numerical value
Historical Orders, Statistical ForecastTime Buckets – Represent periods of time in the InfoCube
Months, Weeks
DP DataMartDP DataMart
SalesActuals
MarketingForecast
Cube
Field SalesForecast
Cube
63
InfoCube/Planning Area Design/Maintenance (cont.)
DP DataMartDP DataMart
SalesActuals
MarketingForecast
Cube
Field SalesForecast
Cube
SAP Demand Planning Planning Object Structure
• Contains plannable characteristics and aggregates for use in liveCache
• Characteristics determine the levels on which you can plan and save data
• Can be either standard characteristics and/or ones that you have created yourself in the Administrator Workbench
64
InfoCube/Planning Area Design/Maintenance (cont.)
DP DataMartDP DataMart
SalesActuals
MarketingForecast
Cube
Field SalesForecast
Cube
SAP Demand PlanningPlanning Object Structure
“Generate characteristic combinations”
Product Group100, 101, 102
Product FamilyLiquids, Gels
Customer GroupRetail, Internet
RegionSouth, North
Sales Organization3000, 3005
Product Group100, 101, 102
Product FamilyLiquids, Gels
Customer GroupRetail, Internet
RegionSouth, North
Sales Organization3000, 3005
65
InfoCube/Planning Area Design/Maintenance (cont.)
DP DataMartDP DataMart
SalesActuals
MarketingForecast
Cube
Field SalesForecast
Cube
SAP Demand PlanningPlanning Object Structure
DP Planning Area(s) [liveCache]
• Central structures for Demand Planning used to store current planning data
• Specifies the following:Key figures to be usedUnit of measure in which data is plannedCurrency in which data is plannedStorage buckets profile that determines buckets in which data is storedAggregate levels on which data can be stored in addition to the lowest level
To enhance performanceSettings for how each key figure is disaggregated, aggregated, and saved

66
InfoCube/Planning Area Design/Maintenance (cont.)
DP DataMartDP DataMart
SalesActuals
MarketingForecast
Cube
Field SalesForecast
Cube DP Planning Book(s)DP Planning Book(s)• Very configurable tabular and
graphical presentations of forecast data
• Each planning book can have multiple data views
• Data views present planning book data in different ways
Time periodsSpecific key figures
SAP Demand PlanningPlanning Object Structure
DP Planning Area(s) [liveCache]
67
DP Planning Area(s) [liveCache]
InfoCube/Planning Area Design/Maintenance (cont.)
DP DataMartDP DataMart
SalesActuals
MarketingForecast
Cube
Field SalesForecast
CubeDP Planning Book(s)DP Planning Book(s)
Marketing ViewHistorical Orders
Historical ShipmentsFinancial Forecast
Marketing Final ForecastLE LAG 1LE LAG 2LE LAG 3
Field Sales ViewHistorical Orders
Historical ShipmentsSales Final Forecast
KAF LAG 1KAF LAG 2KAF LAG 3
Product Supply ViewHistorical Orders
Historical Shipments
PS S&OP ViewHistorical Orders
Historical ShipmentsHistorical Returns
SAP Demand PlanningPlanning Object Structure
68
InfoCube/Planning Area Design/Maintenance (cont.)
• Important things to considerAt what levels do I want to forecast?
Product group? Customer?Characteristics vs. navigational attributes
What time buckets do I want to forecast in? Months, weeks, quarters?
What data do I need to support the process? Historical shipments, marketing forecast
Where will this data come from?How large must the server be to support this process?
69
• Fixing key figuresTo be able to “fix” values, key figures must be configured to be fixable when created as InfoObjects
You must also specify another key figure to which these fixed values are stored
• Aggregates help improve performance By fixing/saving data at a specific level of aggregation
The system then reads only the aggregation level Note: It is recommended that any aggregates you create in SAP Demand Planning also be created in any synchronized SAP NetWeaver BI/SAP BW system
• Think hard about how key figures should aggregate and disaggregate data (statistical forecast vs. unit price)
InfoCube/Planning Area Design/Maintenance – Tips
70
InfoObject Configuration
71
Key Figure Configuration

72
InfoCube/Planning Area Design/Maintenance – Tips
• Using Navigational AttributesTry to boost performance by acting as a “substitute”characteristic
You can’t plan at the attribute level, but you can select and navigate with themExample:
For characteristic “Customer” you might assign attributes of “Sales Rep” and “Priority”You then specify master data for these, like “John Smith”or “Bob Jones”
Attributes also help speed up the realignment process
73
Navigation Attribute Configuration
74
InfoCube/Planning Area Design/Maintenance – Tips
• When using navigational attributes, however:BE CAREFUL!
They can actually adversely affect performance during data selection and navigation in interactive planning
Attributes read a large number of tables from the associated InfoObject master dataThis can increase processing time
My advice: Find the right balance• Don’t initialize planning areas that aren’t needed
Once a planning area is initialized, it consumes liveCache memory
75
A Typical Demand Planning Process
InfoCube/Planning AreaDesign/Maintenance
InfoCube/Planning AreaDesign/Maintenance
Forecast ProfilesDesign/MaintenanceForecast Profiles
Design/Maintenance
Creation ofStatistical forecast
Creation ofStatistical forecast
Creation of promotions
Creation of promotions
Reconciliation ofdemand plans
Reconciliation ofdemand plans
Historical dataupdates
Historical dataupdates
Monitoringforecast accuracy
Monitoringforecast accuracy
Planning BookDesign/Maintenance
Planning BookDesign/Maintenance
Manual Adjustments
Manual Adjustments
Release of demand plan
Release of demand plan
Evaluate/UpdatePlanning Area/Planning Books
Evaluate/UpdatePlanning Area/Planning Books
Create new master data
Create new master data
Generate new CVCs/prop factors
Generate new CVCs/prop factors
Load newmaster data to planning area
Load newmaster data to planning area
Data MaintenanceActivities
Business ProcessActivities
76
Planning Book Design/Maintenance
• Planning books are very configurable interfaces to your DP planning data
They act as the main tool for viewing and modifying plans in SAP Demand PlanningThey are usually designed from scratch for each project
Although there are many “SAP-delivered” ones Can show any key figure from a planning area sliced and diced (using any characteristics in the associated planning object structure)
• SAP APO supports multiple books per planning area, with multiple views per book
Planning Book Design/Maintenance (cont.)
Header
StandardSelections
Macros
Grid
Shuffler
Switch to otherbook/views

78
Planning Book Design/Maintenance (cont.)
• Important things to considerWhich organizational groups need planning books?
Marketing, sales, etc.Do these groups need to share data, or will they generate their own?
Consensus forecasting processAre any special calculations needed to support the forecasting process? (macros)
79
Planning Book Design/Maintenance – Tips
• SAP provides a “wizard” to guide you step-by-step through the process of creating planning books and data views
• A good way to start is to copy a standard SAP planning book and modify it to meet your needs
• You can edit the layout and format of a data view directly from DP Interactive Planning
Click the “Design” icon located on the planning table toolbar• To help improve performance
Keep the number of key figures in each planning book/data view to a minimumTry not to use Default macros – these automatically execute whenever data is changed
80
Planning Book Wizard
81
A Typical Demand Planning Process
InfoCube/Planning AreaDesign/Maintenance
InfoCube/Planning AreaDesign/Maintenance
Forecast ProfilesDesign/MaintenanceForecast Profiles
Design/Maintenance
Creation ofStatistical forecast
Creation ofStatistical forecast
Creation of promotions
Creation of promotions
Reconciliation ofDemand Plans
Reconciliation ofDemand Plans
Historical dataupdates
Historical dataupdates
Monitoringforecast accuracy
Monitoringforecast accuracy
Planning BookDesign/Maintenance
Planning BookDesign/Maintenance
Manual Adjustments
Manual Adjustments
Release of Demand Plan
Release of Demand Plan
Evaluate/UpdatePlanning Area/Planning Books
Evaluate/UpdatePlanning Area/Planning Books
Create new master data
Create new master data
Generate new CVCs/Prop factors
Generate new CVCs/Prop factors
Load newmaster data to Planning Area
Load newmaster data to Planning Area
Data MaintenanceActivities
Business ProcessActivities
82
Creation of Statistical Forecast
• Important things to considerHow often do the statistical models need to run?Should they be run interactively or in batch?At what level is the forecast going to be run?
• TipsIf you plan on executing your forecast by using a batch job, be mindful of the sequence you run it in
You’ll probably have multiple jobs that have to be run with it
You can compare the results from different forecast runs directly through the SAP Demand Planning desktop
83
A Typical Demand Planning Process
InfoCube/Planning AreaDesign/Maintenance
InfoCube/Planning AreaDesign/Maintenance
Forecast ProfilesDesign/MaintenanceForecast Profiles
Design/Maintenance
Creation ofStatistical forecast
Creation ofStatistical forecast
Creation of promotions
Creation of promotions
Reconciliation ofDemand Plans
Reconciliation ofDemand Plans
Historical dataupdates
Historical dataupdates
Monitoringforecast accuracy
Monitoringforecast accuracy
Planning BookDesign/Maintenance
Planning BookDesign/Maintenance
Manual adjustments
Manual adjustments
Release of Demand Plan
Release of Demand Plan
Evaluate/UpdatePlanning Area/Planning Books
Evaluate/UpdatePlanning Area/Planning Books
Create new master data
Create new master data
Generate new CVCs/Prop factors
Generate new CVCs/Prop factors
Load newmaster data to Planning Area
Load newmaster data to Planning Area
Data MaintenanceActivities
Business ProcessActivities

84
Release of Demand Plan
• Important things to considerWhere will the Demand Plan be sent?
SNP, SAP ERP Demand Management, Legacy systemsHow often should forecasts be released?
• TipsTo pass forecasts to SAP ERP, the Core Interface (CIF) must be configured
As all material/location master data objects must exist in SAP APO for the standard release transactions to work
SAP recommends that you use a separate data view for the transfer process
This data view should contain only the key figure containing the forecast data to be transferred, and a forecast horizon only (no history)
85
Release of Demand Plan (cont.)
• Legacy integrationSAP APO Demand Planning is tightly integrated with:
SNP via liveCache (TimeSeries liveCache Order liveCache)SAP ERP via CIF Interface
The SAP APO Demand Planning can also be integrated with a legacy system via BAPI “BAPI_PBSRVAPS_GETDETAIL2”The BAPI enables:
Extraction of data from TimeSeries liveCache to a file/interfaceAggregation on weekly/monthly basis of forecasts results
86
A Typical Demand Planning Process
InfoCube/Planning AreaDesign/ Maintenance
InfoCube/Planning AreaDesign/ Maintenance
Forecast ProfilesDesign/MaintenanceForecast Profiles
Design/Maintenance
Creation ofStatistical forecast
Creation ofStatistical forecast
Creation of promotions
Creation of promotions
Reconciliation ofDemand Plans
Reconciliation ofDemand Plans
Historical dataupdates
Historical dataupdates
Monitoringforecast accuracy
Monitoringforecast accuracy
Planning BookDesign/Maintenance
Planning BookDesign/Maintenance
Manual Adjustments
Manual Adjustments
Release of Demand Plan
Release of Demand Plan
Evaluate/UpdatePlanning Area/Planning Books
Evaluate/UpdatePlanning Area/Planning Books
Create new master data
Create new master data
Generate new CVCs/Prop factors
Generate new CVCs/Prop factors
Load newmaster data to Planning Area
Load newmaster data to Planning Area
Data MaintenanceActivities
Business ProcessActivities 87
Historical Data Updates
SAP ERP
SAP BW/BIDP
SAP APO(part of SAP SCM)
SNP/PP/DS
Historical Data(Shipments, Orders)
Planned Orders(Production, Transport)
Non-SAP
88
Historical Data Updates (cont.)
• Important things to considerWhat is “Historical Data”?
Actual ship date? Requested ship date? Customer requested date? Order entry date?
At what level will historical data be kept?How often should SAP Demand Planning be updated?How are cross-period events handled?
• TipsCLEARLY define what constitutes historical data, and make sure all groups (especially BI) understand this definition
SAP Demand Planning needs, in most cases, at least two years of historical data for statistical models to produce high quality results!
89
Historical Data Updates (cont.)
• Improving Demand ForecastSales Order History (SOH) vs. Point of Sale (POS)
Most DP implementations use classic Sales Order HistoryAs companies delve into CPFR (Collaborative Planning, Forecasting, and Replenishment) implementations, customers/suppliers begin to share genuine demand information – POSPOS eliminates Bullwhip Effect from Sales Order History and accounts for more accurate demand forecastSAP APO DP allows seamless integration of POS via EDI852 transaction (IDoc: PROACT01)

90
A Typical Demand Planning Process
InfoCube/Planning AreaDesign/Maintenance
InfoCube/Planning AreaDesign/Maintenance
Forecast ProfilesDesign/MaintenanceForecast Profiles
Design/Maintenance
Creation ofStatistical forecast
Creation ofStatistical forecast
Creation of promotions
Creation of promotions
Reconciliation ofDemand Plans
Reconciliation ofDemand Plans
Historical dataupdates
Historical dataupdates
Monitoringforecast accuracy
Monitoringforecast accuracy
Planning BookDesign/Maintenance
Planning BookDesign/Maintenance
Manual Adjustments
Manual Adjustments
Release of Demand Plan
Release of Demand Plan
Evaluate/UpdatePlanning Area/Planning Books
Evaluate/UpdatePlanning Area/Planning Books
Create new master data
Create new master data
Generate new CVCs/Prop factors
Generate new CVCs/Prop factors
Load newmaster data to Planning Area
Load newmaster data to Planning Area
Data MaintenanceActivities
Business ProcessActivities 91
Monitoring Forecast Accuracy
• You monitor forecast accuracyTo find out whether you are using the right forecast models To identify what adjustments are needed to forecast models To project expected deviation from the planned forecast
• Important things to considerWhat’s your definition of “Forecast Accuracy”?
Example: FA = 1 – ([Actual – Forecast]/Actual)How will you monitor Forecast Accuracy?
92
Four DP Methods with Which to Monitor Forecast Accuracy
1 – Univariate forecast error measurements 2 – Multiple Linear Regression model measures of fit 3 – Planned/actual comparison using macros4 – Use an SAP NetWeaver BI/SAP BW front end for forecast
accuracy reporting
93
1 – Univariate Forecast Error Measurements
• Univariate measures of error available in SAP Demand Planning
MAD Mean Absolute Deviation
Total Error Total Forecast Error
MAPE Mean Absolute Percentage Error
MSE Mean Square Error
RMSE Root of the Mean Square Error
MPE Mean Percentage Error – Bias
94
2 – Multiple Linear Regression Model Measures of Fit
• SAP Demand Planning offers you many ways to measure how well an MLR model fits the available data
R-square Adjusted R-square Durbin-h Durbin-Watson T-test Mean elasticity
95
3 – Planned/Actual Comparison Using Macros
• Macro automatically calculates forecast error, then triggers an alert if that error exceeds preset levels
Information alert if 10% or lessWarning alert if between 10% and 20%Error alert if greater than 20%
InformationWarningError

96
Monitoring Forecast Accuracy
• Forecast Fit vs. Forecast AccuracyForecast Fit – describes the relative difference between actual historical data and a hypothetical forecast generated by systemForecast Accuracy – describes the relative difference between actual historical data and actual forecast previously generated by the systemSAP APO Demand Planning is pre-built with standard Forecast Fit algorithms. Therefore, a demand planner may select forecast fit errors he may monitor during each statistical forecast generationForecast Accuracy algorithms can be either designed using SAP APO macros or via SAP BI Reporting functionality
97
4 – Use an SAP NetWeaver BI/SAP BW Front End for Forecast Accuracy Reporting• You can use the SAP BEx Analyzer/Explorer to extract data
directly from SAP Demand Planning – identical to an SAP NetWeaver BI/SAP BW report
98
Monitoring Forecast Accuracy: Some Tips
• Establish and communicate your organization’s definition of “forecast accuracy”
• Set up effective ways of monitoring forecast accuracy This is key to understanding how to adjust/change the forecast process
• Leverage DP data structures They make it easy to analyze forecast accuracy at a variety of different levels:
Specific product brandsSpecific customers
99
Monitoring Forecast Accuracy: Some Tips (cont.)
• Dedicate plenty of time/resources to figuring out which statistical models are the most appropriate to use
It is not appropriate to use the same model for all itemsA model should not be arbitrarily selected based on presumptions aloneModel parameters should be tested and continually reviewedData should be analyzed for patterns or the absence thereof
Those closest to the business should be tapped for domain knowledge
100
Monitoring Forecast Accuracy: Some Tips (cont.)
• If you use the rolling error analysis format:You must include key figures to which the past period data can be written
• You can report accuracy data directly out of SAP Demand Planning
Prerequisites for ad hoc reporting out of a DP InfoCube:A planning area in SAP APOAn extraction structure for the planning areaAn InfoSourceA standard or remote Cube that reflects liveCache data
• Using the standard error metrics generated by SAP APO is a greatway to judge forecast accuracy
MAPE is generally regarded as the best metric to use
101
Error Metrics – MAPE vs. MPE
Forecast Actual Error Absolute ErrorAbsolute
Percent Error
Product 1 3 1 -2 2 200%
Product 2 0 50 50 50 100%
Product 3 25 75 50 50 67%
Product 4 75 74 -1 1 1%
Product 5 100 75 -25 25 33%
TOTAL 203 275 72 128
AVERAGE 40.6 55 14.4 25.6 80%
With Product 1Without
Product 1
Mean Percent Error (MPE)80% 50%
=avg(absolute percentage error)
Mean Absolute Percent Error (MAPE)47% 46%
=sum(absolute errors)/sum(actuals)

102
You can enhance the usefulness of MAPE by adding weighting factors (standard cost, list price) to the calculation. This results in higher-value items having a greater influence on the overall error than lower-value ones, and resolves one of the drawbacks of using MAPE – the assumption that the absolute error of each item is equal.
Error Metrics
• ImplicationsMPE is easily skewed by a single entry
Product 1 drives much of the error in the previous exampleMAPE doesn’t suffer from this, and is much more balanced, and therefore offers a more practical metric for monitoring forecasterror/accuracy
103
Managing Planning Exceptions with Alerts
• Notify users of “exception” situations occurring in the demand planning process
• An exception can be:Changes in bias, new trends, unexpected demands Orders exceed forecastOrders fall short of forecast, which may lead to excess inventoryForecast accuracy is below a specified threshold
• Alerts can be filtered and prioritized based on severity throughconfiguration
104
What We’ll Cover …
• The importance of a good forecast• SAP Demand Planning (DP) – What it can do
Demand Planning overviewCreating a forecast using DP’s Statistical ModelsEnhancing a forecast with key DP tools
• SAP Demand Planning – How to implement itPlanning and designing your DP solutionConfiguring and testing your DP solution
• Wrap-up
105
Realization/Configuration
• This stage is critical for successful knowledge transfer! Standard approach is DEV, QA, PRODUCTION
• Common issuesOverly complex data model
Too many characteristics, key figures, planning books, macros doing complicated calculations, etc.My advice – Keep your initial model simple, because you can always go back later and add stuff
Don’t assume you’re configuring a static modelYour business is dynamic, and so your DP environment must be as well
Realignment
106
System Sizing Is CRITICAL!
• Things that affect performanceAmount of historical data
Don’t keep 5+ years of data if you don’t need itNumber of materials, characteristics, key figures, versions, etc.
Forecast for key materials at just a few levelsNumber of macros and what they do
Be VERY careful here; macros are system hogsAvoid “Default” macros
Levels of forecastingForecast at a high level and have system disaggregate
Time bucketsForecast in week/month buckets, not days
107
SAP QuickSizer and liveCache
liveCache size = function (combinations, time buckets, versions)This is multiplicative, non-linear, and difficult to predict!

108
• Note that figures of 16-64gb are to be expected in production systems
• Consider W2003 64-bit NT or Unix for performance
• Ideally, multi-way CPUs (at least 4-way min.)
SAP QuickSizer and liveCache (cont.)
109
Great new feature introduced in SAP SCM 5.0:• Ability to create time series objects not only
for specific key figures in a planning area, but over specific time horizons. This can greatly reduce the overall amount of memory needed for liveCache.
SAP QuickSizer and liveCache (cont.)
SAP QuickSizer and liveCache (cont.)
110
111
Testing Your SAP Demand Planning Implementation
• Testing SAP Demand Planning usually consists of:Design Unit test, System test, Data Migration testDisaster Recovery test, Stress testsFinal Integration test, User Acceptance test
• Key: Analyze which statistical methods are appropriateForecast errors
MAD, MAPE, etc.Ex-post forecast
A forecast that is run in past periods for which actual demand history is also available
Don’t wait until the end to test with realistic data volumes!
112
SAP ERPDev
SAP APO Dev*
SAP APO QAS*
SAP ERPQAS
SAP ERPPRD
SAP APO PRD
SAP APO liveCache
SAP ERPCopy
* Internal liveCache acceptable – but must be 64-bit machinefor SAP APO 4.1 and later releases (UNIX or Windows 2003 64-bit)
CIFCIFCIF
Development and Stress Test – Considerations
113
Go-Live
• Training“Train-the-Trainer” approachInstructor should be from client
• SupportWho can users call for help?
Competency Center modelConsulting support
• Raging go-live party
One of the more common problems in a DP project is user acceptance. These problems usually manifest themselves most prominently during the go-live phase.To help alleviate this, provide users with some temporary means of feeling comfortable with the system (e.g., Override key figure).

114
Some DP Project “Horror Stories”
• Historical data – “What’s an Order?”Develop clear definitions early in the process
• User acceptance – “I ain’t usin’ that thing!”Get users involved early Develop a prototype
• Performance“I’ve executed the forecast model – see you on Monday”
Figure out data scale early – how many materials, etc. Use QuickSizer, SAP, Consulting PartnersPerform multiple sizing checks
• Forecast Models – “Just use the Constant model”Educate users on statistics
115
What We’ll Cover …
• The importance of a good forecast• SAP Demand Planning (DP) – What it can do
Demand Planning overviewCreating a forecast using DP’s Statistical ModelsEnhancing a forecast with key DP tools
• SAP Demand Planning – How to implement itPlanning and designing your DP solutionConfiguring and testing your DP solution
• Wrap-up
116
Resources
• Web linksInternational Institute of Forecasting
www.forecasters.org SAP SCM documentation
http://help.sap.com SAP Business Suite SAP Supply Chain Management)
The Institute for Forecasting Education www.forecastingeducation.com
• BooksJohn E. Hanke and Arthur G. Reitsch, Business Forecasting(Prentice Hall, 1995).Wolfgang Eddigehausen, The SAP APO Knowledge Book –Supply and Demand Planning (Wolfgang Eddigehausen, 2002).
ISBN 0-9581791-0-7117
Resources (cont.)
• Great SAP APO Discussion Grouphttp://supplychain.ittoolbox.com/related-groups/SAP/technical-functional/sap-apo
• SCM ExpertHayrettin Cil and Mehmet Nizamoglu, “23 Ways to Squeeze Better Performance from APO DP Processing and Reporting”(SCM Expert, August/September, 2004).
118
7 Key Points to Take Home
• SAP Demand Planning offers strong functionality in the followingareas:
Sound forecasting methods (Basic and Advanced)Collaborative forecasting methodsLife cycle and promotion planningExcellent way of monitoring accuracyQuick reporting using SAP Business Explorer (SAP BEx Analyzer)Superior integration with other modules of SAP APO
• SAP Demand Planning is extremely flexible – so proper planning is the key to a successful DP environment!
119
7 Key Points to Take Home (cont.)
• SAP Demand Planning offers several powerful forecasting toolsUnivariate/time series models where constant, trend, or seasonal patterns existCausal models to investigate relationships between variables Composite models combine forecasts to reduce error
• Causal forecasting can be very effective when used in conjunction with Time Series forecasting
But understand what it actually does, and that it’s more demanding to set up and maintain
DP supports a business process – getting the process right is therefore critical

120
7 Key Points to Take Home (cont.)
• Keep your design simple, but be careful Detail may grow exponentially as you go DP SNP PP/DSIf you “build a data monster,” you will have to “maintain the monster”
• Develop clear definitions of your data and mappings of where they’re coming from/going to
“Historical data” to the DP team may mean something different than to the SAP BW team
• Assembling the right team – and the right mix of business and technical skills – can make or break your SAP APO project
121
Your Turn!
How to contact me:Alistair Thornton – [email protected]
Rick Anderson – [email protected]
DisclaimerSAP, R/3, mySAP, mySAP.com, xApps, xApp, SAP NetWeaver®, Duet™, PartnerEdge, and other SAP products and services mentioned herein as well as their respective logos are trademarks or registered trademarks of SAP AG in Germany and in several other countries all over the world. All other product and service names mentioned are the trademarks of their respective companies. Wellesley Information Services is neither owned nor controlled by SAP.

Notes: ______________________________________________________________________________
______________________________________________________________________________
______________________________________________________________________________
______________________________________________________________________________
______________________________________________________________________________
______________________________________________________________________________
______________________________________________________________________________
______________________________________________________________________________
______________________________________________________________________________
______________________________________________________________________________
______________________________________________________________________________
______________________________________________________________________________
______________________________________________________________________________
______________________________________________________________________________
______________________________________________________________________________
______________________________________________________________________________
______________________________________________________________________________
______________________________________________________________________________
______________________________________________________________________________
______________________________________________________________________________
______________________________________________________________________________
______________________________________________________________________________
______________________________________________________________________________
______________________________________________________________________________
______________________________________________________________________________
______________________________________________________________________________
______________________________________________________________________________
______________________________________________________________________________
______________________________________________________________________________
______________________________________________________________________________

Wellesley Information Services, 20 Carematrix Drive, Dedham, MA 02026
Copyright © 2009 Wellesley Information Services. All rights reserved.