What Should Commissioners Consider when Reviewing Arizona Resource Plans? Presentation to the...
20
What Should Commissioners Consider when Reviewing Arizona Resource Plans? Presentation to the Arizona Corporation Commission September 11, 2014 Docket No. E-00000V-13-0070 David Berry 1 [email protected]
-
Upload
kathlyn-wilcox -
Category
Documents
-
view
217 -
download
3
Transcript of What Should Commissioners Consider when Reviewing Arizona Resource Plans? Presentation to the...
1
What Should Commissioners Consider when Reviewing Arizona Resource Plans?
Presentation to theArizona Corporation Commission
September 11, 2014Docket No. E-00000V-13-0070
David Berry
2
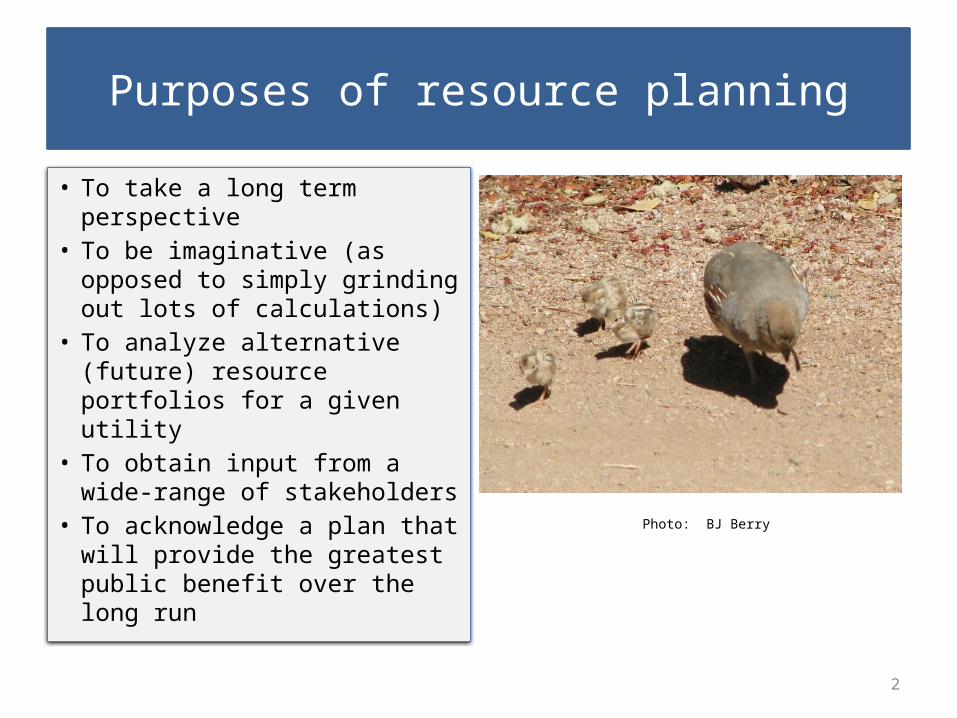
Purposes of resource planning
• To take a long term perspective
• To be imaginative (as opposed to simply grinding out lots of calculations)
• To analyze alternative (future) resource portfolios for a given utility
• To obtain input from a wide-range of stakeholders
• To acknowledge a plan that will provide the greatest public benefit over the long run
Photo: BJ Berry
3
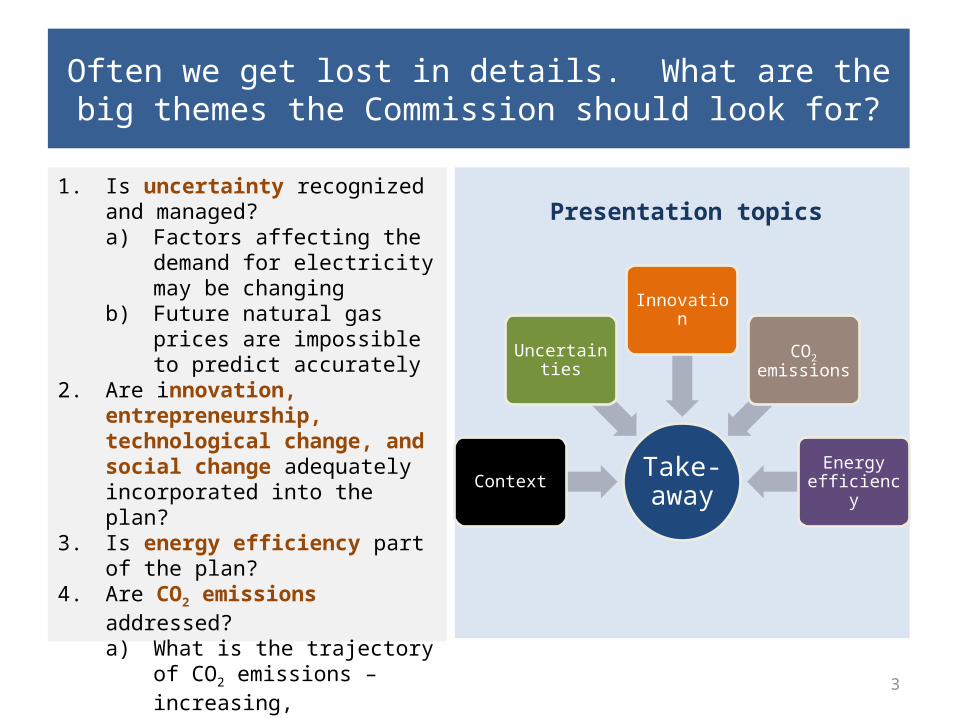
Often we get lost in details. What are the big themes the Commission should look for?
1. Is uncertainty recognized and managed? a) Factors affecting the demand for
electricity may be changingb) Future natural gas prices are
impossible to predict accurately2. Are innovation, entrepreneurship,
technological change, and social change adequately incorporated into the plan?
3. Is energy efficiency part of the plan?4. Are CO2 emissions addressed?
a) What is the trajectory of CO2 emissions – increasing, decreasing?
b) How can CO2 emissions be reduced?
Take-awayContext
Uncertainties
Innovation
CO2 emissions
Energy efficiency
Presentation topics

4
Context: AZ electricity prices are generally lower than 20 years ago:
electricity prices reflect additions of new facilities & fuel prices 19
9019
9119
9219
9319
9419
9519
9619
9719
9819
9920
0020
0120
0220
0320
0420
0520
0620
0720
0820
0920
1020
1120
125
6
7
8
9
10
11
12
13
14
15
Average Arizona Electricity Prices(2009 cents/kWh)
residential commercialindustrial total
2009
cen
ts p
er k
Wh
Factors affecting prices• Depreciation of large capital
additions – Coal & nuclear plants
completed in the 1980s and 1990:• Springerville 2, 1990• Palo Verde (1986-1988)• Springerville 1, 1985• 1980: Cholla 3, Craig 1,
Coronado 2
– Springerville 4, 2009• Very high natural gas prices,
2005-2008 (lagged effect via fuel adjustors)
• RES, DSM program costs (much less than $0.01/kWh)

5
Context: APS’s vision of 2029 according to its resource plan (selected portfolio)
Energy mix: over half the MWh come from fossil fuel combustion
Capacity mix ~ 70% relies on fossil fuelsNote: gas capacity factor = 23%
nuclear; 1,146
coal; 1,932
gas; 7,137
renewable; 827
distributed energy;
261
demand response;
275
efficiency; 1,447
APS MW Contribution at Peak in 2029: Selected Portfolio(13,025 MW total)
nuclear18%
coal24%gas
28%
re+de14%
ee15%
APS Energy (MWh) Mix, 2029, Selected Portfolio, Current Path Scenario
6
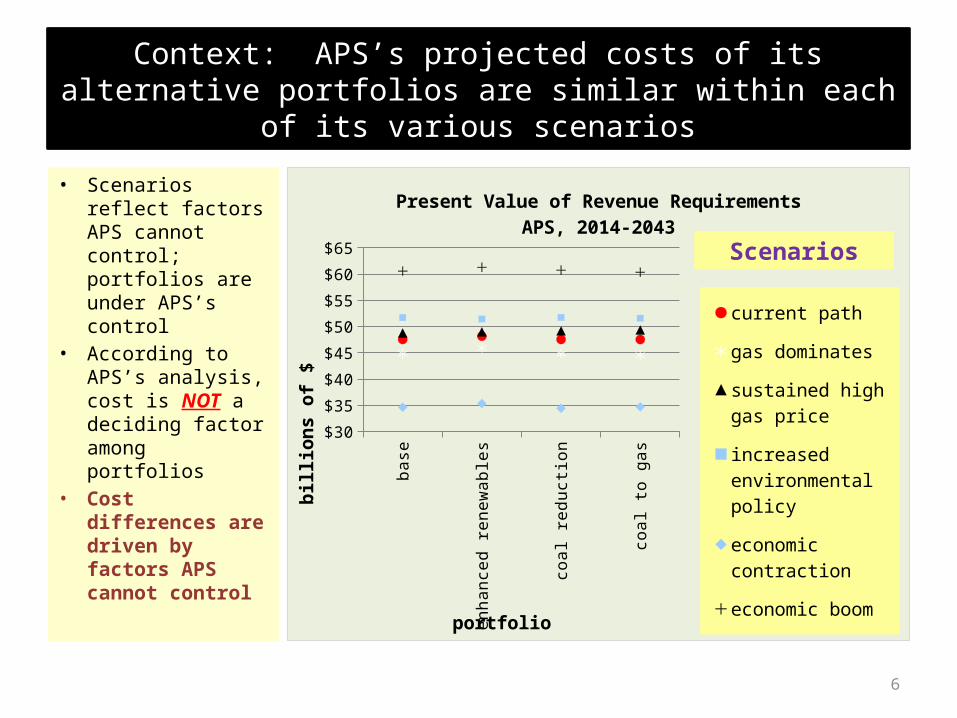
Context: APS’s projected costs of its alternative portfolios are similar within each of its various scenarios
• Scenarios reflect factors APS cannot control; portfolios are under APS’s control
• According to APS’s analysis, cost is NOT a deciding factor among portfolios
• Cost differences are driven by factors APS cannot control
base
enha
nced
ren
ewab
les
coal
red
uctio
n
coal
to g
as
$30
$35
$40
$45
$50
$55
$60
$65
Present Value of Revenue RequirementsAPS, 2014-2043
current path
gas dominates
sustained high gas price
increased environmen-tal policy
economic contraction
economic boomportfolio
billi
ons
of $
Scenarios
7
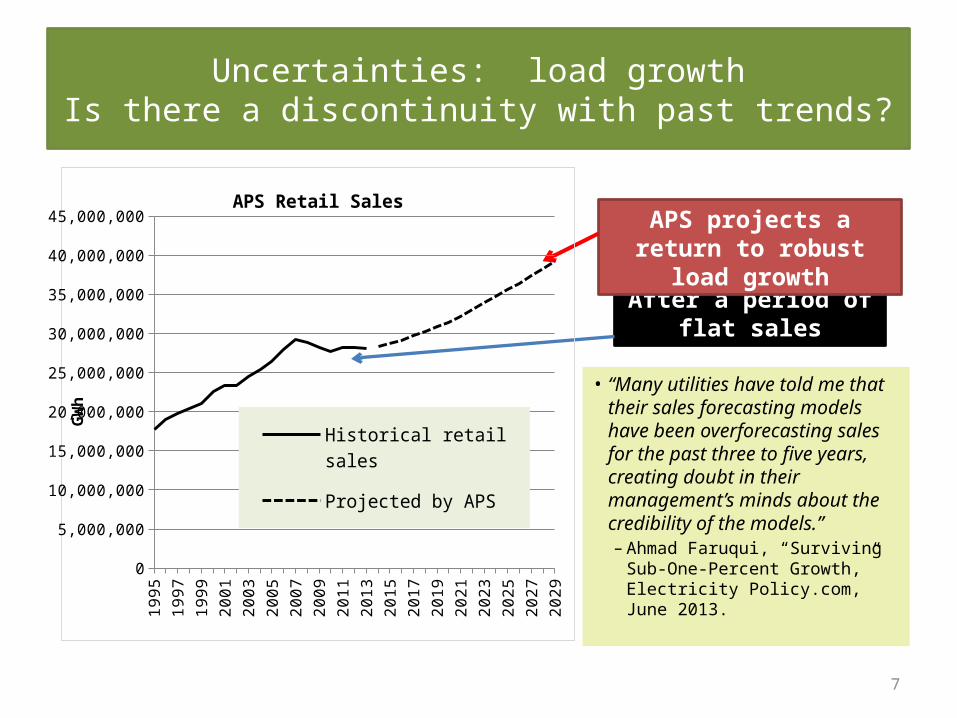
Uncertainties: load growthIs there a discontinuity with past trends?
After a period of flat sales
• “Many utilities have told me that their sales forecasting models have been overforecasting sales for the past three to five years, creating doubt in their management’s minds about the credibility of the models.”– Ahmad Faruqui, “Surviving Sub-
One-Percent Growth,” Electricity Policy.com, June 2013.
APS projects a return to robust load growth
1995
1997
1999
2001
2003
2005
2007
2009
2011
2013
2015
2017
2019
2021
2023
2025
2027
20290
5,000,000
10,000,000
15,000,000
20,000,000
25,000,000
30,000,000
35,000,000
40,000,000
45,000,000APS Retail Sales
Historical retail sales
Projected by APS
GW
h
8
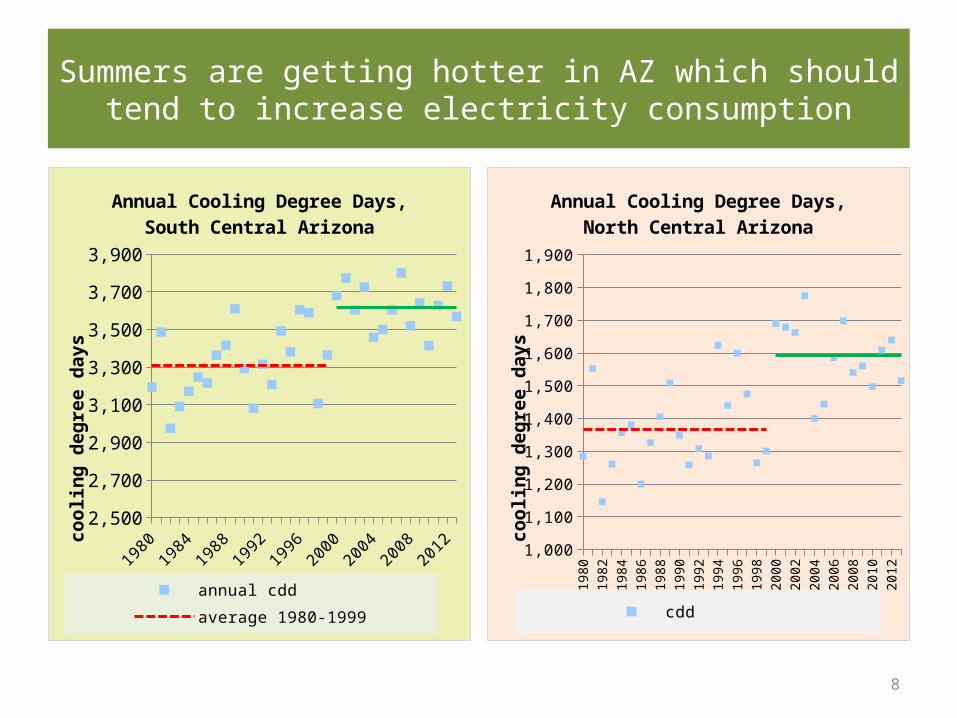
Summers are getting hotter in AZ which should tend to increase electricity consumption
19801983
19861989
19921995
19982001
20042007
20102013
2,500
2,700
2,900
3,100
3,300
3,500
3,700
3,900
Annual Cooling Degree Days, South Central Arizona
annual cddaverage 1980-1999average 2000-2013
cool
ing
degr
ee d
ays
1980
1982
1984
1986
1988
1990
1992
1994
1996
1998
2000
2002
2004
2006
2008
2010
2012
1,000
1,100
1,200
1,300
1,400
1,500
1,600
1,700
1,800
1,900
Annual Cooling Degree Days, North Central Arizona
cdd avg 1980-1999avg 2000-2013
cool
ing
degr
ee d
ays
9
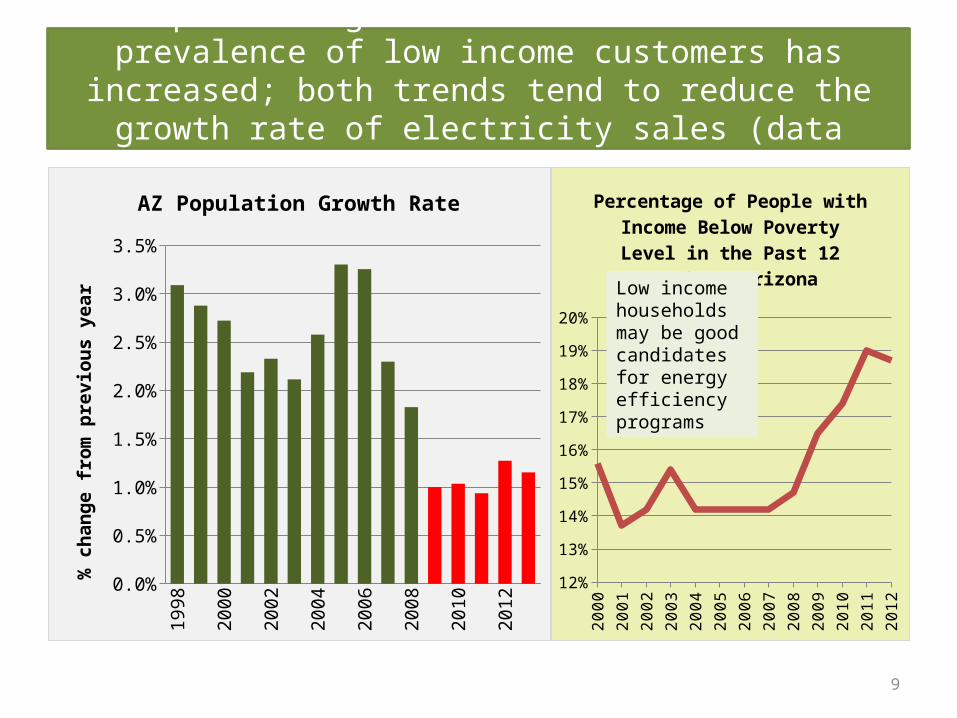
Population growth has slowed and the prevalence of low income customers has increased; both trends tend to reduce the growth
rate of electricity sales (data source: Census Bureau)19
9819
9920
0020
0120
0220
0320
0420
0520
0620
0720
0820
0920
1020
1120
1220
13
0.0%
0.5%
1.0%
1.5%
2.0%
2.5%
3.0%
3.5%
AZ Population Growth Rate
% c
hang
e fr
om p
revi
ous
year
2000
2001
2002
2003
2004
2005
2006
2007
2008
2009
2010
2011
2012
12%
13%
14%
15%
16%
17%
18%
19%
20%
Percentage of People with Income Below Poverty Level in the Past 12
Months: Arizona
Low income households may be good candidates for energy efficiency programs
10
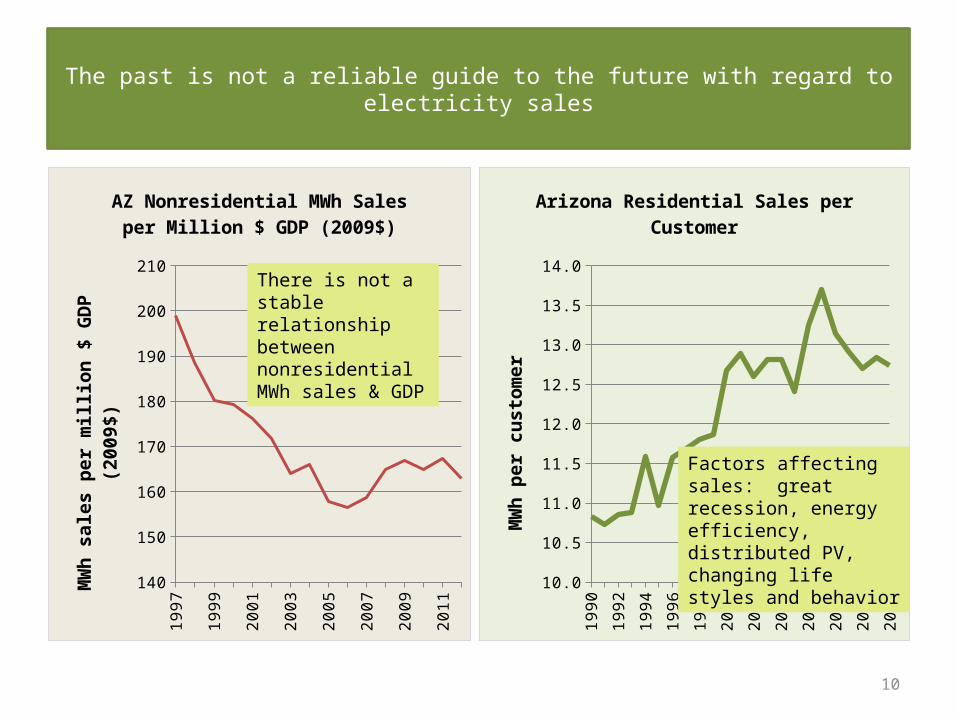
The past is not a reliable guide to the future with regard to electricity sales
1990
1992
1994
1996
1998
2000
2002
2004
2006
2008
2010
2012
10.0
10.5
11.0
11.5
12.0
12.5
13.0
13.5
14.0
Arizona Residential Sales per Customer
MW
h pe
r cus
tom
er
1997
1998
1999
2000
2001
2002
2003
2004
2005
2006
2007
2008
2009
2010
2011
2012
140
150
160
170
180
190
200
210
AZ Nonresidential MWh Sales per Million $ GDP (2009$)
MW
h sa
les
per m
illio
n $
GD
P (2
009$
)
Factors affecting sales: great recession, energy efficiency, distributed PV, changing life styles and behavior
There is not a stable relationship between nonresidential MWh sales & GDP
11
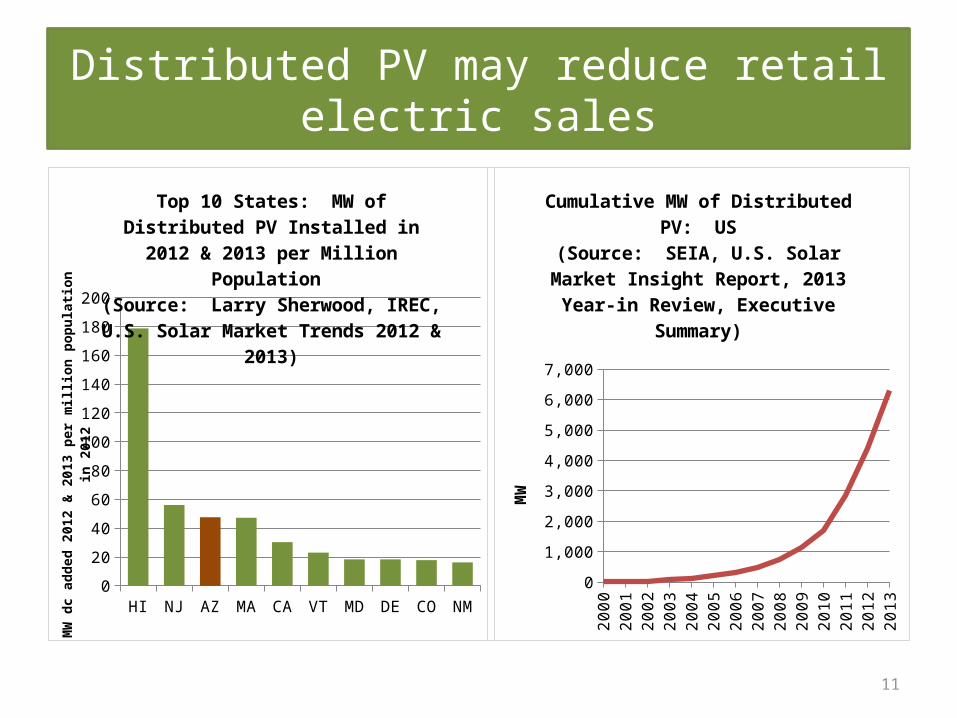
Distributed PV may reduce retail electric sales
2000
2001
2002
2003
2004
2005
2006
2007
2008
2009
2010
2011
2012
2013
0
1,000
2,000
3,000
4,000
5,000
6,000
7,000
Cumulative MW of Distributed PV: US(Source: SEIA, U.S. Solar Market Insight Report, 2013 Year-in Review, Executive
Summary)
MW
HI NJ AZ MA CA VT MD DE CO NM0
20
40
60
80
100
120
140
160
180
200
Top 10 States: MW of Distributed PV In-stalled in 2012 & 2013 per Million Popula-
tion (Source: Larry Sherwood, IREC, U.S. Solar
Market Trends 2012 & 2013)
MW
dc a
dded
201
2 &
201
3 pe
r mill
ion
popu
latio
n in
201
2
12
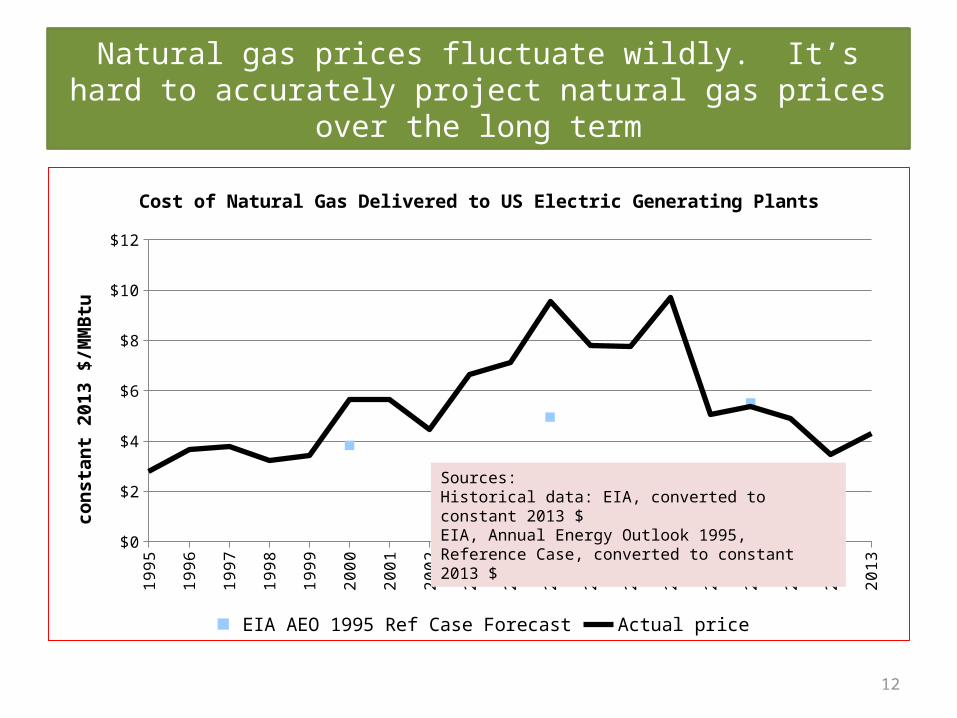
Natural gas prices fluctuate wildly. It’s hard to accurately project natural gas prices over the long term
1995
1996
1997
1998
1999
2000
2001
2002
2003
2004
2005
2006
2007
2008
2009
2010
2011
2012
2013
$0
$2
$4
$6
$8
$10
$12
Cost of Natural Gas Delivered to US Electric Generating Plants
EIA AEO 1995 Ref Case Forecast Actual price
cons
tant
201
3 $/
MM
Btu
Sources:Historical data: EIA, converted to constant 2013 $EIA, Annual Energy Outlook 1995, Reference Case, converted to constant 2013 $
13
Innovation can occur rapidly and can profoundly change an industry
• A few examples of recent innovations– PV on noise barriers, at airports, in
the water supply system– PowerParasols®
– Leasing model for rooftop solar– Market transformation for energy
efficiency– Energy storage– Micro-grids– Solar roadways (?)
• Taken together these & other innovations may result in significant disruptions to business as usual
Photo: BJ Berry
14
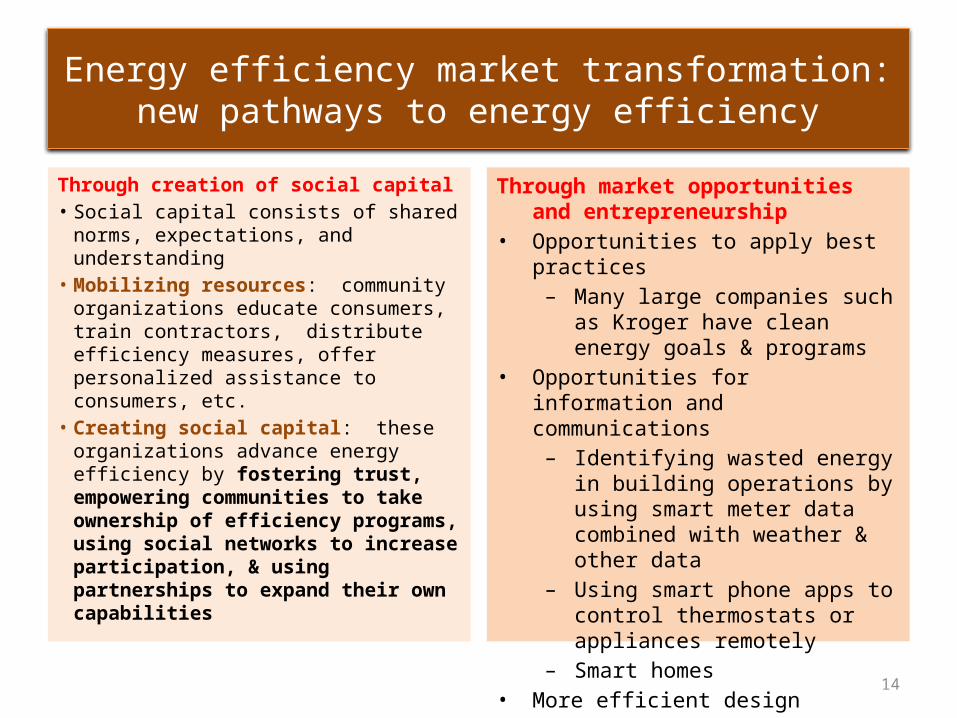
Energy efficiency market transformation: new pathways to energy efficiency
Through creation of social capital• Social capital consists of shared norms,
expectations, and understanding • Mobilizing resources: community
organizations educate consumers, train contractors, distribute efficiency measures, offer personalized assistance to consumers, etc.
• Creating social capital: these organizations advance energy efficiency by fostering trust, empowering communities to take ownership of efficiency programs, using social networks to increase participation, & using partnerships to expand their own capabilities
Through market opportunities and entrepreneurship
• Opportunities to apply best practices– Many large companies such as Kroger
have clean energy goals & programs• Opportunities for information and
communications – Identifying wasted energy in building
operations by using smart meter data combined with weather & other data
– Using smart phone apps to control thermostats or appliances remotely
– Smart homes• More efficient design
– Meritage Homes

15
What is the trajectory of carbon dioxide emissions?
Factors affecting emissions decline:
• Coal plant retirements
• Improved energy efficiency
• Renewable energy
• The great recession
1990
1991
1992
1993
1994
1995
1996
1997
1998
1999
2000
2001
2002
2003
2004
2005
2006
2007
2008
2009
2010
2011
2012
150
160
170
180
190
200
210
220
230
240
250
CO2 Emissions from Electric Generation(AZ, NM, NV, UT, CO, WY)
actual trend
mill
ion
met
ric
tons
of C
O2

16
How can Arizona reduce its CO2 emissions rate (lbs per MWh) from fossil fuel plants to meet the proposed EPA carbon rule?
1. EPA’s proposed rule would require significant decreases in the emission rates of fossil fuel power plants in AZ* EPA’s 2030 goal for AZ is 702 pounds per net MWh. This goal
pertains to the state, not to individual utilities. 2. Practical steps AZ utilities could take to reduce CO2 emissions
Continue energy efficiency programs consistent with the energy efficiency standard
Increase the use of renewable resources (geothermal, solar, & wind)
Substitute gas-fired generation for coal-fired generation* AZ coal units are Apache Station, Cholla, Coronado, and Springerville (other coal plants
serving AZ customers are in Indian country or in other states)

17
Under APS’s IRP, total CO2 emissions will increase but APS‘s emissions intensity declines
2014
2015
2016
2017
2018
2019
2020
2021
2022
2023
2024
2025
2026
2027
2028
2029
10,000,000
11,000,000
12,000,000
13,000,000
14,000,000
15,000,000
16,000,000
17,000,000
18,000,000
19,000,000
APS CO2 Emissions Trajectories:Current Path Scenario
base enhanced renewables
coal reduction coal to gas
mill
ions
of m
etric
tons
of C
O2
Note: this is not EPA’s method of calculating emissions rates
base
enhanced renewables
coal reduction
coal to gas
-300 -250 -200 -150 -100 -50 0
Change in APS CO2 Emission Rate 2014 to 2029(current path scenario; relative to all MWh)
Change in emissions rate (pounds per MWh)
18
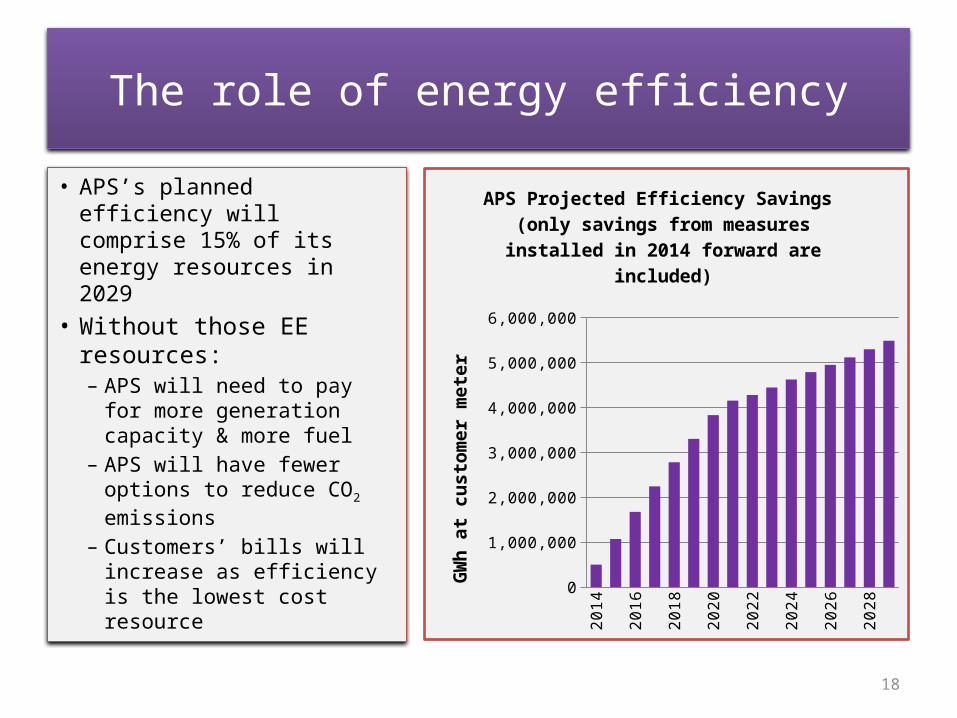
The role of energy efficiency
• APS’s planned efficiency will comprise 15% of its energy resources in 2029
• Without those EE resources:– APS will need to pay for
more generation capacity & more fuel
– APS will have fewer options to reduce CO2 emissions
– Customers’ bills will increase as efficiency is the lowest cost resource 20
1420
1520
1620
1720
1820
1920
2020
2120
2220
2320
2420
2520
2620
2720
2820
29
0
1,000,000
2,000,000
3,000,000
4,000,000
5,000,000
6,000,000
APS Projected Efficiency Savings (only savings from measures installed in 2014
forward are included)
GW
h at
cus
tom
er m
eter
19
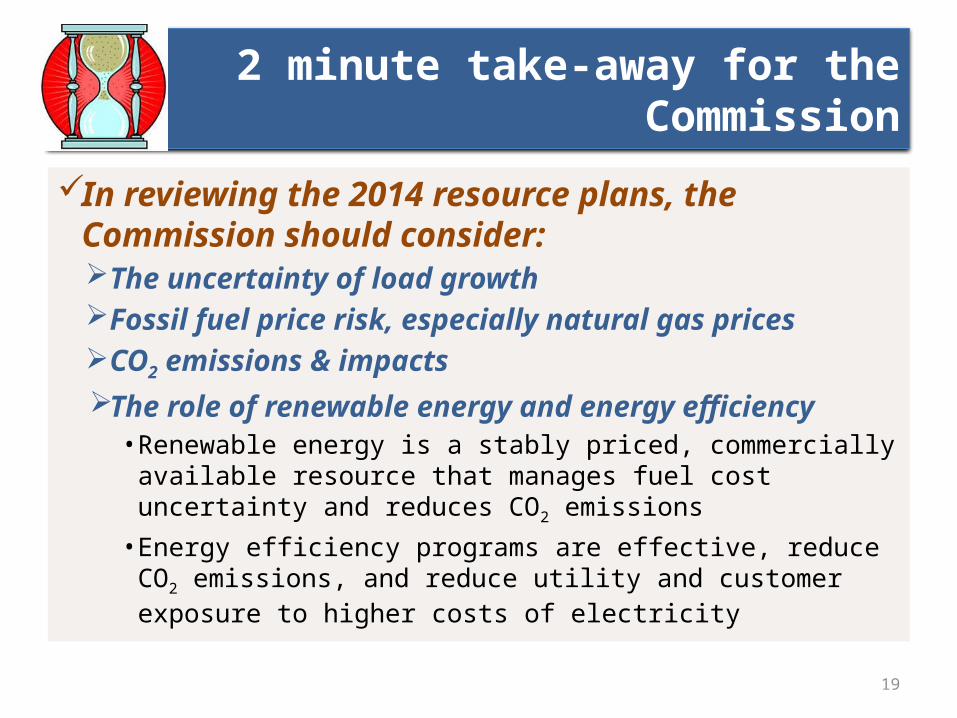
2 minute take-away for the Commission
In reviewing the 2014 resource plans, the Commission should consider: The uncertainty of load growth Fossil fuel price risk, especially natural gas prices CO2 emissions & impactsThe role of renewable energy and energy efficiency
• Renewable energy is a stably priced, commercially available resource that manages fuel cost uncertainty and reduces CO2 emissions
• Energy efficiency programs are effective, reduce CO2 emissions, and reduce utility and customer exposure to higher costs of electricity

20
2 minute take-away for the Commission
The Commission should ask whether policies encourage innovation and its benefits or whether policies lock out new technologies or create barriers to new market entrants
• Beneficial change is being driven by:– Innovation and entrepreneurship, especially from
outside the electric utility industry– Increasing societal & market receptivity to energy
efficiency and distributed renewable energy– Learning by consumers, entrepreneurs, utilities