What sets the top performing ecommerce How fast are … · 2019-07-18 · Consumer shopping...
21
| 1 What are the indicators of top performing companies? How fast are ecommerce companies growing? What sets the top performing ecommerce companies apart?
Transcript of What sets the top performing ecommerce How fast are … · 2019-07-18 · Consumer shopping...

| 1
What are the indicators of top performing companies?
How fast are ecommerce companies growing?
What sets the top performing ecommerce companies apart?
Over the past four years, we have watched ecommerce evolve
from the “cheaper alternative” to a sector known for innovative
products, powerful brands, and data-savvy founders.
This study shares the data behind a shift that we have
observed from the front lines. While the ecommerce landscape
is becoming increasingly competitive, best-in-class brands are
writing the playbook on achieving breakout success.
Here are few of the strategies that we have seen driving these
top performing companies:
Creating a near frictionless buying experience
From solving the inconvenience of mattress shopping (Casper)
to delivering all the ingredients for a healthy home-cooked meal
(Plated), ecommerce companies are building lasting consumer
brands by blurring the line between product and service.
Building passionate communities
Amazon owns commodities, but best-in-class companies build
competitive advantage by engaging with vibrant communities.
Bark & Co. has built a strong community around shared
interests of dog lovers, just as Chubbies has done with shorts
for “bros.” In these companies, customer loyalty fuels growth.
At Lerer Hippeau Ventures, we believe in ecommerce.
Foreword
FOREWORD | 2
Blake Lyon,

FOREWORD | 3
Blending content and commerce
Other companies have reimagined the catalogue and turned it into an
editorial experience. Examples of this include Thrillist with Jackthreads
and Glossier with Into the Gloss.
Offering a “try before you buy” experience
The “What if it’s not like the picture?” hurdle is a barrier that any
ecommerce retailer needs to overcome. But some of today’s biggest
success stories come from companies who have made overcoming
this hurdle a core part of their experience. Warby Parker’s home try on
kits for prescription glasses build returns into the process. Birchbox
reinvented the cosmetic sample, creating an entirely unique buying
experience.
What we see is that the most successful companies excel at two things:
1. A product and brand experience that customers love and keep
coming back for.
2. A keen focus on their KPIs, particularly around customer
acquisition.
It’s the ability to bring customers back again and again, while
aggressively acquiring new customers, that gives best-in-class
companies the edge. We’re excited about these companies. They are
where product-market fit meets excellence in execution, and they will
continue to redefine the ecommerce landscape in the coming years.

At the beginning of 2014, Jeff Jordan of Andreesen Horowitz wrote
a widely quoted post that examined the rapidly changing retail
landscape. His takeaway was simple: “We’re in the midst of a profound
structural shift from physical to digital retail.”
In 2013, the growth of ecommerce significantly outpaced brick-and-
mortar both domestically and worldwide. 2014 kept up this pace of
growth, and according to recent projections from eMarketer, this trend
is going to continue in the coming years.
These numbers are a positive sign for the ecommerce market, but
they conceal an important fact. Behind these averages are ecommerce
companies that have achieved breakout success, far beyond standard
industry growth rates. In 2013, jewelry retailer Alex and Ani grew
250%. NoMoreRack, a flash sales site, also hit a 250% growth rate.
Flash sale site TheRealReal was even higher, growing 295%. These
companies are outperforming the market by leaps and bounds.
In this report, we look at the data to find out what separates the
leaders from the laggards, and help you determine if your company is
one of the best.
Executive Summary PROJECTED COMPOUND ANNUAL
GROWTH RATE THROUGH 2018:
5%Total retail, worldwide
15%Ecommerce only, worldwide
3.3%Total retail, U.S.
11% Ecommerce only, U.S..
All projections from eMarketer
EXECUTIVE SUMMARY | 4

Key Findings
Average Growth Rate
There is no “average growth rate” in ecommerce. Splitting
companies by quartiles reveals that some ecommerce companies
grow dramatically faster than others.
KEY FINDINGS | 5
Average Order Value
Top performing ecommerce
companies have an Average
Order Value (AOV) 36%
higher than everyone else
($94 vs. $60).
Monthly Revenue
By month six in business,
top performing ecommerce
companies have separated
from the pack, reaching a
monthly revenue over $450k,
68% more than everyone else.
Customer Lifetime Value
Companies in the top quartile
have a Customer Lifetime
Value (CLV) 5x greater than
everyone else.
Repeat Purchases
Top performing companies
excel at turning customers into
repeat buyers. Customers of
the fastest growing ecommerce
companies purchase 2x more
than everyone else.
Customer Loyalty
Top performing companies create a “renewable resource”
of loyal customers. By the end of year three in business, a
majority of their revenue is coming from repeat purchases.

METHODOLOGY | 6
Methodology
RJMetrics is the analytics platform of choice for
over 400 online businesses, many of whom are
ecommerce retailers. Our global customer base
ranges from new ecommerce companies with
less than $1 million in annual revenue to some of
the fastest growing companies in the IR 500.
The conclusions in this report are based on
analysis of:
200+Ecommerce
Retailers
$25BTransactions
31MCustomers

Understanding the Ecommerce Landscape
Growth of the Average Ecommerce Company
The first thing we wanted to explore is what average
ecommerce growth looks like. To do this, we plotted
monthly revenue from the date of a store’s first
purchase onward.
This chart seems to show that the average ecommerce
company is making $1.2M per month shortly after the
end of its third year. This statistic, however, is a dramatic
oversimplification. As Avinash Kaushik famously said,
“The interesting thing about averages is that they hide
the truth very effectively.” To tease out the profile of top
performing ecommerce companies, we needed to look
deeper.
$1.2MTotal Revenue
UNDERSTANDING THE ECOMMERCE LANDSCAPE | 7

UNDERSTANDING THE ECOMMERCE LANDSCAPE | 8
Growth by Retail Category
While ecommerce is steadily gaining market share in the retail
industry, certain categories have been more successful at
gaining traction online than others. Apparel/Accessories and
Houseware/Home Furnishings categories have above average
rates of ecommerce penetration, but Food/Drug and Health/
Beauty haven’t had the same success.
It would seem then, that retail category would play a role in
a companies ability to grow, but this doesn’t seem to be the
case. Across the four categories we explored in our research,
there is no significant difference in their growth rates.
TAKEAWAY
Ecommerce category alone is not an indicator
of future growth.
SHARE

UNDERSTANDING THE ECOMMERCE LANDSCAPE | 9
Growth by Revenue Size
As companies get bigger, it becomes harder to sustain a rapid rate of
growth. Jeff Jordan calls this effect “gravity”. We expected to see this
effect play out in our research, and it did.
This insight is helpful for companies in two ways:
1. It’s a helpful guideline as you set growth targets for your
company.
2. It’s a good indicator of when you will need to move past the
low-hanging fruit and start exploring new sources of growth.
In the early days of your company, you’ll grow simply by building
awareness. You’ll build a high-functioning website, create some
ads, and grow a subscriber list. This alone can be enough to get
you growing quickly. But once you cross the two million in revenue
line, you’re going to need to work harder to achieve the same
results.
TAKEAWAY
Revenue alone isn’t an indicator of future performance, but
it’s useful in helping us understand what average growth
rates look like at different stages of a company lifecycle.

The increase in technologically- savvy consumers Consumer shopping behavior has changed dramatically
with the adoption of emerging technologies such as
mobile and social media. “Generation Z,” those aged 18
to 24, are now spending one in ten of their dollars online.
Mobile purchasing In Q2:2014, purchases made via tablet or smartphone
increased 48% YoY, three times the growth in desktop
purchasing. Gartner found that mobile commerce
currently generates 22% of digital commerce revenue,
and predicts mobile revenue in the U.S. will account for
50% by 2017.
Logistics FedEx and UPS committed to addressing previous
seasonal constraints by hiring seasonal employees.
While the larger ecommerce companies, with Amazon
setting the pace, are increasing their ability to handle
their own deliveries and warehousing.
Product and brand differentiation Ecommerce stores like Birchbox, ThinkGeek, and Nine
Naturals have found that the best way to compete with
Amazon is by creating highly differentiated product and
brand experiences.
Emerging international markets All-in-one logistics providers have made it easier to
penetrate international markets by making international
shipping and transaction processing smoother.
Store-based retailers catching up to web-only The threat of “showrooming” is subsiding as traditional
retailers make the transition to the online marketplace.
Traditional retailers saw 22% growth in ecommerce
sales over the 2nd quarter, a pace faster than overall
ecommerce. However, the influence of the online
channel as it extends to offline is continuing to evolve,
and many physical retailers are still attempting to
balance new growth with the proper pace of closing
physical locations.
FACTORS DRIVING FASTER GROWTH IN ECOMMERCE
UNDERSTANDING THE ECOMMERCE LANDSCAPE | 10

UNDERSTANDING THE ECOMMERCE LANDSCAPE | 11
Growth by Year Founded
Over the past decade and a half, the face of ecommerce, from ad
platforms to shopping carts, has changed dramatically:
• Amazon was founded in 1994
• Mailchimp was founded in 2001
• Google Analytics came on the scene in 2006
• The first release of Magento was in 2008
• Facebook Exchange became widely available in 2013
Because of these advancements, we were curious to see if
ecommerce companies founded more recently grow faster in the early
days of their company.
2013 is the most recent year we can make accurate estimates on,
but the data indicates that companies founded more recently get
to $10 million in annual revenue at a much faster pace than
companies founded in earlier years.
This is likely the result of an ecosystem of changes: more high-
quality ecommerce talent on the market, better technology
tools that help retailers with everything from reducing cart
abandonment to fulfilling orders more efficiently, or venture
capitalists showing a greater interest in the ecommerce
market. But one thing is clear, there has never been a better
time than now to start an ecommerce company.
Wrapping Up
Our first round of analysis revealed a few interesting tidbits
about growth patterns, but other than year founded, we didn’t
uncover any clear indicators that tell us whether a company
might become a top performer.
$10MAnnual Revenue

The Profile of Top Performers
At this point, it was clear we needed to get away from
averages and look closer at top performers to gain a
better understanding of who will become the next break-
out hit in ecommerce.
Revenue by Quartile
To do this, we split our sample into quartiles based on
total revenue in their third year of existence. The fastest
growing companies are in the first quartile, next-best in
the second, and so on.
This data paints a sharp contrast between the very best
and the rest of the pack. The top quartile (Q1) companies
are nearing $60 million in total revenue by the third year
they’re in business, the rest of the pack hasn’t crossed
$15 million.
THE PROFILE OF TOP PERFORMERS | 12
THE PROFILE OF TOP PERFORMERS | 13
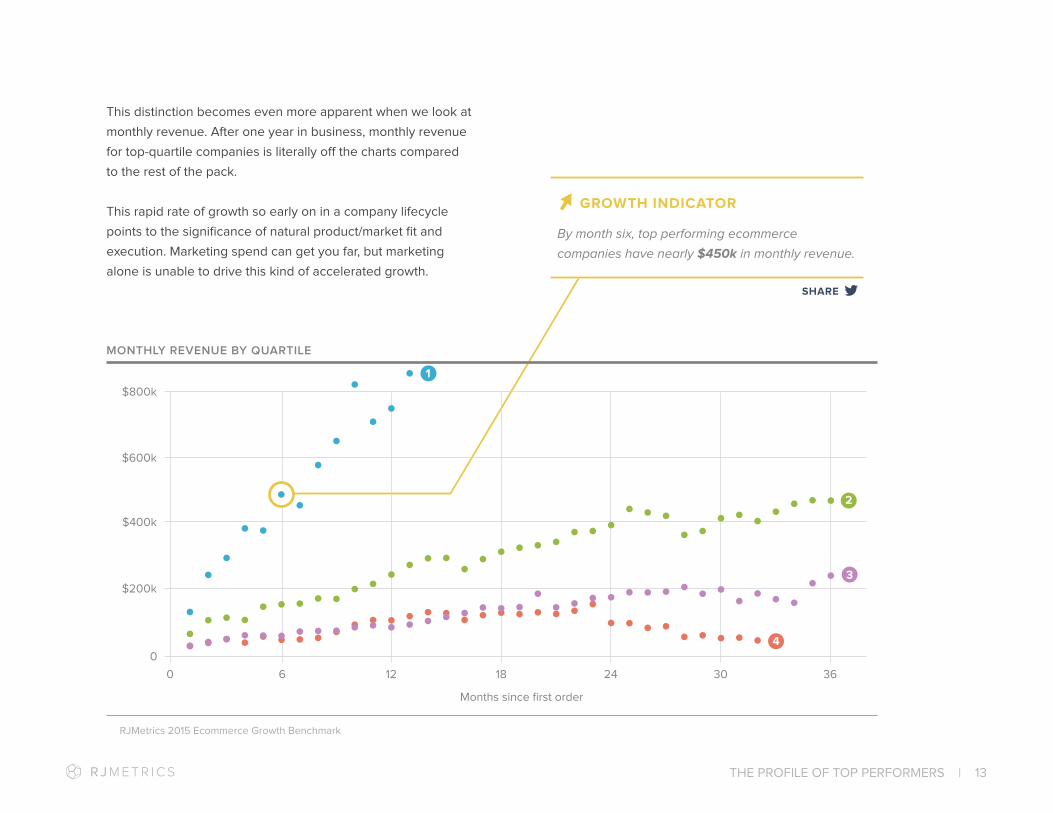
This distinction becomes even more apparent when we look at
monthly revenue. After one year in business, monthly revenue
for top-quartile companies is literally off the charts compared
to the rest of the pack.
This rapid rate of growth so early on in a company lifecycle
points to the significance of natural product/market fit and
execution. Marketing spend can get you far, but marketing
alone is unable to drive this kind of accelerated growth.
GROWTH INDICATOR
By month six, top performing ecommerce
companies have nearly $450k in monthly revenue.
SHARE
THE PROFILE OF TOP PERFORMERS | 14
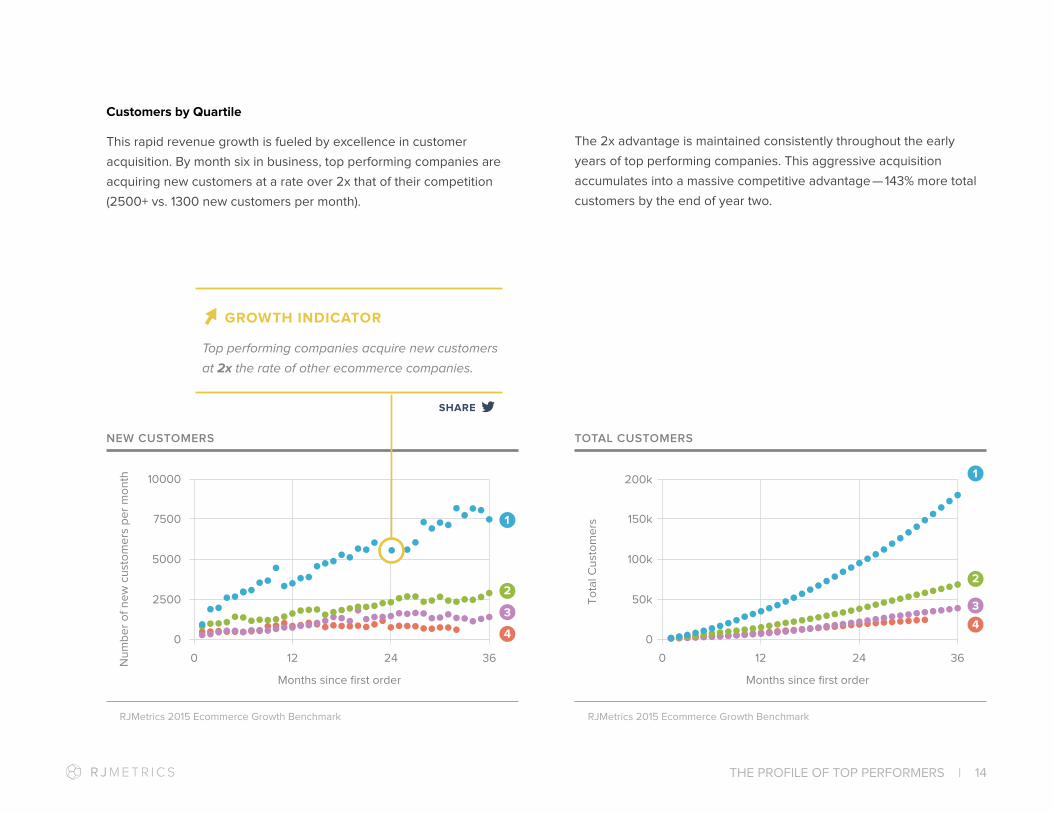
Customers by Quartile
This rapid revenue growth is fueled by excellence in customer
acquisition. By month six in business, top performing companies are
acquiring new customers at a rate over 2x that of their competition
(2500+ vs. 1300 new customers per month).
GROWTH INDICATOR
Top performing companies acquire new customers
at 2x the rate of other ecommerce companies.
The 2x advantage is maintained consistently throughout the early
years of top performing companies. This aggressive acquisition
accumulates into a massive competitive advantage — 143% more total
customers by the end of year two.
SHARE

THE PROFILE OF TOP PERFORMERS | 15
GROWTH INDICATOR
Customers at top performing companies purchase an
average of seven times. Customers in the bottom three
quartiles purchase an average of three times.
3
7
Lifetime Number of Orders per Customer by Quartile
We mentioned earlier that the top performer’s rapid growth is likely a
result of product/market fit. It’s when we look at Q1 performance at the
customer level that this story starts to take shape.
The average lifetime number of orders per customers is two times
higher for top performing companies than the bottom three quartiles.
And top performing companies aren’t just amazing at acquiring
customers; they know how to keep them coming back. Whether this is
due to great products, clever marketing, or a combination of both, the
results speak for themselves.
SHARE

THE PROFILE OF TOP PERFORMERS | 16
Average Order Value by Quartile
Customers of top performing companies place a greater number of
orders over their lifetime, but that’s not all. The orders are also a higher
value. Top performing companies have an average order value (AOV)
of $94. Companies in the lowest performing quartile have an AOV of
only $60.
Another interesting pattern emerged around AOV. As they grow, top
performing companies maintain an AOV that consistently stays very
close to $100. Companies in the bottom two quartiles show much
greater fluctuation. While AOV for Q3 companies is $63 at the end of
year one, that number dips below $50 at the start of year three.
This dip is likely the result of an increased reliance on discounting in
the face of poor performance. GROWTH INDICATOR
Top performing ecommerce companies
have an Average Order Value of $94. $100AOV
SHARE

CLV by Quartile
We now know that top performing companies have higher average
order values and more orders per customer. Together these numbers
form the gold standard of ecommerce performance — high customer
lifetime value (CLV).
Top performing ecommerce companies have a customer lifetime
value that is 5 times higher than the next best quartile. On average,
a customer at a top performing company is worth $3,600, whereas
customers at bottom-performing companies are worth between $460-
770.
This difference does not come from more marketing dollars alone. Top
performing companies are great at acquiring new customers, but they
also have a product good enough to keep customers coming back
again and again.
5xHigher
THE PROFILE OF TOP PERFORMERS | 17
SHARE

THE PROFILE OF TOP PERFORMERS | 18
New vs. Repeat Revenue by Quartile
Acquiring new customers is increasingly expensive. Getting existing
customers to purchase again is cheap — costing between ⅓ and ⅛ as
much. Companies that excel at turning one-time buyers into repeat
purchasers have more profitable, sustainable businesses, with higher
lifetime values.
We already saw that the fastest-growing companies have higher AOV,
repeat purchases, and CLV, but we wanted to see how the mix of new
vs. repeat revenue changes as a business matures. Take a look at how
this plays out across all quartiles:
This looks pretty much as you’d expect. In the beginning of a
company’s life, almost all of its revenue is coming from new customers,
and that gradually converges over time. By two years in, about 50% of
revenue is from new customers and 50% is from repeat customers.
50/50New vs repeat revenue
THE PROFILE OF TOP PERFORMERS | 19
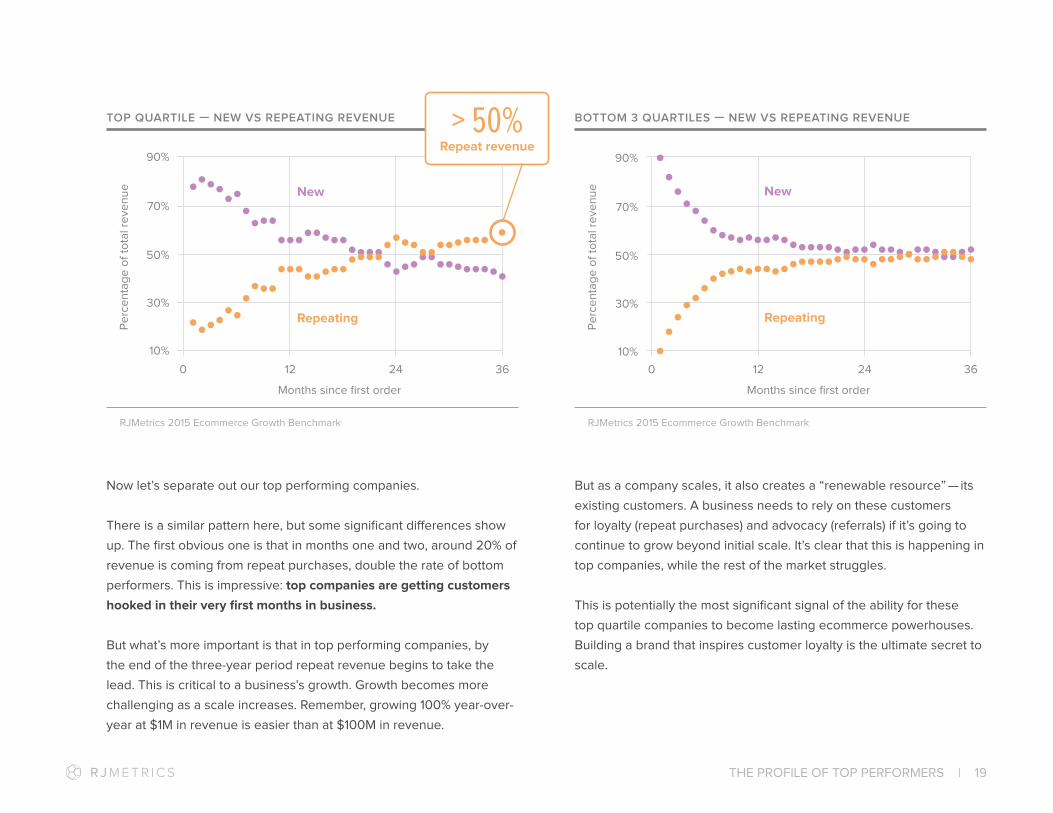
Now let’s separate out our top performing companies.
There is a similar pattern here, but some significant differences show
up. The first obvious one is that in months one and two, around 20% of
revenue is coming from repeat purchases, double the rate of bottom
performers. This is impressive: top companies are getting customers
hooked in their very first months in business.
But what’s more important is that in top performing companies, by
the end of the three-year period repeat revenue begins to take the
lead. This is critical to a business’s growth. Growth becomes more
challenging as a scale increases. Remember, growing 100% year-over-
year at $1M in revenue is easier than at $100M in revenue.
But as a company scales, it also creates a “renewable resource” — its
existing customers. A business needs to rely on these customers
for loyalty (repeat purchases) and advocacy (referrals) if it’s going to
continue to grow beyond initial scale. It’s clear that this is happening in
top companies, while the rest of the market struggles.
This is potentially the most significant signal of the ability for these
top quartile companies to become lasting ecommerce powerhouses.
Building a brand that inspires customer loyalty is the ultimate secret to
scale.
> 50%Repeat revenue

The top quartile of new companies does almost $2M in
revenue in its first six months as an operating business.
This growth is being driven by fundamentals: massive
venture investment in ecommerce, increasing platform
maturity, growth in scalable marketing channels, and
growth in the underlying market. The combination of
these mean that there has never been a better time to
start and grow an ecommerce store.
But it sets a high bar for retailers. In this competitive
environment, it is increasingly hard to stand out.
Acquisition channels are crowded and inventory is bid up.
Inboxes are crowded. Competitors saturate the market
with discounts.
In our exploration of ecommerce growth, we’ve seen
that there is a class of companies who are head and
shoulders above the rest. These companies acquire more
customers, faster. They have higher repeat purchase
rates, higher average order values, and higher customer
lifetime values.
These companies are simply executing better than their
peers. They have better products and they bring them to
market more successfully. Their customers love them and
keep coming back for more.
Conclusion
The ecommerce landscape is changing quickly. New ecommerce
companies are born every day, and many of their stars burn bright.
CONCLUSION | 20

How do you measure up?
If you’d like to understand how you compare on
these key metrics, we’d be glad to help.
In less than a week, we can build you an online
dashboard with all the insights you need to
optimize your ecommerce business.
Sign up for a free demo today.
rjmetrics.com [email protected] 877-684-1394