what powers the brightest supernovae?ccpp.nyu.edu/eventpdf/E_rPtb8hq61V.pdf · what powers the...
53
what powers the brightest supernovae?
Transcript of what powers the brightest supernovae?ccpp.nyu.edu/eventpdf/E_rPtb8hq61V.pdf · what powers the...
what powers the brightest supernovae?
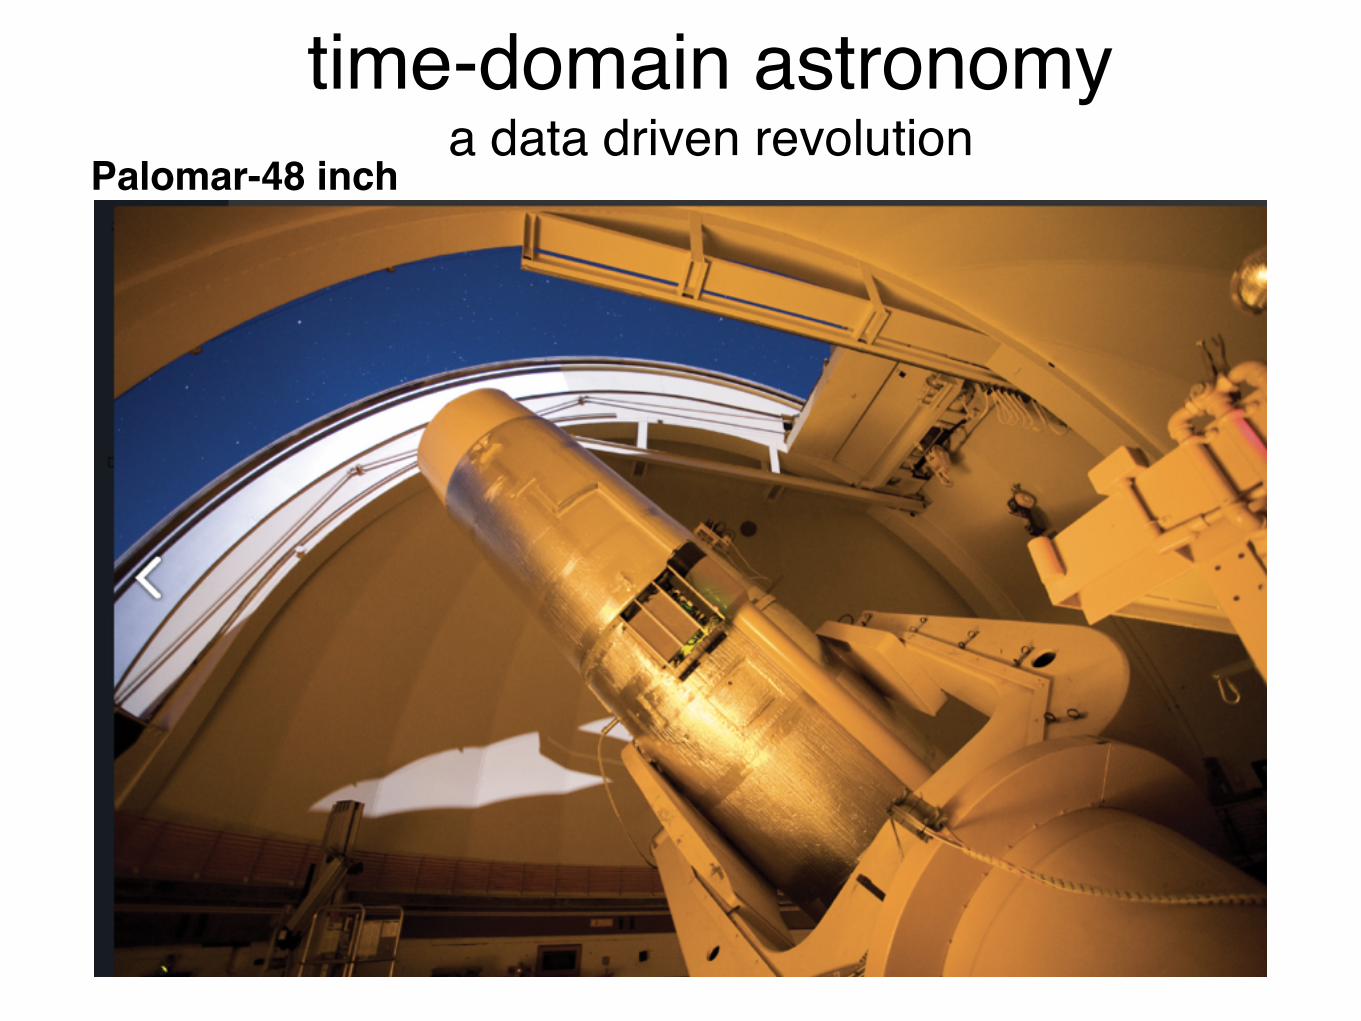
time-domain astronomya data driven revolution
Palomar-48 inch
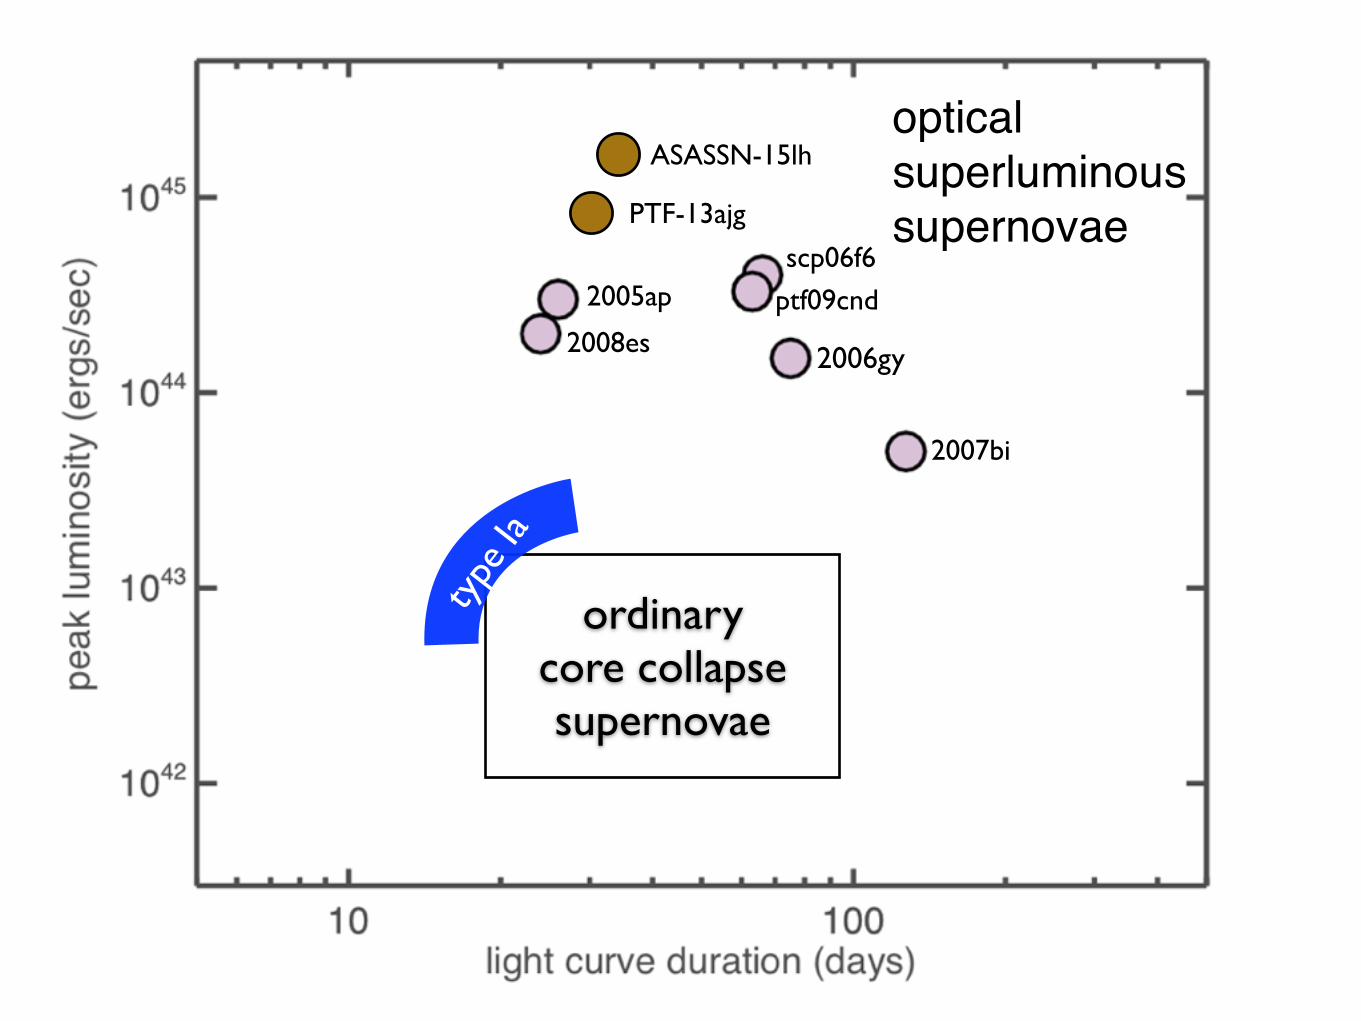
2006gy
2007bi
2005ap
2008es
ptf09cnd
scp06f6
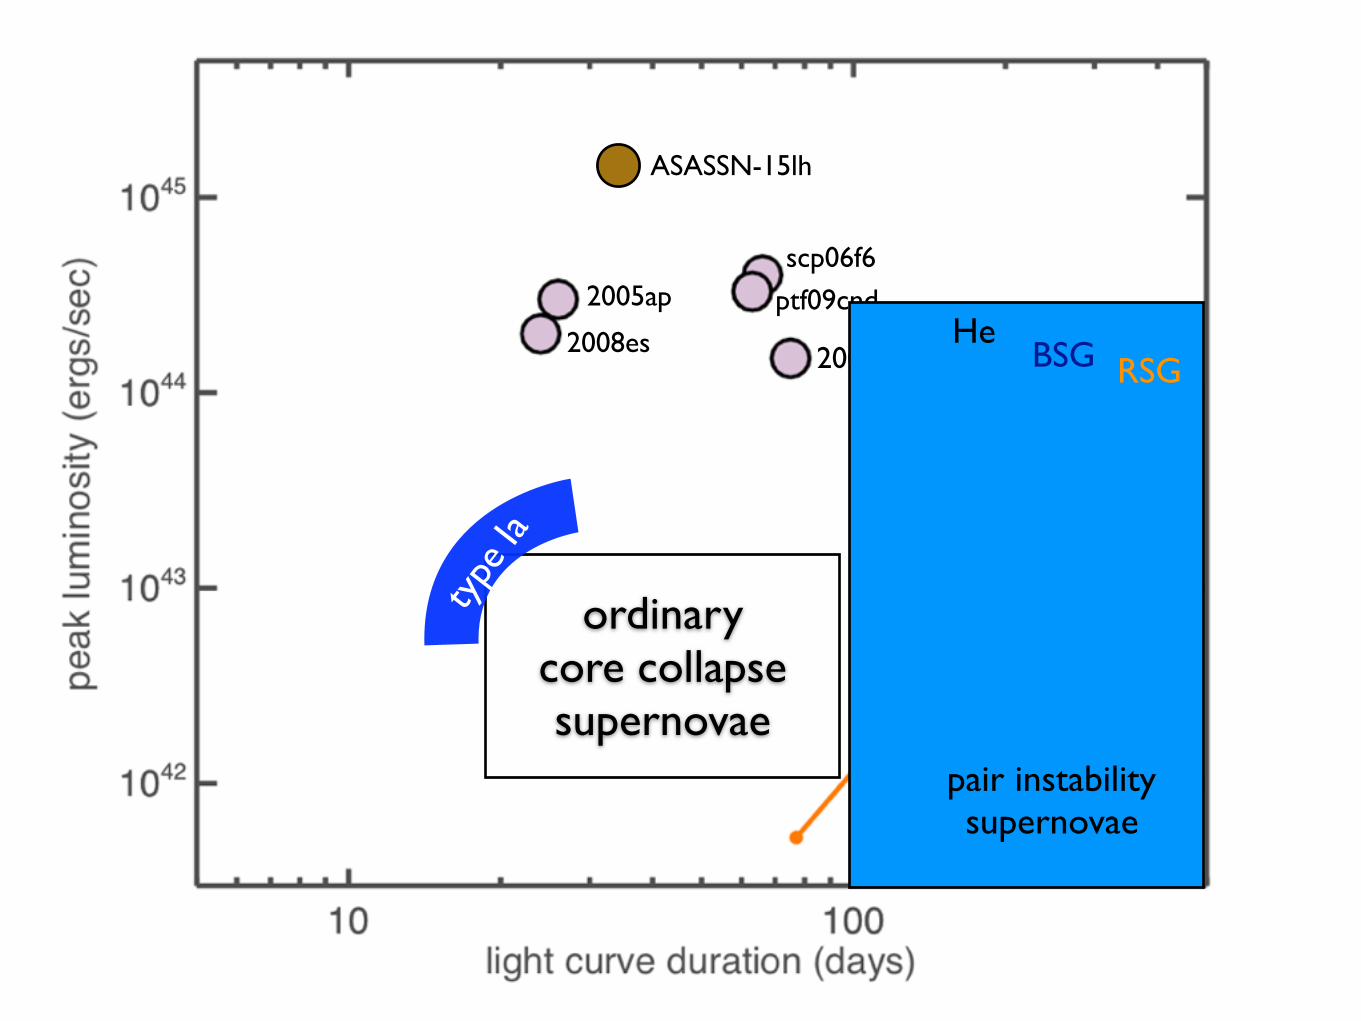
ordinarycore collapsesupernovae
type
Ia
ASASSN-15lh
PTF-13ajg
opticalsuperluminoussupernovae

ultra-long duration gamma-ray burstslevan et al 2014
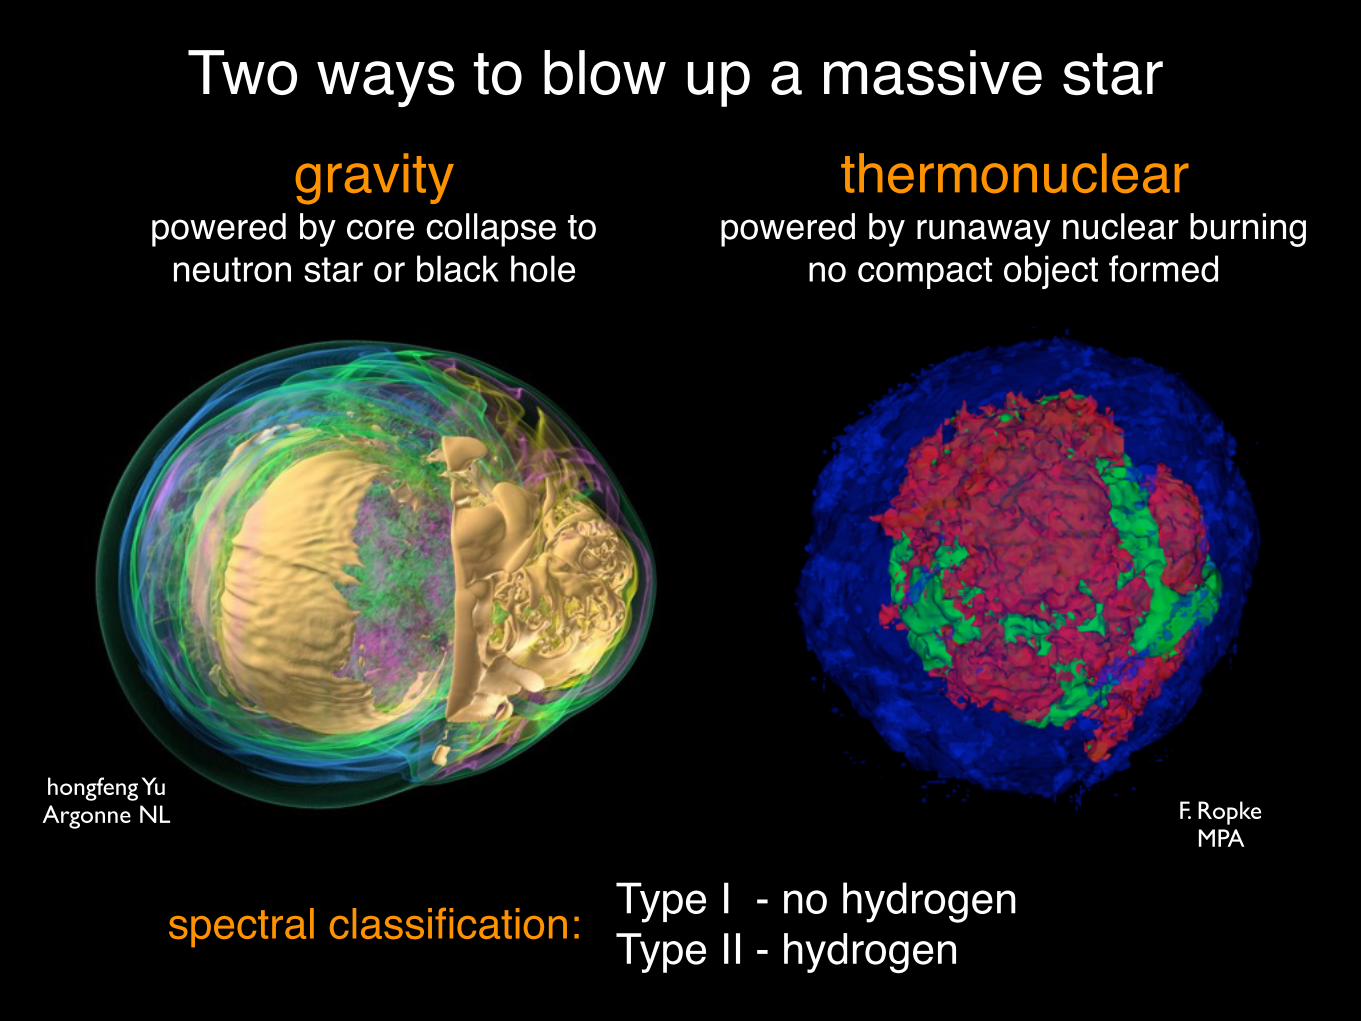
gravitypowered by core collapse to
neutron star or black hole
thermonuclearpowered by runaway nuclear burning
no compact object formed
Type I - no hydrogenType II - hydrogenspectral classification:
hongfeng YuArgonne NL F. Ropke
MPA
Two ways to blow up a massive star
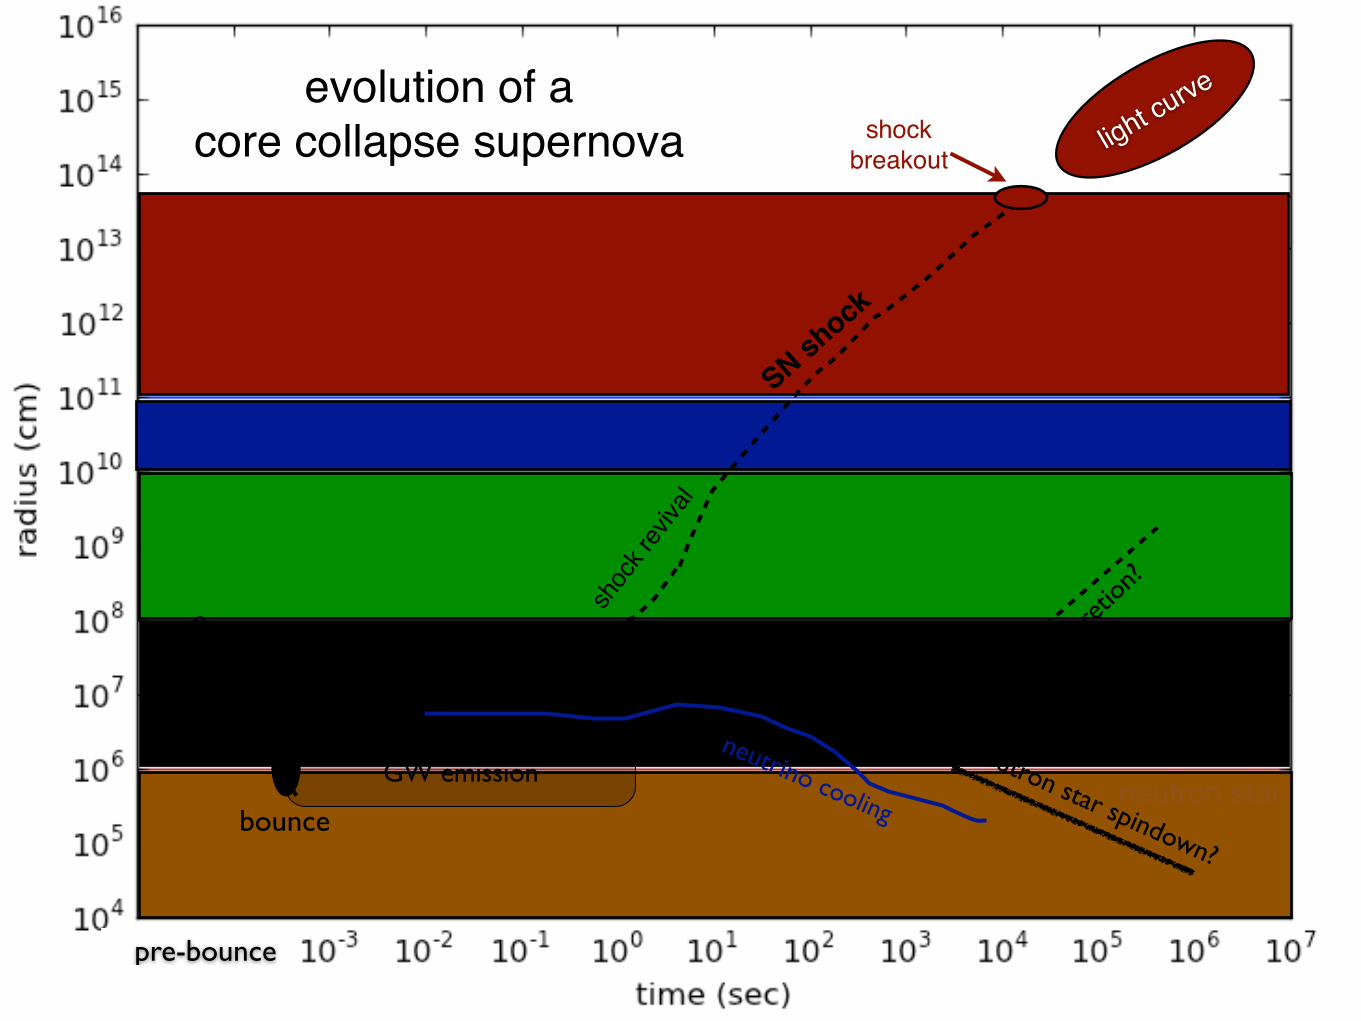
GW emission
H envelope
Fe core
neutron star
SN shock
light curve
neutrino cooling
core collapse
shock stall
shockbreakout
He core
C/O core
bounce
pre-bounce
evolution of acore collapse supernova
fallba
ck ac
cretio
n?sh
ock r
eviva
l
neutron star spindown?
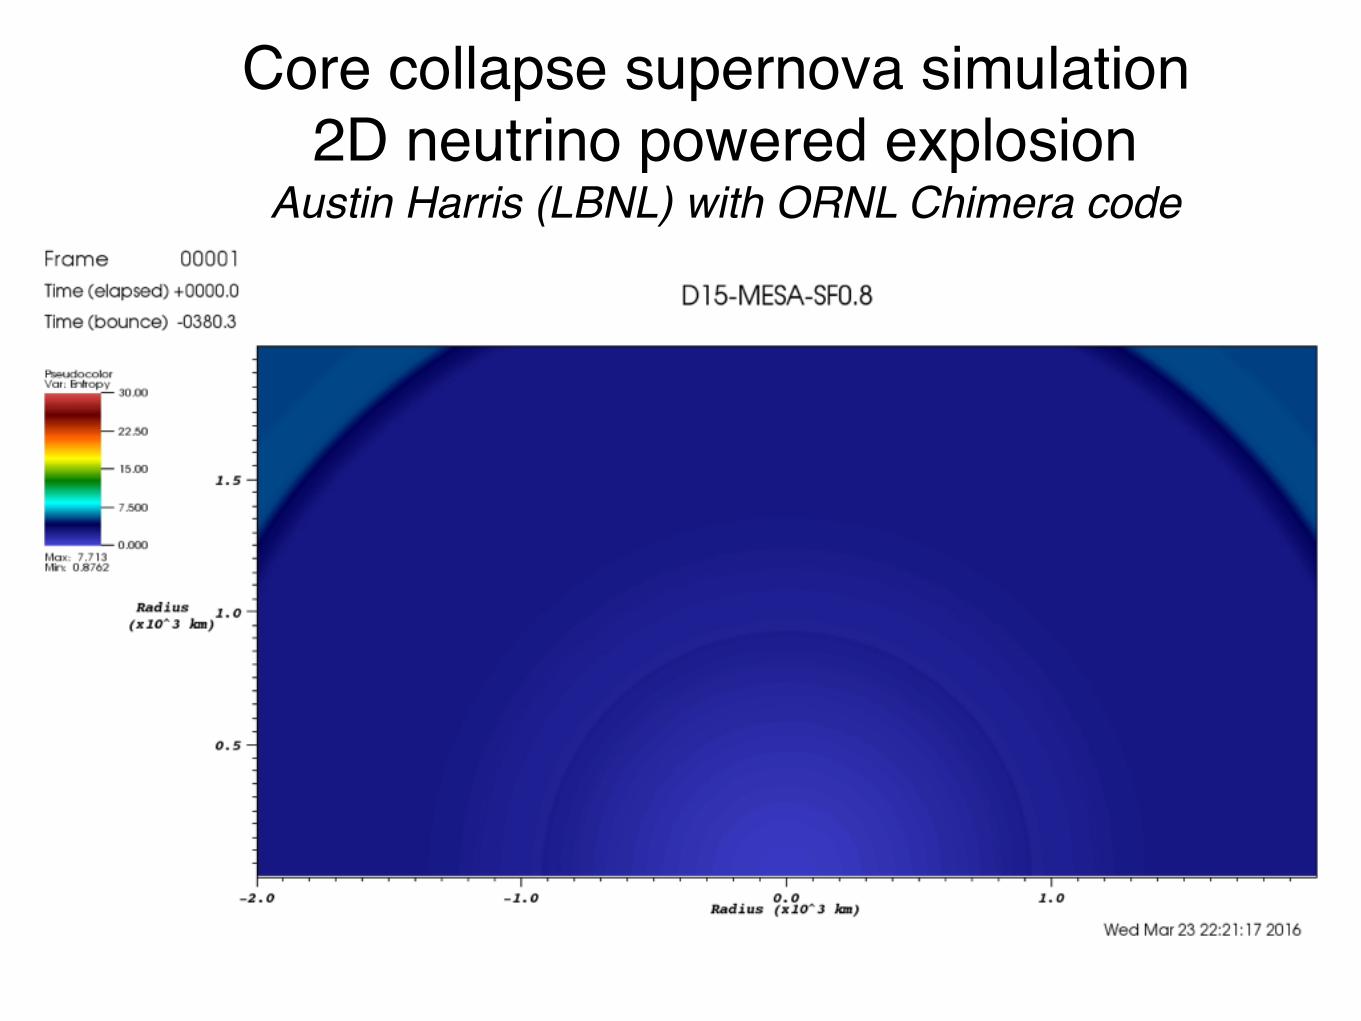
Core collapse supernova simulation2D neutrino powered explosion
Austin Harris (LBNL) with ORNL Chimera code
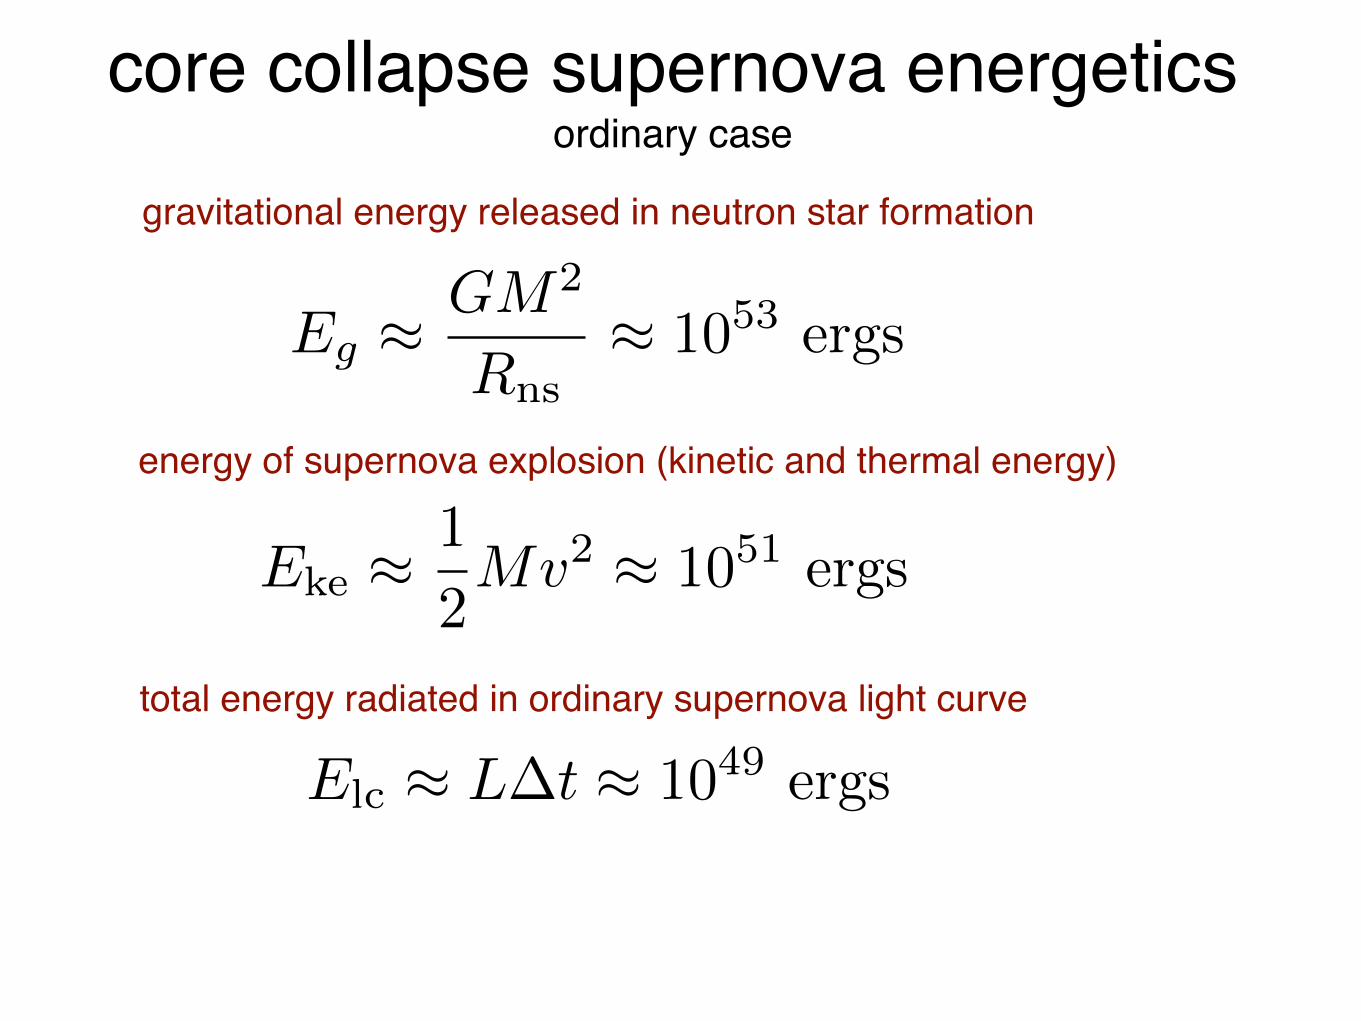
core collapse supernova energeticsordinary case
Eg ⇡ GM2
Rns
⇡ 1053 ergs
Lni
⇡ Mni
✏ni
tni
e�td/tni
M ⇡ 10� 15 M�
L ⇡ 1042 � 1043 ergs s�1
td
⇡ 50� 150 days
Esn
⇡ 1� 10 B
R? ⇡ 1013 cm
Eth
(t) = E0
R(t)
R0
��1
Lsn
⇡ Esn
td
R
sh
Rsn
�⇠ 1045 ergs s�1
R
sh
104 R�
�
Rsh
⇡ 104 R� ⇡ 1015 cm
tsh
= Rsh
/vsh
= 2 years
100 km s�1
vsh
�
Lsn
⇡ Esn
td
R?
Rsn
�⇠ 1045 ergs s�1
R?
104 R�
�
td
= ⌧
R
c
�= ⇢R
R
c
�⇠ M
Rc
td
⇠ M
(vt)c
td
⇠M
vc
�1/2
⇡ 29 days
✓M
M�
◆1/2✓
0.1
◆1/2✓ v
109
◆�1/2
Esn
⇡ 1
2Mv2 ⇡ 1051 ergs ⌘ 1 B
L = 4⇡R2�SB
T 4
1
gravitational energy released in neutron star formation
Eg ⇡ GM2
Rns
⇡ 1053 ergs
Eke
⇡ 1
2Mv2 ⇡ 1051 ergs
Lni
⇡ Mni
✏ni
tni
e�td/tni
M ⇡ 10� 15 M�
L ⇡ 1042 � 1043 ergs s�1
td
⇡ 50� 150 days
Esn
⇡ 1� 10 B
R? ⇡ 1013 cm
Eth
(t) = E0
R(t)
R0
��1
Lsn
⇡ Esn
td
R
sh
Rsn
�⇠ 1045 ergs s�1
R
sh
104 R�
�
Rsh
⇡ 104 R� ⇡ 1015 cm
tsh
= Rsh
/vsh
= 2 years
100 km s�1
vsh
�
Lsn
⇡ Esn
td
R?
Rsn
�⇠ 1045 ergs s�1
R?
104 R�
�
td
= ⌧
R
c
�= ⇢R
R
c
�⇠ M
Rc
td
⇠ M
(vt)c
td
⇠M
vc
�1/2
⇡ 29 days
✓M
M�
◆1/2✓
0.1
◆1/2✓ v
109
◆�1/2
Esn
⇡ 1
2Mv2 ⇡ 1051 ergs ⌘ 1 B
1
energy of supernova explosion (kinetic and thermal energy)Eg ⇡ GM2
Rns
⇡ 1053 ergs
Eke
⇡ 1
2Mv2 ⇡ 1051 ergs
Elc
⇡ L�t ⇡ 1049 ergs
Lni
⇡ Mni
✏ni
tni
e�td/tni
M ⇡ 10� 15 M�
L ⇡ 1042 � 1043 ergs s�1
td
⇡ 50� 150 days
Esn
⇡ 1� 10 B
R? ⇡ 1013 cm
Eth
(t) = E0
R(t)
R0
��1
Lsn
⇡ Esn
td
R
sh
Rsn
�⇠ 1045 ergs s�1
R
sh
104 R�
�
Rsh
⇡ 104 R� ⇡ 1015 cm
tsh
= Rsh
/vsh
= 2 years
100 km s�1
vsh
�
Lsn
⇡ Esn
td
R?
Rsn
�⇠ 1045 ergs s�1
R?
104 R�
�
td
= ⌧
R
c
�= ⇢R
R
c
�⇠ M
Rc
td
⇠ M
(vt)c
td
⇠M
vc
�1/2
⇡ 29 days
✓M
M�
◆1/2✓
0.1
◆1/2✓ v
109
◆�1/2
1
total energy radiated in ordinary supernova light curve
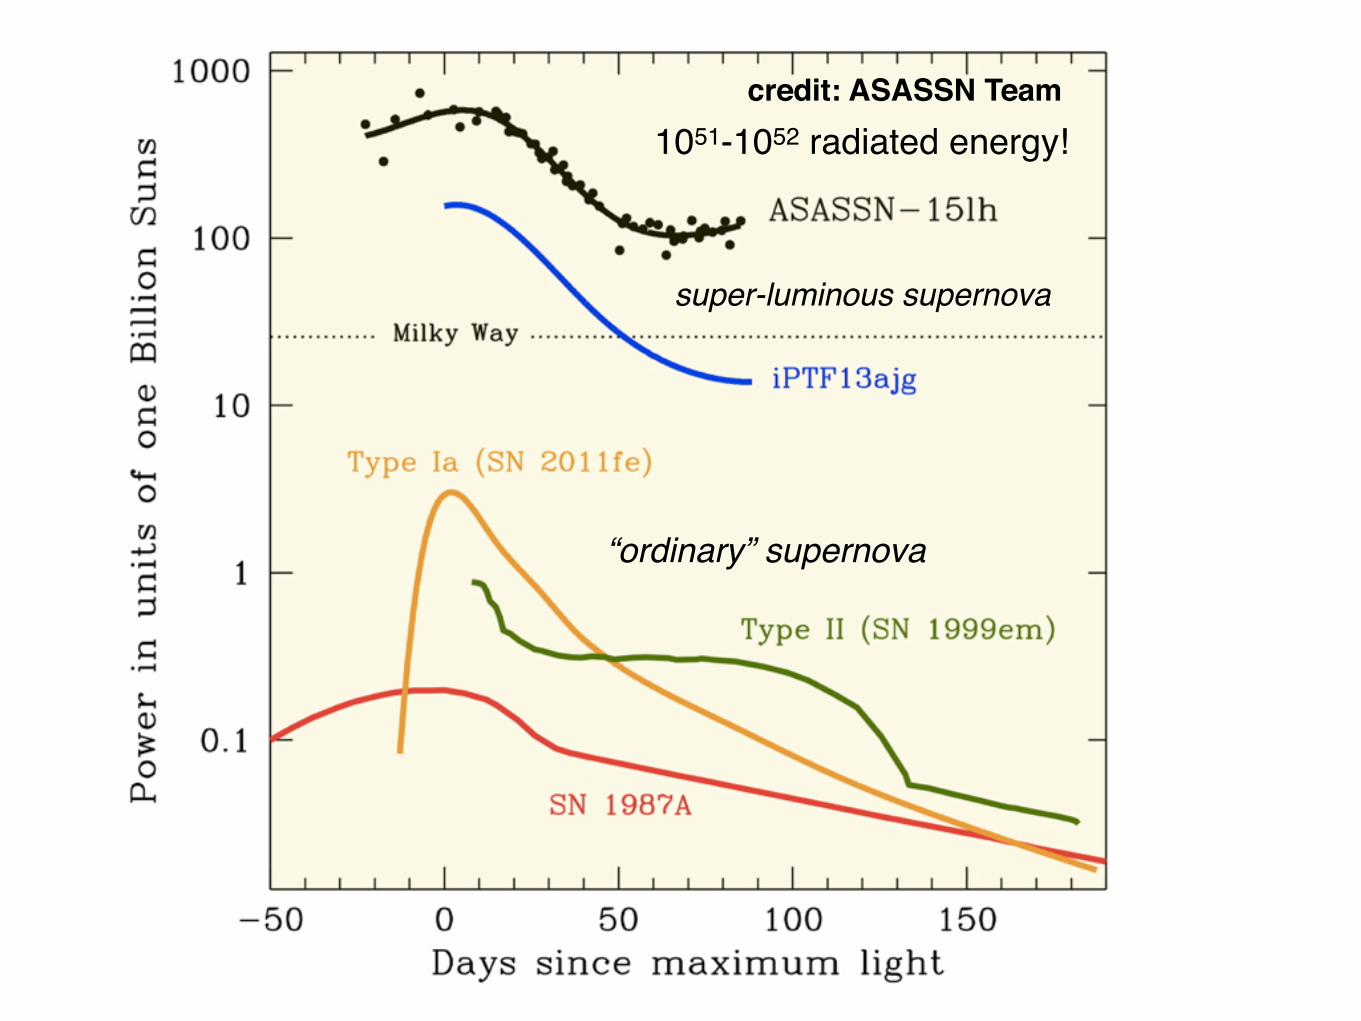
credit: ASASSN Team
“ordinary” supernova
super-luminous supernova
1051-1052 radiated energy!
quimby et al. 2010
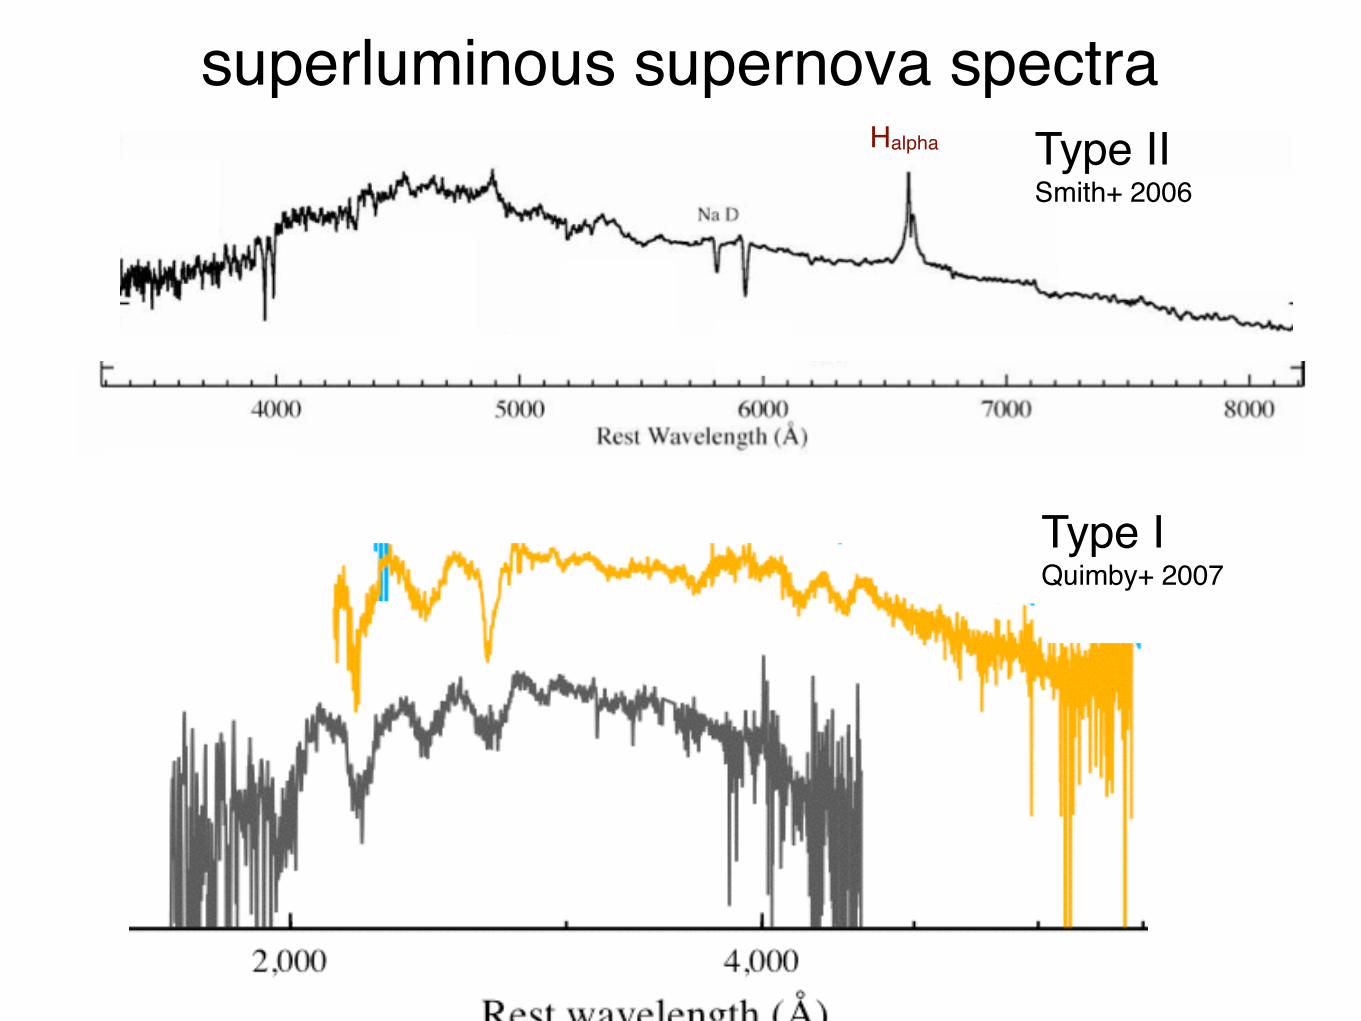
superluminous supernova spectraType IISmith+ 2006
Type IQuimby+ 2007
Halpha
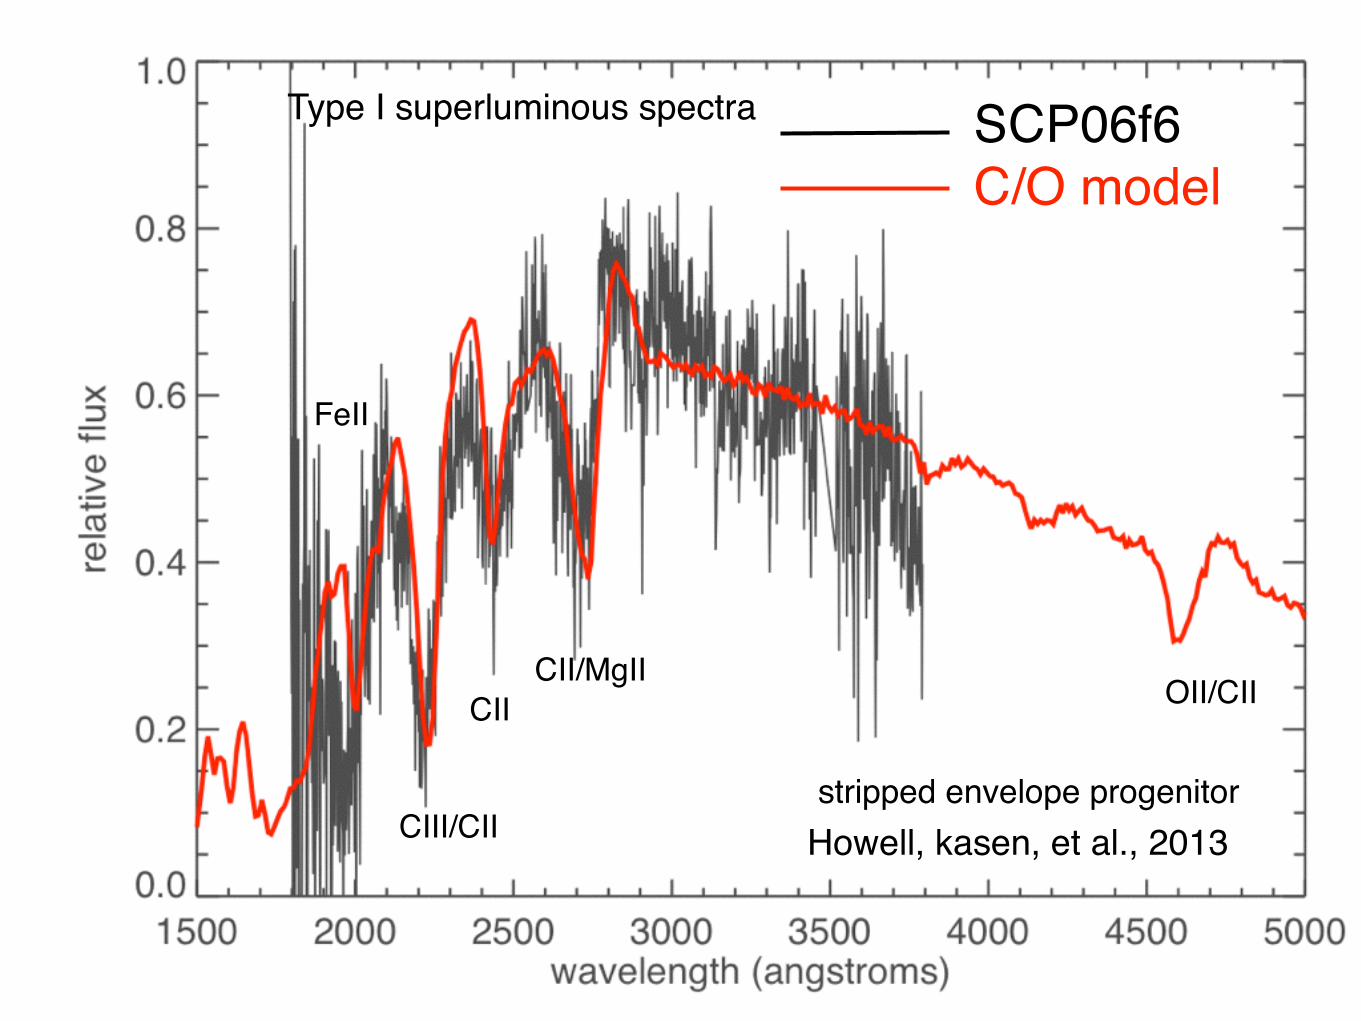
SCP06f6C/O model
stripped envelope progenitorHowell, kasen, et al., 2013
CII/MgII OII/CIICII
CIII/CII
FeII
Type I superluminous spectra

e+Z Z-1
ννΥ
radioactive decay
56Ni -> 56Co -> 56Fe
supernova light curve basics debris expands at v ~ 0.03c, cools by pdV work
at t ~ weeks-months
ρ ~ 10-13 g cm-3
translucentreheated to T ~ 5000-20000 K L >~ 109 Lsun
r ~ 1015 cm ~ 100 AU
engine?
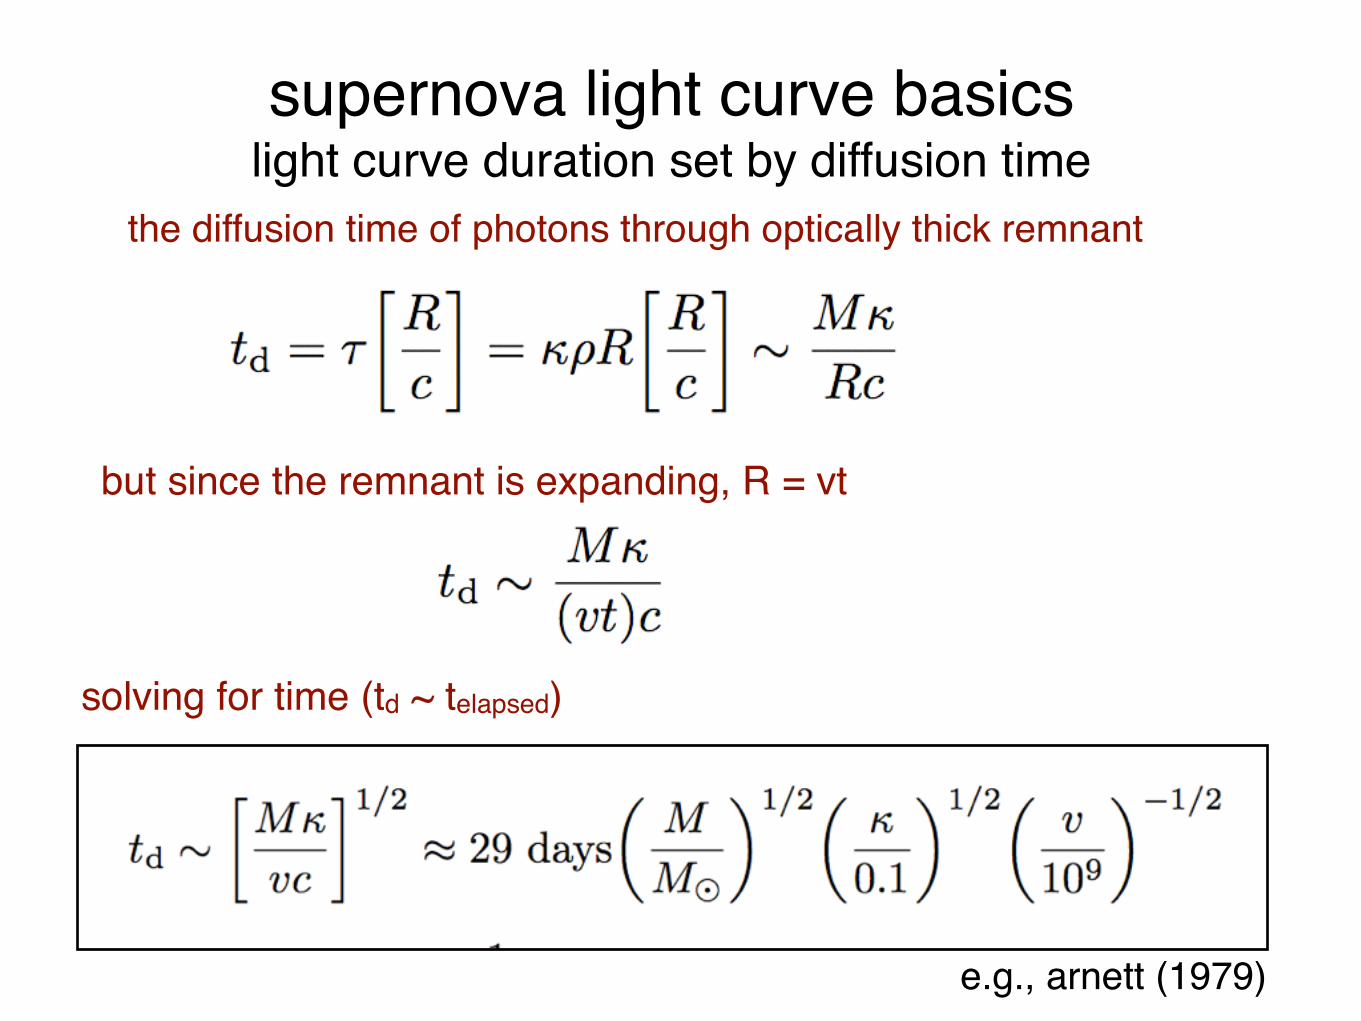
supernova light curve basicslight curve duration set by diffusion time
the diffusion time of photons through optically thick remnant
but since the remnant is expanding, R = vt
solving for time (td ~ telapsed)
e.g., arnett (1979)
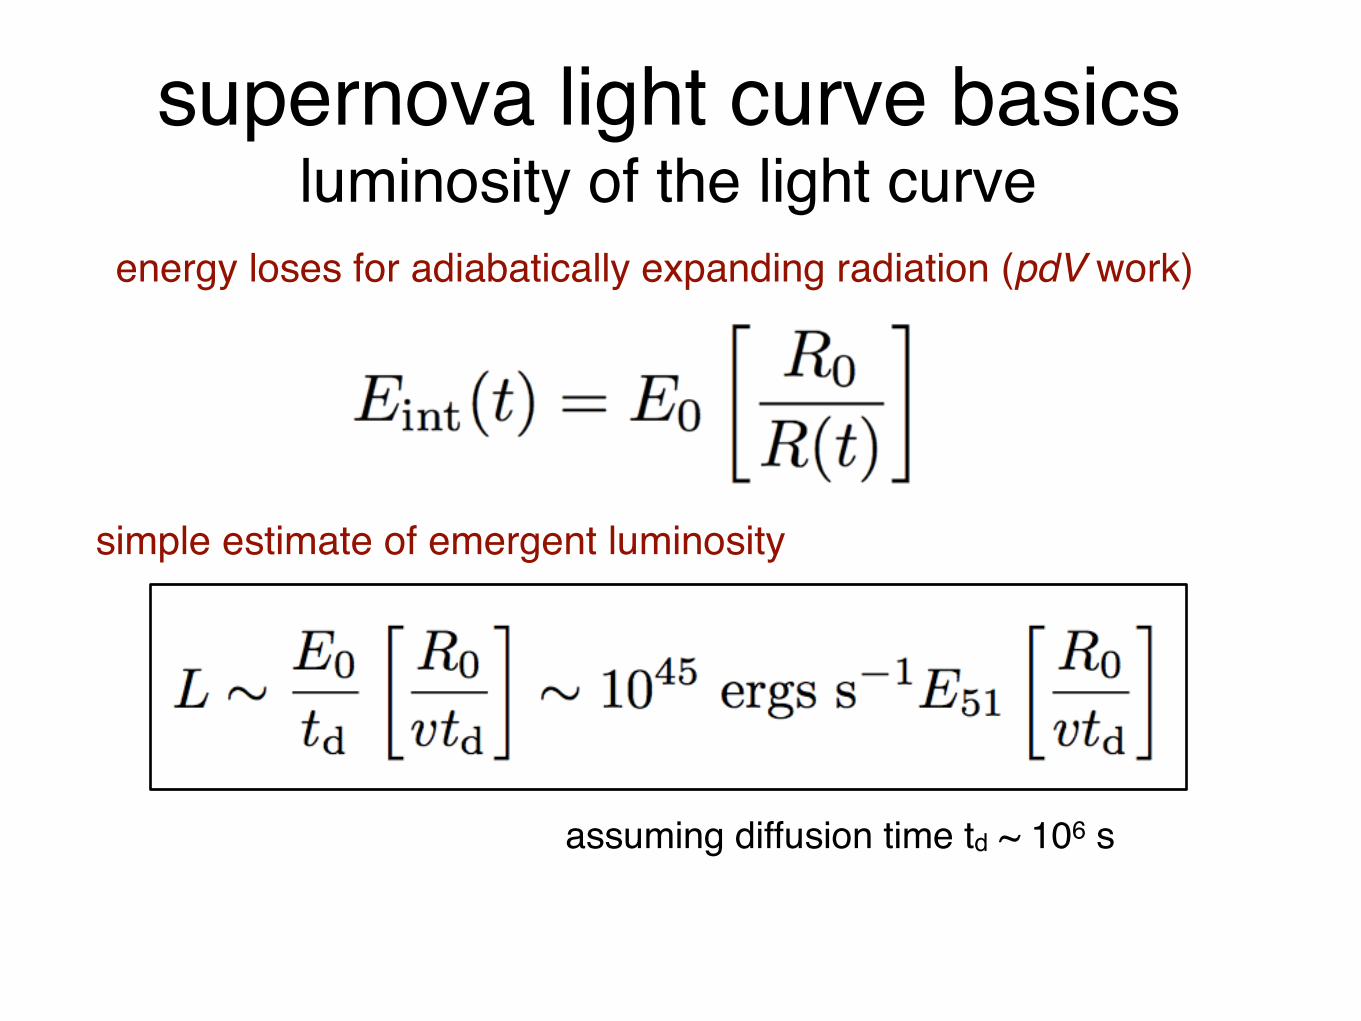
supernova light curve basicsluminosity of the light curve
energy loses for adiabatically expanding radiation (pdV work)
simple estimate of emergent luminosity
assuming diffusion time td ~ 106 s
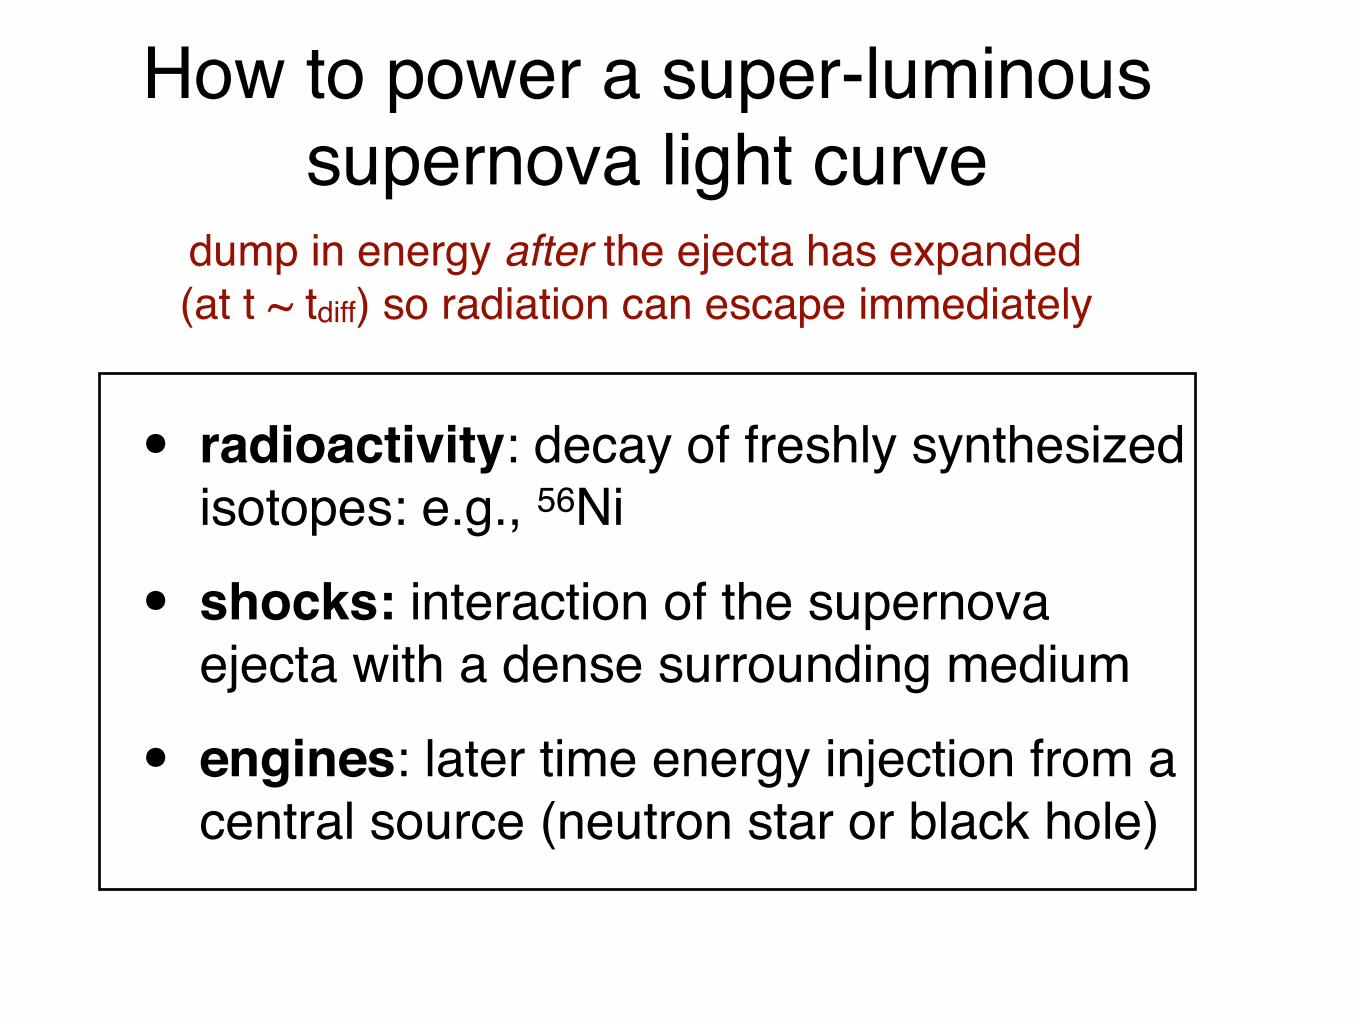
How to power a super-luminous supernova light curve
• radioactivity: decay of freshly synthesized isotopes: e.g., 56Ni
• shocks: interaction of the supernova ejecta with a dense surrounding medium
• engines: later time energy injection from a central source (neutron star or black hole)
dump in energy after the ejecta has expanded(at t ~ tdiff) so radiation can escape immediately
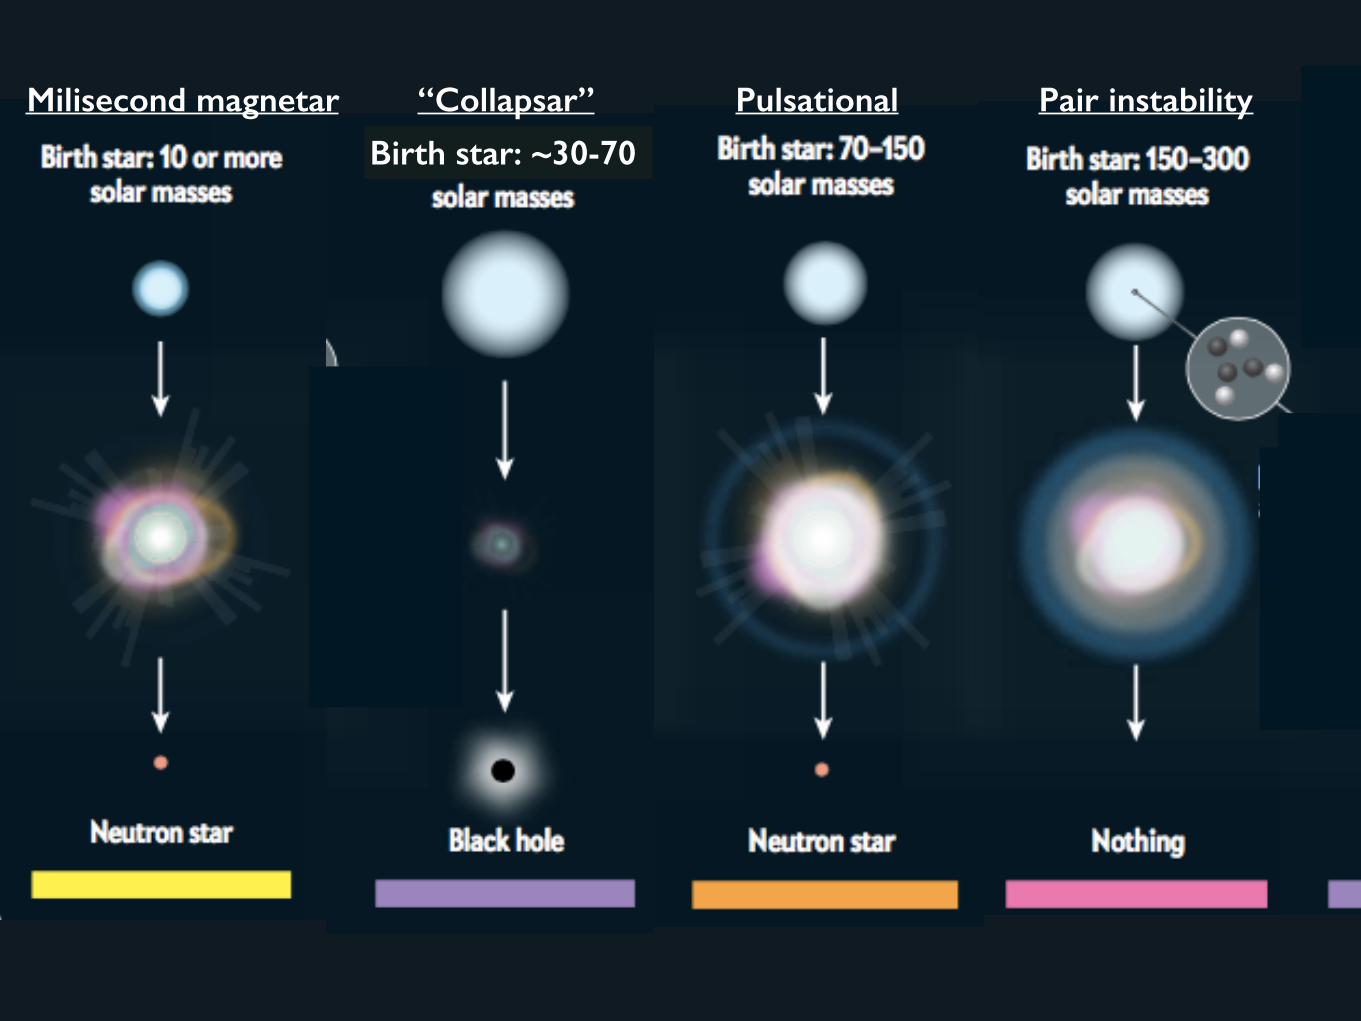
Birth star: ~30-70
Milisecond magnetar “Collapsar” Pulsational Pair instability
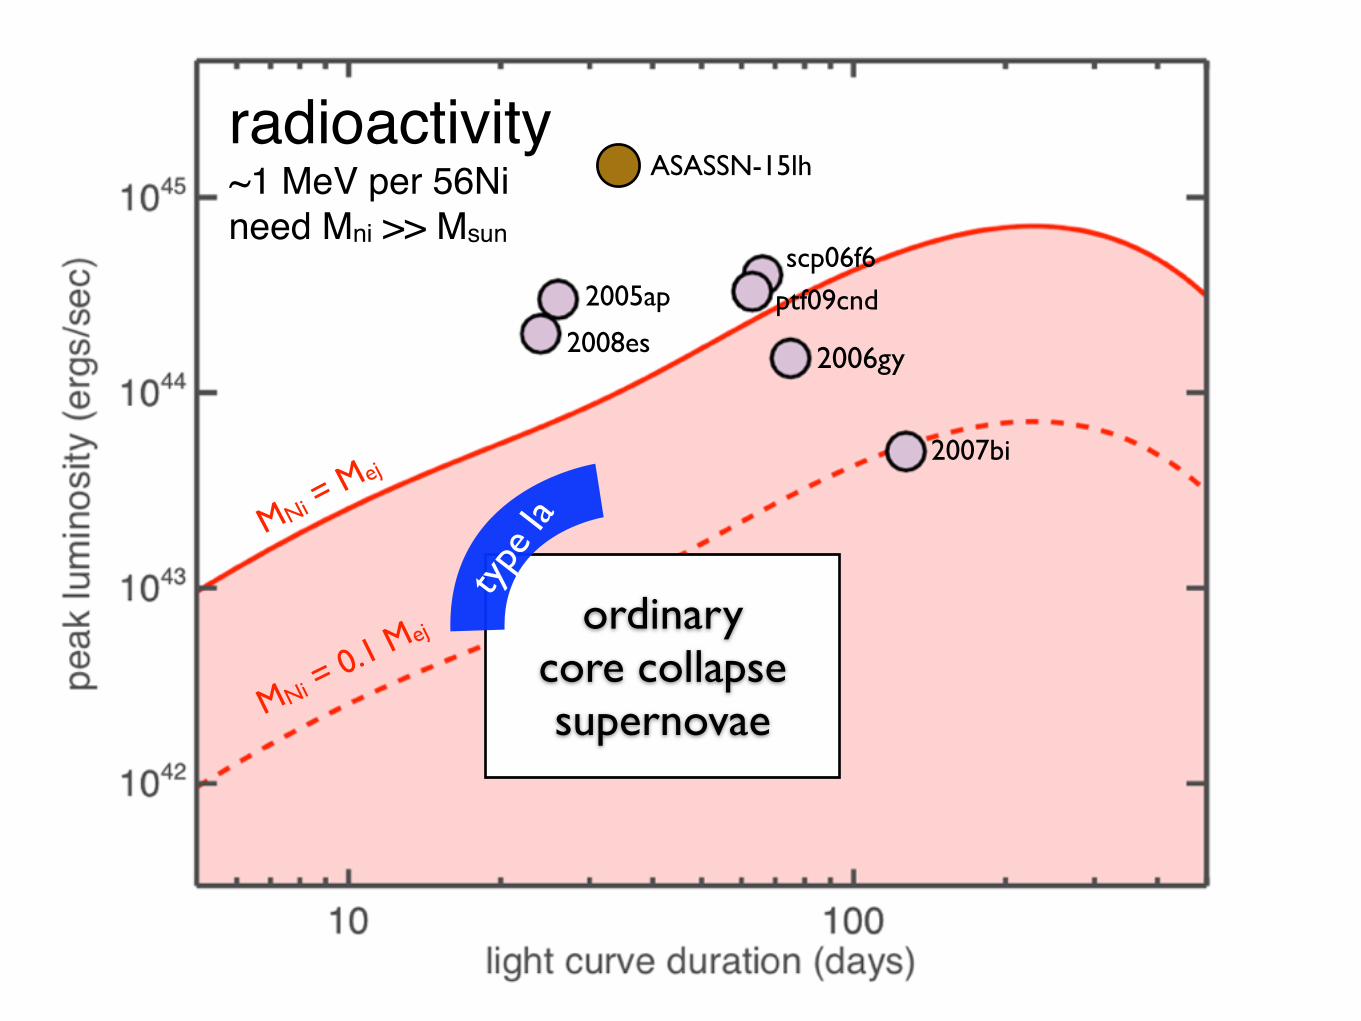
MNi = Mej
MNi = 0.1 Mej
2006gy
2007bi
2005ap
2008es
ptf09cnd
scp06f6
ordinarycore collapsesupernovae
ASASSN-15lhradioactivity~1 MeV per 56Nineed Mni >> Msun
type
Ia
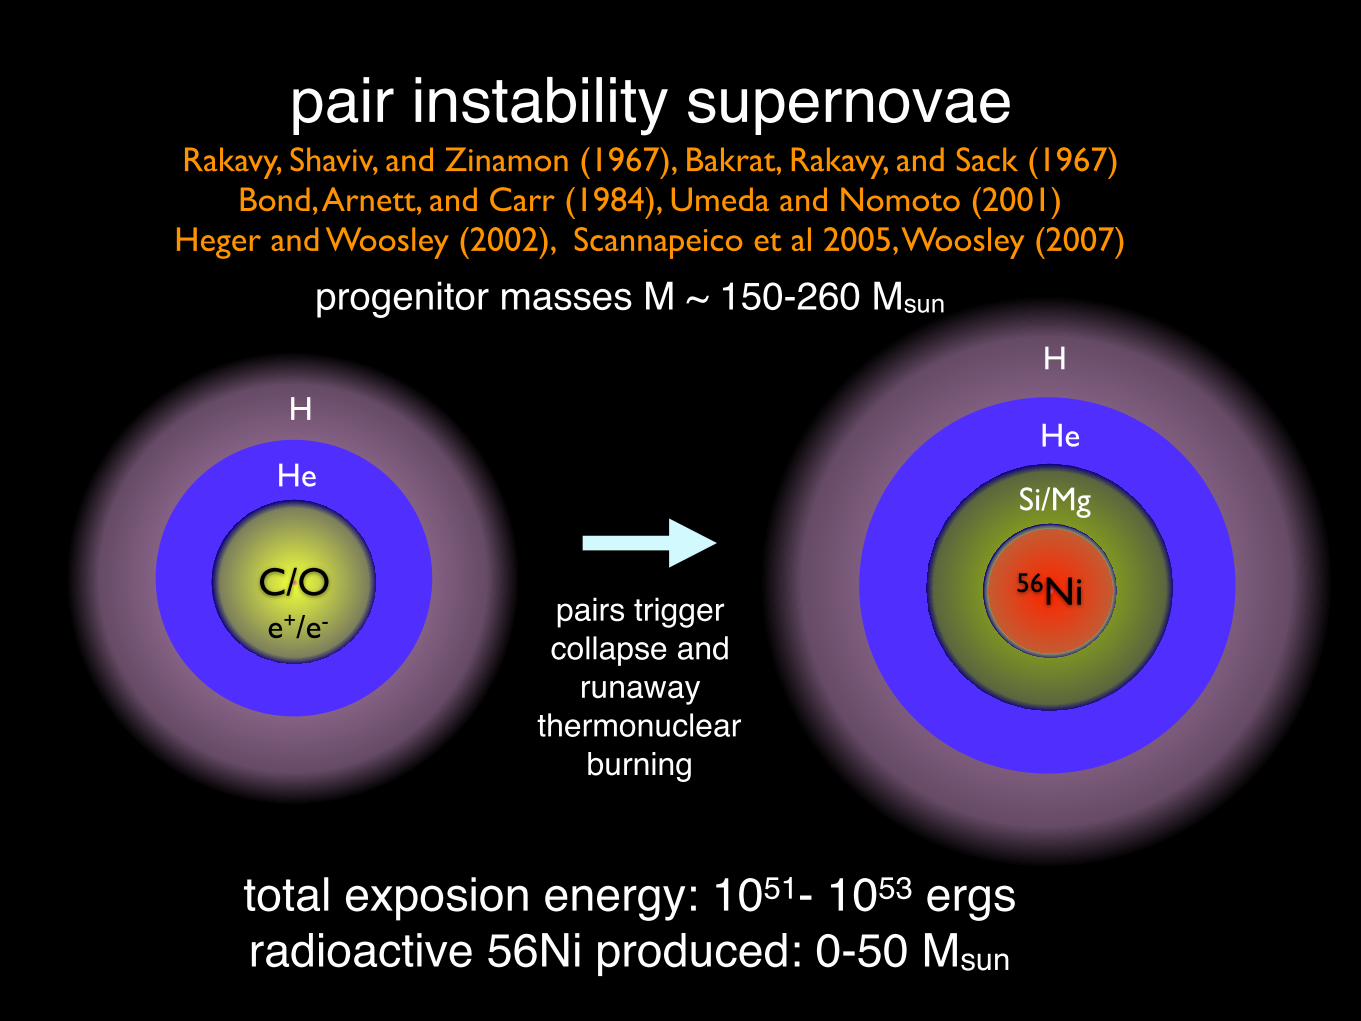
C/O
He
H
e+/e-
Si/O
Si/Mg
H
56Ni
He
pairs triggercollapse and
runaway thermonuclear
burning
pair instability supernovaeRakavy, Shaviv, and Zinamon (1967), Bakrat, Rakavy, and Sack (1967)
Bond, Arnett, and Carr (1984), Umeda and Nomoto (2001)Heger and Woosley (2002), Scannapeico et al 2005, Woosley (2007)
progenitor masses M ~ 150-260 Msun
total exposion energy: 1051- 1053 ergsradioactive 56Ni produced: 0-50 Msun
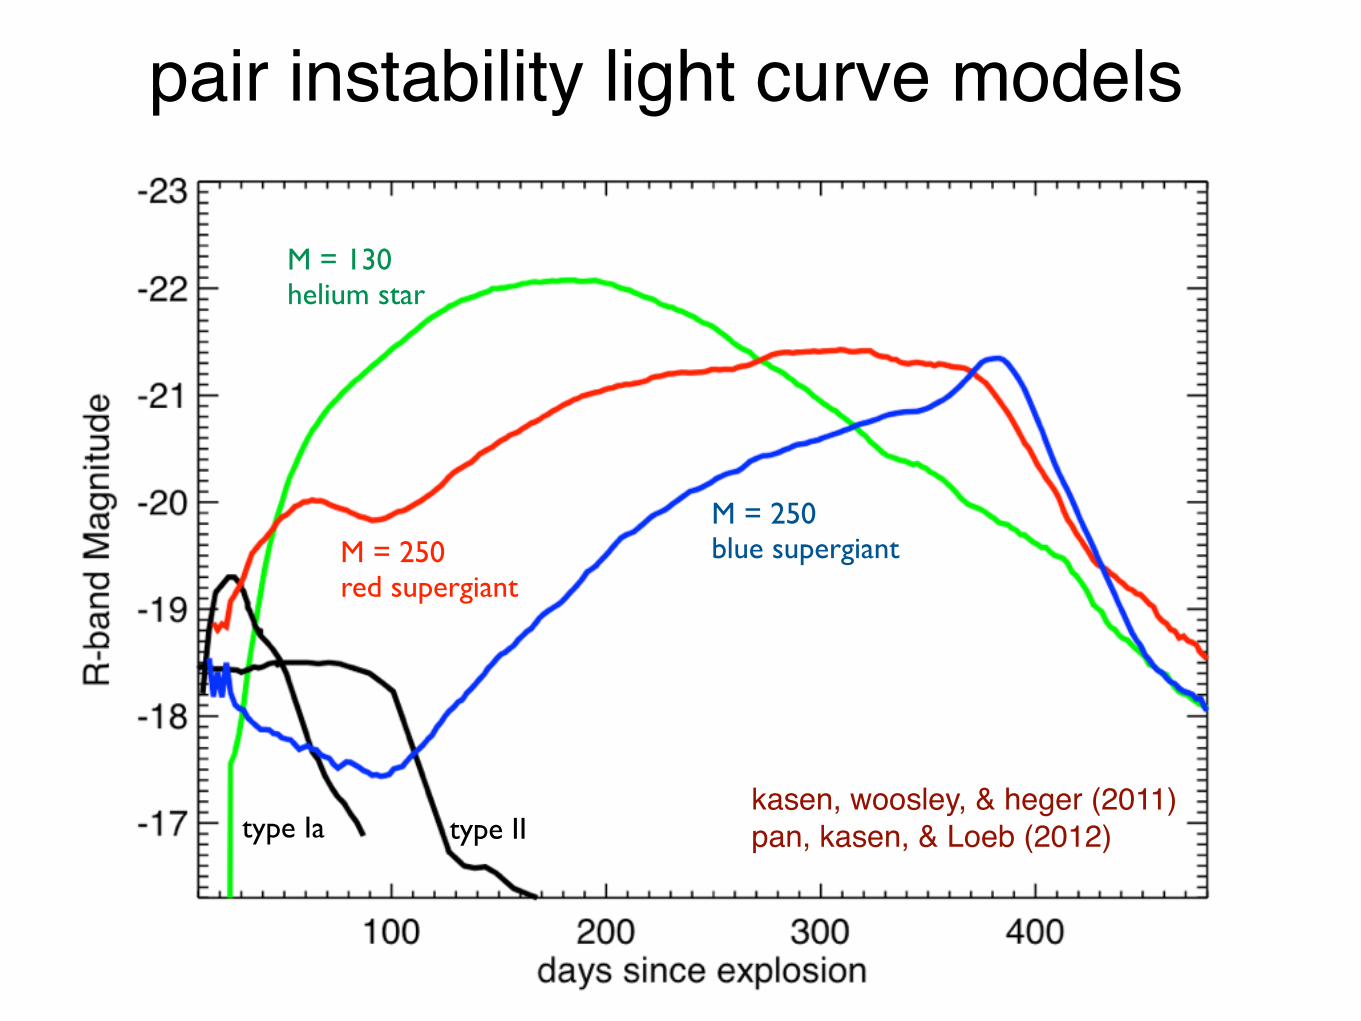
pair instability light curve models
M = 250 red supergiant
type Ia type II
M = 250 blue supergiant
M = 130 helium star
kasen, woosley, & heger (2011)pan, kasen, & Loeb (2012)
2006gy
2007bi
2004ap
2008es
ptf09cnd
scp06f6
ordinarycore collapsesupernovae
type
Ia
2006gy
2007bi
2005ap
2008es
ptf09cnd
scp06f6
pair instabilitysupernovae
HeBSG RSG
ASASSN-15lh
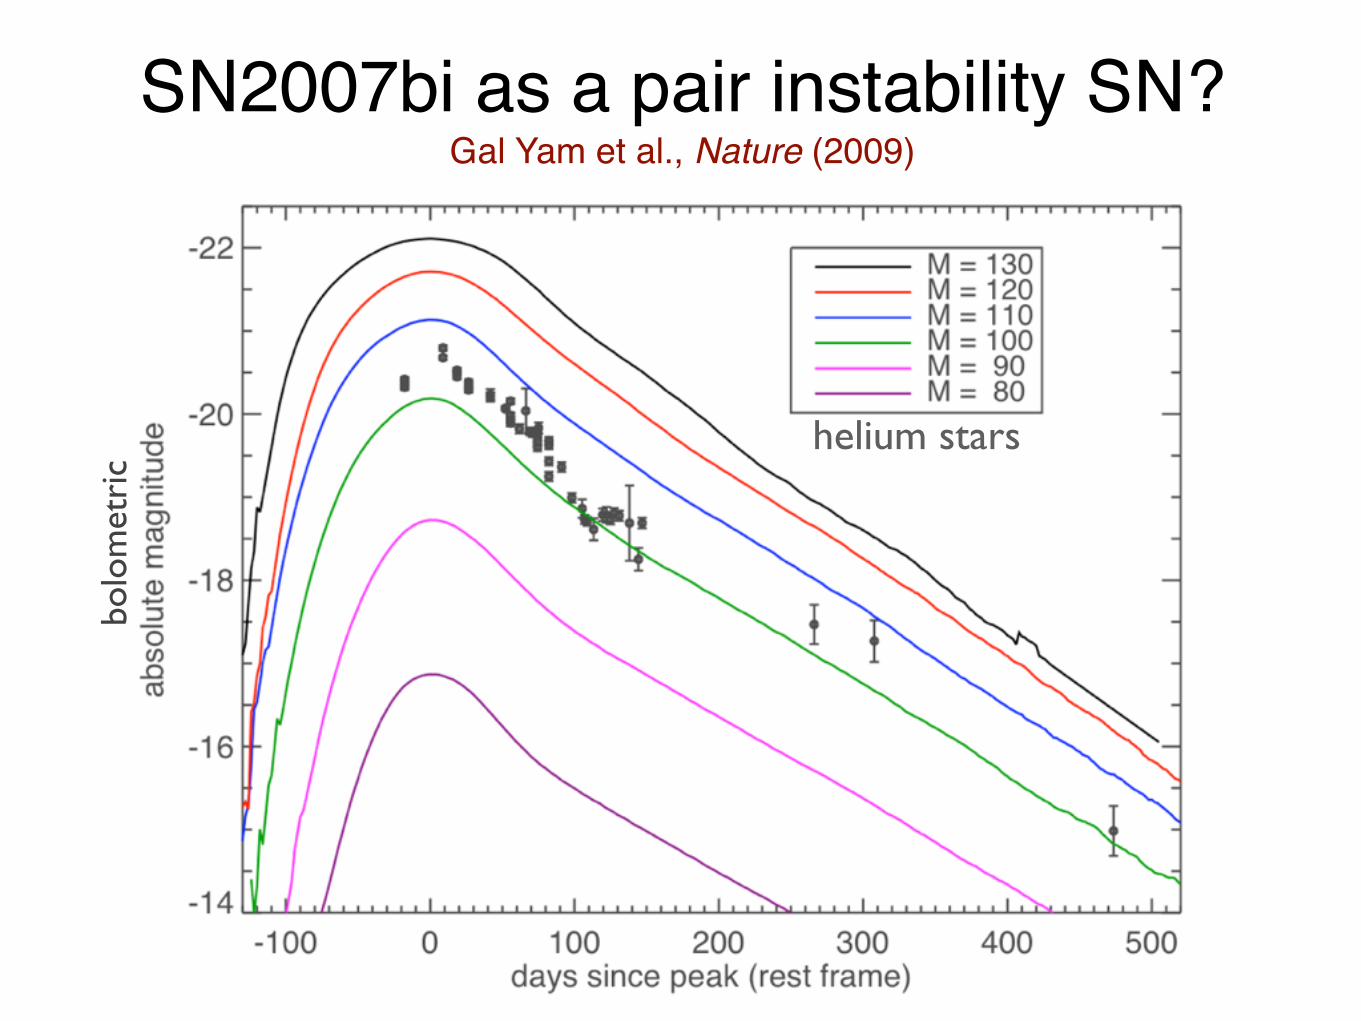
SN2007bi as a pair instability SN?Gal Yam et al., Nature (2009)
helium stars
bolo
met
ric
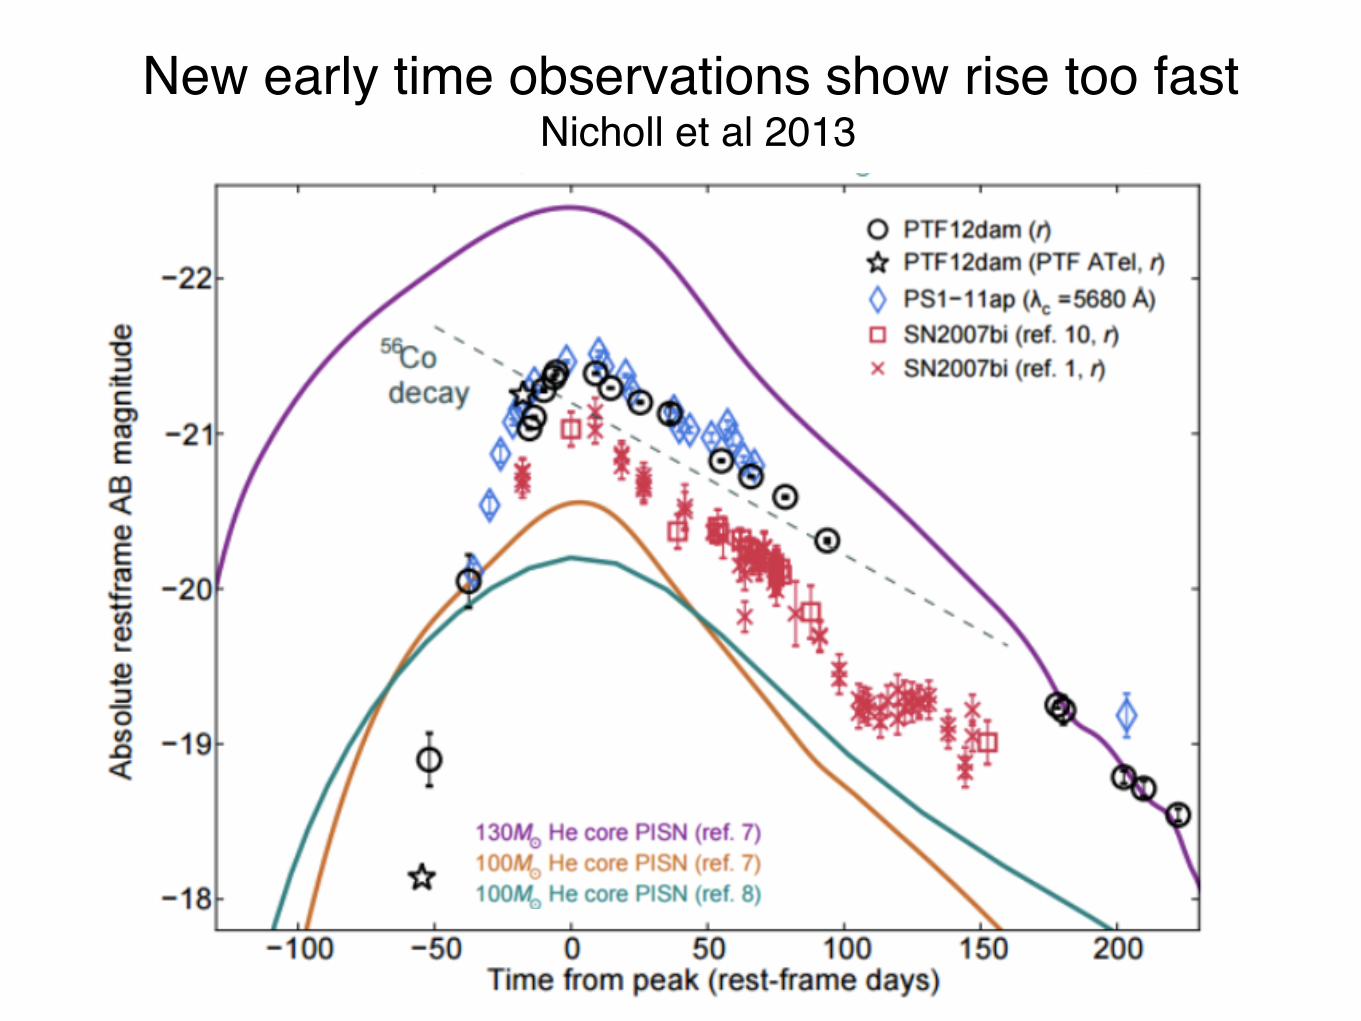
New early time observations show rise too fastNicholl et al 2013
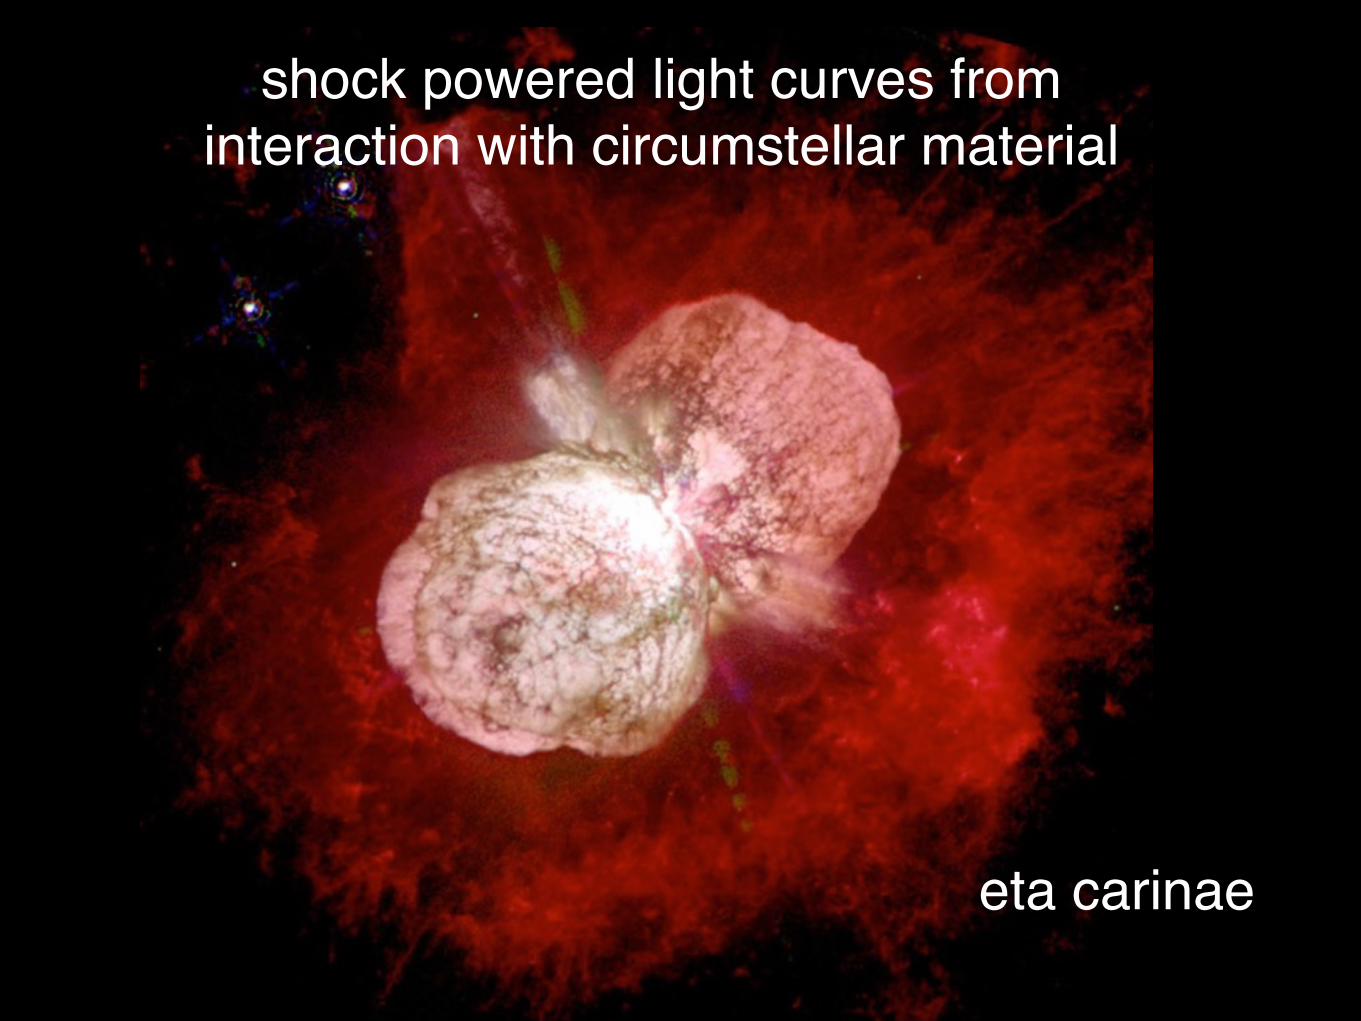
eta carinae
shock powered light curves frominteraction with circumstellar material
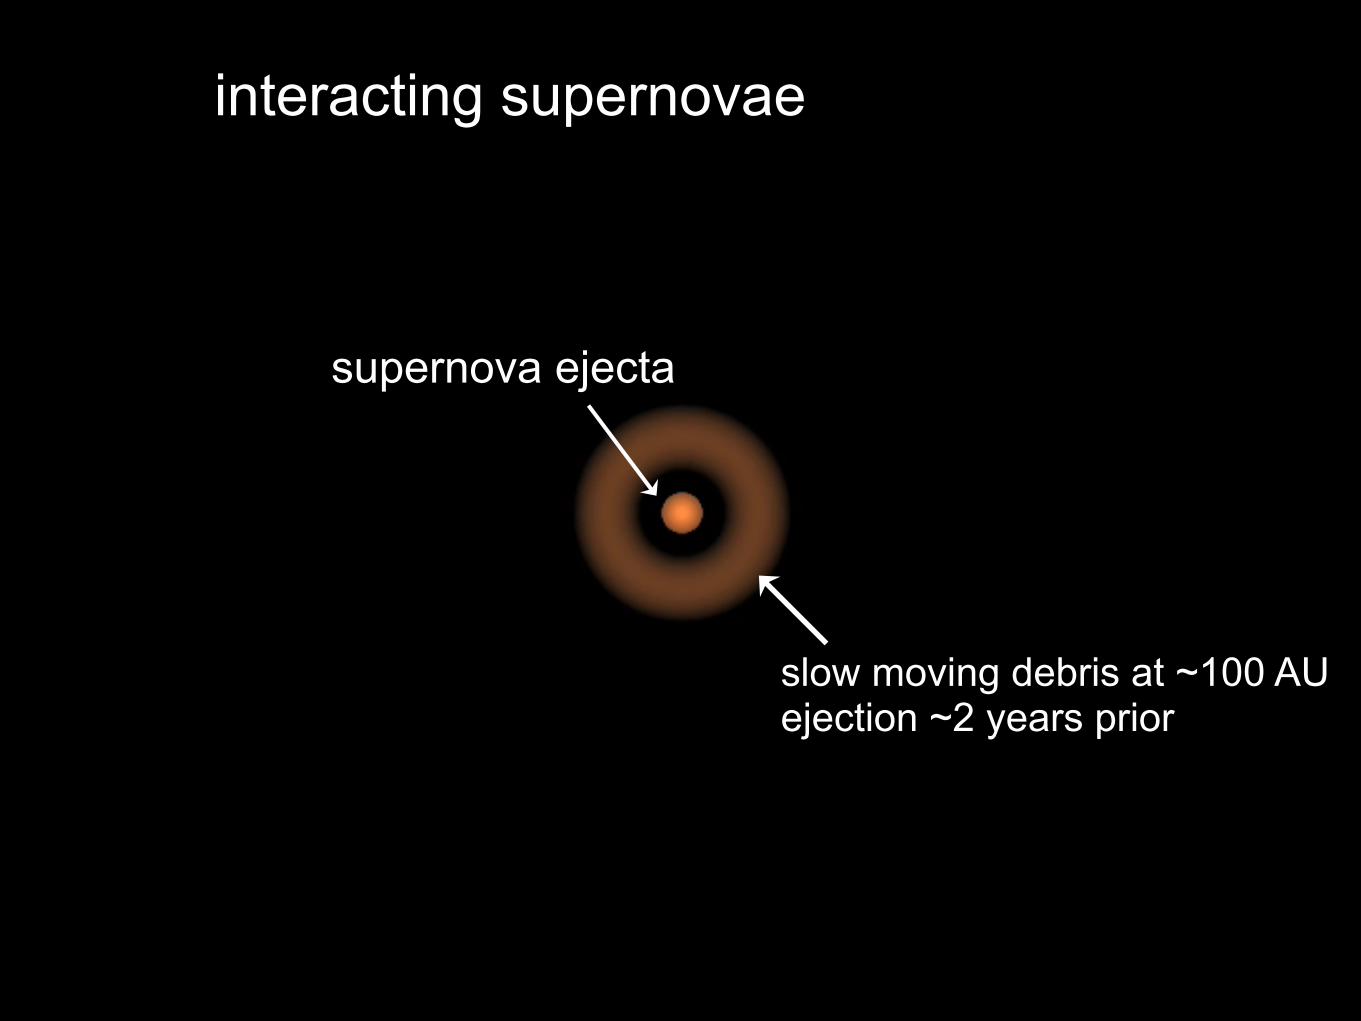
“tamped” supernova modelsinteracting supernovae
slow moving debris at ~100 AU ejection ~2 years prior
supernova ejecta
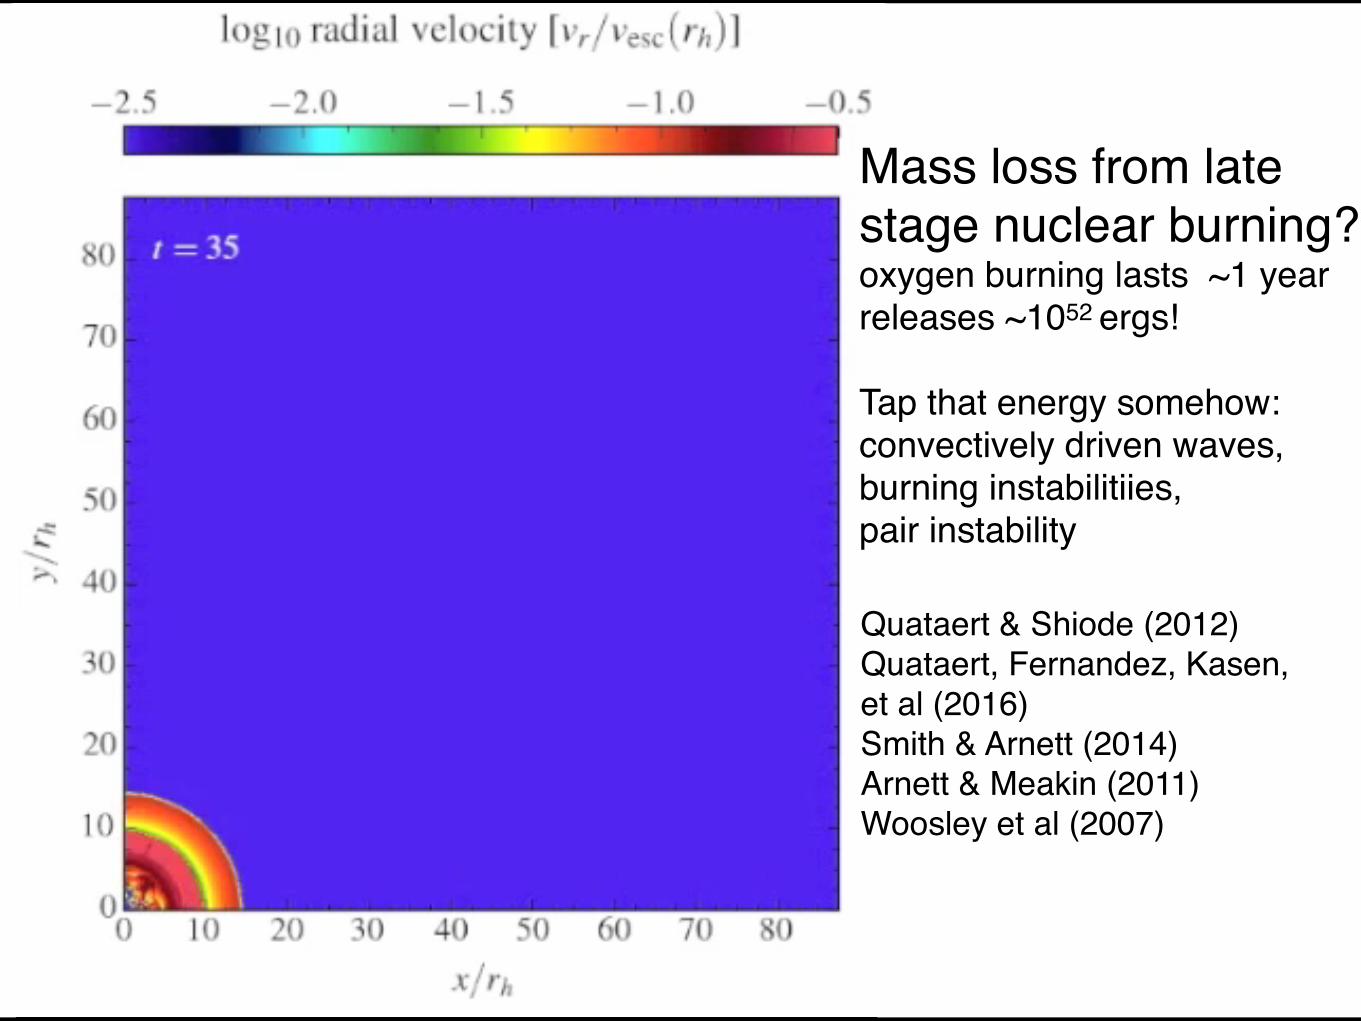
Mass loss from late stage nuclear burning?oxygen burning lasts ~1 yearreleases ~1052 ergs!
Tap that energy somehow:convectively driven waves,burning instabilitiies,pair instability
Quataert & Shiode (2012)Quataert, Fernandez, Kasen, et al (2016)Smith & Arnett (2014)Arnett & Meakin (2011)Woosley et al (2007)

density
velocitycolliding shelltoy model
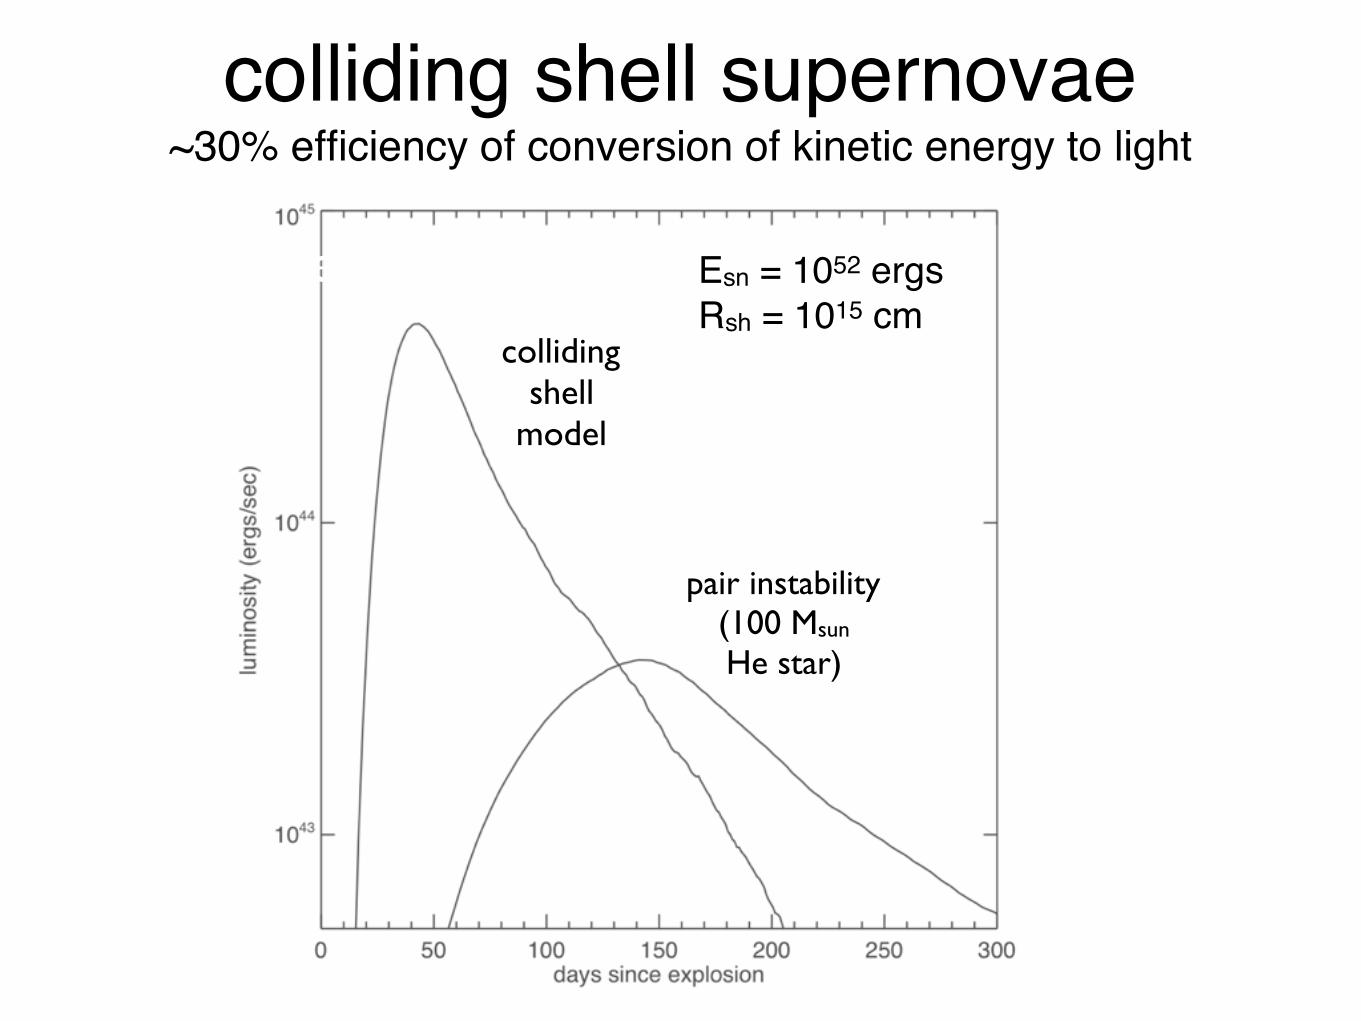
colliding shell supernovae ~30% efficiency of conversion of kinetic energy to light
shell
collidingshell
model
pair instability(100 Msun He star)
Esn = 1052 ergsRsh = 1015 cm
needed to power the late-time luminosity (see previous point),and fully consistent within the uncertainty of the late-time lu-minosity estimate. This is also a factor of !10 lower than thenecessary mass-loss rate in the decade just before core collapse,signifying a sharp boost in M immediately before the star’s death.
6. The intermediate-width component of the H! line arisesmostly in a swept-up, dense, postshock cooling shell expandingat a constant speed of !2000 km s"1 (Fig. 16). This is the dom-inant speed of the forward shock plowing into the CSM. Thisspeed does not change perceptibly from day 32 onward. Sincethe shell does not decelerate even though it is emitting almost1051 ergs, the shell must already be very massive by day 32, con-sistent with our estimates above.
7. The nature of the Balmer emission changes with time. Atearly times, the H!/H" flux ratio is consistent with recombina-tion, whereas at late times, the H!/H" ratio rises to more than10, suggesting that it becomes dominated by direct collisionalexcitation.
8. Broad wings of H! may be due in part to electron scatter-ing, but there also appears to be an underlying broad emissioncomponent, seen almost exclusively at blueshifted speeds up toabout "7500 km s"1 (Fig. 8). This broad component appearssometime after day 41, is seen on days 64 through 95, and dis-appears again at very late times. We propose that this feature cor-responds to the outermost parts of the SN ejecta that have almostreached the reverse shock (see Fig. 16). Material traveling at thisspeed would, in fact, just about reach the radius of the reverse
shock by this time after explosion (Fig. 15). The broad featuresare also seen in P Cygni absorption in He i k5876 and O i k7774.The absorption requires some additional background continuumlight source, which is likely to be the diffusion of radiation fromthe inner SN ejecta deposited by shock energy or radioactivedecay. The luminosity required for the absorption strength im-plies that the underlying SN was overluminous as well, indepen-dent of CSM-interaction.9. A possible explanation for why the broad features are seen
only from day 64 through 95 is that before that time, the shockedshell was highly opaque (the broad features reside interior to thereverse shock; Fig. 16). Long after that time (by day 445), theSN ejecta luminosity has probably dropped far below that ofthe ongoing CSM-interaction region.10. The luminosity of the intermediate-width component of
H! is not correlated with the continuum luminosity of the SN(Fig. 12). It rises as the continuum luminosity fades. Comparedto other SNe IIn, the H! equivalent width is lower, but rises tosimilar values at late times more than 1 yr after explosion (Fig. 13).This is another clue that SN 2006tf has some additional source ofcontinuum luminosity at early times, which is likely to be theslow diffusion of radiation from the massive swept-up opaqueshell that mimics a normal H-recombination SN atmosphere,but at constant velocity.11. The intermediate-width postshock H! emission has pro-
nounced asymmetry at late times, showing an asymmetric andblueshifted profile at velocities within roughly #1000 km s"1.
Fig. 16.—Cartoon illustration of the components of SN 2006tf at about 60 days after discovery, during the decline from the main light-curve peak. The primaryfeature is the massive postshock shell of gas, composed of the swept-up opaque pre-SN envelope around the star ejected in the decade before core collapse. Most of themass is in the cold dense shell (CDS), bounded by the forward shock (FS) and the reverse shock (RS). Diffusion of radiation from this shocked shell produces the maincontinuum photosphere (1) and the intermediate-width component of H!. This shell expands at constant speed into the preshock CSM (dense wind of the progenitor).The interior of the shell is filled by freely expanding SN ejecta, the outermost parts of which are ionized by radiation (wavy lines) propagating inward from the reverseshock, exciting the broad He i and O i features seen in the spectrum. There is also a second photosphere (2) in the SN ejecta, which is fainter than the main photosphereand can only be seen if the main shell thins or develops clumps as time proceeds. Right : More detailed depiction of the postshock gas, including the clumpy structurethat forms due to instabilities in the cold dense shell layer. The dashed line here represents the photosphere at some arbitrary early time, working its way from left to rightthrough the clumpy CDS as the SN expands. When it reaches a dense clump, the recombination photosphere will proceed through that clump, but for the regionsbetween clumps it will eventually break through, allowing an observer to see the underlying SN ejecta.
SMITH ET AL.482 Vol. 686
4 Smith et al.
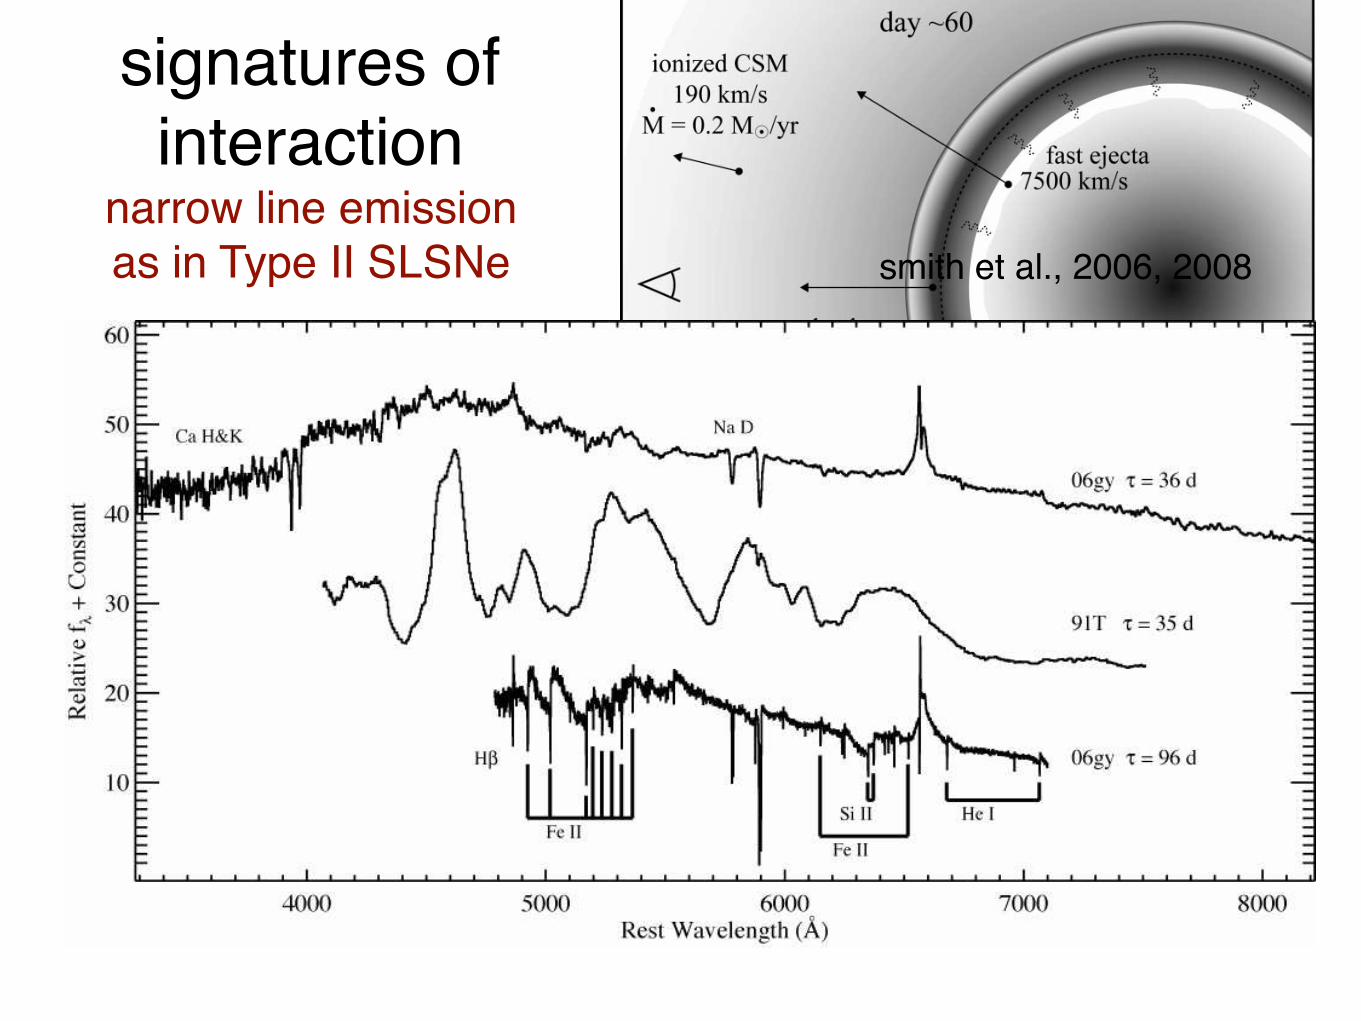
Fig. 3.— Lick Observatory spectra of SN 2006gy at two different epochs, corrected for a range of assumed host-galaxy reddeningcorresponding to the values of AR listed at right (Cardelli et al. 1989). This extinction is in addition to Galactic extinction of AR = 0.43mag. These are compared to the day 32 spectrum of the Type IIn SN 2006tf (black) from our database, which is a SN with a spectrumsimilar to that of SN 2006gy, but seems to show little reddening. We adopt AR = 1.25 ± 0.25 mag for SN 2006gy; see text.
Fig. 4.— Dereddened visual-wavelength spectra of SN 2006gy at t = 36 d and 96 d after explosion, obtained at Lick Observatory andwith the Keck II telescope, respectively. Several narrow absorption lines in our high-resolution Keck spectrum have been marked, butthere are some remaining unidentified lines. Also plotted is a spectrum of the Type Ia SN 1991T at t = 35 d (Filippenko et al. 1992) forcomparison with our day 36 spectrum of SN 2006gy; there is essentially no similarity between the two spectra.
imum light from a portion of the same Keck spectrum inFig. 4, with the flux normalized to the underlying contin-uum level, and the velocity scale chosen with the narrowHα emission feature at v = 0 km s−1. The Hα profile inFigure 5 reveals several different characteristic velocitiesrelevant to interpretations of SN 2006gy. First, the verynarrow emission component (FWHM ≈ 100 km s−1) hasan associated P Cygni absorption feature that indicatesoutflow speeds of 130 km s−1 (the trough) to 260 km s−1
(the blue edge) in the unshocked circumstellar gas. Inaddition to Hα, several lines identified in Figs 4 and 5also have narrow absorption features.
A broad Hα emission component has an apparentFWHM ≈ 2400 km s−1 that is similar to Hβ at earlytimes (Harutyunyan et al. 2006). The true unabsorbedFWHM of this broad Hα component is larger because ofthe broad blueshifted absorption. Extended faint wings
out to ±6,000 km s−1 may be caused either by electronscattering or by the fastest SN ejecta.
The blue edge of the broad, blueshifted Hα absorptionin Figure 5 indicates an outflow speed of 4,000 km s−1,where the emission jumps back up just to the level thatwould be expected for a symmetric profile. This jump isreadily apparent when we take the redshifted side of thebroad emission profile and reflect it to the blue side, tosimulate what a symmetric profile would look like (Fig.5). Because this absorption traces the speed of the dom-inant absorbing material along the line of sight at thisepoch, we take this speed of 4,000 km s−1 to representdense material swept up by the SN blast wave in the cir-cumstellar material (CSM) interaction hypothesis, whichshould closely trace the speed of the blast wave itself.
The broad-line profile differs from the smooth broadparts of Hα profiles normally seen in SNe IIn (e.g.,
signatures of interaction
narrow line emissionas in Type II SLSNe smith et al., 2006, 2008
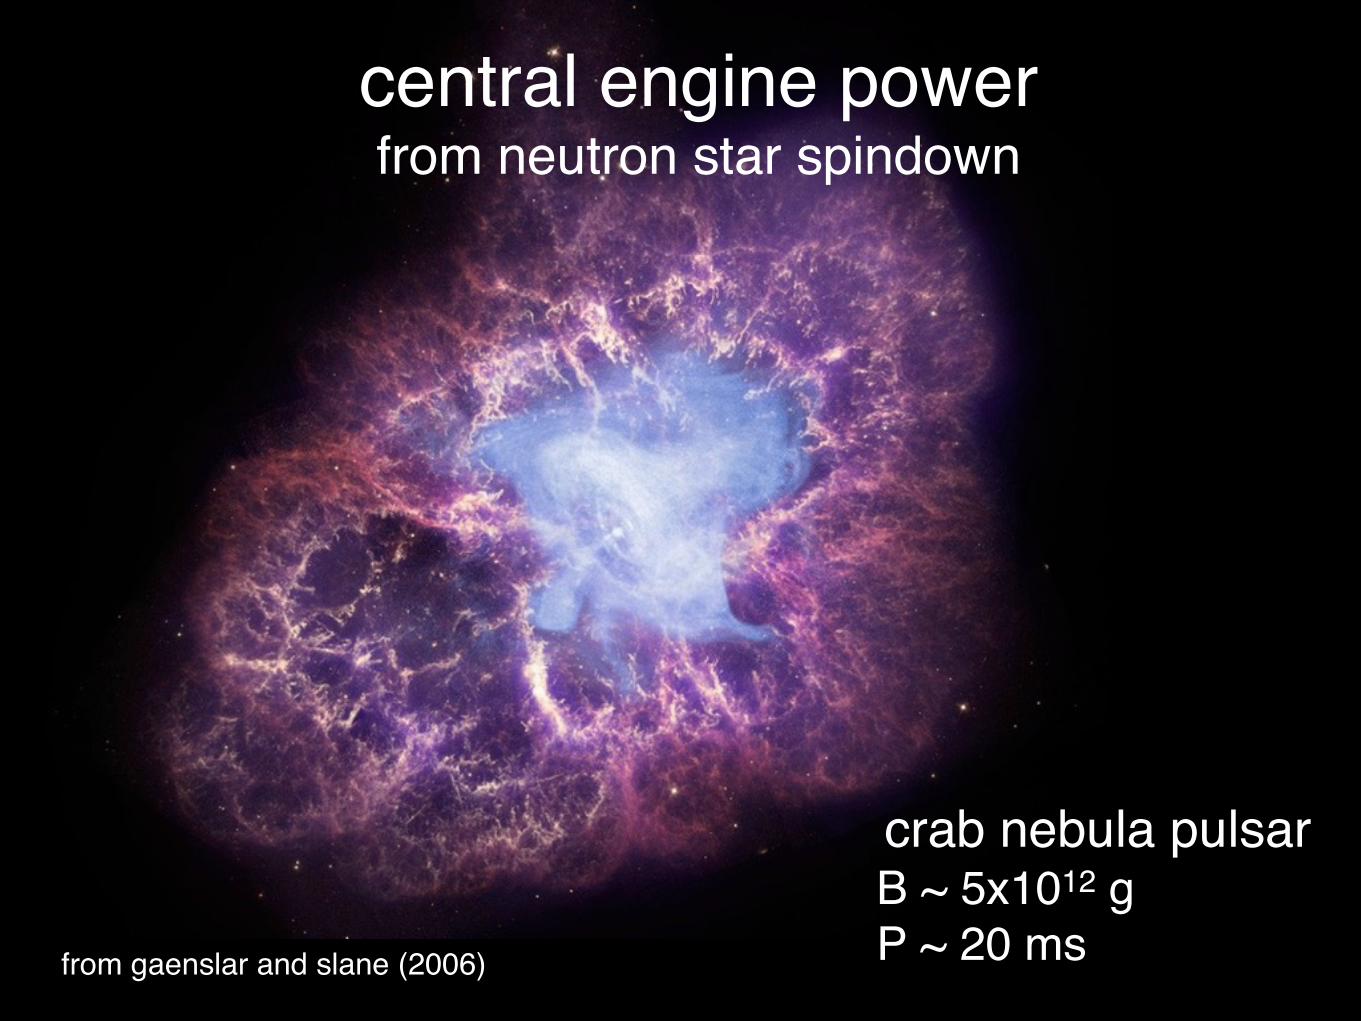
crab pulsar wind nebulafrom gaenslar and slane (2006)central engine power
from neutron star spindown
crab nebula pulsarB ~ 5x10¹² gP ~ 20 ms from gaenslar and slane (2006)
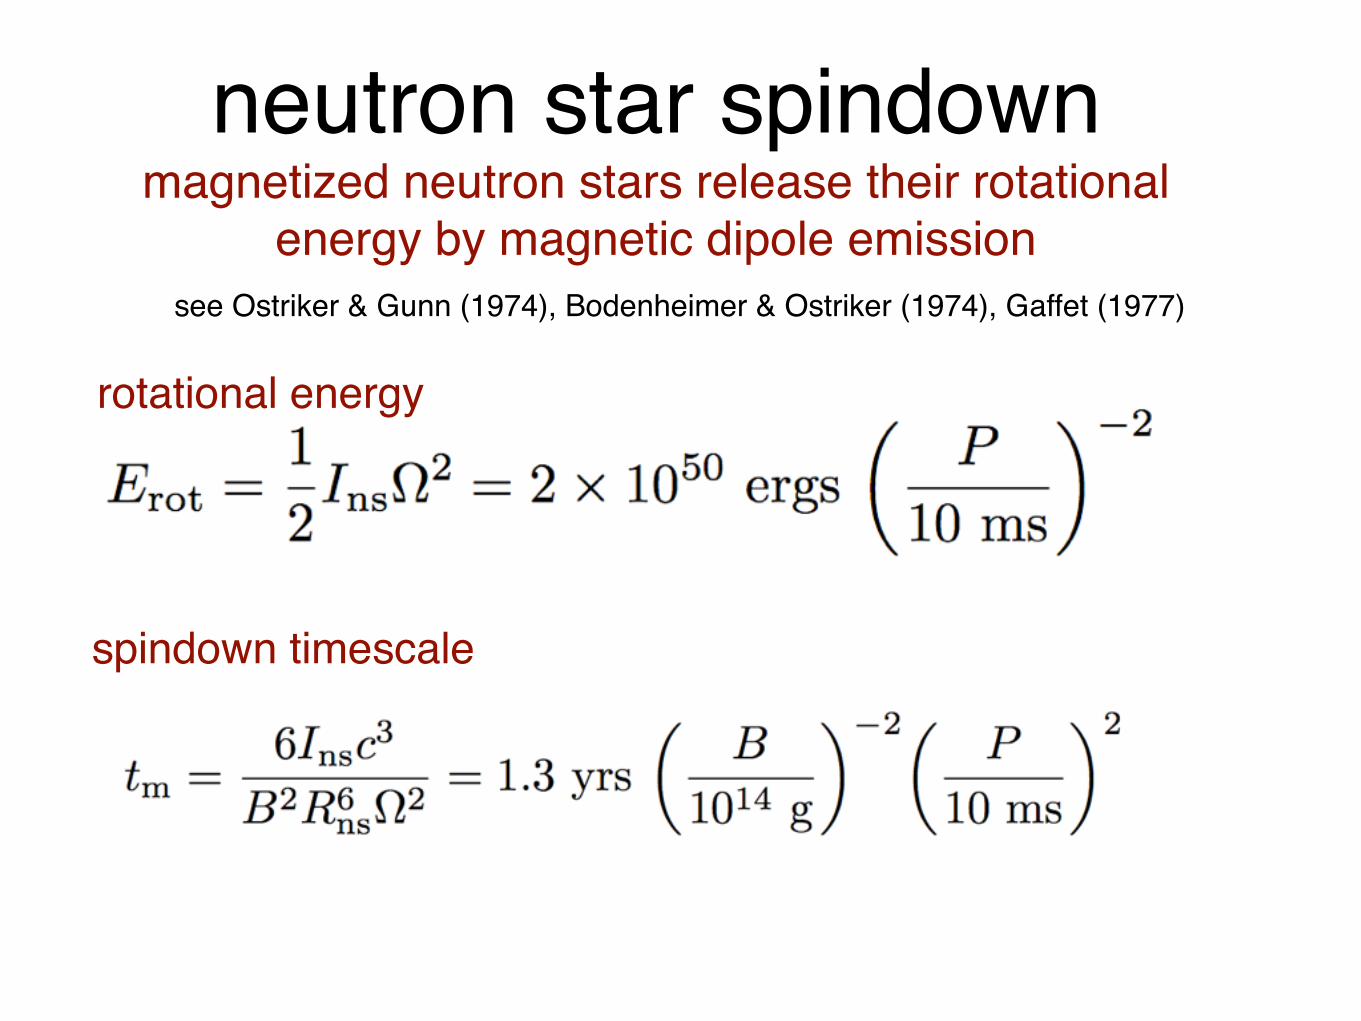
neutron star spindownmagnetized neutron stars release their rotational
energy by magnetic dipole emission
rotational energy
spindown timescale
see Ostriker & Gunn (1974), Bodenheimer & Ostriker (1974), Gaffet (1977)
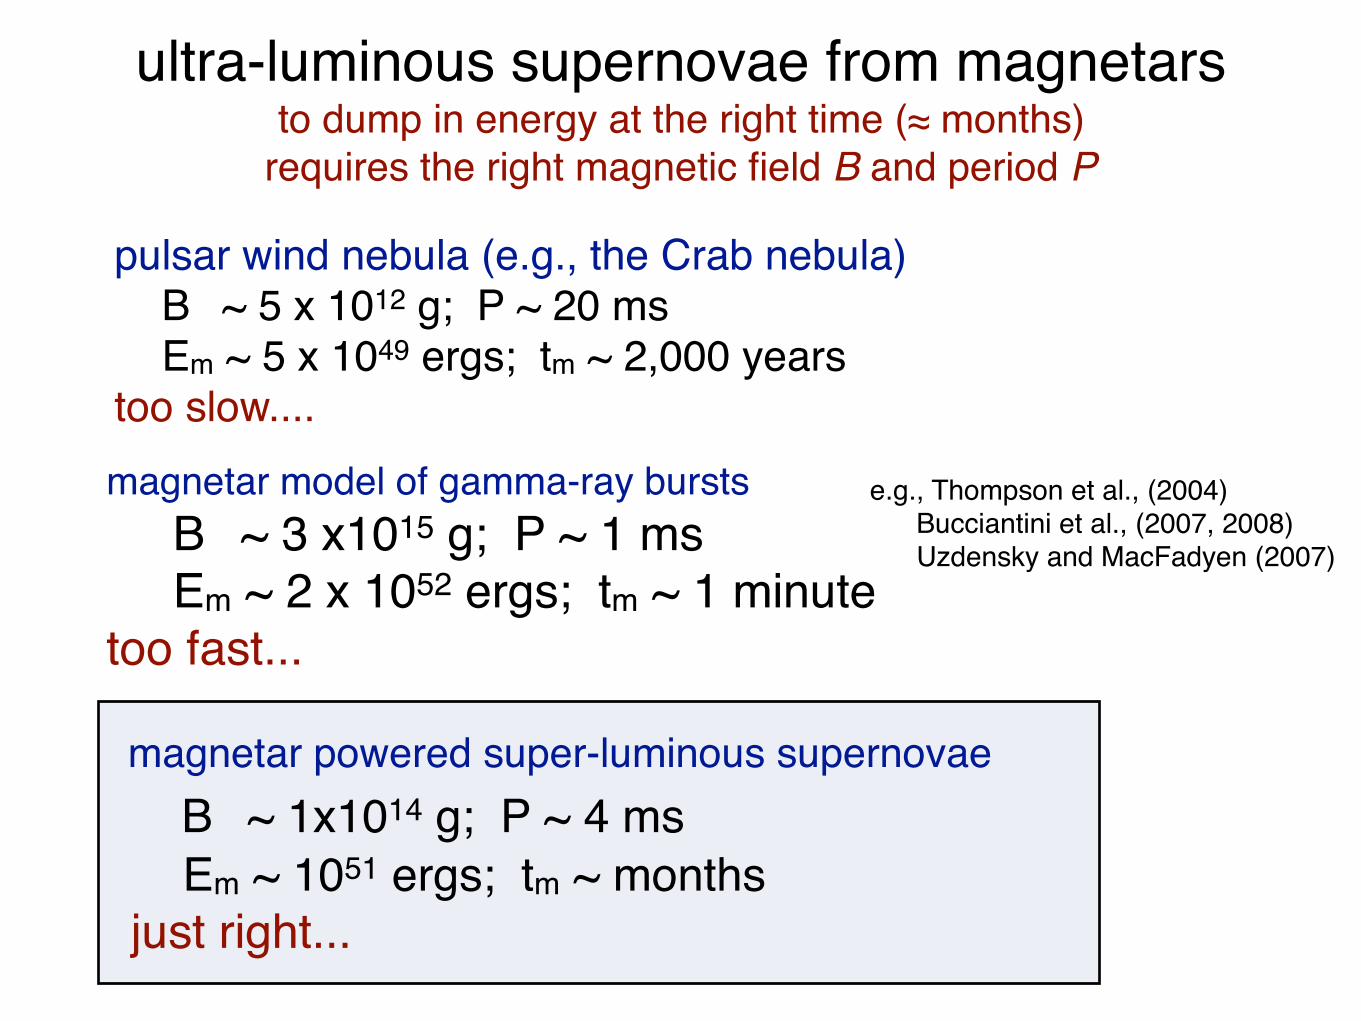
magnetar powered super-luminous supernovae B ~ 1x10¹⁴ g; P ~ 4 ms Em ~ 1051 ergs; tm ~ months just right...
pulsar wind nebula (e.g., the Crab nebula) B ~ 5 x 10¹² g; P ~ 20 ms Em ~ 5 x 1049 ergs; tm ~ 2,000 yearstoo slow....magnetar model of gamma-ray bursts B ~ 3 x10¹⁵ g; P ~ 1 ms Em ~ 2 x 1052 ergs; tm ~ 1 minutetoo fast...
e.g., Thompson et al., (2004) Bucciantini et al., (2007, 2008) Uzdensky and MacFadyen (2007)
ultra-luminous supernovae from magnetarsto dump in energy at the right time (≈ months)
requires the right magnetic field B and period P
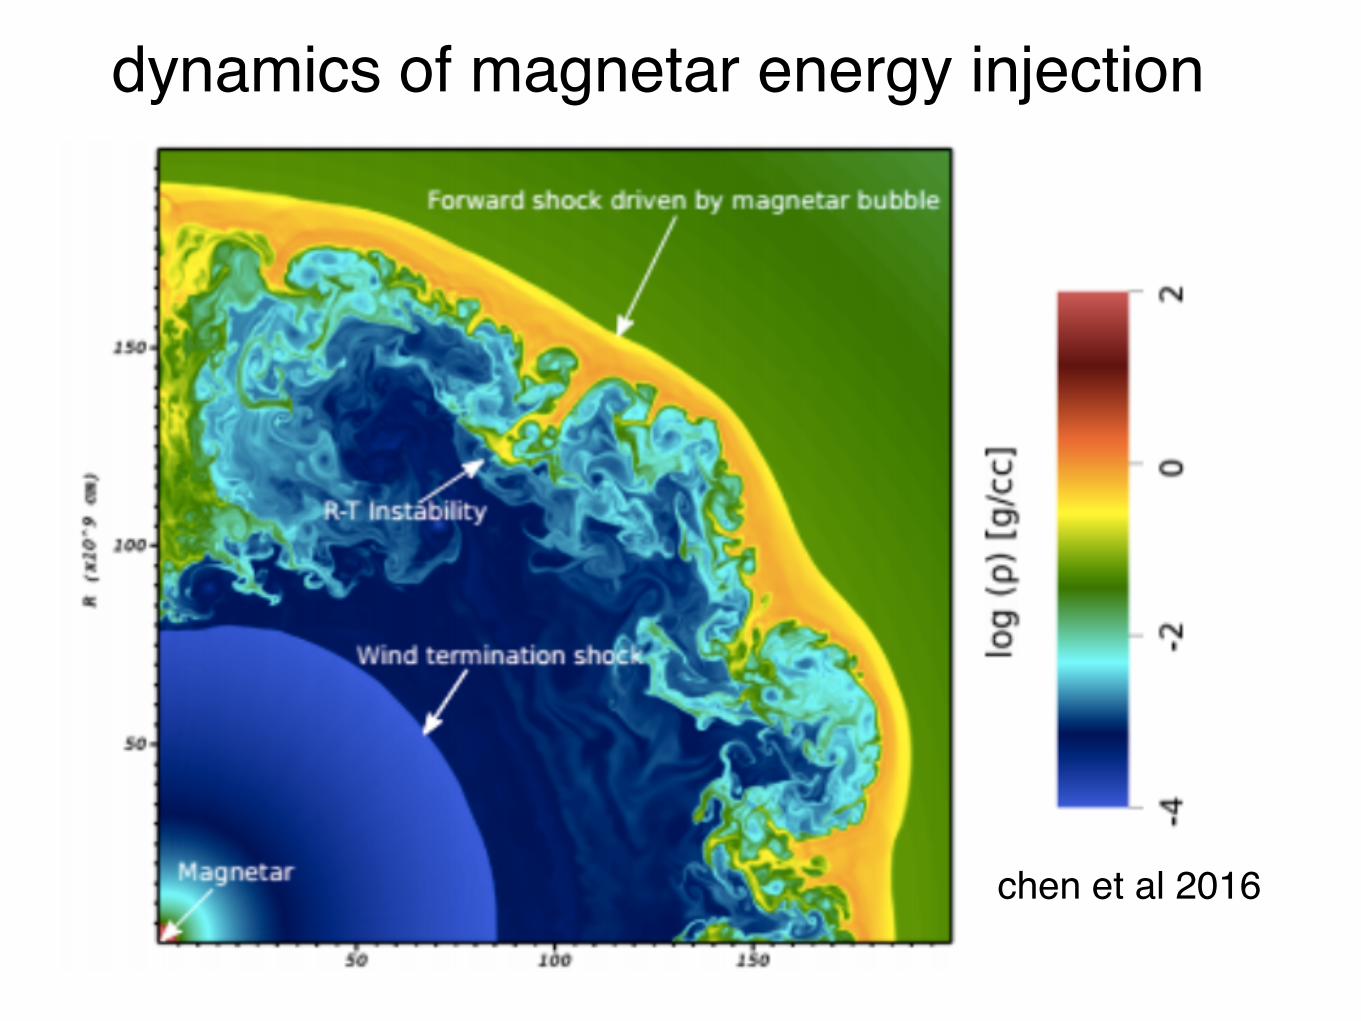
chen et al 2016
dynamics of magnetar energy injection
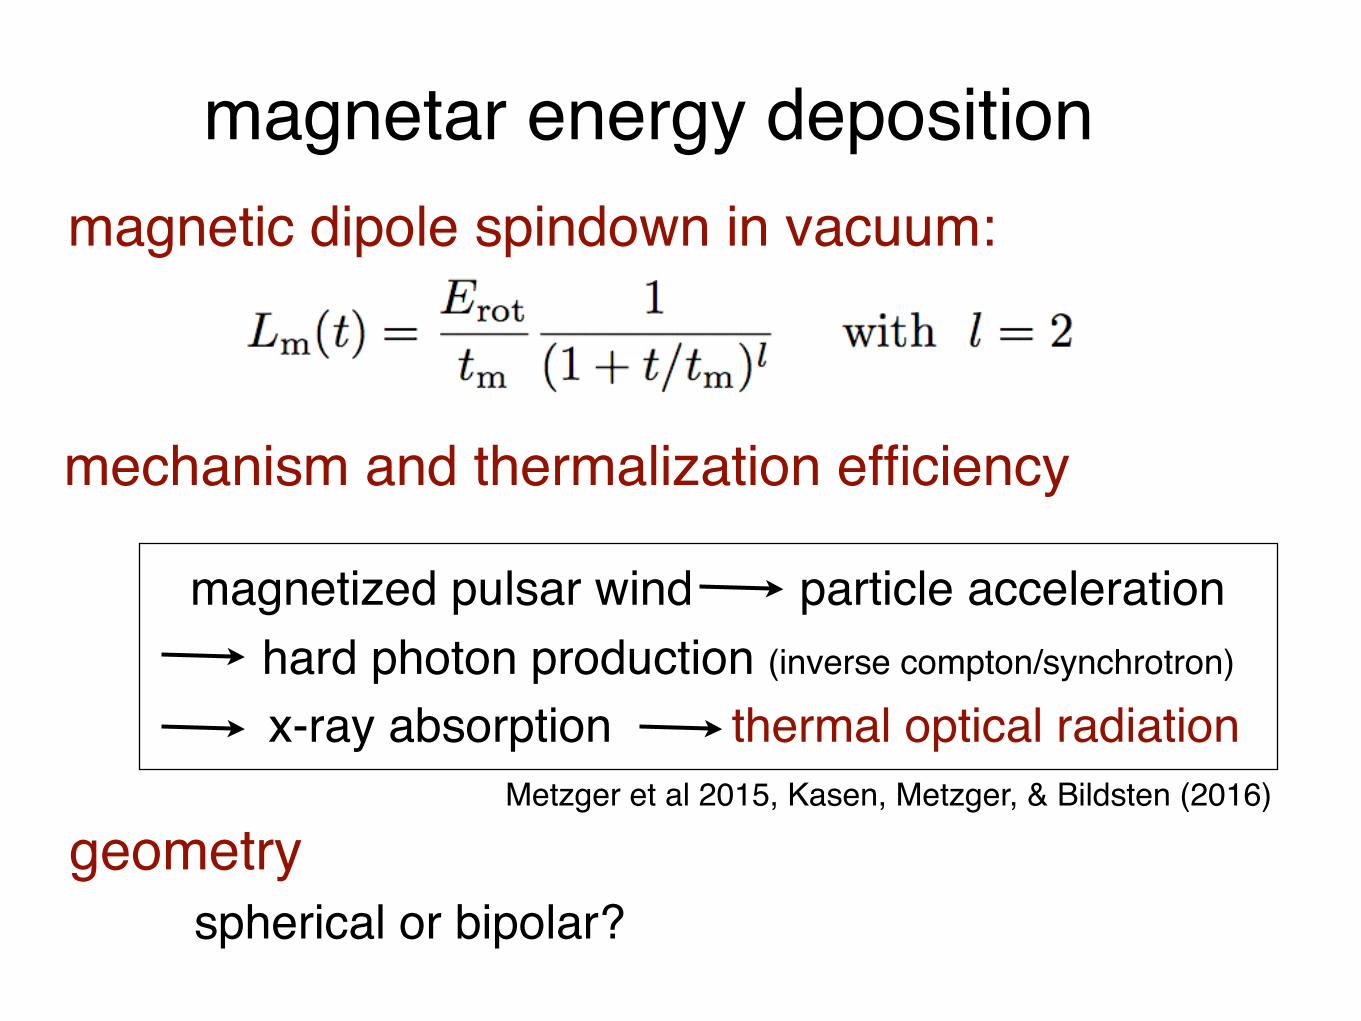
magnetic dipole spindown in vacuum:
mechanism and thermalization efficiency
magnetized pulsar wind particle acceleration hard photon production (inverse compton/synchrotron)
x-ray absorption thermal optical radiation
magnetar energy deposition
geometryMetzger et al 2015, Kasen, Metzger, & Bildsten (2016)
spherical or bipolar?
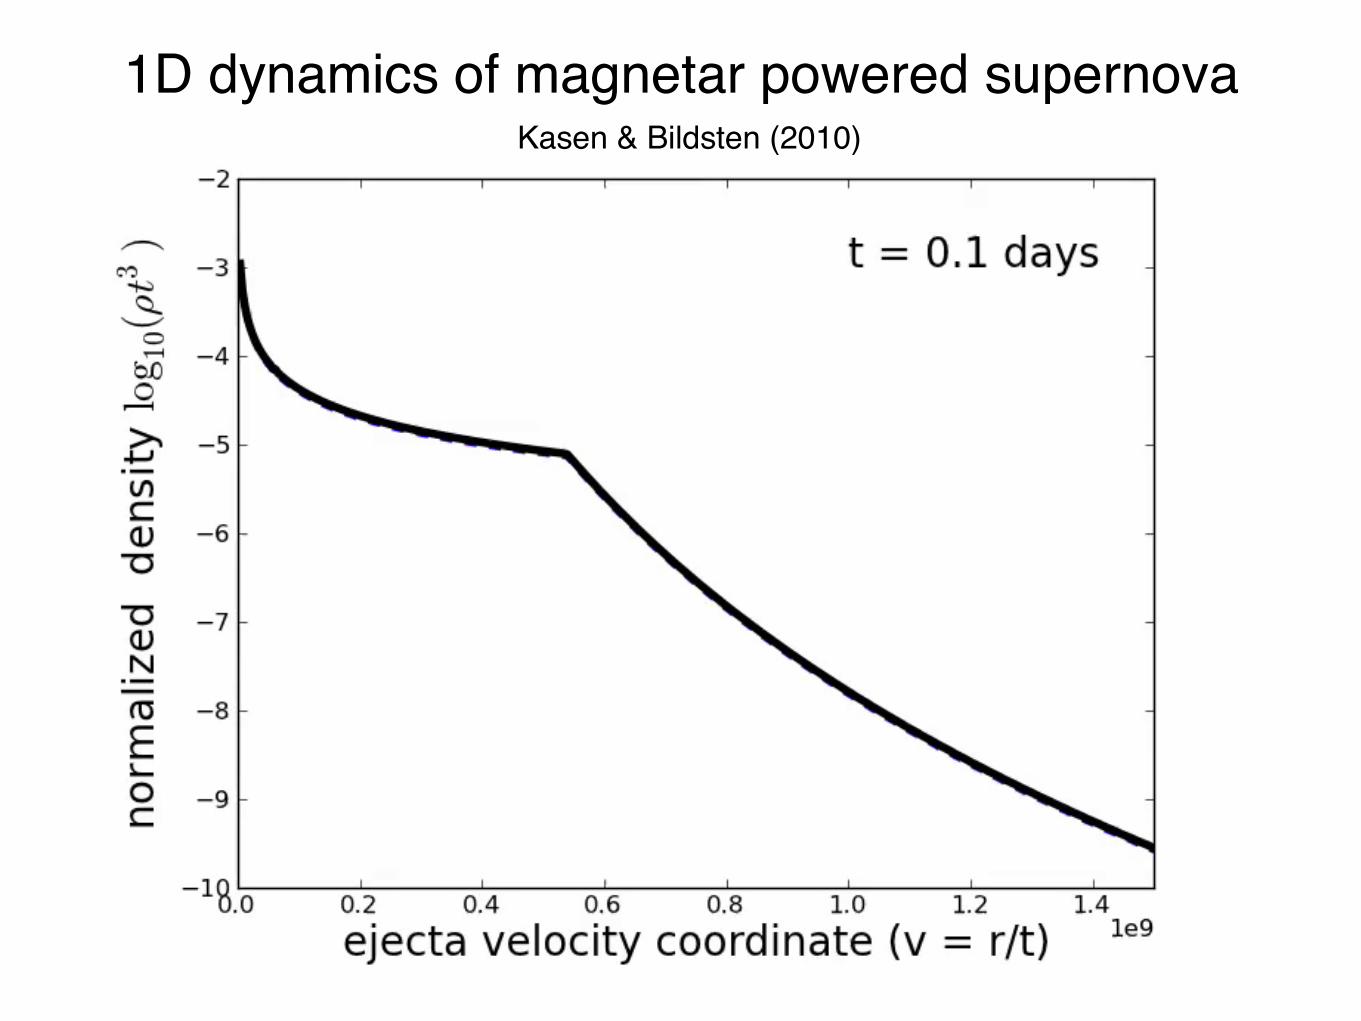
1D dynamics of magnetar powered supernovaKasen & Bildsten (2010)

P = 5 ms
P = 2 ms
P = 1 ms
longer spindown time
theoretical maximum2-3 x 1045 ergs/s
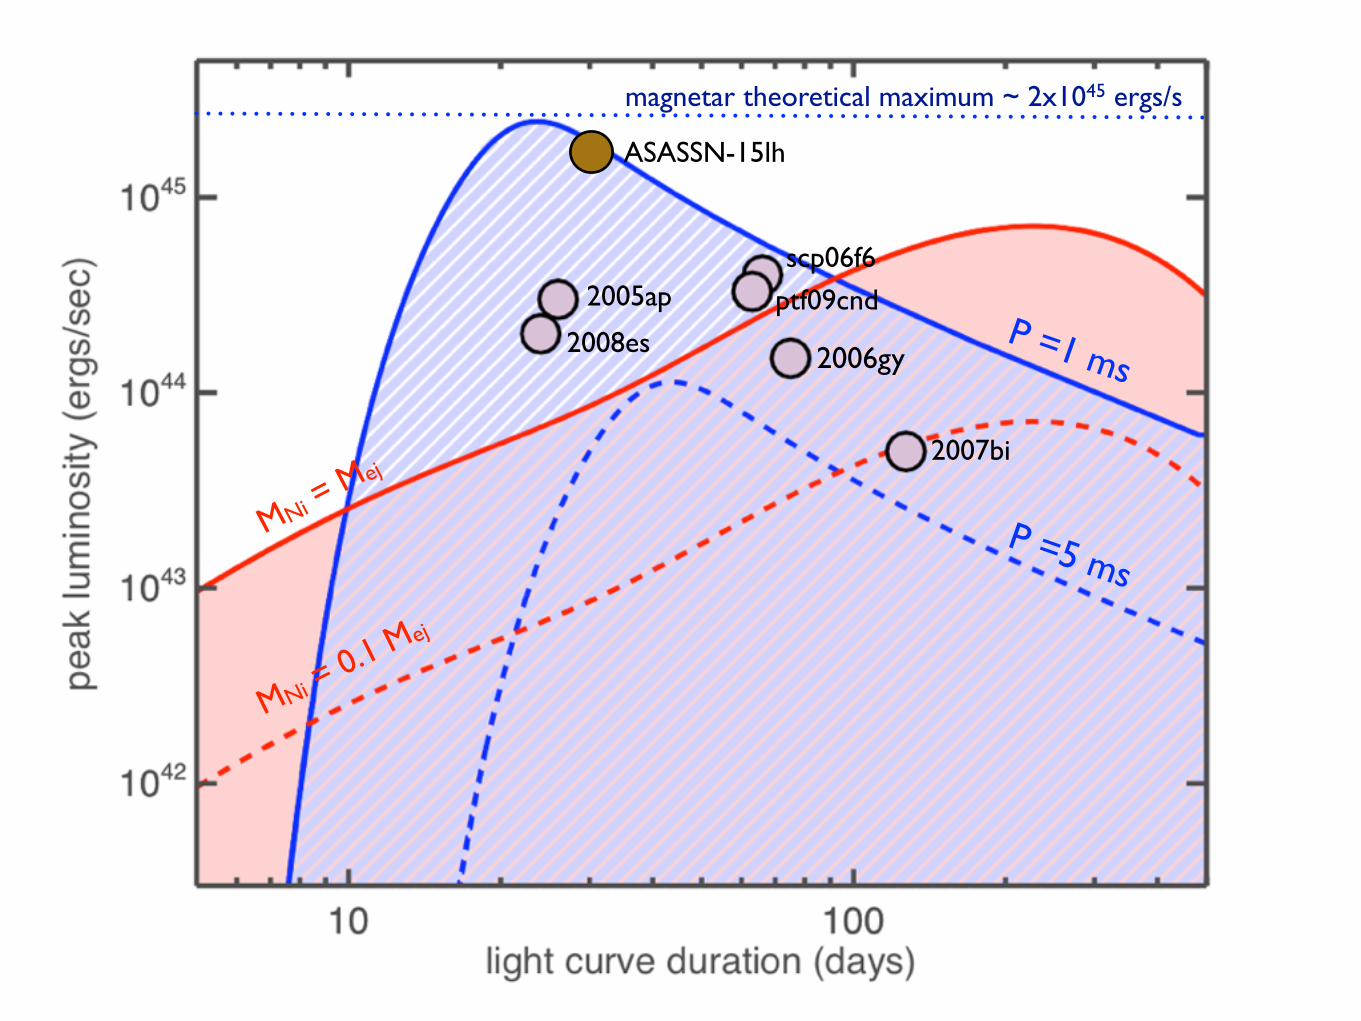
MNi = Mej
MNi = 0.1 Mej
magnetar theoretical maximum ~ 2x1045 ergs/s
P =1 ms
P =5 ms
2006gy
2007bi
2005ap
2008es
ptf09cnd
scp06f6
MNi = Mej
MNi = 0.1 Mej
ASASSN-15lh
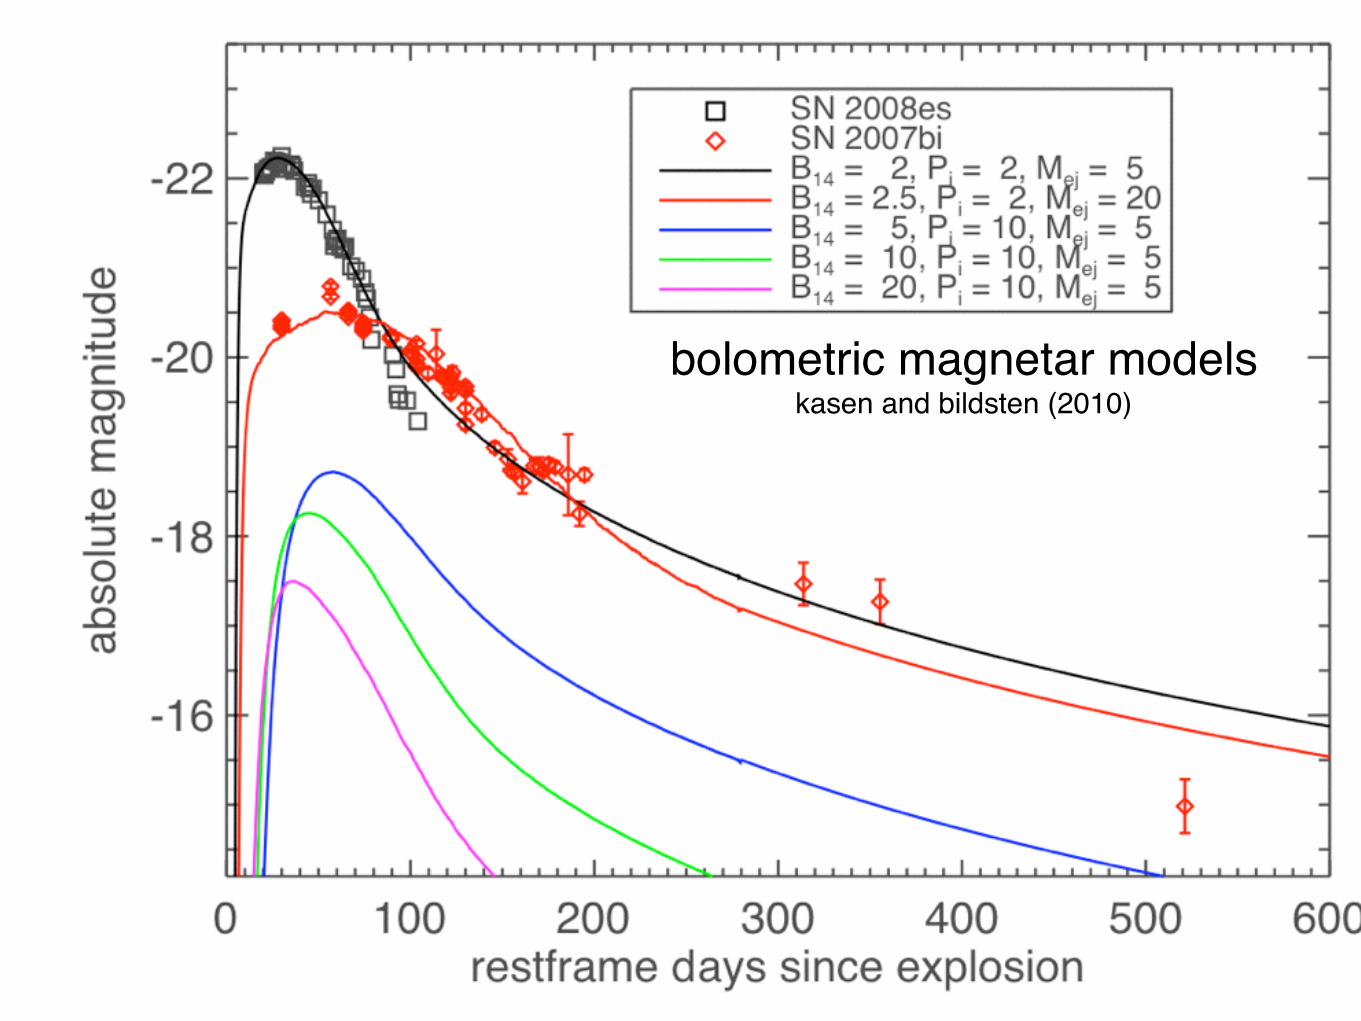
bolometric magnetar modelskasen and bildsten (2010)
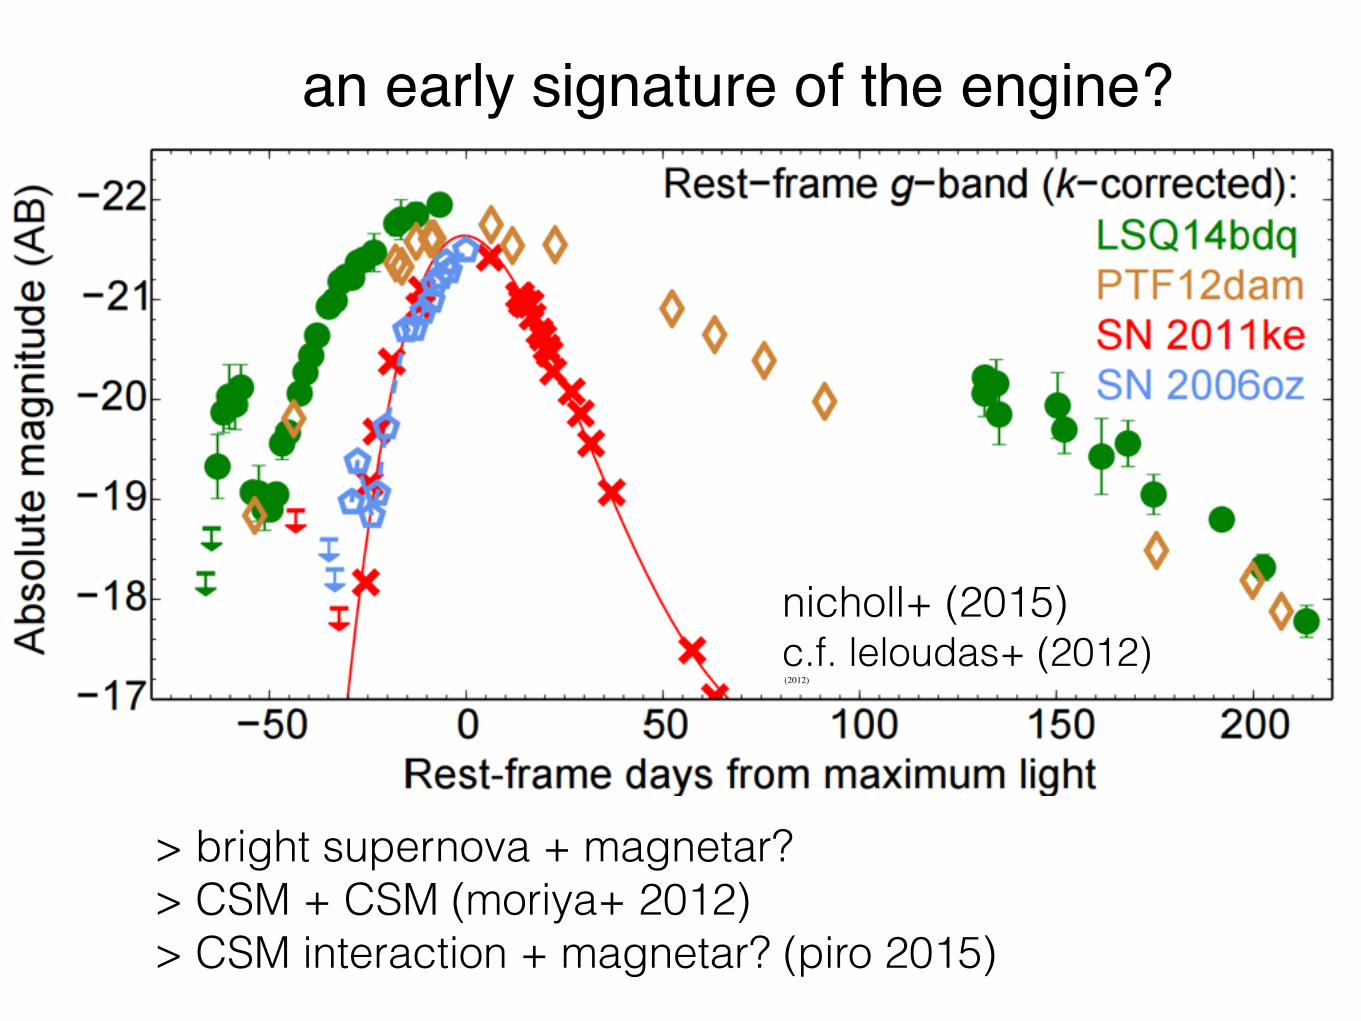
an early signature of the engine?
nicholl+ (2015) c.f. leloudas+ (2012)
(2012)
> bright supernova + magnetar? > CSM + CSM (moriya+ 2012) > CSM interaction + magnetar? (piro 2015)
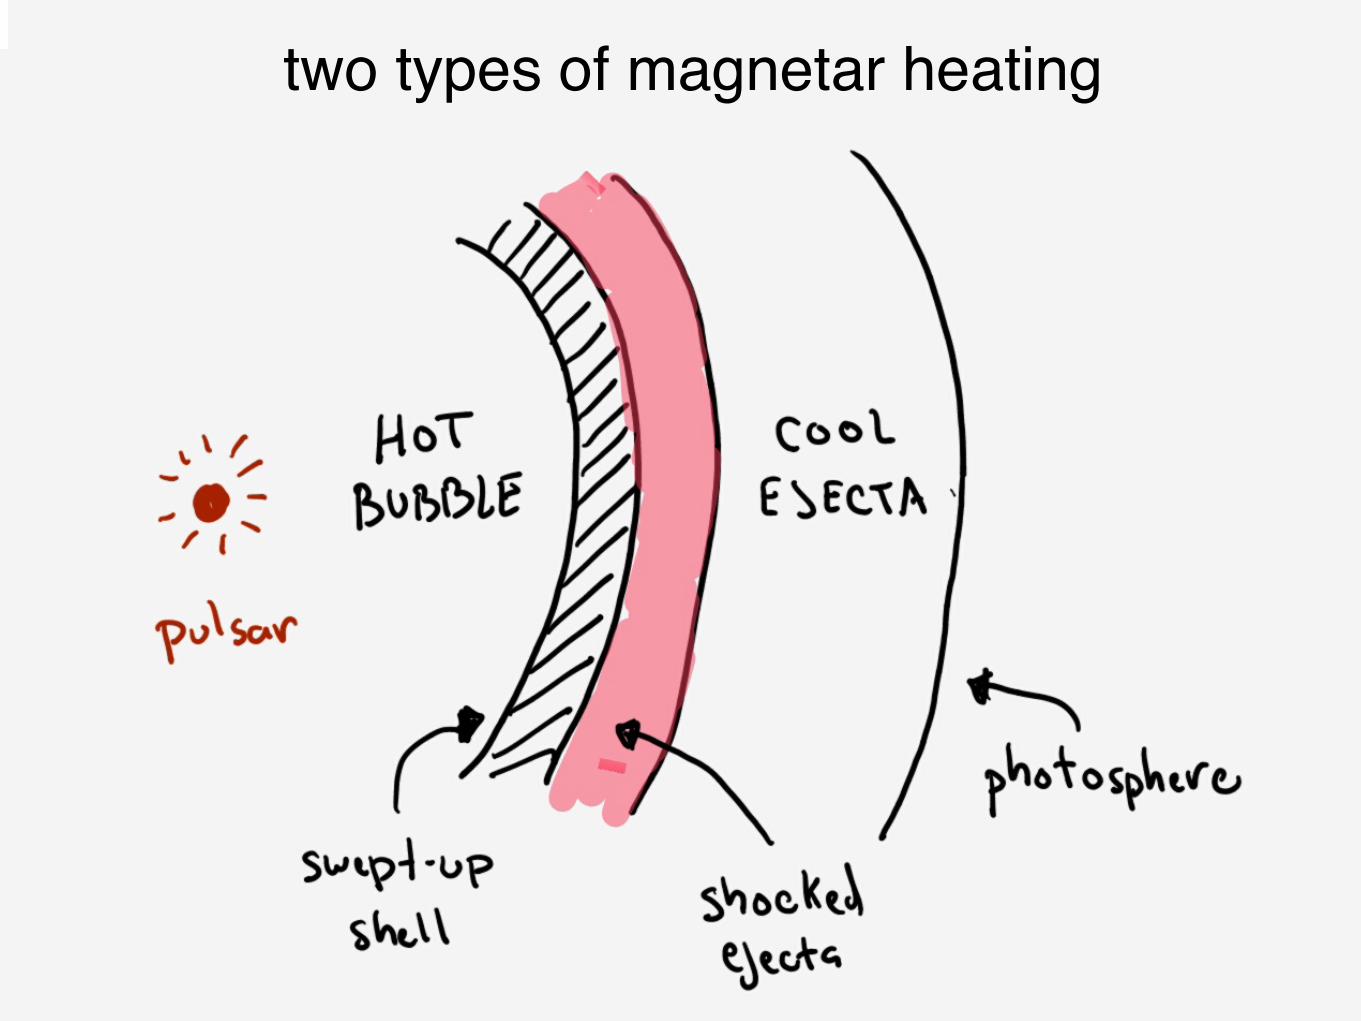
two types of magnetar heating
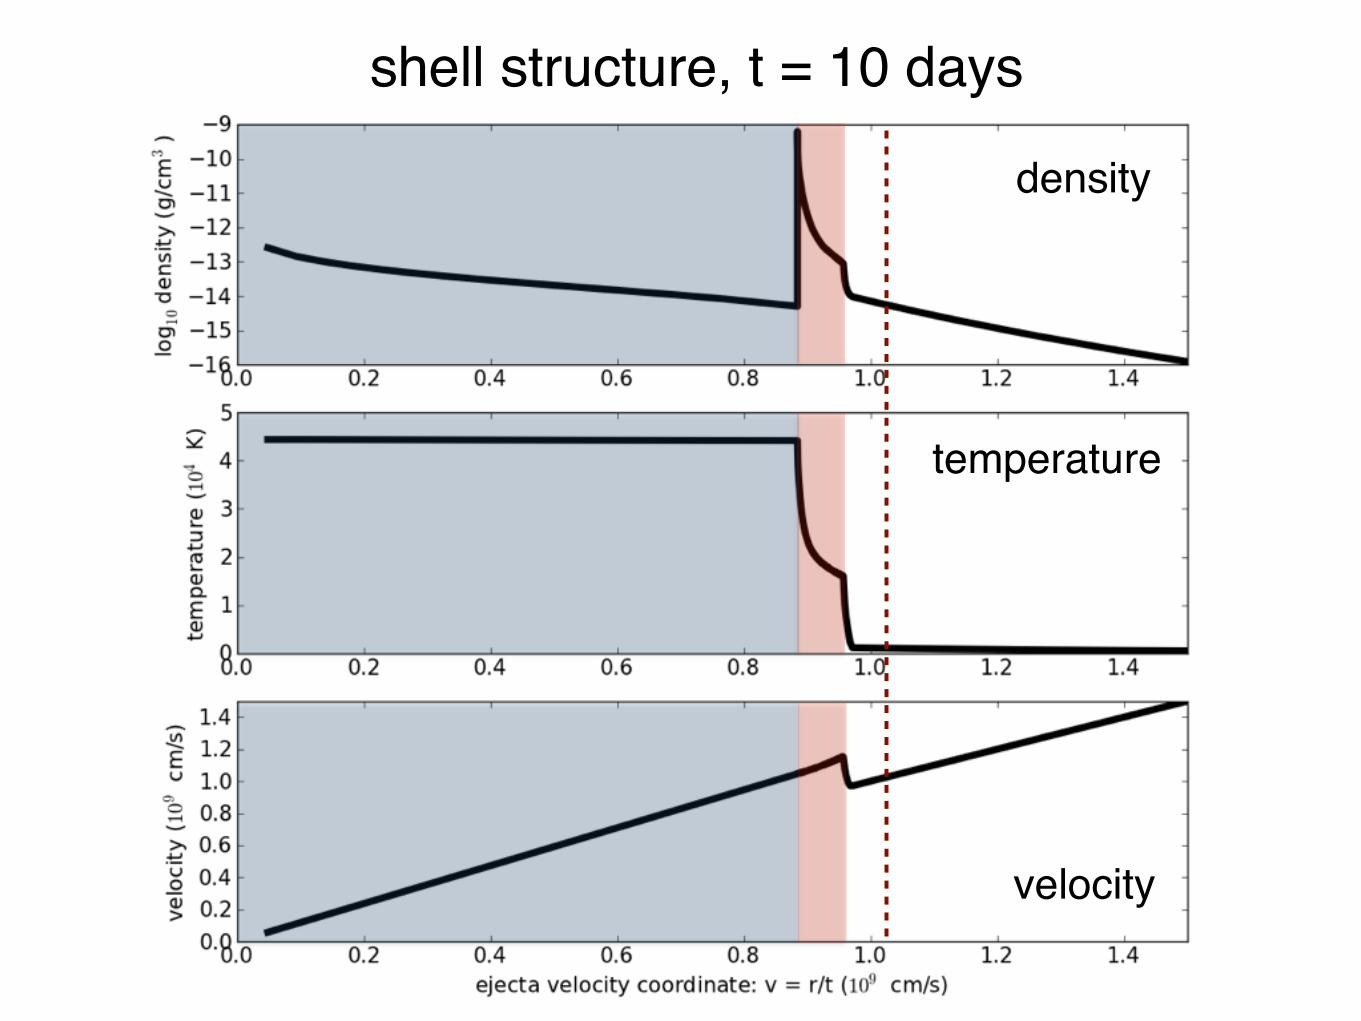
density
temperature
velocity
shell structure, t = 10 days
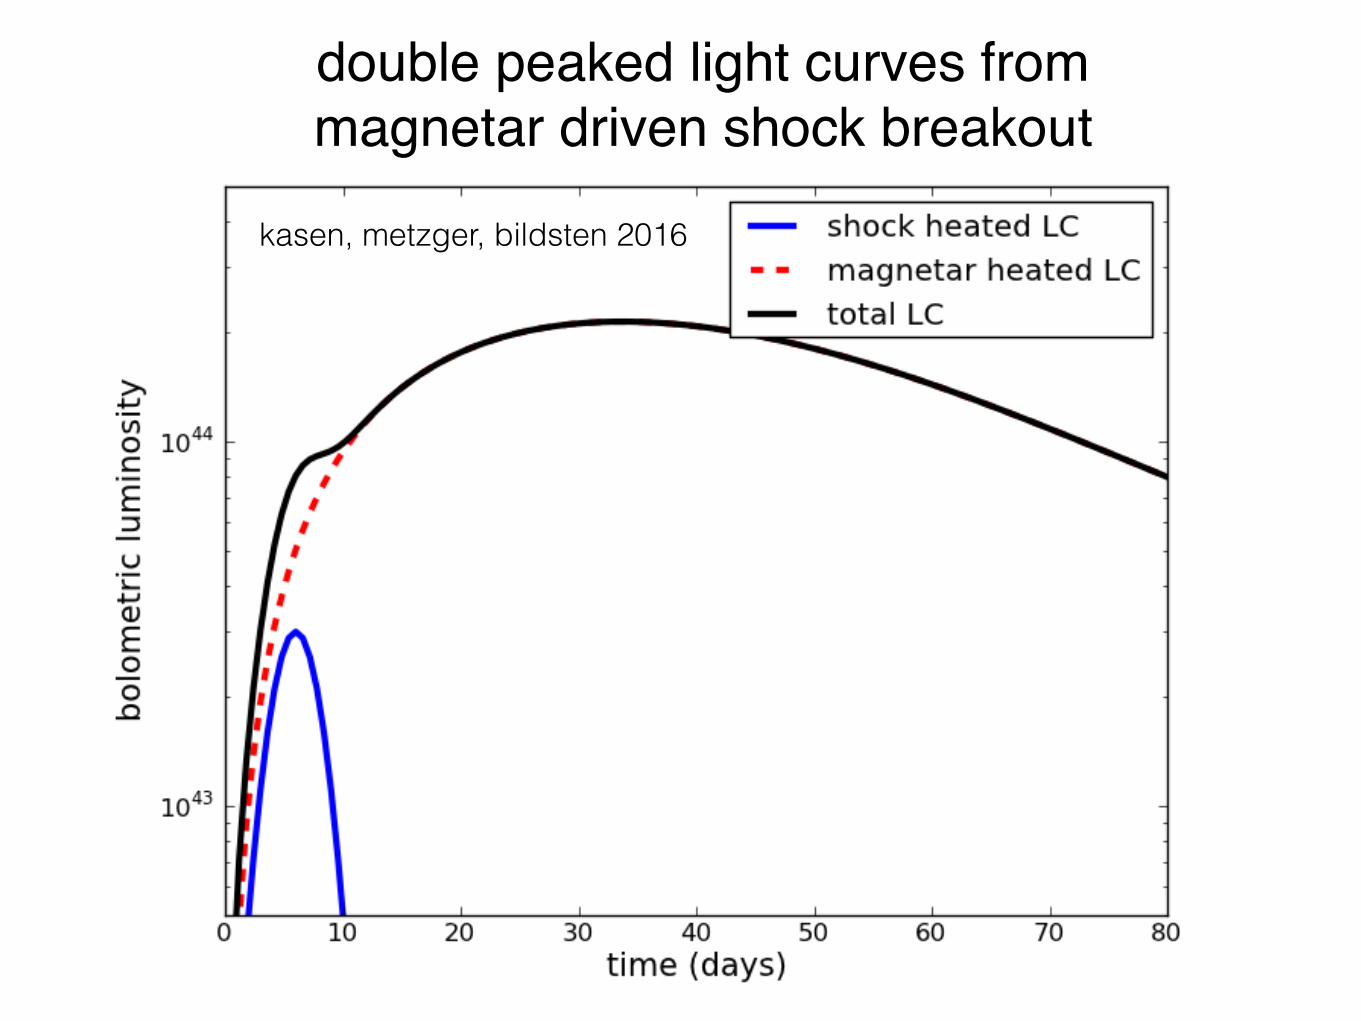
double peaked light curves frommagnetar driven shock breakout
kasen, metzger, bildsten 2016
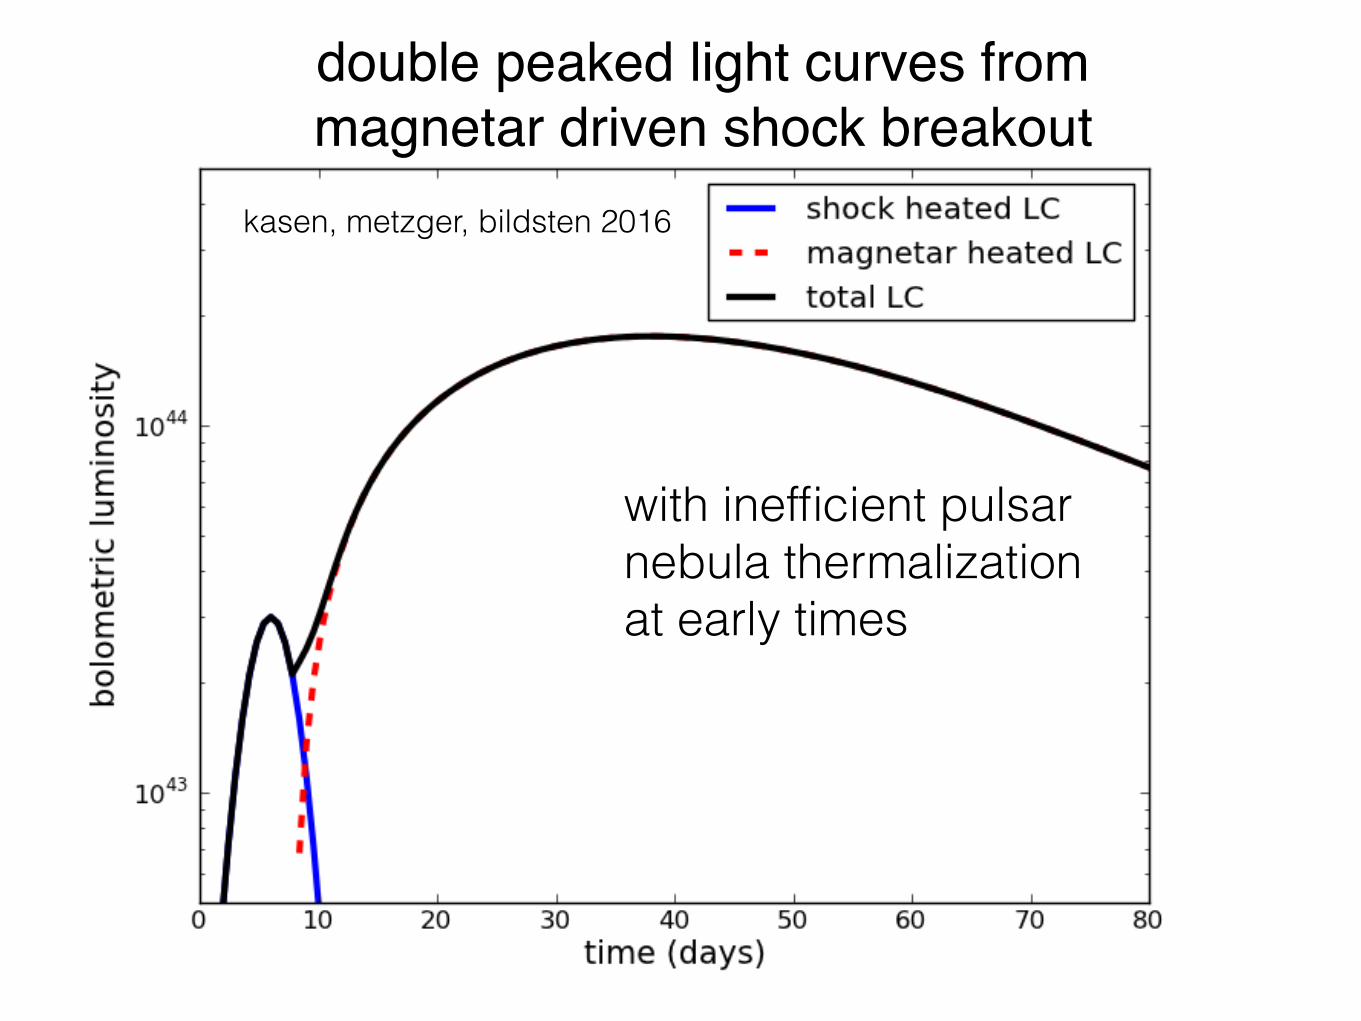
double peaked light curves frommagnetar driven shock breakout
with inefficient pulsar nebula thermalization at early times
kasen, metzger, bildsten 2016
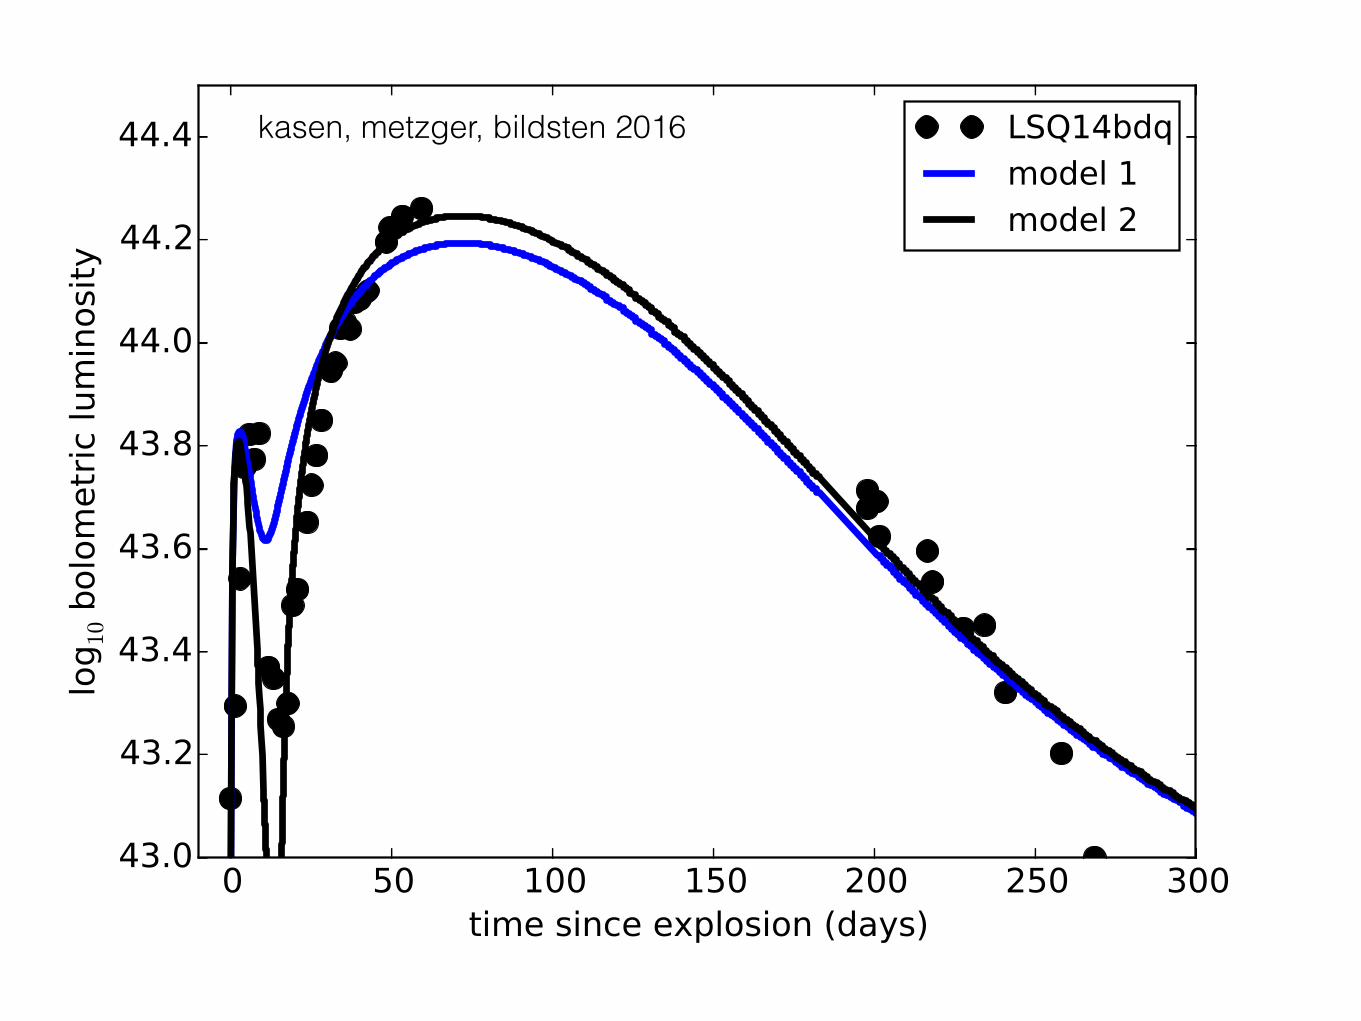
kasen, metzger, bildsten 2016
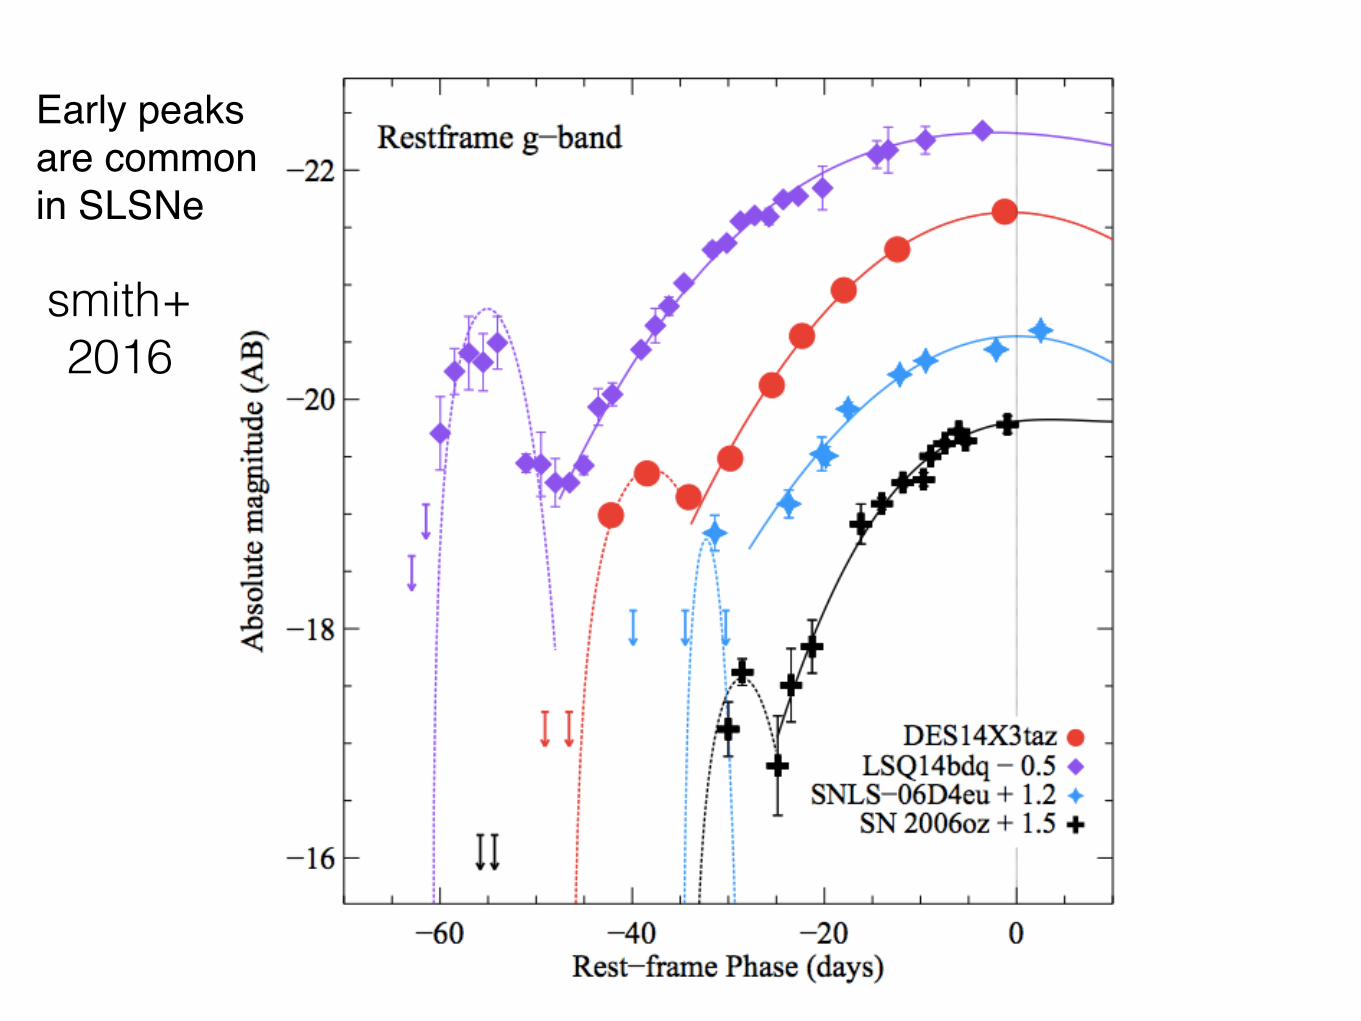
smith+ 2016
Early peaks are commonin SLSNe
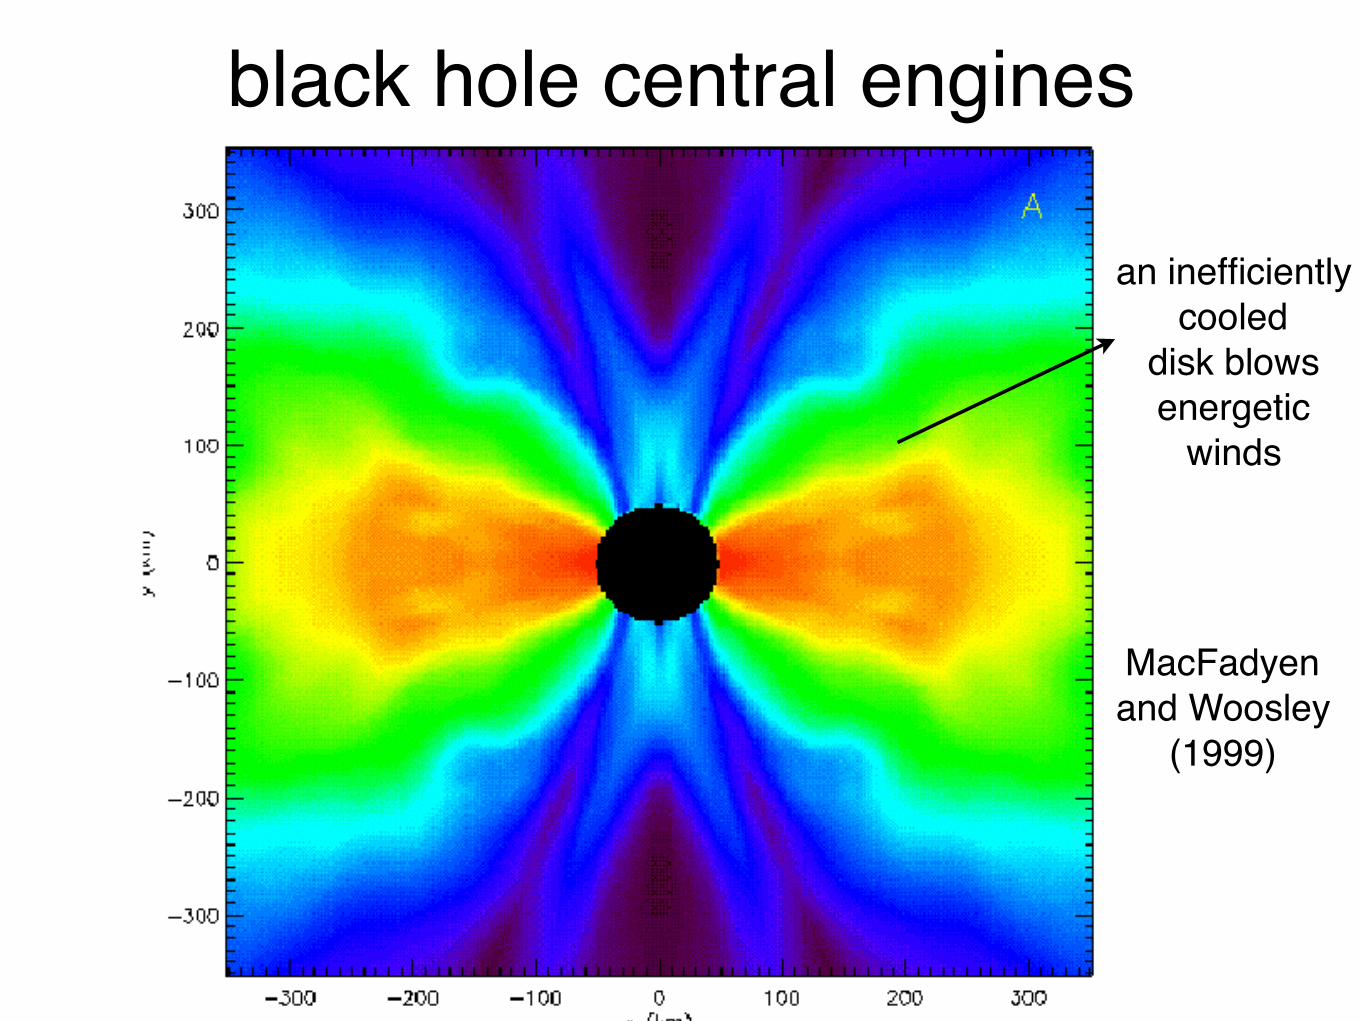
black hole central engines
an inefficiently cooled
disk blows energetic
winds
MacFadyenand Woosley
(1999)
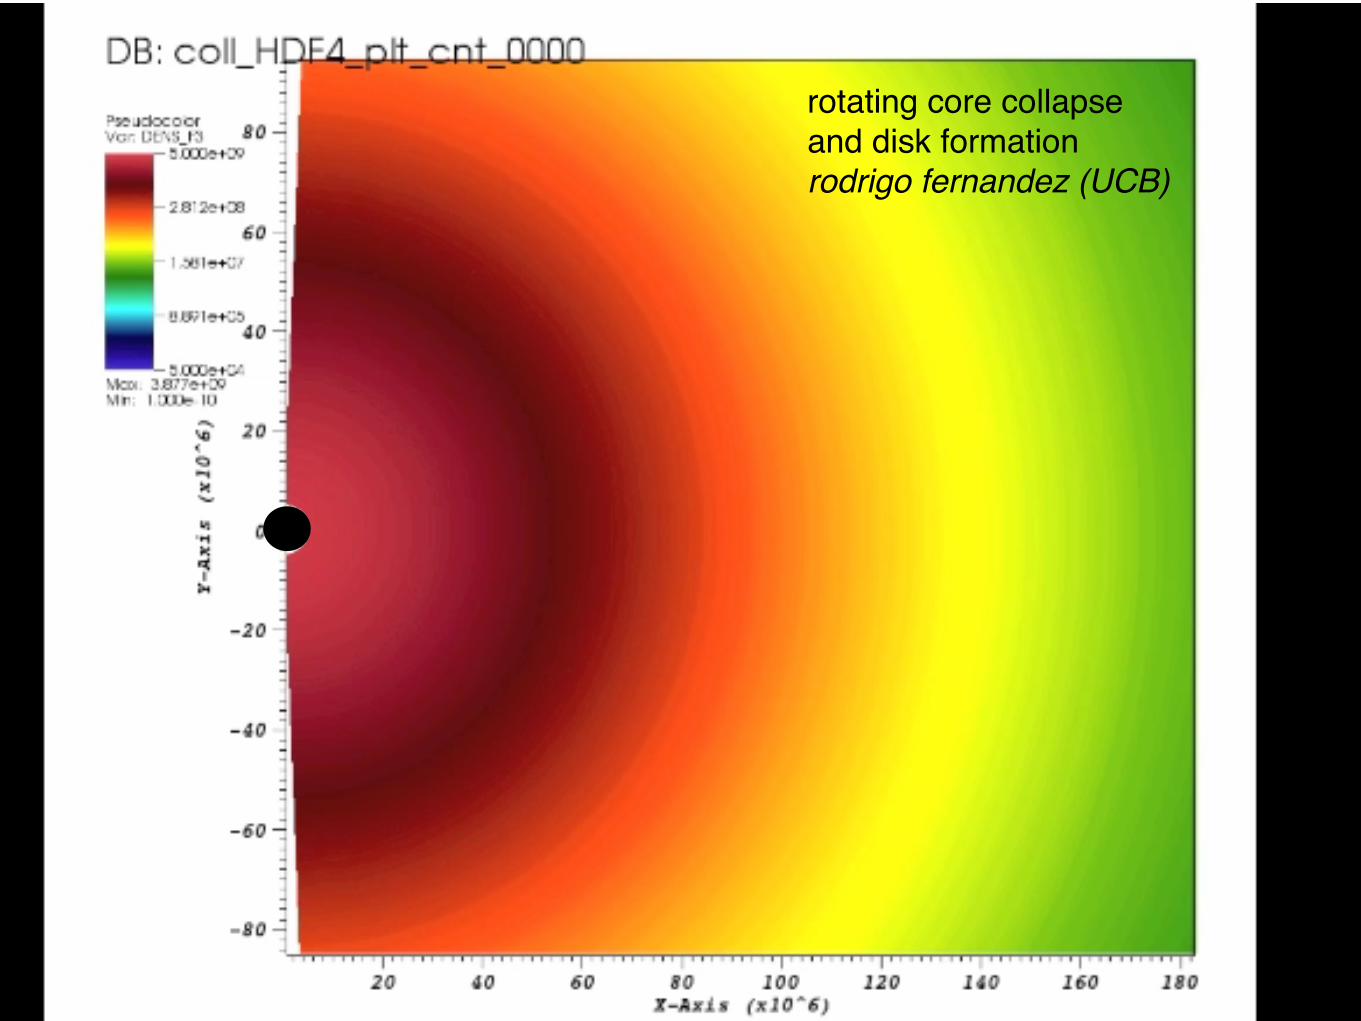
rotating core collapseand disk formationrodrigo fernandez (UCB)
H envelopeHe coreC/O core
1D core collapse explosion modeldexter and kasen (2013)
escape speed
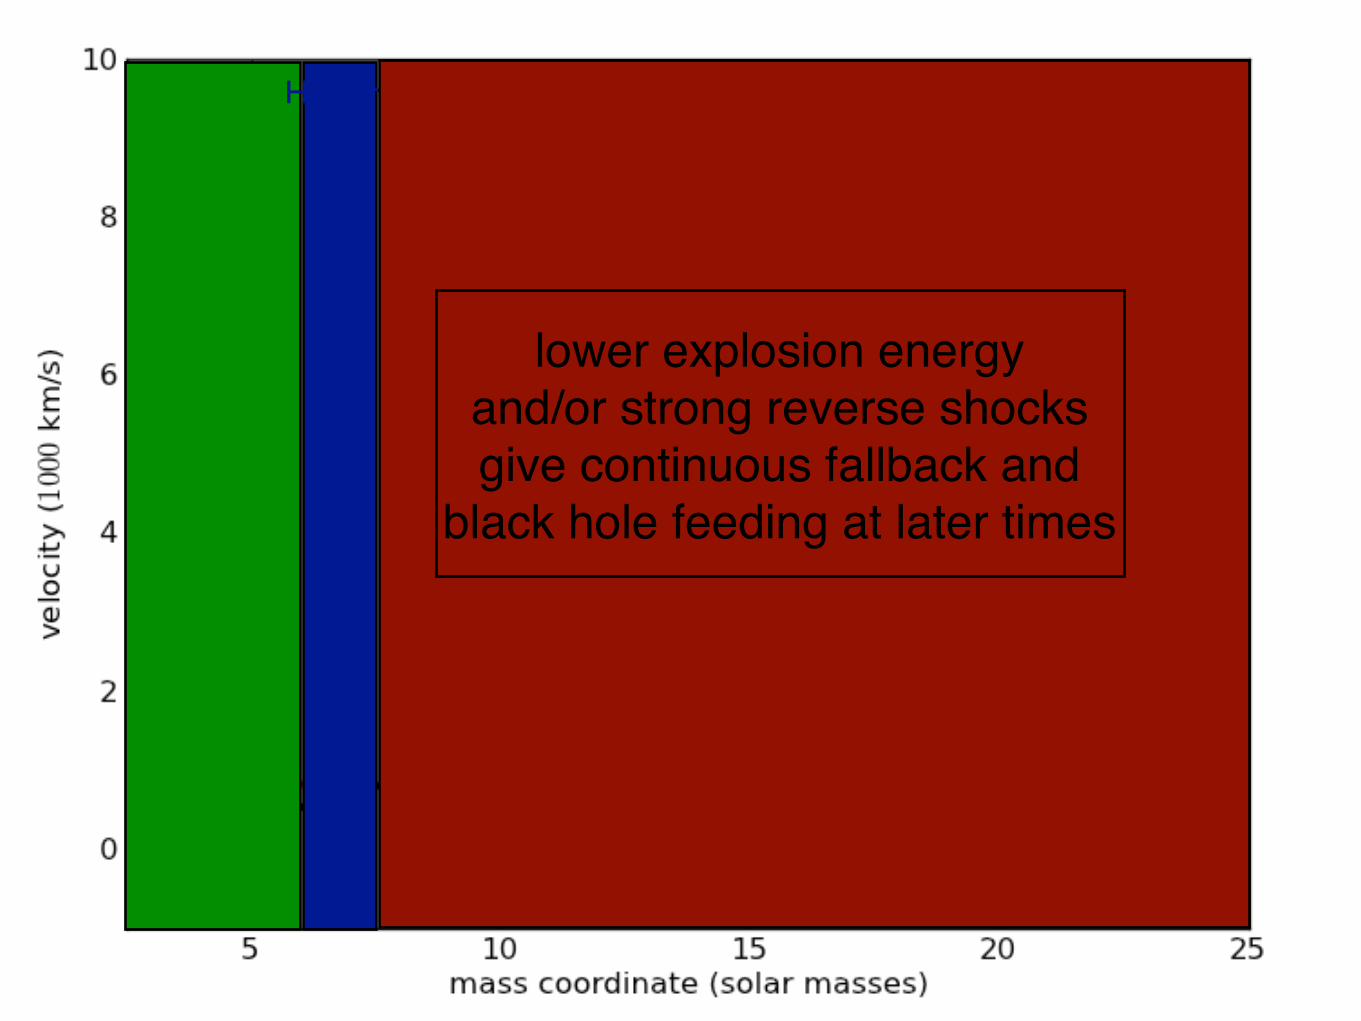
lower explosion energy and/or strong reverse shocksgive continuous fallback and
black hole feeding at later times

fallback accretion ratefrom low energy explosions of massive stars
red supergiant(Type II)
blue supergiant(Type II)
He star(Type Ib)
dexter and kasen (2013)quataert and kasen (2014)
LBH = ✏Mc2 ⇡ 1044 ergs s�1
✓✏
10�3
◆✓M
10�7M� s�1
◆
LBH ⇡ 1
2⇠Mv2w ⇡ 1045 ergs s�1
✓M
10�7M� s�1
◆✓vw0.1c
◆2
Eg ⇡ GM2
Rns⇡ 1053 ergs
Eke ⇡1
2Mv2 ⇡ 1051 ergs
Elc ⇡ L�t ⇡ 1049 ergs
Lni ⇡Mni✏nitni
e�td/tni
M ⇡ 10� 15 M�
L ⇡ 1042 � 1043 ergs s�1
td ⇡ 50� 150 days
Esn ⇡ 1� 10 B
R? ⇡ 1013 cm
Eth(t) = E0
R(t)
R0
��1
Lsn ⇡ Esn
td
Rsh
Rsn
�⇠ 1045 ergs s�1
Rsh
104 R�
�
Rsh ⇡ 104 R� ⇡ 1015 cm
tsh = Rsh/vsh = 2 years
100 km s�1
vsh
�
Lsn ⇡ Esn
td
R?
Rsn
�⇠ 1045 ergs s�1
R?
104 R�
�
td = ⌧
R
c
�= ⇢R
R
c
�⇠ M
Rc
1
Mdot ~ t -5/3
Accretion Powered Supernova Light Curves 5
where t0 ≡ (2Gρ0)−1/2 (cf. Eq. 2 of QK12). For α < 0,the enclosed mass is roughly constant, and the accretionrate is:
M =8π
3ρ0r3
0
t0
!t
t0
"(2α−3)/3
, (7)
where now t0 ≡ πr3/20 /
#2GM(r0). In this way, the
freefall accretion rate provides information about thedensity profile of the progenitor star.
For bound material with vesc ≃ v, the maximum ra-dius, r1 ≡ r0(1 − v2/v2
esc)−1, becomes much larger thanthe initial one, r0. Then the asymptotic fallback rate,M ∝ t−5/3, applies (Michel 1988; Chevalier 1989). Thisasymptotic scaling applies at the latest times in all threecurves in Figure 2. Using the ballistics solution fromChevalier (1989), we can bridge these two asymptoticlimits to analytically estimate the fallback accretion rateat all times for comparison with our numerical calcula-tions.
For each mass shell, the downstream shock velocity istaken from the analytic formulae in Matzner & McKee(1999), which are typically an excellent approximation tothe numerical calculations. Then the total fallback timefor each mass element can be calculated from Eq. 3.7 ofChevalier (1989), and its time derivative is an approxi-mate accretion rate. This assumes that pressure effectsare negligible, which is incorrect. However, the true ac-celeration measured from the numerical calculations de-scribed below turns out to usually be roughly half of thegravitational acceleration.
This ballistic estimate reproduces the fallback accre-tion rate at all times in many progenitors. However,in some cases (particularly blue supergiants such asSN1987A, Chevalier 1989) the reverse shock formed atthe hydrogen-helium interface is strong enough to decel-erate portions of the ejecta below the escape speed. Thisenhances the accretion rate at late times, and can sig-nificantly add to the remnant mass (Zhang et al. 2008).The reverse shock formation and evolution is analagousto that formed when the forward shock breaks out ofthe star and into the interstellar medium (e.g., McKee1974; Chevalier 1982). As the simplest possible reverseshock prescription, we solve the strong shock jump con-ditions for the reverse shock velocity and the downstreamvelocity at the boundary of 100% helium and hydrogenlayers: vRS ≤ v0 ≃ 0.6v. For simplicity, we take vRSto be constant at its initial value. Then the location ofintersection between ejecta and the reverse shock can befound, as well as the resulting ballistic t(M) for mate-rial that is recaptured after passing through the reverseshock. The reverse shock prescription is important forthe blue Z29 curve in Figure 2.
The ballistic approximation does a reasonable job re-producing the numerical calculations in all cases. Thelargest disagreement is in the reverse shock cases, wherethe semi-analytic accretion rate overestimates (underes-timates) the numerical results at early (late) times. Theresulting remnant mass vs. initial mass distribution fromthese explosions is in excellent agreement with Zhanget al. (2008).
4. POSSIBLE OUTCOMES
0 20 40 60 80 100Days since explosion
1041
1042
1043
1044
Lum
inos
ity (e
rgs
s-1)
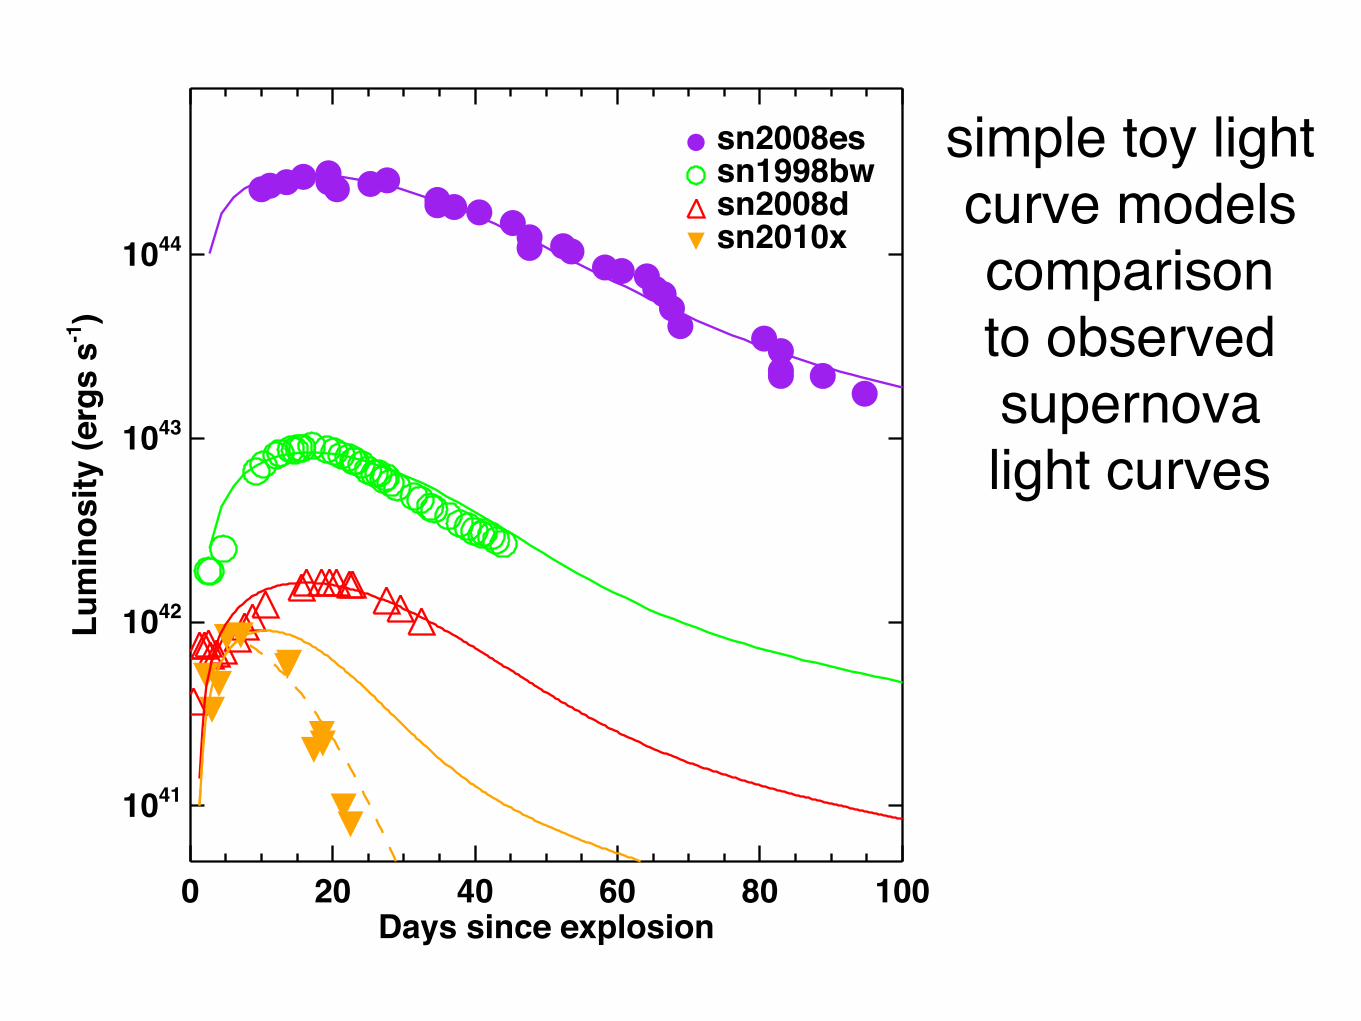
sn2008essn1998bwsn2008dsn2010x
Figure 5. Comparison of fallback powered light curves (solidlines) with some observed supernovae. The parameters for theseevents are given in Table 1. The orange dashed curve assumestoff = 7 days. Data points are taken from Gezari et al. (2009,SN 2008es), Mazzali et al. (2008, SN 1998bw and SN 2008D), andKasliwal et al. (2010, SN 2010X).
We explore possible outcomes for supernova lightcurves from the injection of accretion energy. A widerange of explosion energies is used for each progenitor toexplore the full range of possible outcomes. Only explo-sions with positive total energy at late times are consid-ered. Approximate one zone light curves are calculatedusing the methods described in Appendix A. For thesecalculations, we need the diffusion time:
td =$
34π
Mκ
vc=
%34π
(Mej + Mfb)κvfc
, (8)
where Mfb = ξ&
Mfbdt is the total outflow mass,Efb = ϵMfbc2 is the injected accretion energy, andvf =
#(Esn + Efb)/(Mej + Mfb) is the final ejecta ve-
locity. We assume an opacity κ = 0.2 g cm−1. Notethat there is an ambiguity in determining Mfb, depend-ing on the interpretation of the fudge factor ξ. If ξ in-dicates the fraction of outflow mass that interacts withthe supernova ejecta, then the above expression for Mfbapplies. If on the other hand, the mass transfer to theejecta is more efficient while the specific energy of theoutflow is lower, Mfb could be significantly larger.
From the light curves, we measure the time to peak,tp, and the peak luminosity, Lp. The results are shownin Figure 3 for ϵ = 10−3. Each point represents asingle explosion energy and progenitor model, color-coded by the radius of the pre-supernova star (red forR > 1013cm (RSGs), purple for 1012cm < R < 1013cm,blue for 1011cm < R < 1012cm (BSGs), and green forR < 1011cm (He or C/O stars). This radius also corre-sponds to the zero age main sequence metallicity: solarfor RSGs, zero for BSGs, and 10−4Z⊙ for stars in be-
simple toy lightcurve modelscomparisonto observedsupernovalight curves
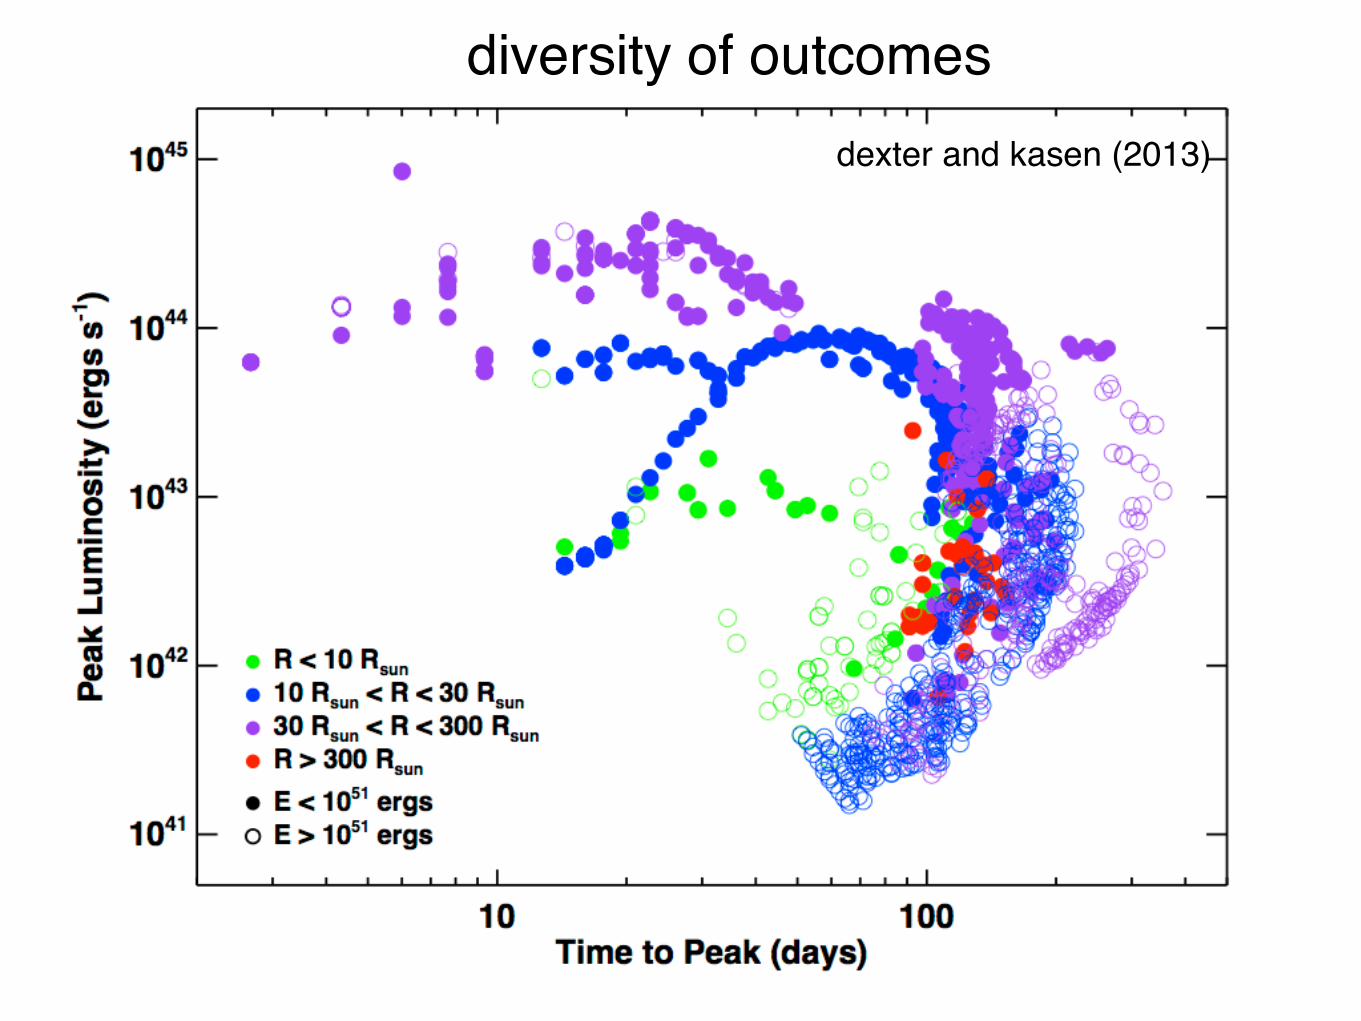
diversity of outcomesdexter and kasen (2013)
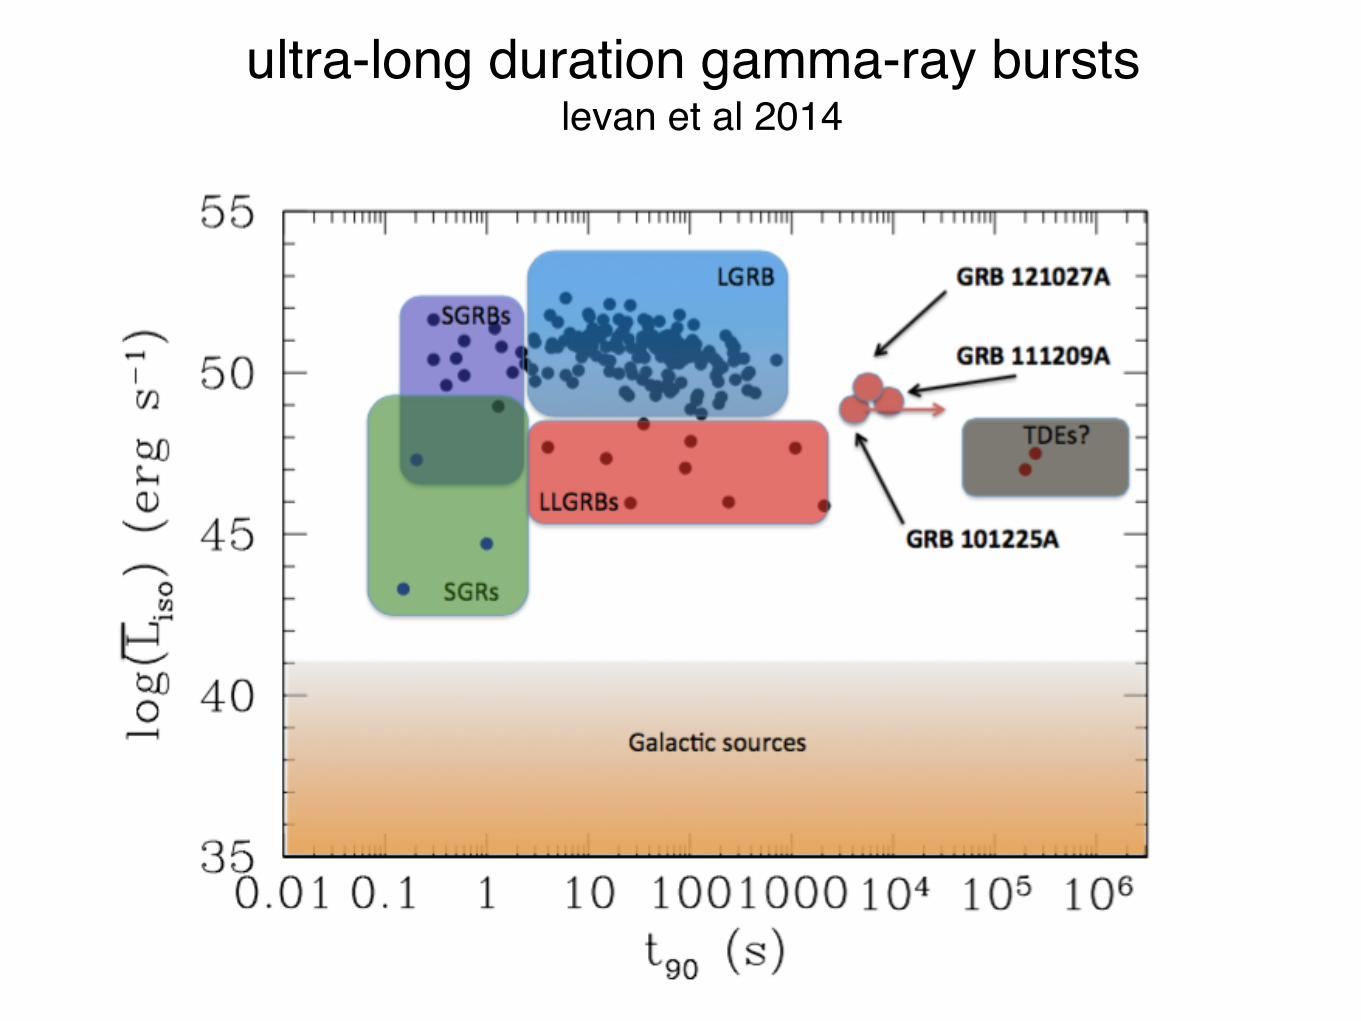
ultra-long duration gamma-ray burstslevan et al 2014
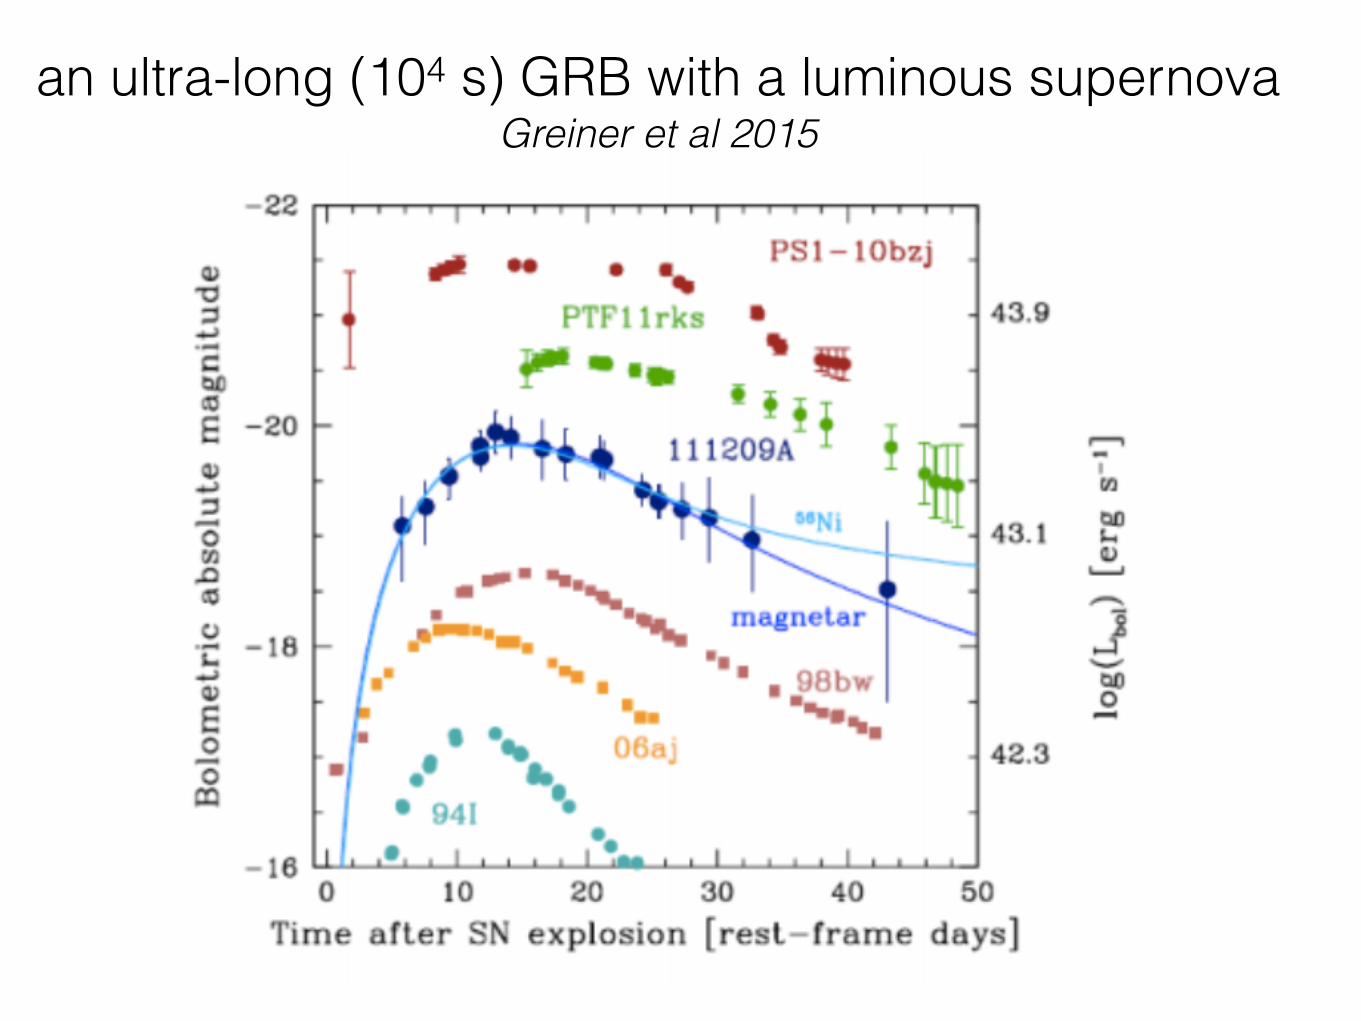
an ultra-long (104 s) GRB with a luminous supernova Greiner et al 2015
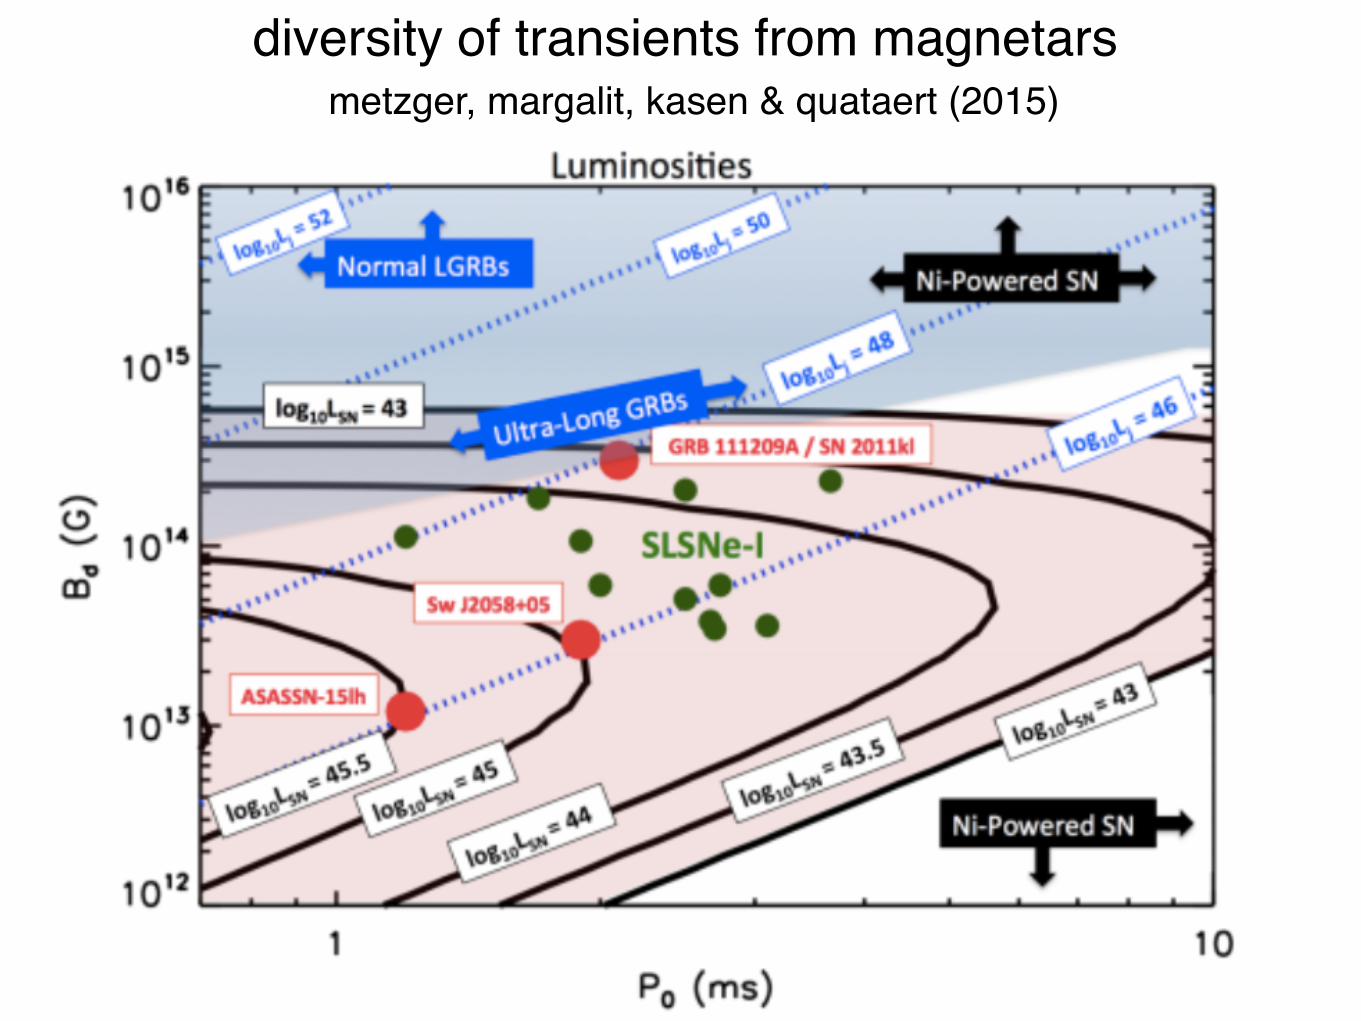
diversity of transients from magnetarsmetzger, margalit, kasen & quataert (2015)