WHAT MAKES THE THEATRE AUDIENCE RETURN? THE ROLE OF ... · The “service encounter” or...
13
ToSEE – Tourism in Southern and Eastern Europe, Vol. 4, pp. 423-435, 2017 A. Pap, J. Dlačić, M. Ham: WHAT MAKES THE THEATRE AUDIENCE RETURN? THE ROLE OF ... 423 WHAT MAKES THE THEATRE AUDIENCE RETURN? THE ROLE OF ENGAGEMENT IN PREDICTING FUTURE BEHAVIOR Ana Pap Jasmina Dlačić Marija Ham Received 5 April 2017 Revised 28 June 2017 Accepted 26 July 2017 https://doi.org/10.20867/tosee.04.38 Abstract Purpose – The purpose of this research is to explore the factors that influence the future behaviour of theatre audience. The authors hypothesized that the audience engagement could be the key factor and the answer to the question: What makes the theatre audience return? Methodology – The research was conducted on a sample of 537 respondents from Croatia that have visited either Croatian National Theatre in Osijek or in Rijeka in the past two years. This precondition was ensured through filter question on the beginning of the survey and 452 respondents have satisfied the precondition. The data was gathered through highly structured questionnaire designed based on scales and items adapted from previous research. Structural equation modelling (SEM) in LISREL was used to analyse the data. Findings – Research results suggest that future behaviour of theatre audience is positively influenced by perceived value of theatre performances and customer engagement. Contradictory to previous findings, quality of performance has no influence on future behaviour. Also, mediator effects are explored. Managerial implications are discussed and suggestions for marketing managers in theatres offered. Originality of the research – This research contributes to the development of the theory on customer engagement in general and in the context of non-profit marketing as well as theatre marketing. It provides the empirically based answers to research questions related to the predictive power of engagement as well as other suggested variables. The study also contributes to understanding the determinants of future behaviour of theatre audience in Croatia. Keywords Theatre audience, customer engagement, future behaviour, SEM INTRODUCTION Marketing in cultural institutions has the potential to contribute not only to the well- being of the specific institution but also to the society as a whole by raising its general cultural level and fostering economic growth based on creative industries. Also there is a great potential for it to contribute to the cultural tourism in the specific city and in the region which implies a potential multiplicative effect on the economy. For that reason, the role of marketing and it’s potentials in creative industries has gained great attention in academia research as well as in modern marketing practice in recent years. Boter (2005), Hill et al. (2003) and Heilbrun et al. (2001), claim that cultural institutions started using marketing in the 1970s with the aim to inform the public about upcoming events and to bring art closer to the audience. That was much simpler in those days because marketing was used only for one-way communication - to
Transcript of WHAT MAKES THE THEATRE AUDIENCE RETURN? THE ROLE OF ... · The “service encounter” or...
ToSEE – Tourism in Southern and Eastern Europe, Vol. 4, pp. 423-435, 2017
A. Pap, J. Dlačić, M. Ham: WHAT MAKES THE THEATRE AUDIENCE RETURN? THE ROLE OF ...
423
WHAT MAKES THE THEATRE AUDIENCE RETURN? THE ROLE OF ENGAGEMENT IN PREDICTING
FUTURE BEHAVIOR
Ana Pap
Jasmina Dlačić
Marija Ham
Received 5 April 2017
Revised 28 June 2017
Accepted 26 July 2017
https://doi.org/10.20867/tosee.04.38
Abstract
Purpose – The purpose of this research is to explore the factors that influence the future
behaviour of theatre audience. The authors hypothesized that the audience engagement could be
the key factor and the answer to the question: What makes the theatre audience return?
Methodology – The research was conducted on a sample of 537 respondents from Croatia that
have visited either Croatian National Theatre in Osijek or in Rijeka in the past two years. This
precondition was ensured through filter question on the beginning of the survey and 452
respondents have satisfied the precondition. The data was gathered through highly structured
questionnaire designed based on scales and items adapted from previous research. Structural
equation modelling (SEM) in LISREL was used to analyse the data.
Findings – Research results suggest that future behaviour of theatre audience is positively
influenced by perceived value of theatre performances and customer engagement. Contradictory
to previous findings, quality of performance has no influence on future behaviour. Also, mediator
effects are explored. Managerial implications are discussed and suggestions for marketing
managers in theatres offered.
Originality of the research – This research contributes to the development of the theory on
customer engagement in general and in the context of non-profit marketing as well as theatre
marketing. It provides the empirically based answers to research questions related to the
predictive power of engagement as well as other suggested variables. The study also contributes
to understanding the determinants of future behaviour of theatre audience in Croatia.
Keywords Theatre audience, customer engagement, future behaviour, SEM
INTRODUCTION
Marketing in cultural institutions has the potential to contribute not only to the well-
being of the specific institution but also to the society as a whole by raising its general
cultural level and fostering economic growth based on creative industries. Also there is
a great potential for it to contribute to the cultural tourism in the specific city and in the
region which implies a potential multiplicative effect on the economy. For that reason,
the role of marketing and it’s potentials in creative industries has gained great attention
in academia research as well as in modern marketing practice in recent years.
Boter (2005), Hill et al. (2003) and Heilbrun et al. (2001), claim that cultural
institutions started using marketing in the 1970s with the aim to inform the public
about upcoming events and to bring art closer to the audience. That was much simpler
in those days because marketing was used only for one-way communication - to
ToSEE – Tourism in Southern and Eastern Europe, Vol. 4, pp. 423-435, 2017
A. Pap, J. Dlačić, M. Ham: WHAT MAKES THE THEATRE AUDIENCE RETURN? THE ROLE OF ...
424
transfer certain information. Art that was shown in theatres, museums and other
cultural institutions was considered a better form of entertainment than the popular
forms of entertainment (i.e. television) and it was implied for such art to be financially
supported and attended by audience.
Since the beginning of the 1990s, implementation of marketing and management in
cultural institutions and art has become increasingly important and more complex and
there have been many examples of their quality and systematic practical
implementation (Pavičić et al. 2006). Carls (2012) indicates that marketing in culture
has to be concerned with both current and potential audience, and that this approach
should be implemented constantly and strategically. According to Šešić-Dragičević et
al. (2013), marketing in culture has one basic task and that is to create and expand the
market because business development of cultural institutions is often faced with the
obstacle of “non-existing market” i.e. the lack of audience.
In the field of marketing in culture, it is important to show and popularize cultural and
artistic achievement and to encourage people’s contact with art and works of art. It
means that it is necessary to explore “the distance between the producer and the
consumer”. The market-based approach to culture imposes a requirement to encourage
consumption in order to achieve higher economic profit of the institution whose
product is being sold (exhibition, performance, etc.). Also, cultural institutions should
not only think about how to attract more audience (selling tickets), but also about how
to make the audience a constant audience of cultural events – one which is able to react
and interact with the artwork (Šešić-Dragičeveć et al. 2013).
In the Republic of Croatia, many cultural institutions do not have special marketing
departments or marketing programs. One of the recent studies (Buljubašić 2015) has
shown that, for example, general managers of theatres have a certain "fear of
marketing", especially of unconventional marketing. Lack of experience and
knowledge in the use of unconventional marketing was identified as the biggest barrier
for implementing and using unconventional marketing in cultural institutions in Croatia
(Buljubašić et al. 2016).
Previous research point out that audience in cultural institutions does behave as
customers (Hand, 2011). In the focus of marketing managers of these institutions is
keeping the present consumers, as attracting new audience members is much more
difficult and expensive. The role of marketing research is therefore to provide
empirically based answers to the question: What makes the consumers return (to the
cultural institution)? The present research tries to address this issue and reveal the
factors that influence the future behaviour of theatre audience. The authors
hypothesized that the audience engagement could be the key factor as engaged
customer is experiencing co-creative customer experiences with a focal object and in
specific service relationships (Brodie et al. 2011). The research also examines the
direction and strength of the influence of overall value and core service quality on the
customer engagement. The data was gathered through highly structured questionnaire
designed based on scales and items adapted from previous research i. e. Vivek et al.
(2014), Danaher and Mattsson (1994), Kim et al. (2013).

ToSEE – Tourism in Southern and Eastern Europe, Vol. 4, pp. 423-435, 2017
A. Pap, J. Dlačić, M. Ham: WHAT MAKES THE THEATRE AUDIENCE RETURN? THE ROLE OF ...
425
This research contributes to the development of the theory on customer engagement in
general and in the context of non-profit marketing as well as theatre marketing. The
concept of the customer engagement has originally been developed and studied within
the profit-marketing domain (Gambetti et al. 2013; Vivek et al. (2014). However, based
on the notion that customer engagement is not necessarily related to purchasing
process, rather than the interaction process (van Doorn et al. 2010), the applicability
and explanatory ability of this concept is tested in a non-profit based research model.
Also according to Vivek et al. (2014), most of the scholarly work done on customer
engagement has been conceptual in nature, with empirical work as an exception. This
study provides the empirically based answers to research questions related to the
predictive power of engagement as well as other suggested variables. The study also
contributes to understanding the determinants of future behaviour of theatre audience in
Croatia thus giving useful information to the theatre (marketing) management and all
other stakeholders interested in fostering this type of behaviour (education institutions,
local government, NGO’s etc.).
1. LITERATURE REVIEW AND HYPOTHESES DEVELOPMENT
1.1. Service quality
The “service encounter” or “service experience” is the entire transaction received by
the customer (Dwyer et al. 1987; Tseng et al. 1999). When measuring the performance
of actual service versus perceived service, Zeithaml et al. (1988) suggests measuring
service quality. Service quality receives attention in research as more firms realize that
maintaining customers and maximizing customer satisfaction is key to long-term
relationships (Jiang and Wang 2006; Palmer and O’Neill 2003). Hoskins and
McFadyen (1991) suggest that more focus is required in understanding the roles of
service quality and also overall perceived value in the cultural industry.
Service quality includes aspects of functional process and technical quality (Gronroos
1990) and the performance of both core and peripheral services. For the performing
arts sector, the core services would be the display and performance of acts or skills in a
public performance (Moses 2001) as well as the servicescape factors that support its
display, i.e. the theatre and stage, stage setting, actors and actresses, lighting and audio
(Hume 2008, 350). Some previous research has analysed the role of service quality for
visitors’ overall satisfaction in theatre (Hill et al 2003; Kotler and Scheff, 2007) and
found that it has a significant influence in overall satisfaction. Hume (2008) conducted
a research on re-purchase intention in performing arts industry and found that
customers determine their re-purchase intention based on both core and peripheral
service quality, mediated by perceived value and customer satisfaction.
Service quality is a well-established construct (Cronin et al. 2000; Zeithaml et al. 1988)
yet the relationships of service quality to perceived value, satisfaction and customer
engagement are continually receiving attention and debate in the literature (Bahia et al.
2000). Van Doorn et al. (2010) assert that if service quality is diminished over time,
customers are less willing to be engaged. And opposite also stands. So, if service
quality is at constant level or rising, hence, making customers getting what they expect
ToSEE – Tourism in Southern and Eastern Europe, Vol. 4, pp. 423-435, 2017
A. Pap, J. Dlačić, M. Ham: WHAT MAKES THE THEATRE AUDIENCE RETURN? THE ROLE OF ...
426
they will be more prone to engage in different forms of behaviour. According to
aforementioned, the following hypothesis was developed:
H1: Core service quality has a positive influence on customer engagement.
1.2. Perceived value
According to Zeithaml et al. (1988, 14) perceived value is specifically defined “as the
benefit received by customers for the price of the service exchanged or the overall
utility of a product based on the perceptions of what is received and what is
exchanged”. Researchers so far have identified four general dimensions of perceived
value: low price, receiving what you want, quality for price and receiving what you
have paid for (Caruana et al. 2000; Zeithaml et al. 1988) thus for different consumers,
the components of perceived value might be differentially weighted.
Previous research has found perceived value to have a direct and encounter-specific
relationship to satisfaction (Patterson et al. 1997; Sweeney et al. 1999; Zeithaml et al.
1988). Voss et al. (1998) have found that perceived value is the most important
indicator of repurchase intent. Some previous research in service industry suggested
that perceived value measurements should be associated with measures of satisfaction
(Woodruff 1997; Ryu et al. 2008) and some research suggested that perceived value
plays a moderating role between service quality and satisfaction (Caruana et al. 2000;
Hume 2008). On the other side, according to Zeithaml (1988) perceived value
associates the benefits received with the price paid and is distinguished from service
quality and satisfaction. Cronin et al. (2000) in their research concluded that perceived
value, service quality and satisfaction are all directly related to behavioural intentions
when all of these variables are considered collectively. The results of their study further
suggested that the indirect effects of the service quality and perceived value constructs
enhanced their impact on behavioural intentions. Also, different influences based on
consumer-level like perceived costs/benefits i.e. value and satisfaction,
trust/commitment are perceived to be drivers of customer engagement behaviour (Van
Doorn et al. 2011). Similarly to service quality, if customers perceive they are getting
more value of a product or a service they are more willing to engage in different forms
of behaviour related to that company. Also, adding value in communication with
customers will enhance their engagement (Vivek, Beatty, Morgan, 2012). So,
considering the importance of perceived value, the following hypothesis was
developed:
H2: Perceived value has a positive influence on customer engagement.
1.3. Customer engagement
In modern marketing conditions, the problem of retaining customers and getting the
customers engaged is gaining importance. Accordingly raising efforts of researchers to
explain and understand the influential factors on customer engagement are evident.

ToSEE – Tourism in Southern and Eastern Europe, Vol. 4, pp. 423-435, 2017
A. Pap, J. Dlačić, M. Ham: WHAT MAKES THE THEATRE AUDIENCE RETURN? THE ROLE OF ...
427
Based on the dimensions and context observed, customer engagement appears in the
literature under different terms, the most common being customer engagement and
customer brand engagement. Customer engagement goes beyond purchase and is the
level of the customer’s (or potential customer’s) interactions and connections with the
brand or firm’s offerings or activities, often involving others in the social network
created around the brand/offering/activity. Engaged individuals include current as well
as prospective customers (Vivek et al. 2014). According to Gambetti et al. (2012),
customer engagement can be defined as a multidimensional concept that encompasses
different elements such as: attention, dialog, emotions, interactions, sensorial pleasure
and immediate activation aimed at creating a total brand experience with consumers.
Van Doorn et al. (2010) in his model of customer engagement mentioned: buyers
characteristics, economic entity’s initiatives and surroundings as variables and/or
moderators of customer engagement.
In the present research, the notion of customer engagement is grounded in the research
of Vivek et al. (2014). Following the expanded relationship metaphor and service-
dominant logic, a three-dimensional view of customer engagement is conceptualized,
including conscious attention, enthused participation, and social connection.
Conscious Attention is defined as the degree of interest the person has or wishes to
have in interacting with the focus of their engagement. Enthused Participation refers to
the zealous reactions and feelings of a person related to using or interacting with the
focus of their engagement. And finally, social connection is defined as enhancement of
the interaction based on the inclusion of others with the focus of engagement,
indicating mutual or reciprocal action in the presence of others (Vivek et al. 2014).
Grégoire et al. (2009) point out that customer engagement often leads to increased
loyalty, trust and commitment of consumers We can say that loyalty implies the
intention to purchase the product again or in this case, to revisit the cultural institution.
Also the intention to revisit is strongly based in trust and commitment, and therefore
we can hypothesize that customer engagement can influence the intention to visit the
cultural institution again. Therefore it can be hypothesised that:
H3: Customer engagement has a positive influence on behavioural intentions (to visit
the theatre again).
Based on previous literature review, following model is proposed.
Figure 1: Conceptual model
Source: Authors’ work
Core service
quality
Perceived
value
Customer
engagement
Behavioural
intentions (to visit
the theatre again)
ToSEE – Tourism in Southern and Eastern Europe, Vol. 4, pp. 423-435, 2017
A. Pap, J. Dlačić, M. Ham: WHAT MAKES THE THEATRE AUDIENCE RETURN? THE ROLE OF ...
428
2. METHODOLOGY
2.1. Sample and sampling procedure
Research included individuals that visited Croatian national theatre in Osijek and
Croatian national theatre Ivan pl. Zajc in Rijeka. Theatres were selected based on
population area they attract. As purposive sampling was used in order to distinguish
between respondents relevant for research they were selected based on selection
criteria. Selection criteria included a question at the beginning of the questionnaire
stating “Have you visited a performance in national theatre in past two years?”
Sample was collected using online created questionnaire with Limesurvey using snow-
ball sampling technique. Data was collected from February till October 2016. A total of
537 respondents were included in original sample, where 50.5% respondents are from
Rijeka, and 49.5% of respondents are from Osijek. After applying selection criteria of
visiting national theatre in past two years sample was 452 with 51.5% of respondents
that visited Croatian national theatre in Osijek, and 48.5% of respondents that visited
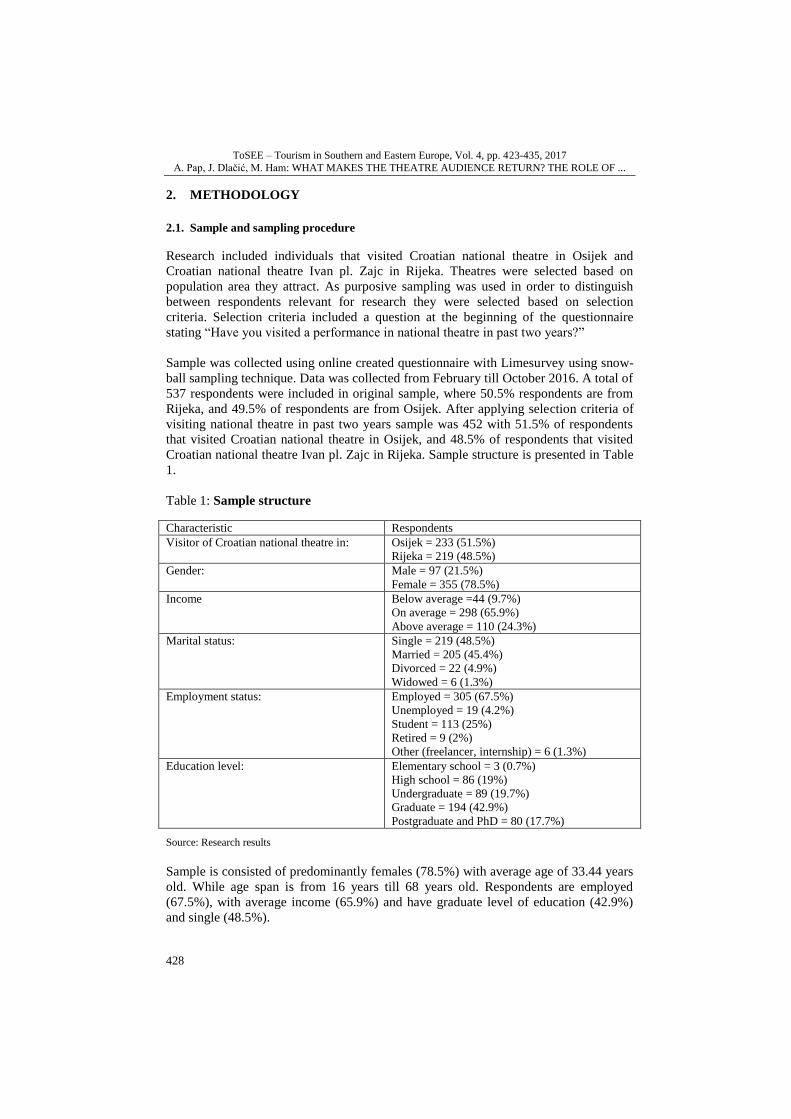
Croatian national theatre Ivan pl. Zajc in Rijeka. Sample structure is presented in Table
1.
Table 1: Sample structure
Characteristic Respondents
Visitor of Croatian national theatre in: Osijek = 233 (51.5%)
Rijeka = 219 (48.5%)
Gender: Male = 97 (21.5%)
Female = 355 (78.5%)
Income Below average =44 (9.7%)
On average = 298 (65.9%)
Above average = 110 (24.3%)
Marital status: Single = 219 (48.5%)
Married = 205 (45.4%)
Divorced = 22 (4.9%)
Widowed = 6 (1.3%)
Employment status: Employed = 305 (67.5%)
Unemployed = 19 (4.2%)
Student = 113 (25%)
Retired = 9 (2%)
Other (freelancer, internship) = 6 (1.3%)
Education level: Elementary school = 3 (0.7%)
High school = 86 (19%)
Undergraduate = 89 (19.7%)
Graduate = 194 (42.9%)
Postgraduate and PhD = 80 (17.7%)
Source: Research results
Sample is consisted of predominantly females (78.5%) with average age of 33.44 years
old. While age span is from 16 years till 68 years old. Respondents are employed
(67.5%), with average income (65.9%) and have graduate level of education (42.9%)
and single (48.5%).

ToSEE – Tourism in Southern and Eastern Europe, Vol. 4, pp. 423-435, 2017
A. Pap, J. Dlačić, M. Ham: WHAT MAKES THE THEATRE AUDIENCE RETURN? THE ROLE OF ...
429
2.2. Measures
In building a conceptual model, scales from previous research were used. The data was
gathered through highly structured questionnaire designed based on scales and items
adapted from previous research. Core service quality was measured based on Danaher
and Mattsson (1994) research, overall value used Kim et al. (2013), customer
engagement was based on Vivek et al. (2014) and future behavioural intentions
borrowed item from Garbarino and Johnson (1999). Item measuring behavioural
intentions is “In future I plan to attend shows at HNK”. All the aforementioned
measures used a 7-point Likert-type scale, anchored with ‘strongly disagree’ (1) and
‘strongly agree’ (7). The second part of the questionnaire presented respondents’
demographic information.
3. RESEARCH RESULTS
In analyzing research results respondents attending different theatres were analyzed
together. Following procedure for testing structural models (Anderson and Gerbing
1988) firstly confirmatory factor analysis (hereinafter, CFA) was done to check all
measures that we could apply structural equation modelling. The maximum likelihood
estimation procedure in LISREL 8.8 was used with covariance matrix as input.
Most of the fit indices for proposed theoretical model are of acceptable fit (χ2=209.575,
p=0.000; df=63; χ2/df=3.3; RMSEA=0.072; NNFI=0.970; CFI=0.970; SRMR=0.044)
according to Diamantopoulos and Siguaw’s (2000) suggestions of acceptable fit. Only,
χ2/df index rises concern about model acceptable fit as this ratio is above threshold of 3
(Kline, 2005) but below threshold suggested by Wheaton et al (1977). The reliability
and validity are also analyzed. Cronbach's alphas are above acceptable level of 0.7
(Nunnally 1978) for all constructs except for Social connection in Customer
engagement construct (α=0.666). But following Kline (2000) suggestion Cronbach's
alphas below 0.7 are acceptable. Also, Construct reliability (CR) and Average variance
extracted (AVE) were used as additional measures of reliability (Fornell and Larcker
1981). Lowest CR value is 0.724, and lowest AVE value is 0.585. Hence, also all CR
and AVE values are at acceptable level (Table 2). Bagozzi and Yi (1988) suggest
minimal value for CR to be 0.6, and Fornell and Larcker (1981) suggest threshold for
AVE to be 0.5, hence, all CR and AVE’s are above minimal threshold.
Convergent validity is also met as all t-values of indicator loadings are statistically
significant. This supports convergent validity in measures (Bagozzi and Yi 1988).
Also, all AVE measures are greater than 0.5 also indication according to MacKenzie et
al. (2011) convergent validity. For assessing discriminant validity we used Fornell and
Larcker (1981) criterion that all AVE scores should be greater than the square of the
correlations between constructs. Hence, discriminant validity is met for all constructs
except for Enthused participation in Customer engagement construct as squared
correlations for this constructs are above AVE value (Table 3). Additionally, we
performed 2 difference tests between all dimensions of Customer engagement
according to MacKenzie, Podsakoff and Podsakoff (2011). When the unconstrained
model achieves an 2 value lower than that of the constrained model, this means that

ToSEE – Tourism in Southern and Eastern Europe, Vol. 4, pp. 423-435, 2017
A. Pap, J. Dlačić, M. Ham: WHAT MAKES THE THEATRE AUDIENCE RETURN? THE ROLE OF ...
430
traits are not perfectly correlated and that discriminant validity is achieved (Bagozzi &
Phillips, 1982, p. 476). Results of 2 difference tests are presented in Table 4. Results
indicate that discriminant validity is present among constructs that are belonging to the
same higher-order construct Customer engagement as difference among constrained
and unconstrained model is statistically significant. So, it was decided to proceed with
analysis.
Table 2: CFA Measurement model results
Factor Items St.
loadings T-value CR AVE Alpha
Overall
value
Audience on HNK* shows
react positively.
HNK is a theatre that
everyone should visit.
Visiting HNK is a good
experience.
0.730
0.856
0.940
-
16.926
17.835
0.876 0.705 0.860
Core
service
I was happy with the actors,
stage and shows in HNK. 0.865 24.548 0.912 0.775 0.911
quality
The shows are what I
expected.
The shows are entertaining and
professional.
0.874
0.902
-
26.380
Conscious Anything related to HNK
grabs my attention. 0.873 - 0.754 0.609 0.741
attention
(CE**)
I like to learn more about
HNK. 0.675 14.563
Enthused
participa-
tion (CE)
I am heavily into HNK.
I am passionate about HNK.
I would not be the same if I
don’t go to HNK.
0.877
0.773
0.657
18.262
-
13.779
0.816 0.600 0.811
Social
connecti-
on (CE)
I enjoy going to HNK more
when I am with others.
HNK is more fun when other
people around me go too.
0.939
0.535
-
3.408
0.724 0.585 0.666
Note: *For respondents that go to Croatian national theatre in Osijek abbreviation HNK Osijek was used; while for respondents that go to Croatian national theatre Ivan pl. Zajc in Rijeka abbreviation HNK Zajc was
used.
** CE = Customer engagement
Source: Authors’ work

ToSEE – Tourism in Southern and Eastern Europe, Vol. 4, pp. 423-435, 2017
A. Pap, J. Dlačić, M. Ham: WHAT MAKES THE THEATRE AUDIENCE RETURN? THE ROLE OF ...
431
Table 3: Correlation matrix and discriminant validity
Constructs 1 2 3 4 5 6
Conscious attention (CE) 0.609 0.745 0.004 0.333 0.255 0.340
Enthused participation (CE) 0.863 0.600 0.001 0.282 0.178 0.223
Social connection (CE) 0.066 -0.024 0.584 0.032 0.034 0.038
Behavioural intentions 0.577 0.531 0.179 1 0.281 0.339
Core service quality 0.505 0.422 0.185 0.530 0.775 0.696
Overall value 0.583 0.472 0.196 0.582 0.834 0.716
Note: Correlations are below diagonal, squared correlations are above the diagonal, and AVE estimates are
presented on the diagonal.
Source: Authors’ work
Table 4: 2 difference tests between pairs of latent constructs in Customer
engagement
Pairs of latent constructs 2 difference test (D2)
Conscious attention (CE) - Enthused
participation (CE) (1) = 277.89 – 264.92 = 12.97**
Conscious attention (CE) - Social
connection (CE) (1) = 435.38 – 253.43 = 181.95**
Enthused participation (CE) - Social
connection (CE) (1) = 499.65 – 251.64 = 248.01**
Note: **p<0.01
Source: Authors’ work
After testing measures in conceptual model, analysis was continued with testing
structural relationships. Results are presented in Table 5.
Table 5: Hypotheses assessment
Relationships St. path
coefficients t-value
Perceived value Customer engagement (H1) 0.113 1.162
Core service quality Customer engagement (H2) 0.565 5.736**
Customer engagement Behavioural intentions (H3) 0.687 13.725**
**p<0.01 *p<0.005 critical t-values are 1.645 and 2.325 for a=0.05 and a=0.01 respectively 1-tail test
Source: Authors’ work
In assessing these relationships the first step was inspection of fit indices. Fit indices
for proposed theoretical model are of a low fit (χ2=196.270, p=0.000; df=33;
χ2/df=5,9; RMSEA=0.108; NNFI=0.955; CFI=0.967; SRMR=0.069). Especially χ2/df
and RMSEA index indicate low goodness of fit. So, conclusions regarding our
conceptualized model should be taken with cautions as model failed to achieve
acceptable fit. Nonetheless we just point out results related to our stated hypotheses not

ToSEE – Tourism in Southern and Eastern Europe, Vol. 4, pp. 423-435, 2017
A. Pap, J. Dlačić, M. Ham: WHAT MAKES THE THEATRE AUDIENCE RETURN? THE ROLE OF ...
432
forming their acceptance or refusal. Following the results obtained through SEM
assessment, H1 results are statistically not significant (γ = 0.113; t = 1.162; p>0.05).
Hence, no relationship between Perceived value and Customer engagement is
established. H2 results indicate a statistically significant relationship among researched
constructs (γ = 0.565; t = 5.736; p< 0.01) implying a positive influence of Core service
quality on Customer engagement. In addition, H3 (i.e. positive relationship between
Customer engagement and Behavioural intentions (to visit the theatre again)) results
also indicate a statistically significant relationship among researched constructs (β =
0.687; t = 2.95; p < 0.01).
CONCLUSION
This research applies the theory on customer engagement in the context of non-profit
marketing, or more specifically, theatre marketing. It provides the empirically based
answers to research questions related to the predictive power of engagement as well as
other suggested variables. The study also contributes to understanding the determinants
of future behaviour of theatre audience in Croatia. Firstly, it pointed out that core
service quality is contributing to customers i.e. audience to be and feel more engaged.
With having this in mind, managers of cultural institutions should emphasise quality of
shows, actors and performances in order to positively affect customer engagement, and
consequently to have loyal customers. Secondly, it confirms that engaged theatre
audience contributes to increasing audience willingness to visit theatre again, hence,
reinforcing their loyalty. This is in line with previous results pointing out (Vivek et al.
2014), but it emphasizes this relationship in cultural institutions. Therefore the focus of
marketing in cultural institutions should be on various engagement strategies.
Marketing managers should strive to provide platforms and venues (i.e. online) for
customers to share experiences and views and to enhance advocacy and positive word-
of-mouth. In this way cultural institutions will drive more attention from audiences and
more participation of consumers in different events is also possible to happen. At the
same time this can contribute to the engagement per se. This would lead to a more
credible communication as well as to greater involvement of customers (audience) in
the value creation process.
This research, as all research, is not without limitations. They are noticed in sample
structure, predominant number of females, and focusing just on two theatres in one
country. Also the research captured rather general attitudes and perceptions of visitors
on the theater offer which means that the attitudes on specific elements of that offer
were not measured. Since different elements, different types of shows and types of
production (shows produced by home theatre or guest shows) can be differently
evaluated, it would be beneficial in future research to capture these attitudes with more
specific approach and more detail.
For further research it would be interesting to explore if there is really a difference
between males and females regarding customer engagement in cultural institutions, and
to explore if personality traits can influence customer engagement. Also, some cultural
institutions are using unconventional advertising, while others are focused on
traditional advertising media. It would be interesting to explore if this influences

ToSEE – Tourism in Southern and Eastern Europe, Vol. 4, pp. 423-435, 2017
A. Pap, J. Dlačić, M. Ham: WHAT MAKES THE THEATRE AUDIENCE RETURN? THE ROLE OF ...
433
customer engagement. Furthermore, future research in the field could strive to
investigate the contribution to the cultural tourism. It would be beneficial to consider
the possible multiplicative positive effect on the local economy through analysing the
specific groups within the audience that live elsewhere in Croatia or abroad and have
visited the specific theatre as a part of their visit to one of these cities. Another
interesting notion in this regard is to determine the primary attraction factor (theatre or
something else) and how the theatre can strengthen its position in the cultural tourism
context. And finally, one more recommendation for future research could be to analyse
the relationship between core service quality and perceived value.
ACKNOWLEDGEMENTS
This paper has been financially supported by the University of Rijeka for project ZP
UNIRI 2/16.
REFERENCES
Bagozzi, R.P. and Phillips, L.W. (1982), “Representing and testing organizational theories: a holistic construal”, Administrative Science Quarterly, Vol. 27, No. 3, pp. 459-489. doi: 10.2307/2392322
Bagozzi, R.P. and Yi, Y. (1988), “On the evaluation of structural equation models”, Journal of the academy
of marketing science, Vol. 16, No. 1, pp. 74–94. doi: https://doi.org/10.1007/BF02723327 Bahia, K., Paulin, M. and Perrien, J. (2000), “Reconciliating literature about client satisfaction and perceived
service quality”, Journal of Professional Services Marketing, Vol. 27, No. 2, pp. 21-41. doi:
https://doi.org/10.1300/J090v21n02_03 Boter, J. (2005), Market structures in arts and entertainment, Vrije universiteit, Amsterdam, Netherlands.
Brodie, R. J., Hollebeek, L. D., Jurić, B., and Ilić, A. (2011), “Customer engagement: conceptual domain,
fundamental propositions, and implications for research”, Journal of Service Research, Vol. 14, No. 3, pp. 252-271. doi: https://doi.org/10.1177/1094670511411703
Buljubašić, I. (2015), “Impact of unconventional advertising on performance of cultural institutions in city of
Osijek”, Proceedings of an Interdisciplinary Management Research XI. Opatija: Faculty of Economics in Osijek. pp. 1097-1105.
Buljubašić, I., Ham, M. and Pap, A. (2016), “Factors influencing the implementation of unconventional
marketing in cultural institutions – evidence from Croatia”, Scientific Annals of Economics and Business, Vol. 63, No. 2, pp 247-272. doi: https://doi.org/10.1515/saeb-2016-0120
Caruana, A., Money, A.H. and Berthon, P.R. (2000), “Service quality and satisfaction: the moderating role of
value”, European Journal of Marketing, Vol. 34, No. 11/12, pp. 1338–1352. doi: https://doi.org/10.1108/03090560010764432
Cronin, J. J., Brady, M. K. and Hult, G. T. M. (2000), “Assessing the Effects of Quality, Value, and
Customer Satisfaction on Consumer Behavioral Intentions in Service Environments”, Journal of
Retailing, Vol. 76, No. 2, pp. 193-218. doi: https://doi.org/10.1016/S0022-4359(00)00028-2
Danaher, P.J. and Mattsson, J. (1994), "Cumulative Encounter Satisfaction in the Hotel Conference Process",
International Journal of Service Industry Management, Vol. 5, No. 4, pp. 69-80. doi: https://doi.org/10.1108/09564239410068715
Diamantopoulos, A. and Siguaw, J. (2000), Introducing LISREL, SAGE publications, London, UK.
Dwyer, F.R., Schurr, P.H. and Oh, S. (1987), “Developing buyer-seller relationships”, Journal of Marketing, Vol. 51, No. 2, pp. 11-27. doi: https://doi.org/10.2307/1251126
Fornell, C. and Larcker, D.F. (1981), “Structural equation models with unobservable variables and
measurement error: Algebra and statistics”, Journal of Marketing Research, Vol. 18, No. 3, pp. 382-388. doi: https://doi.org/10.2307/3150980
Gambetti, R., Graffigna, G. and Biraghi, S. (2012), “The grounded theory approach to consumer-brand
engagement”, International Journal of Market Research, Vol. 5, No. 54, pp. 659-687. doi: https://doi.org/10.2501/IJMR-54-5-659-687

ToSEE – Tourism in Southern and Eastern Europe, Vol. 4, pp. 423-435, 2017
A. Pap, J. Dlačić, M. Ham: WHAT MAKES THE THEATRE AUDIENCE RETURN? THE ROLE OF ...
434
Grégoire, Y., Tripp, T. and Legoux, R. (20099, “When Customer Love Turns into Lasting Hate: The Effects
of Relationship Strength and Time on Customer Revenge and Avoidance”, Journal of Marketing,
Vol. 73, No. 6, pp. 18-32. doi: https://doi.org/10.1509/jmkg.73.6.18 Gronroos, C. (1990), “Relationship approach to marketing in service contexts: the marketing and
organizational behavior interface”, Journal of Business Research, Vol. 20, No. 1, pp. 3-11. doi:
https://doi.org/10.1016/0148-2963(90)90037-E Hand, C. (2011), “Do arts audiences act like consumers?”, Managing Leisure, Vol. 16, No. 2, pp. 88-97. doi:
https://doi.org/10.1080/13606719.2011.559088
Heilbrun, J. and Gray, C. (2001), The Economics of Art and Culture: An American perspective, Cambridge University Press, Cambridge.
Hill, E., O'Sullivan, C. and O'Sullivan, T. (2003), Creative Arts Marketing, Butterworth, Oxford.
Hoskins, C. and McFadyen, S. (1991), “International marketing strategies for a cultural services”, International Marketing Review, Vol. 8, No. 2. doi: https://doi.org/10.1108/02651339110145117
Hume, M. (2008), “Understanding core and peripheral service quality in customer repurchase of the performing arts”, Journal of service theory and practice, Vol. 18, No. 4, pp. 349-369. doi:
https://doi.org/10.1108/09604520810885608
Jiang, Y. and Wang, C.L. (2006), “The impact of affect on service quality and satisfaction: the moderation of service contexts”, The Journal of Services Marketing, Vol. 20, No. 4, pp. 211-218.
doi: https://doi.org/10.1108/08876040610674562
Kim, S. H., Holland, S., and Han, H. S. (2013), “A structural model for examining how destination image, perceived value, and service quality affect destination loyalty: A case study of Orlando”,
International Journal of Tourism Research, Vol. 15, No. 4, pp. 313-328.
doi: https://doi.org/10.1002/jtr.1877 Kline, P. (2000), The handbook of psychological testing, Psychology Press, Florence, KY.
Kline, R.B. (2005), Principles and Practice of Structural Equation Modeling (2nd Edition ed.), The Guilford
Press, New York, USA. Kotler P. and Scheff J. (2007), Standing Room Only. Strategies for Marketing the Performing Arts, Harvard
Business School Press, Boston, USA.
MacKenzie, S.B., Podsakoff, P.M. and Podsakoff, N.P. (2011), “Construct measurement and validation procedures in MIS and behavioral research: Integrating new and existing techniques”, MIS
Quarterly, Vol. 35, No. 2, pp. 293-334.
Moses, S. (2001), “Have a plan and make the most of arts and culture”, Public Management, Vol. 83, No. 1, pp. 18-21.
Nunnally, J. (1978), Psychometric methods, McGraw-Hill, New York.
Palmer, A. and O’Neill, M. (2003), “The effects of perceptual processes on the measurement of service quality”, The Journal of Services Marketing, Vol. 17, No. 2/3, pp. 254-64.
doi: https://doi.org/10.1108/08876040310474819
Patterson, P.G., Johnson, L.W. and Spreng, R.A. (1997), “Modeling the determinants of customer satisfaction for business-to-business, professional services”, Journal of Academy of Marketing Science, Vol.
3, pp. 4-17. doi: https://doi.org/10.1007/BF02894505
Pavičić, J., Alfirević, N. and Aleksić, LJ. (2006), Marketing i menadžment u kulturi i umjetnosti, Masmedia, Zagreb, Croatia.
Ryu, K., Han H. and Kim, T-H. (2008). “The relationships among overall quick-casual restaurant image,
perceived value, customer satisfaction, and behavioural intentions”, International Journal of Hospitality Management, Vol. 27, pp. 459–469. doi: https://doi.org/10.1016/j.ijhm.2007.11.001
Šešić-Dragičević, M. and Stojković, B. (2013), Kultura- menadžment, animacija-marketing, KIC, Zagreb,
Croatia. Sweeney, J.C., Soutar, G.N. and Johnson, L.W. (1999), “The role of perceived risk in the quality-value
relationship: a study in a retail environment”, Journal of Retailing, Vol. 75, No. 1, pp. 77-105.
doi: https://doi.org/10.1016/S0022-4359(99)80005-0 Tseng, M.M., Qinhai, M. and Su, C.J. (1999), “Mapping customers’ service experience for operations
improvement”, Business Process Management Journal, Vol. 5, No. 1, p. 50.
doi: https://doi.org/10.1108/14637159910249126 Van Doorn, J., Lemon, K.N., Mittal, V., Nass, S, Pick, D., Pirner, P. and Verhoef, P.C. (2010), “Customer
Engagement Behavior: Theoretical Foundations and Research Directions”, Journal of Service
Research, Vol. 13, pp. 253-266. doi: https://doi.org/10.1177/1094670510375599 Vivek, S. D., Beatty, S. E., Dalela, V., and Morgan, R. M. (2014), “A generalized multidimensional scale for
measuring customer engagement” Journal of Marketing Theory and Practice, Vol. 22, No. 4, pp.
401-420. doi: https://doi.org/10.2753/MTP1069-6679220404

ToSEE – Tourism in Southern and Eastern Europe, Vol. 4, pp. 423-435, 2017
A. Pap, J. Dlačić, M. Ham: WHAT MAKES THE THEATRE AUDIENCE RETURN? THE ROLE OF ...
435
Voss, G.B., Parasuraman, A. and Grewal, D. (1998), “The role of price, performance, and expectations in
determining satisfaction in service exchanges”, Journal of Marketing, Vol. 62, pp. 46-62. doi:
https://doi.org/10.2307/1252286 Wheaton, B., Muthen, B., Alwin, D.F. and Summers, G. (1977), "Assessing Reliability and Stability in Panel
Models," Sociological Methodology, Vol. 8, No. 1, pp. 84-136.
doi: https://doi.org/10.2307/270754 Woodruff, RB. (1997), Customer value: The next source for competitive edge. Journal of the Academy of
Marketing Science, Vol. 25, No. 2, pp. 139–153. doi: https://doi.org/10.2307/1252286
Zeithaml, V.A., Berry, L.L. and Parasuraman, A. (1988), “Communication and control processes in the delivery of service processes”, Journal of Marketing, Vol. 52, pp. 35-48.
doi: https://doi.org/10.2307/1251263
Ana Pap, mag.oec., Teaching Assistant
University of J.J. Strossmayer, Faculty of economics
Department for Marketing
Trg Ljudevita Gaja 7, 31000 Osijek, Croatia
Phone: +385-31-224-400
E-mail: [email protected]
Jasmina Dlačić, PhD, Assistant Professor
University or Rijeka, Faculty of economics
Department for Marketing
Ivana Filipovića 4, 51000 Rijeka, Croatia
Phone: +385-51-355169
E-mail: [email protected]
Marija Ham, PhD, Associate Professor
University of J.J. Strossmayer, Faculty of economics
Department for Marketing
Trg Ljudevita Gaja 7, 31000 Osijek, Croatia
Phone: +385-31-224-400
E-mail: [email protected]