What Makes an Entrepreneur?andrewoswald.com/docs/entrepre.pdfWhat Makes An Entrepreneur?" For many...
58
What Makes an Entrepreneur? David G. Blanchflower and Andrew J. Oswald Dartmouth College and NBER and Warwick University To appear in Journal of Labor Economics, 1998, 16(1), pp. 26-60 This is an extended and revised version of NBER Working Paper # 3252. We thank the ESRC and the UK Department of Employment for financial assistance. The project has had a long gestation period (the first version was circulated in 1988). Helpful suggestions were made by participants in seminars at Cambridge (UK), LSE, Harvard, Dartmouth, Aberdeen, Glasgow, Guelph, McMaster, Oxford, the London Business School, Swansea, Uppsala, FIEF (Stockholm), and Warwick, and by Peter Abell, Graham Beaver, Joan Beaver, Fran Blau, George Borjas, Mark Casson, Andrew Clark, Robert Cressy, Peter Elias, Roger Gordon, Al Gustman, Tom Holmes, Peter Johnson, Bruce Meyer, Chris Pissarides, Gavin Reid, David Storey, Steve Venti, Alex Zanello, and a referee.
Transcript of What Makes an Entrepreneur?andrewoswald.com/docs/entrepre.pdfWhat Makes An Entrepreneur?" For many...
What Makes an Entrepreneur?
David G. Blanchflower
and
Andrew J. Oswald
Dartmouth College and NBER
and
Warwick University
To appear in Journal of Labor Economics, 1998, 16(1), pp. 26-60
This is an extended and revised version of NBER Working Paper # 3252. We thank the ESRC andthe UK Department of Employment for financial assistance. The project has had a long gestation period(the first version was circulated in 1988). Helpful suggestions were made by participants in seminars atCambridge (UK), LSE, Harvard, Dartmouth, Aberdeen, Glasgow, Guelph, McMaster, Oxford, theLondon Business School, Swansea, Uppsala, FIEF (Stockholm), and Warwick, and by Peter Abell,Graham Beaver, Joan Beaver, Fran Blau, George Borjas, Mark Casson, Andrew Clark, RobertCressy, Peter Elias, Roger Gordon, Al Gustman, Tom Holmes, Peter Johnson, Bruce Meyer, ChrisPissarides, Gavin Reid, David Storey, Steve Venti, Alex Zanello, and a referee.
Abstract
The factors that affect the supply of entrepreneurs are important
but poorly understood. We study a sample of individuals who
choose either to be employees or to run their own businesses.
Four conclusions emerge. First, consistent with the existence of
borrowing constraints on potential entrepreneurs, we find that
the probability of self-employment depends markedly upon
whether the individual ever received an inheritance or gift.
Second, when directly questioned in interview surveys, potential
entrepreneurs say that raising capital is their principal problem.
Third, consistent with our theoretical framework's predictions,
the self-employed have higher levels of job and life satisfaction
than employees. Fourth, childhood personality measurements
and psychological test scores are of almost no help in predicting
who runs their own business later in life. It is access to start-up
capital that matters.
What Makes An Entrepreneur?
" For many commentators this is the era of theentrepreneur. After years of neglect, those who start andmanage their own businesses are viewed as popularheroes. They are seen as risk-takers and innovators whoreject the relative security of employment in largeorganizations to create wealth and accumulate capital.Indeed, according to many, economic recovery ... islargely dependent upon their ambitions and efforts."
(Robert Goffee and Richard Scase (1987), p.1.))
1. Introduction
Most Western governments provide encouragement and tax breaks to those
who run small businesses. Politicians appear to believe that there are undesirable
impediments to the market supply of entrepreneurship. Despite media and political
interest in this topic, however, economists have contributed relatively little to the
debate about how the economy generates successful small businesses. It has long
been noted that economics textbooks largely ignore the role of the entrepreneur and
say little about the formation of the small enterprises that provide the beginnings of
giant corporations.
The simplest kind of entrepreneurship is self-employment. There is recent
survey evidence to suggest that, in the industrialized countries, many individuals
who are currently employees would prefer to be self-employed. Although it cannot
be definitive, this evidence suggests that there may be restrictions on the supply of
entrepreneurs. The International Social Survey Programme of 1989 asked random
samples of individuals from eleven countries the question:
"Suppose you were working and could choose between different kinds of jobs.
Which of the following would you choose?
I would choose ...
(i) Being an employee
2
(ii) Being self-employed
(iii) Can't choose."
Large numbers of people gave answer (ii) and thus stated that they would wish to
be self-employed. This answer was given by, for example, a remarkable 63% of
Americans (out of 1453 asked), 48% of Britons (out of 1297), and 49% of
Germans (out of 1575). These numbers can be compared with an actual proportion
of self-employed people in these countries of approximately 15%.
The data raise a puzzle: why do not more of these individuals follow their
apparent desire to run a business? This paper explores the factors that may be
important in determining who becomes and remains an entrepreneur. After years of
comparative neglect, research on the economics of entrepreneurship -- especially
upon self-employment -- is beginning to expand. Microeconometric work includes
Fuchs (1982) and Rees and Shah (1986), and more recently Pickles and O'Farrell
(1987), Borjas and Bronars (1989), Evans and Jovanovic (1989), and Evans and
Leighton (1989)(1). This paper follows in the general spirit of these inquiries,
although its data and methods differ from those in earlier investigations.
One possible impediment to entrepreneurship is lack of capital. In recent
work using US micro data, Evans and Leighton (1989) and Evans and Jovanovic
(1989) have argued formally that entrepreneurs face liquidity constraints. The
authors use the National Longitudinal Survey of Young Men for 1966-1981 and the
Current Population Surveys for 1968-1987. The key test shows that, all else equal,
people with greater family assets are more likely to switch to self-employment from
employment. This asset variable enters probit equations significantly and with a
quadratic form. Although Evans and his collaborators draw the conclusion that
capital and liquidity constraints bind, this claim is open to the objection that other
interpretations of their correlation are feasible. One possibility, for example, is that
inherently acquisitive individuals both start their own businesses and forego leisure
3
to build up family assets. In this case, there would be a correlation between family
assets and movement into self-employment even if capital constraints did not exist.
A second possibility is that the correlation between family assets and the movement
to self-employment arises because children tend to inherit family firms.
The paper provides, in Section 4, a new test of the finance-constraint
hypothesis. The test uses data on inheritances and gifts (as though from a 'natural
experiment' in which some people enjoy windfalls while most do not). Studying the
behavior of those who receive money is presumably as close as the economist can
get to the ideal laboratory experiment in which some subjects are issued with capital
while those in a control group get none. Results described later show that
individuals who have received inheritances or gifts are more likely to run their own
businesses. This is true holding constant a group of personal, family and
geographical characteristics. The effect is large, and is not the result of offspring
inheriting family enterprises.
The paper presents complementary questionnaire evidence. This is of a kind
apparently not reported before in the literature. Data from interviews with random
samples of individuals demonstrate that the self-employed say that they are
constrained principally by a lack of capital. Moreover, many of those who are not
self-employed say that it is predominantly a shortage of capital that prevents them
from starting their own business. Section 5 contains this survey material. Although
such survey responses have to be interpreted with caution, the message they
provide is consistent with that from the quite different econometric methods.
Another theme within the paper is the role of psychological characteristics.
The analysis studies the correlation between the probability of being self-employed
as an adult and the individual's childhood scores on a number of psychological
tests. Although originally a major motivation for the research, the results are
relatively poor. Individuals' psychology -- at least using the data available here --
4
does not play a large role.
If it is true that capital and other constraints hold back the effective supply of
entrepreneurship, and so lead to there being frustrated employees who would rather
be entrepreneurs, those who run their own businesses might be expected to be
'happier', on average, than those who do not. In Section 6, the paper suggests and
implements an econometric test of this hypothesis. It uses data of a kind more
commonly studied by psychologists.
2. Theoretical Background
Consider the following theoretical model in which people choose between
working in the entrepreneurial sector and being an employee. First, assume,
following Knight (1921) and others, that entrepreneurial opportunities cannot be
assigned probabilities. Second, assume that entrepreneurs may be constrained in
the amount of capital they can directly acquire. Consider person j, who by
assumption is a potential business-person with the vision to see a range of feasible
business projects, and thus is within the intrinsically entrepreneurial section of the
population. He or she needs capital to undertake a project. One possibility is to
use own or family funds, thereby making it unnecessary to borrow commercially.
However, person j may have lower savings than are required for the entrepreneurial
venture. Then there is no option but to try to obtain a business loan.
A banker in the above framework is likely to reason in the following way. "I
have little idea about whether project X will work out as Mr. A says. I cannot
assign it a probability. However, if Mr. A offers me collateral of Y, then I can make
a loan of Y - δ, where δ is the cost of reclaiming the collateral in the event of
bankruptcy. This is effectively a risk-free loan." Thus secured ('collateralized')
loans are a rational response by bankers to imperfect knowledge. Such a view
provides a natural rationale for the existence of capital constraints.
Assume individual j can get an unsecured loan only z percent of the time,
5
where z is below unity. This is despite the fact that the business venture is assumed
sound. The reason for the apparent sub-optimality is that individual j has no way of
assuring the typical banker that the hypothetical project is feasible. He may do so
(perhaps because some within the innovative entrepreneurial class become bankers),
but not with certainty.
This approach makes genuine uncertainty a central feature of the analysis. By
contrast, the recent work by Kanbur (1982), Khilstrom and Laffont (1979) and
Grossman (1984) breaks with the tenets of earlier thought on entrepreneurial
activity. Kanbur et al develop a standard neoclassical approach in which
productive business opportunities are ex ante feasible for, and visible to, all
individuals (most simply choose not to exploit them); there is an objective
probability distribution governing business risk, and everyone knows that
distribution; entrepreneurs receive the same expected utility as their workers; the
entrepreneur is likely to be someone with unusually low risk-aversion (see especially
Khilstrom and Laffont, 1979). These are different from the main assumptions and
arguments of classic sources such as Schumpeter (1939), Knight (1921) and
Kirzner (1973). In contrast to modern theory, the classic writings about the nature
of the entrepreneur stressed the following: most individuals are not sufficiently alert
or innovative to perceive business opportunities; there is no objective probability
distribution governing business risks; an innovative entrepreneur may receive higher
expected utility than he or she would as a regular worker; attitude to risk is not the
central characteristic that determines who becomes an entrepreneur.
The paper's model draws upon the older, but recently neglected, current of
thought. Eight assumptions are made.
A.1 Assume that proportion β of the population has entrepreneurial vision. This
group of individuals can see business opportunities where proportion 1-β see none.
A.2 There is, in the economy, an array of viable entrepreneurial projects, each of
6
which requires a different amount of capital, k. Each project requires only one
entrepreneur's labor.
A.3 The profit from project k (indexing in this way without loss of generality) is
p(k). This function describes the return from the different entrepreneurial ventures
in the economy. Without loss of generality, it is assumed to be strictly increasing.
A.4 There is a distribution of capital endowments across the population. Denote
it f(k), defined on support [0, 1]. The latter normalizes the richest person's assets at
unity.
A.5 An individual who perceives the array of business opportunities cannot with
certainty borrow the required capital unless he or she has access to the necessary
collateral. This is because, by their nature, such opportunities are not within the
vision of most other kinds of individuals (such as bankers approached for loans).
The individual can try to borrow for a project, but has only probability z of
obtaining an unsecured loan(2).
A.6 Individuals receive utility
u = p + i in self-employment
u = w in conventional employment,
where w is the wage paid for non-entrepreneurial work, and i is the non-pecuniary
utility from being independent and "one's own boss".
A.7 Anyone can find alternative work at wage w in the non-entrepreneurial part of
the economy. It is assumed that w equals the marginal product of labor in that
alternative sector, and that this is a declining function, w(N), of the number of
employees in the sector, N.
A.8 Population is normalized at unity. The number of entrepreneurs is E.
These assumptions lead to a simple but fairly unconventional model. To
make the key points as simply as possible, all probabilistic business risk is assumed
away. Many potential entrepreneurs are liquidity-constrained. People enter
7
entrepreneurship until, in equilibrium, either (i) capital or vision constraints are
binding in aggregate or (ii) the utility from running a business is driven down to
equal to that from wage-work. In the latter case,
w = p(k*) + i, (1)
where k* is the amount of capital needed for the marginal entrepreneurial project.
All projects requiring more capital have here already been undertaken.
The number of entrepreneurs in the economy is
E = β f k dk + βzk*
1
f k dk0
k*
(2)
= 1 - N (3)
This is also, by the choice of units, the probability of self-employment for one
individual. The first term on the right-hand side of equation (2) is the probability of
'vision' multiplied by the number of people with a greater capital endowment than k*
(that needed for the marginal project). The second term on the right-hand side of
equation (2) is the probability of vision multiplied by the probability of successfully
getting an unsecured business loan multiplied by the number of individuals who are
short of capital.
Equilibrium in this economy can take two different forms. One is described
by the simultaneous solution of equations (1) to (3). This is the case in which the
market for entrepreneurs clears: the marginal entrepreneur earns utility (made up of
profit plus the satisfaction from independence) equal to that from working in the
wage-sector. There is a second possibility, and that is when there are insufficient
entrepreneurs to drive to zero the surplus from running the marginal business.
When there is a shortage of β-individuals with capital,
p(k*) + i > w. (4)
This distortion is a result of the asymmetric information between bankers and
individuals with entrepreneurial vision.
8
A number of obvious comparative static results emerge.
Proposition 1
When the market for entrepreneurs clears (p(k*) + i = w), the following raise the
equilibrium number of entrepreneurs and the economy's wage rate:
(i) an increase in ß, the proportion of the population with (entrepreneurial) vision
(ii) a rise in i, the utility from independence
(iii) an increase in z, the probability of loans to individuals without sufficient
capital.
Proposition 2
When the market for entrepreneurs fails to clear (p(k*) + i >w), the following
raise the equilibrium number of entrepreneurs and the economy's wage rate:
(i) an increase in ß, the proportion of the population with entrepreneurial vision
(ii) an increase in z, the probability of loans to individuals without sufficient
capital.
(iii) a drop in k*, the binding level of capital necessary to set up a business
Contrary to the market clearing case, (iv) the utility from independence, i, has no
effect.
The proofs are omitted (they are given in an earlier version that is available on
request from the authors).
The underlying idea is a simple one. At the individual level, there are capital
constraints. Some of the people with the ability to see good projects fail to obtain
the funds to undertake them; they do not have a large enough capital endowment, k,
and are not lucky enough to get an unsecured loan. At the aggregate level, however,
the capital constraint may not bind. This is the case analyzed in Proposition 1,
where there is no distortion. The case in Proposition 2 is different. Here the supply
of capital is so short that anyone who can raise the finance earns a form of rent
created by the asymmetric information in the economy(3).
9
In equilibrium, either capital or vision constraints are binding in aggregate,
or the utility from running a business has been driven down to equal that from
wage-work. In the former case w < p(e*) + i, and in the latter w = p(e*) + i. In a
slight change of notation, for convenience, from capital levels to entrepreneurial
projects, e* is denoted as the marginal entrepreneurial venture. At e*, all business
projects with higher profitability (and higher capital) are already being undertaken.
Entrepreneurs are better off than regular workers, and the mean gap in utility
between the two kinds of work is higher if there are fewer numbers of people with
capital.
Proposition 3
Entrepreneurs get higher utility than regular workers.
Proposition 4
When capital constraints bind, the larger is Z, the number of people in the
economy who have capital, the smaller is the utility gap between entrepreneurs
and workers.
Proofs See Appendix.
This framework suggests two testable hypotheses. The first is the idea that
some potential entrepreneurs are constrained, by lack of access to capital, to
become employees rather entrepreneurs. The second is that individuals who run
their own enterprises have higher utility than those who are employees in the wage-
sector. Sections 3 and 4 study the first issue using an econometric test and
complementary questionnaire evidence. The second issue is intrinsically more
difficult to assess, because it requires data on utility levels in the two sectors.
Following methods more commonly found in psychology than economics, Section
5 implements a test using reported satisfaction levels as proxy utility data.
3. Data and Methods
Whether or not individual j is self-employed depends on a joint probability
10
captured by the constituent parts of equation (1):
the probability of running a business = (the probability of having
entrepreneurial vision) * (the probability of having capital + the
probability of being able to get an unsecured loan given no capital).
Empirically these probabilities may be assumed to depend upon a set of personal
characteristics, especially measures correlated with the person's assets, and a set of
regional and industrial characteristics. Rather than work with a highly structured
model, the paper estimates reduced-form equations based on a linearization of the
assumed probability function, and uses standard personal variables plus a range of
childhood variables.
Should the analysis focus upon transitions into self-employment or upon
cross-section evidence on those who are self-employed? Although it would be
useful to have results for pure transitions into self-employment, there is a problem
with such an approach. Policy-makers (as well as economists) are interested in
entrepreneurs who are successful rather than unsuccessful, and in small businesses
that last rather than fail. Therefore, showing that inheritances affect the flow into
entrepreneurship would, in itself, be of limited (though positive) value, for it could
be that such individuals quickly exit from self-employment. Establishing that a
person's access to finance influences his or her decision to remain self-employed
would, similarly, also be of positive but limited interest, because such people might
be less likely to flow in to entrepreneurship in the first place.
A natural way to learn about the aggregate influence of capital injections such
as inheritances is thus either (i) simultaneously to study both sets of transitions (in
and out), or (ii) to study the effects of earlier inheritances upon the cross-section
probability of being self-employed. This paper -- partly because of the nature of
the data -- adopts the second approach. New work by Holtz-Eakin et al (1994a,b),
11
which follows an early version of this paper, takes route (i) and shows that
inheritances both raise entry and slow exit.
The econometric analysis described in the next section draws upon the
National Child Development Study (NCDS). This is a longitudinal birth cohort
study that takes as its subjects all those living in Great Britain who were born
between the 3rd and the 9th March, 1958. These children were surveyed at birth,
and at ages 7, 11, 16, 23, and 33. At each of the first three follow-ups, information
was obtained from parents, teachers, and doctors. At the most recent sweep,
conducted in 1991 when all subjects were age 33, information was also gathered
about the respondent's spouse and children. For details of the survey design, see
Elias and Blanchflower (1989).
We make use of information about employment status that was collected in
the interviews of 1981 (NCDS4) and 1991 (NCDS5). This has the useful feature
that it provides snapshots of self-employment activity when the individuals were in
their early twenties and early thirties. The 1981 sweep of NCDS contained 12,537
interviews. Of the total, 521 were self-employed, while 8657 worked as employees.
Hence, approximately one in eighteen young people who were working at the time
of interview had a job which they had, in a sense, created themselves. The 1991
sweep contains data on 11,407 individuals. Of these, 1279 were self-employed,
while a further 7703 were employees. Thus, ten years further into the life cycle, the
proportion of employment accounted for by the self-employed had risen from 5.7%
in 1981 to 14.2% in 1991. The period itself probably accounts for some of this
rise. In December 1981, there were 21,142,000 employees in employment in Great
Britain, of whom 2,093,000 or 9.9% were self-employed. This compares with
21,506,000 employees in employment in December 1991, of whom 3,224,000 or
15% were self-employed (Source: Employment Gazette, January 1985, May 1994).
The empirical analysis focuses on individuals who were either employed or
12
self-employed at the time of interview in either 1981 or 1991. In each year, we
study cross-section patterns at that point in time. This makes the nature of the
equations different from Evans's work with Jovanovic and Leighton, where the data
were on the flow into self-employment. The paper studies the probability that an
individual reports himself or herself as self-employed. The dependent variable is
therefore a stock rather than a flow, and so captures the combined effects of gifts
and inheritances (among other variables) on past movements into and out of self-
employment. However, some information is available on timing, and the later
results do more than look at simple cross-section correlations.
To produce plausible evidence that an access-to-capital variable influences
entrepreneurial activity, it is necessary to have a well-designed statistical test. It is
likely to be important to be able to argue that the capital variable is exogenous or
can be instrumented convincingly.
Two tests are done on 1981 data. One uses instrumental variables, the other
lags. The data set has the valuable feature that it records in 1981 whether or not the
entrepreneur's parents are alive or dead. A variable for parental death then makes a
natural instrumental variable (in the NCDS data set, approximately 14% of
individuals have at least one parent who has died), because it should enter an
inheritance equation but not a self-employment equation. Unfortunately, this
cannot be done in the 1991 data, because parental death is not available in the later
data. In order to provide an additional test of the direction of causality, the paper
also uses data on gifts/inheritances that were received many years before the start-
up decision.
The key question in the NCDS surveys is:
"Have you (or your husband/wife/partner) ever inherited, orreceived as a gift from another person, money, property, or othergoods to the value of £500 or more?"
Q. 9, p. 68, NCDS4 and Q.E11, p.71, NCDS5.
13
This question was asked in both sweeps of the National Child Development Study.
In 1981, 1060 working individuals responded positively to this question. These
respondents were asked to report both the amount of the gift/inheritance and the
date of its receipt. 6.4% of these monies were received before 1975, 25.7%
between 1975 and 1978, and the rest received between 1979 and 1981. In the 1991
data, 2927 working individuals said they or their spouses had received a gift or
inheritance of £500 or more. 80% of these inheritances or gifts had been received
since 1981.
For analysis, these data on inheritance/gift payments were converted into
constant 1981 pounds sterling by compounding the UK Treasury Bill interest rates
from 1958-91. Among those who received a sum, the mean size of payment
received by workers was £3617 in 1981 (with a standard deviation of £8421) and
£5655 in 1991 (with a standard deviation of £18700). Only the largest
inheritance/gift was recorded, so it is not possible to aggregate over any multiple
gifts. It was thought best, for later analysis, not to exclude gifts received by
married people's spouses before the marriage took place (because those spouses
could have later used the money in their partner's business).
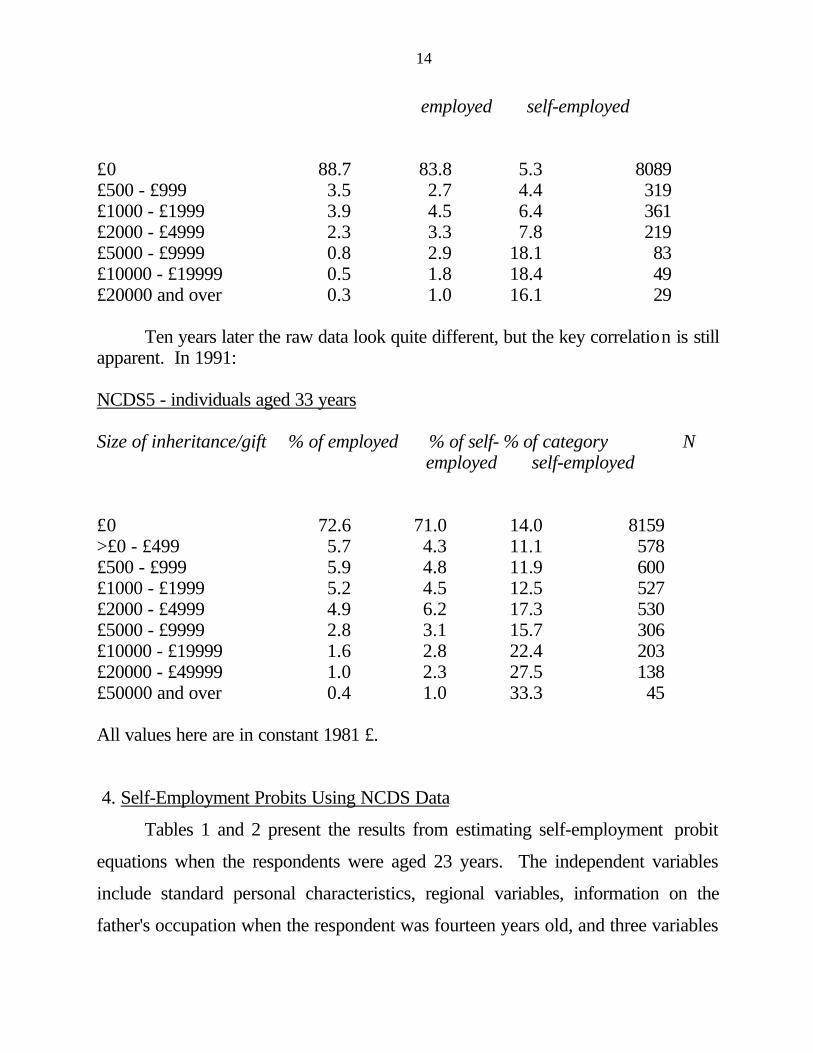
The distribution of inheritances or gifts in constant 1981 pounds is reported
below from both NCDS4 and NCDS5. These raw data reveal a positive
relationship between the size of inheritances/gifts and the incidence of self-
employment. The first two columns of the distribution give the proportion of the
employed and the self-employed who received an inheritance and/or a gift. The
third column reports the proportion of individuals who were self-employed. In
1981:
NCDS4 - individuals aged 23 years
Size of inheritance/gift % of employed % of self- % of category N
14
employed self-employed
£0 88.7 83.8 5.3 8089£500 - £999 3.5 2.7 4.4 319£1000 - £1999 3.9 4.5 6.4 361£2000 - £4999 2.3 3.3 7.8 219£5000 - £9999 0.8 2.9 18.1 83£10000 - £19999 0.5 1.8 18.4 49£20000 and over 0.3 1.0 16.1 29
Ten years later the raw data look quite different, but the key correlation is stillapparent. In 1991:
NCDS5 - individuals aged 33 years
Size of inheritance/gift % of employed % of self- % of category N employed self-employed
£0 72.6 71.0 14.0 8159>£0 - £499 5.7 4.3 11.1 578£500 - £999 5.9 4.8 11.9 600£1000 - £1999 5.2 4.5 12.5 527£2000 - £4999 4.9 6.2 17.3 530£5000 - £9999 2.8 3.1 15.7 306£10000 - £19999 1.6 2.8 22.4 203£20000 - £49999 1.0 2.3 27.5 138£50000 and over 0.4 1.0 33.3 45
All values here are in constant 1981 £.
4. Self-Employment Probits Using NCDS Data
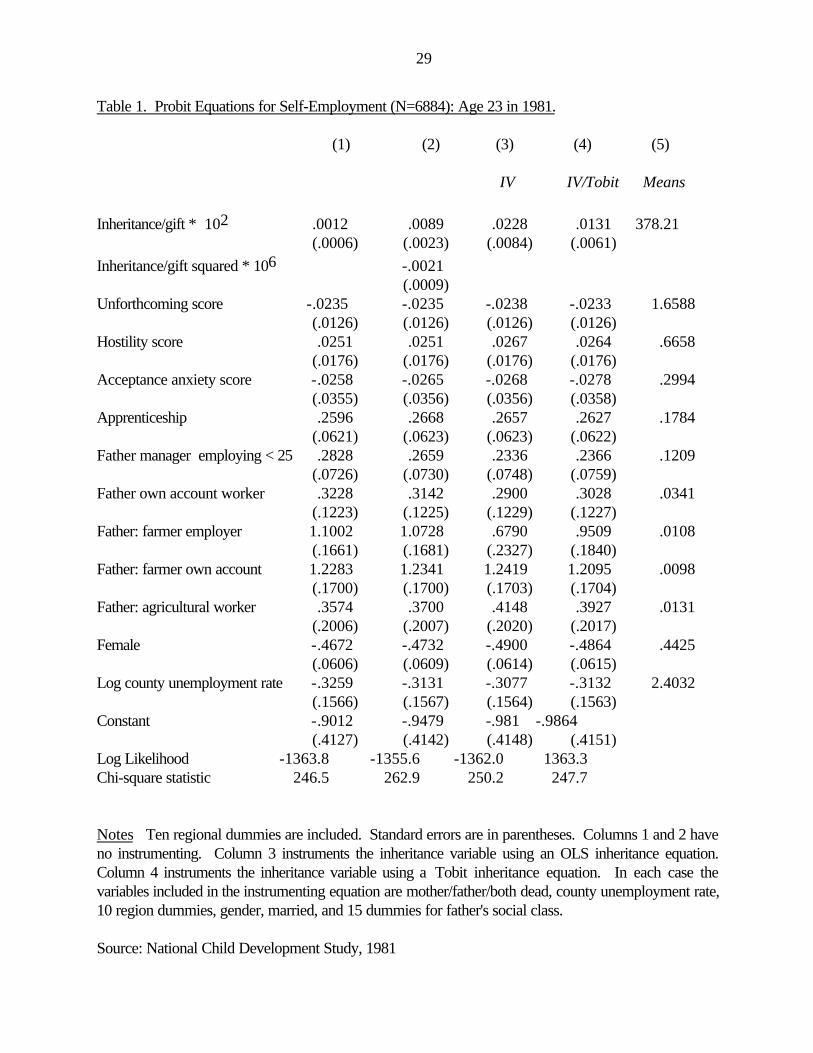
Tables 1 and 2 present the results from estimating self-employment probit
equations when the respondents were aged 23 years. The independent variables
include standard personal characteristics, regional variables, information on the
father's occupation when the respondent was fourteen years old, and three variables
15
derived from personality reports from a school teacher when the respondent was
seven years of age. These can be viewed as approximately pre-determined
variables. Experimentation with a further set of possibly endogenous variables,
such as marital status and educational qualifications, left the key results unaltered.
Although they are not the focus of the paper, it is worth noting the negative effects
of the local unemployment rate and the female dummy (replicating findings on a
different UK data set in Blanchflower and Oswald, 1990b), the significant effects of
father's occupation, and the borderline influence of childhood psychological traits.
On the latter issue, many other psychological variables were tried unsuccesfully and
hence were omitted.
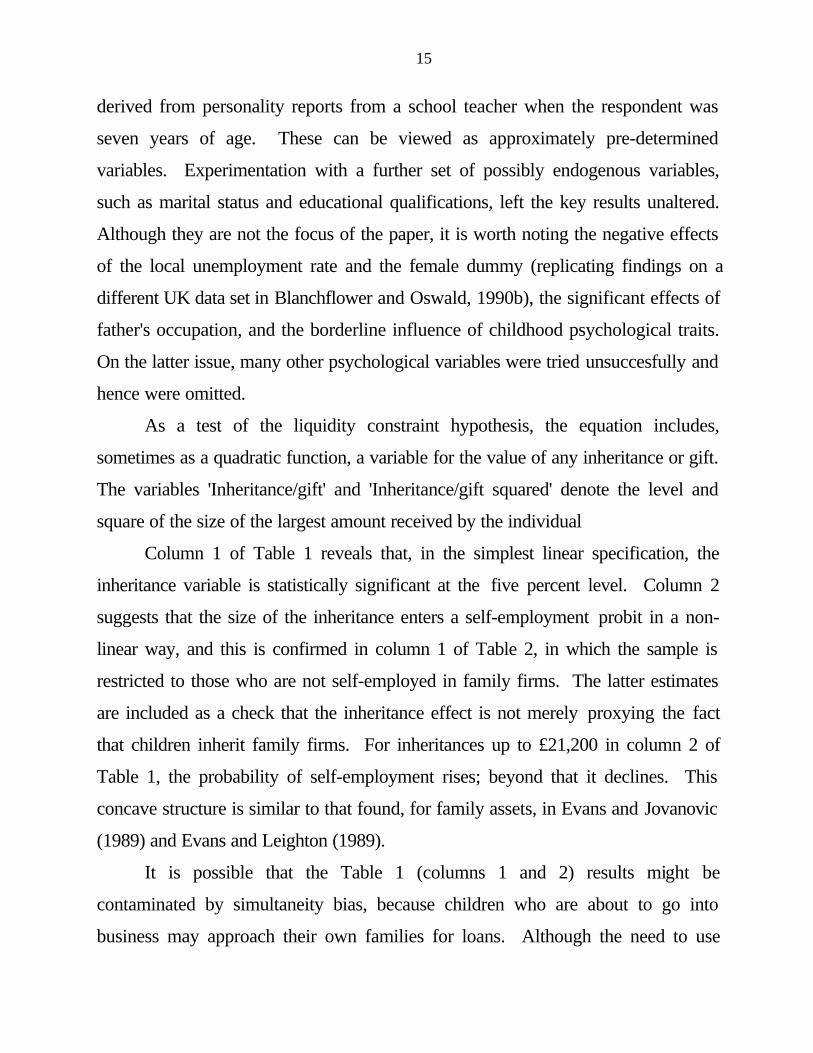
As a test of the liquidity constraint hypothesis, the equation includes,
sometimes as a quadratic function, a variable for the value of any inheritance or gift.
The variables 'Inheritance/gift' and 'Inheritance/gift squared' denote the level and
square of the size of the largest amount received by the individual
Column 1 of Table 1 reveals that, in the simplest linear specification, the
inheritance variable is statistically significant at the five percent level. Column 2
suggests that the size of the inheritance enters a self-employment probit in a non-
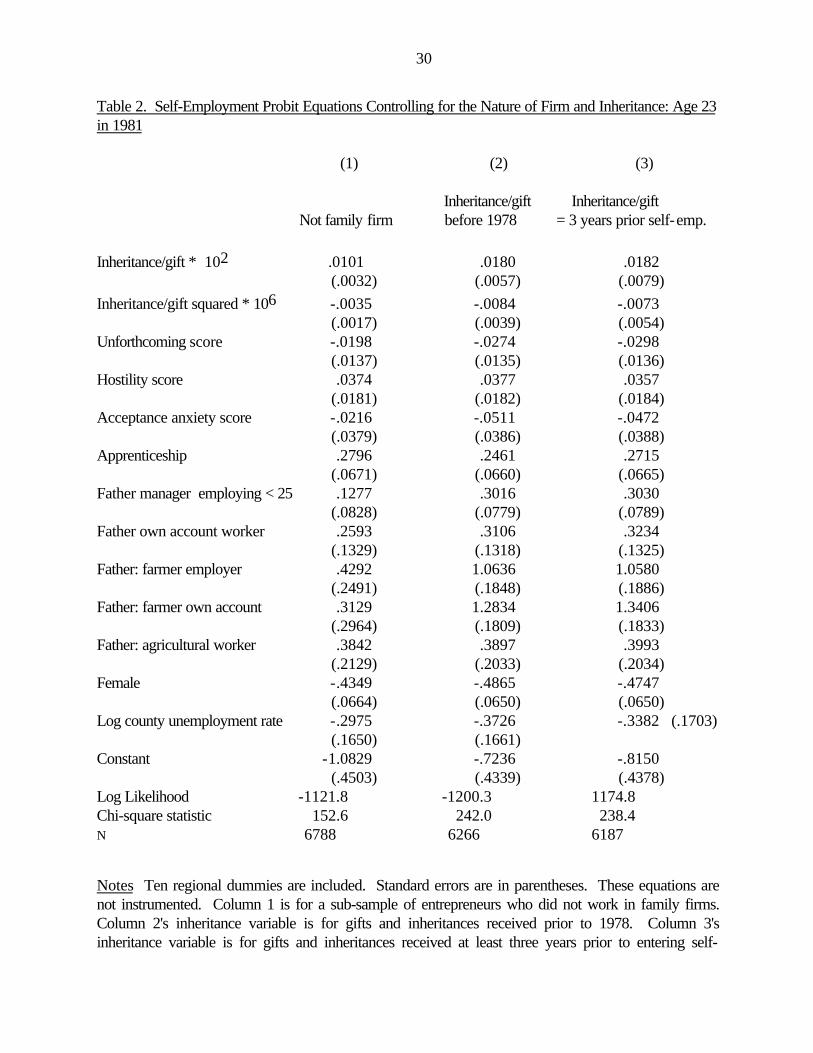
linear way, and this is confirmed in column 1 of Table 2, in which the sample is
restricted to those who are not self-employed in family firms. The latter estimates
are included as a check that the inheritance effect is not merely proxying the fact
that children inherit family firms. For inheritances up to £21,200 in column 2 of
Table 1, the probability of self-employment rises; beyond that it declines. This
concave structure is similar to that found, for family assets, in Evans and Jovanovic
(1989) and Evans and Leighton (1989).
It is possible that the Table 1 (columns 1 and 2) results might be
contaminated by simultaneity bias, because children who are about to go into
business may approach their own families for loans. Although the need to use
16
family money in this way could be construed as another example of capital
constraints, two procedures were followed in an attempt to allow for the possible
endogeneity of the inheritance/gift variable.
First, columns 3 and 4 of Table 1 report instrumental variable estimates.
Here a good instrument is required, and the data set seems to contains one. The
inheritance/gift variable is assumed to be a function of a variable for parental death.
This ought to be an effective instrument because it should have no effect on the
self-employment decision per se but should, and does, as would be expected, enter
significantly into an equation for inheritance (details of the inheritance equations are
not reported but are available from the authors). Approximately 14% of the sample
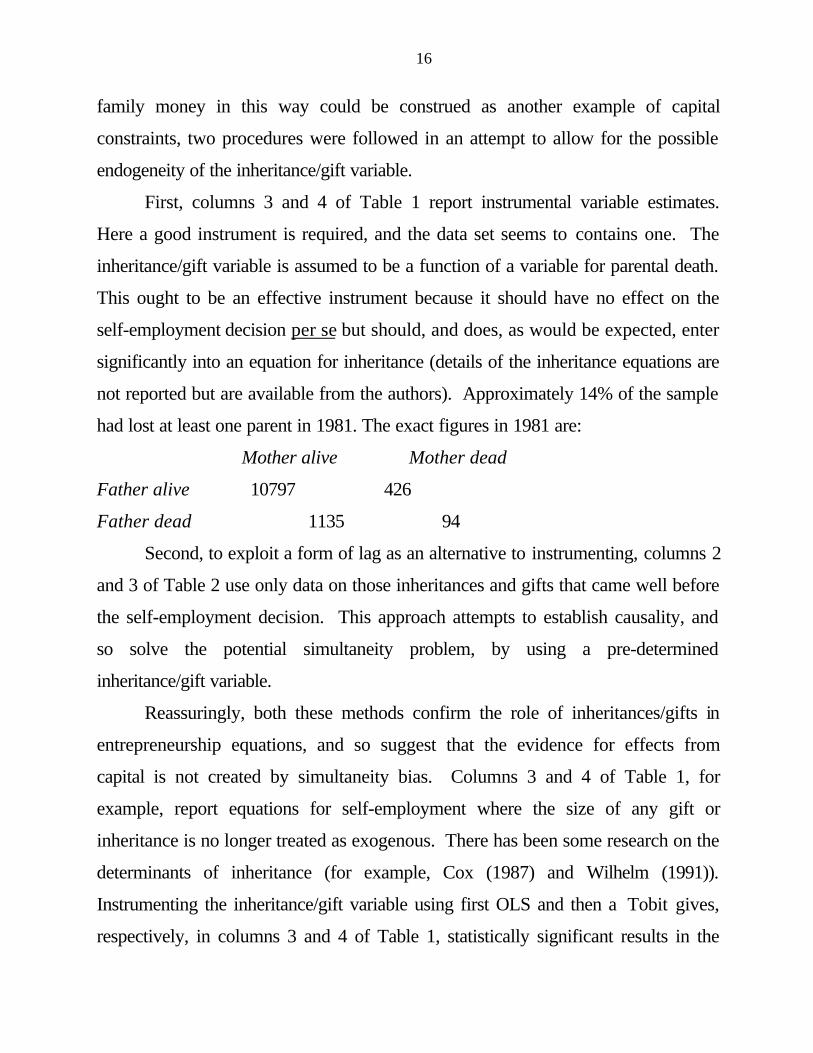
had lost at least one parent in 1981. The exact figures in 1981 are:
Mother alive Mother dead
Father alive 10797 426
Father dead 1135 94
Second, to exploit a form of lag as an alternative to instrumenting, columns 2
and 3 of Table 2 use only data on those inheritances and gifts that came well before
the self-employment decision. This approach attempts to establish causality, and
so solve the potential simultaneity problem, by using a pre-determined
inheritance/gift variable.
Reassuringly, both these methods confirm the role of inheritances/gifts in
entrepreneurship equations, and so suggest that the evidence for effects from
capital is not created by simultaneity bias. Columns 3 and 4 of Table 1, for
example, report equations for self-employment where the size of any gift or
inheritance is no longer treated as exogenous. There has been some research on the
determinants of inheritance (for example, Cox (1987) and Wilhelm (1991)).
Instrumenting the inheritance/gift variable using first OLS and then a Tobit gives,
respectively, in columns 3 and 4 of Table 1, statistically significant results in the
17
self-employment probit equation. The coefficients and standard errors are,
respectively, 0.023 (0.008) and 0.013 (0.006). More weight should probably be put
on the second of these, because of the statistically preferable properties of the
Tobit estimator (inheritances/gifts below £500 are reported as zeroes). In both of
the specifications the quadratic form of the inheritance variable was weak and has
been omitted; this raises doubts about the robustness of the previous estimate of
the function's curvature.
Columns 2 and 3 of Table 2, which allow for timing and a recursive structure,
lead to the same conclusion. When inheritances before 1978, or inheritances more
than three years before self-employment, are used, there continues to be a
statistically significant effect upon the probability of being self-employed in 1981.
Here the quadratic terms are on the border of significance, so they are retained in
columns 2 and 3. A three-year pre-inheritance interval was chosen as a
compromise between the need for as long a lag as possible and the requirement that
the number of observations not be too few.
The findings from these three sets of results -- uninstrumented, instrumented,
and lagged -- all find statistically significant inheritance effects and are thus
consistent with the existence of capital constraints. To study the quantitative
importance of inheritance and gifts, a number of hypothetical cases were
constructed, by using the model estimated in column 4 of Table 1 (results were
similar if the estimates in column 2 were used instead). The results of two typical
outcomes are reported below, with separate estimates for men and women.
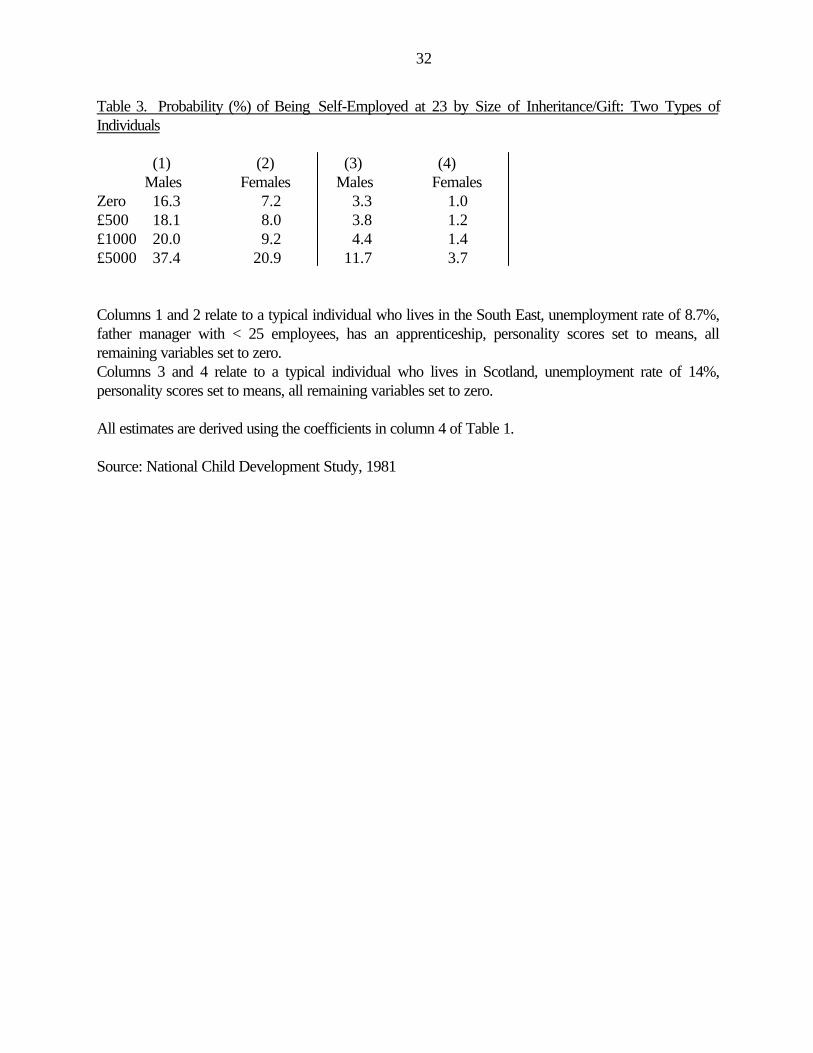
Table 3 shows that comparatively small increases in inheritances/gifts
apparently have large effects on the probability of running a business. Individuals
who had received £5,000 ($9,000) in constant 1981 pounds sterling were
approximately twice as likely to be self-employed in 1981 as those who had
received nothing. For example, a male in the South East of England, with an
18
apprenticeship and whose father was a manager in a workplace with under 25
employees, had a probability of 0.163 of being self-employed without an inheritance
and/or a gift. This probability was 0.374 if he had received an inheritance of
£5,000. In the case of females, the probabilities were 0.072 and 0.209, respectively.
Even though measured in 1981 pounds, the size of this effect appears
remarkably large, especially when contrasted with the Evans-Jovanovic estimate that
removing all liquidity constraints would increase the flow of entrepreneurs from
3.8% to 5.1% (p.824). The likely explanation -- apart from possible US and UK
differences and the need for caution in interpreting all estimates in early work in a
field -- is that capital constraints bind more on the young.
It might be argued that ideally age 23 is too young to study self-employed
people. Tables 4 and 5 re-do the analysis for the 1991 data, that is, when these
individuals were age 33. Table 4 is a probit equation for self-employment at that
date. It is designed to be close in specification to the earlier Tables. Table 5
calculate a new set of probabilities.
Table 4 continues to find an apparently powerful correlation between self-
employment status and having received an inheritance or gift. The sample consists
of individuals in employment at the time of interview in 1991 when the respondents
were thirty-three years of age. As in Tables 1 and 2, the dependent variable is set to
1 if self-employed in the main activity, and to zero otherwise. The self-employed
were only slightly more likely to have received an inheritance than the employed
(29% compared with 27.4% respectively), but the amount received was higher (the
mean level of inheritance received was £4692 for the employed and £11148 for the
self-employed).
Column 1 of Table 4 is a probit equation that includes only the amount of
inheritance in constant 1981 pounds. The level of inheritance enters with a
coefficient of 0.85*10-5 and a t-statistic of nearly 5. This is not a small effect
19
(given the amount of variation in the data). In column 2, there is some evidence that
the relationship is a quadratic, as found earlier at age 23. The inheritance effect is
robust to the inclusion of parental class variables in column 3. These variables
work very similarly to those in Tables 1 and 2 above. The squared inheritance term
is insignificant when parental social class is controlled for in column 4. It never
achieves significance once other controls are included; hence in subsequent
specifications in this Table it is omitted. To check for the possibility of attrition
bias, column 5 and onward uses a bigger sample: it includes all those cases that had
missing values to the parental class variable. We set all of the other social class
dummies to zero for such cases and include a further dummy variable "Father:
social class missing NCDS2". This is everywhere insignificant, and the other
coefficients are essentially unchanged, which may suggest that these results are not
biased by attrition.
The inheritance variable is robust to the inclusion of regional dummies
(column 7), or the regional unemployment rate (column 8), which once again enters
negatively. Column 9 of Table 4 includes the three personality scores provided by
the school teacher when the respondent was aged seven. Those anxious for
acceptance as children are less likely, at age 33, to be self-employed. Finally, in
column 10, a form of lagged dependent variable is included. It records self-
employment status in the earlier sweep of the NCDS survey, namely, in 1981. Even
controlling for this, inheritance continues to be significant, and to be of
approximately the same size.
Table 5 is the equivalent, for 33-year olds, of Table 3. Here the change in the
probability in self-employment that an inheritance induces is smaller than at age 23.
An inheritance of twenty five thousand pounds, for example, now raises the
probability a few percentage points.
As usual with econometric analysis, it is not possible to rule out the
20
possibility that the observed empirical correlation is due to some other effect.
Perhaps wealth makes people less risk-averse and thus more prone to go into
business, or self-employment allows wealthier individuals to consume leisure more
easily. Yet the apparently sizable effects from small inheritances do not make such
an interpretation look the most natural one. As the next section shows, moreover,
there is other evidence.
5. Interview Evidence on Capital Constraints
This part of the paper reports new survey findings -- from two other data
sets -- that are consistent with the idea that both current and potential self-employed
business owners feel constrained by limited capital. Its aim is to provide evidence
that is more direct than, and complementary to, that in Evans and Jovanovic (1989)
and Evans and Leighton (1989) and the econometric evidence reported in the
previous section. Two previously unexploited sources of information are used.
The first is the British Social Attitudes (BSA) Survey series, an annual random
sample providing data from 1983 to 1989. The second is a 1987 government-
sponsored random survey, the National Survey of the Self-Employed (NSS).
The BSA survey asked 5947 randomly chosen employees who had not been
self-employed in the previous five years (97.1% of all employees) the question
"How seriously have you considered being self-employed?". The answers are
given in Table 6. On average, 16.8 per cent had considered running their own
business either 'very seriously' or 'quite seriously'. In 1983, 1984 and 1986 a sub-
sample of 451 respondents who had considered it very or quite seriously were
asked the follow-up question: "Why did you not become self-employed?". The
answers, which were recorded in their own words, are reported in Table 7. The
Table reveals that, aggregating over the years, approximately half the group gave as
their reason for not setting up in business that they could not obtain the necessary
capital. It was the most common reason. This is one form of evidence on the
21
relevance of binding liquidity constraints.
The National Survey of the Self-Employed, which apparently has not been
used before by economists, draws on information from a random sample of
approximately 12,000 adults interviewed in Britain in the spring of 1987. Individuals
who were recently self-employed were asked to name the main source of finance
used to set up their business. Out of the 243 respondents(4) who were in this
special category, 103 or 42% reported that they used their own savings to set up the
business, 36 or 15% used money from family or friends, while only 41 or 17% took
a bank loan. Taking this group as the base, Table 8 provides the answers to the
question "What help would have been most useful to you in setting up your
business?". It reveals that assistance with money and finance was the most
commonly mentioned item, which is again consistent with the capital-constraint
hypothesis.
In addition to interviewing the self-employed, the NSS also obtained
information on 139 individuals who said they were 'seriously intending' to become
self-employed. They were asked the following: "There are many anxieties and
concerns people have in setting-up in self-employment. What are you most
concerned about?". They were then given a list of twenty possible answers from
which they had to select one. The main responses are reported in Table 9 and
show that the single most common answer was that individuals were worried about
how to raise the necessary finance.
These two questionnaire surveys provide information about the problems that
potential and current self-employed people think are most important. In each case,
the dominant answer concerns the availability of capital. Although economists are
schooled to be cautious of survey information, it seems unlikely that there is nothing
to be learned from this common message from different surveys. They appear to
sit comfortably alongside the estimation results.
22
6. Testing Whether the Self-Employed Are Happier
The model implies (Proposition 3) that those running their own enterprises
will be happier than employees. For a test of this, it is necessary to compare the
total returns to conventional work and entrepreneurial activity. The reported
earnings of self-employed individuals are known to be unreliable, and it is likely, as
the model suggests, that such individuals get a non-pecuniary benefit from being
their own boss. Hence, some proxy for overall utility is required.
This paper follows the psychology literature in using survey data on job and
life satisfaction. It is established there (see, for example, Argyle 1989 and Warr
1985) that reported satisfaction numbers are highly correlated with observable
measures of individual well-being such as quitting behavior and physiological
symptoms. The small economics literature includes Hamermesh (1977), Borjas
(1979), Freeman (1978), Meng (1990), Miller (1990), Schwochau (1987), Clark and
Oswald (1992, 1994), and Blanchflower and Freeman (1994).
The central issue is whether, ceteris paribus, the self-employed report higher
levels of overall utility or job satisfaction than do employees. After asking each 23-
year-old individual how satisfied they were with a range of items, such as pay and
working conditions, the following encompassing question was asked:
"Taking everything into consideration, how satisfied ordissatisfied are you with your job as a whole"
Q19j, p.9: NCDS4 questionnaire
Preliminary questions were asked about individual components of utility.
Respondents presumably saw this question as requesting information on their entire
'utility package', and this makes the answers potentially useful.
The responses to the satisfaction question were coded into five categories.
A cross-tabulation of the results is reported in Table 10. In so far as the responses
can be seen as a genuine proxy for utility levels, they appear to favor the view that
23
the self-employed are 'happier'. The Table shows that 46% of the self-employed
say that they are in the top category of very satisfied, whereas the figure is 29% for
employees.
To control for other characteristics, ordered probit equations are estimated in
Table 11. Because satisfaction is presumably influenced by income, some stance
must be taken on whether or not a earnings measure is to be included in the probit
equations. The theory makes clear that the appropriate test is to omit earnings
variables. This is because the focus of interest is the total utility of individuals -- to
allow a comparison of the entire utility associated with each kind of work -- and not
just the satisfaction level after income is held constant.
Included as controls in the equations are dummy or continuous variables for
self-employment, union membership, marital status, gender, disabled status, region,
highest educational qualification, part-time, ever unemployed in the previous 5
years, a dummy for problems with arithmetic, months of experience, and job tenure.
Month-of-interview dummies are included. A set of industry dummies are also
included in Table 11. Results are also given for sub-samples of people who did
and did not inherit money. These form the second and third columns of the Table.
It is apparent that the self-employment dummy variable is significant (it was
so in all specifications, including those with few control variables). Consistent with
the cross-tabulations presented in Table 10, self-employment has a positive effect
on reported satisfaction levels (one that is quantitatively larger than any of the other
dummies). As the equations exclude income measures, the self-employment
variables are not capturing merely the non-monetary return to being one's own boss,
but rather a mixture of money and other things. Given the paucity of work with
data like these, the other controls may also be of interest. Women are more
satisfied; married people are also more satisfied. Those who have been
unemployed are less satisfied. Union members are also less content: this replicates
24
the main finding of the earlier literature of Borjas (1979) and Freeman (1978). Low
qualifications and being part-time are also positively associated with satisfaction --
perhaps reflecting the low-aspiration effects discussed in Clark and Oswald (1992).
As an experiment into the effects of access to capital, the data were split
into two sub-samples. The second set of columns of Table 11 is estimated with
data on the 6887 people who reported themselves as having received no inheritance
or gift of money or goods exceeding £500. The third set of columns of Table 11
gives estimates for the sub-sample of 987 people who had received this kind of
inheritance or gift. There is some evidence that the self-employment dummy
variable has a smaller effect in the group who inherited; the dummy even goes
negative. Such evidence might be taken to be consistent with the idea that those
with capital -- through an inheritance -- are more able to enter the self-employment
sector and drive down the rents available there. This argument can only be
suggestive, but indicates an area where further research may be fruitful.
Table 12 presents results for the 1991 data. Here there is no question asked
about individuals' satisfaction with their work, so instead the dependent variable is
the answers to a question about life satisfaction. The question asked was as
follows:
'Here is a scale from 0 to 10. On it, "0" means that you arecompletely dissatisfied and "10" that you are completely satisfied.Please ring one number to show just how dissatisfied or satisfied youare about the way your life has turned out so far.'
Q8, p19, Section I, NCDS5questionnaire .
In the life satisfaction equation, a self-employment dummy enters positively(5).
Females and married people are significantly more satisfied. The union dummy
here enters positively, suggesting that such people are happier even if (see the earlier
Table 11) they may be less satisfied with their job. It is difficult to know what to
25
make of this difference. Columns 1 to 6 build up to a specification including
personal and regional variables. Crucially for this paper, the finding that the self-
employed are happier appears to be robust.
The results provide some evidence that entrepreneurs get higher utility than
conventional employees. One caveat should be borne in mind when interpreting the
paper's findings. The use of satisfaction and happiness data to proxy utility levels
is unconventional in economics research. It may be that reported satisfaction levels
are subject to important biases: self-employed people may be intrinsically more
optimistic and cheerful than others, or feel psychologically compelled, because their
business is in their own hands, to answer in the way they do. Nevertheless, at this
juncture a more natural interpretation of the data is that the self-employed really are
happier.
7. Conclusions
The forces that affect the supply of entrepreneurship are widely viewed as
important but poorly understood. This paper uses survey and microeconometric
methods to study a simple class of entrepreneurs, namely, individuals who run their
own businesses. It draws upon data from the National Child Development Study,
the British Social Attitude Surveys, the International Social Survey Programme, the
US General Social Surveys, and the National Survey of the Self-Employed.
The empirical results are consistent with the hypothesis that entrepreneurs
face finance and liquidity constraints. In an ideal world, this would be studied by
constructing a laboratory or field experiment. In that experiment, the behavior of a
group of individuals who are randomly given capital would be compared with the
behavior of those from a control group who receive nothing. Such an approach is
not probably not feasible in a subject like economics. But a natural experiment, in
the same spirit, is generated by the fact that some individuals serendipitously receive
inheritances and gifts.
26
The first part of the paper constructs a theoretical model in which capital-
constrained individuals choose between employment and self-employment.
Consistent with this, the empirical analysis produces four main conclusions.
1. The receipt of an inheritance or gift seems to increase a typical individual's
probability, ceteris paribus, of being self-employed. This emerges from NCDS
data. It is not an estimate of the effect of capital availability upon transitions(6) into
self-employment, but rather -- and perhaps more relevant to policy -- an estimate of
the lasting effect upon the stock of people running their own businesses. The
inheritance effect is found both at age 23 and at age 33. It is especially large among
the younger group (perhaps because older people have other ways to acquire
capital).
2. Consistent with the model developed in the paper, ISSP data reveal that
surprisingly large numbers of people in the industrialized countries say they would
prefer to be self-employed, and NCDS data demonstrate that those who are self-
employed report themselves as more satisfied, ceteris paribus, than employees.
Complementary international evidence about the happiness of the self-employed is
reported in Appendix D.
3. Faced with the question 'Why did you not become self-employed?', the most
common survey response given by a random sample of workers in the BSA survey
was to cite shortage of capital and money.
4. NSS data indicate that most small businesses were begun not with bank loans
but with own or family money, that individual entrepreneurs felt they had needed
most help with finance, and that the single biggest concern of potential
entrepreneurs was with where to obtain capital.
When this research began, a key motivation was to study the impact of
psychological traits on entrepreneurship. The NCDS data series seems ideally
suited for this task, because it records the outcome of psychological tests that were
27
done during childhood. In practice, only one clear result can be found. Although
the effect is quantitatively small, those who were anxious for acceptance (when
children) were less likely to run their own businesses at age 33. Using the variables
available here, in other words, psychology apparently does not play a key role in
determining who becomes an entrepreneur.
The paper's results draw upon a variety of complementary methods and data
sets. They are consistent with the view that capital constraints hold back potential
entrepreneurs and that the self-employed earn a utility premium. The complex
normative implications of these findings seem to demand attention.

28
Endnotes
1. OECD (1986) and Blau (1987) are aggregate time-series studies. Theoretical analysis relevant to this
paper's results includes Rosen (1983), Shorrocks (1988), Casson (1990) and Holmes and Schmitz (1990).
New empirical papers include Blanchflower and Meyer (1994), De Witt and Van Winden (1990), Holmes
and Schmitz (1991), Lentz and Laband (1990), Meyer (1990), Reid and Jacobsen (1988), and Reid (1990).
Unpublished work by Black and de Meza (1992) finds, consistent with the general tenor of the approach
taken here, that housing equity plays an important role in shaping the supply of entrepreneurs.
2. An interesting but complex project would be to construct a complete theory of the determinants of z
(the probability that someone with a good idea can obtain a loan from bankers who cannot themselves
perceive the business opportunity). This paper requires only that z be less than unity.
3. It is assumed that the existence of any specialist venture-capital companies is not sufficient to remove
the distortion created by asymmetric information.
4. Data sets covering newly self-employed entrepreneurs are almost inevitably small, so the best that can
be done is to insist that data are drawn from a well-designed random sample.
5. We have replicated this positive self-employment result in happiness equations for eight other Western
countries (Great Britain, Northern Ireland, USA, Italy, Eire, Israel, Norway West Germany and New
Zealand) using ISSP data for 1991 and for the USA using a time-series of cross-sections from General
Social Surveys, 1972-1990. Appendix Tables D1 and D2 report the exact questions asked, the distribution
of responses as well as ordered probits equations for happiness. In both cases self-employment has a
significant positive effect. Clark and Oswald (1994), using a medical measure of psychiatric health,
uncover a somewhat different result, namely, that the self-employed are more highly stressed than are
employees.
6. The usual reason that economists favor studies of transitions is because a cross-section typically does
not provide data on the timing of events. This reason is inapplicable here: Table 2 gives estimates using
inheritances/gifts that were received well before self-employment.
29
Table 1. Probit Equations for Self-Employment (N=6884): Age 23 in 1981.
(1) (2) (3) (4) (5)
IV IV/Tobit Means
Inheritance/gift * 102 .0012 .0089 .0228 .0131 378.21 (.0006) (.0023) (.0084) (.0061)
Inheritance/gift squared * 106 -.0021 (.0009)
Unforthcoming score -.0235 -.0235 -.0238 -.0233 1.6588(.0126) (.0126) (.0126) (.0126)
Hostility score .0251 .0251 .0267 .0264 .6658 (.0176) (.0176) (.0176) (.0176)
Acceptance anxiety score -.0258 -.0265 -.0268 -.0278 .2994(.0355) (.0356) (.0356) (.0358)
Apprenticeship .2596 .2668 .2657 .2627 .1784(.0621) (.0623) (.0623) (.0622)
Father manager employing < 25 .2828 .2659 .2336 .2366 .1209 (.0726) (.0730) (.0748) (.0759)Father own account worker .3228 .3142 .2900 .3028 .0341
(.1223) (.1225) (.1229) (.1227)Father: farmer employer 1.1002 1.0728 .6790 .9509 .0108 (.1661) (.1681) (.2327) (.1840)Father: farmer own account 1.2283 1.2341 1.2419 1.2095 .0098
(.1700) (.1700) (.1703) (.1704)Father: agricultural worker .3574 .3700 .4148 .3927 .0131
(.2006) (.2007) (.2020) (.2017)Female -.4672 -.4732 -.4900 -.4864 .4425
(.0606) (.0609) (.0614) (.0615)Log county unemployment rate -.3259 -.3131 -.3077 -.3132 2.4032
(.1566) (.1567) (.1564) (.1563)Constant -.9012 -.9479 -.981 -.9864 (.4127) (.4142) (.4148) (.4151)Log Likelihood -1363.8 -1355.6 -1362.0 1363.3Chi-square statistic 246.5 262.9 250.2 247.7
Notes Ten regional dummies are included. Standard errors are in parentheses. Columns 1 and 2 haveno instrumenting. Column 3 instruments the inheritance variable using an OLS inheritance equation.Column 4 instruments the inheritance variable using a Tobit inheritance equation. In each case thevariables included in the instrumenting equation are mother/father/both dead, county unemployment rate,10 region dummies, gender, married, and 15 dummies for father's social class.
Source: National Child Development Study, 1981
30
Table 2. Self-Employment Probit Equations Controlling for the Nature of Firm and Inheritance: Age 23in 1981
(1) (2) (3)
Inheritance/gift Inheritance/gift Not family firm before 1978 = 3 years prior self-emp.
Inheritance/gift * 102 .0101 .0180 .0182 (.0032) (.0057) (.0079)
Inheritance/gift squared * 106 -.0035 -.0084 -.0073 (.0017) (.0039) (.0054)
Unforthcoming score -.0198 -.0274 -.0298(.0137) (.0135) (.0136)
Hostility score .0374 .0377 .0357 (.0181) (.0182) (.0184)
Acceptance anxiety score -.0216 -.0511 -.0472(.0379) (.0386) (.0388)
Apprenticeship .2796 .2461 .2715(.0671) (.0660) (.0665)
Father manager employing < 25 .1277 .3016 .3030 (.0828) (.0779) (.0789)Father own account worker .2593 .3106 .3234 (.1329) (.1318) (.1325)Father: farmer employer .4292 1.0636 1.0580 (.2491) (.1848) (.1886)Father: farmer own account .3129 1.2834 1.3406
(.2964) (.1809) (.1833)Father: agricultural worker .3842 .3897 .3993
(.2129) (.2033) (.2034)Female -.4349 -.4865 -.4747
(.0664) (.0650) (.0650)Log county unemployment rate -.2975 -.3726 -.3382 (.1703)
(.1650) (.1661)Constant -1.0829 -.7236 -.8150 (.4503) (.4339) (.4378)Log Likelihood -1121.8 -1200.3 1174.8Chi-square statistic 152.6 242.0 238.4N 6788 6266 6187
Notes Ten regional dummies are included. Standard errors are in parentheses. These equations arenot instrumented. Column 1 is for a sub-sample of entrepreneurs who did not work in family firms.Column 2's inheritance variable is for gifts and inheritances received prior to 1978. Column 3'sinheritance variable is for gifts and inheritances received at least three years prior to entering self-

31
employment.
Source: National Child Development Study, 1981
32
Table 3. Probability (%) of Being Self-Employed at 23 by Size of Inheritance/Gift: Two Types ofIndividuals
(1) (2) (3) (4)Males Females Males Females
Zero 16.3 7.2 3.3 1.0£500 18.1 8.0 3.8 1.2£1000 20.0 9.2 4.4 1.4£5000 37.4 20.9 11.7 3.7
Columns 1 and 2 relate to a typical individual who lives in the South East, unemployment rate of 8.7%,father manager with < 25 employees, has an apprenticeship, personality scores set to means, allremaining variables set to zero.Columns 3 and 4 relate to a typical individual who lives in Scotland, unemployment rate of 14%,personality scores set to means, all remaining variables set to zero.
All estimates are derived using the coefficients in column 4 of Table 1.
Source: National Child Development Study, 1981
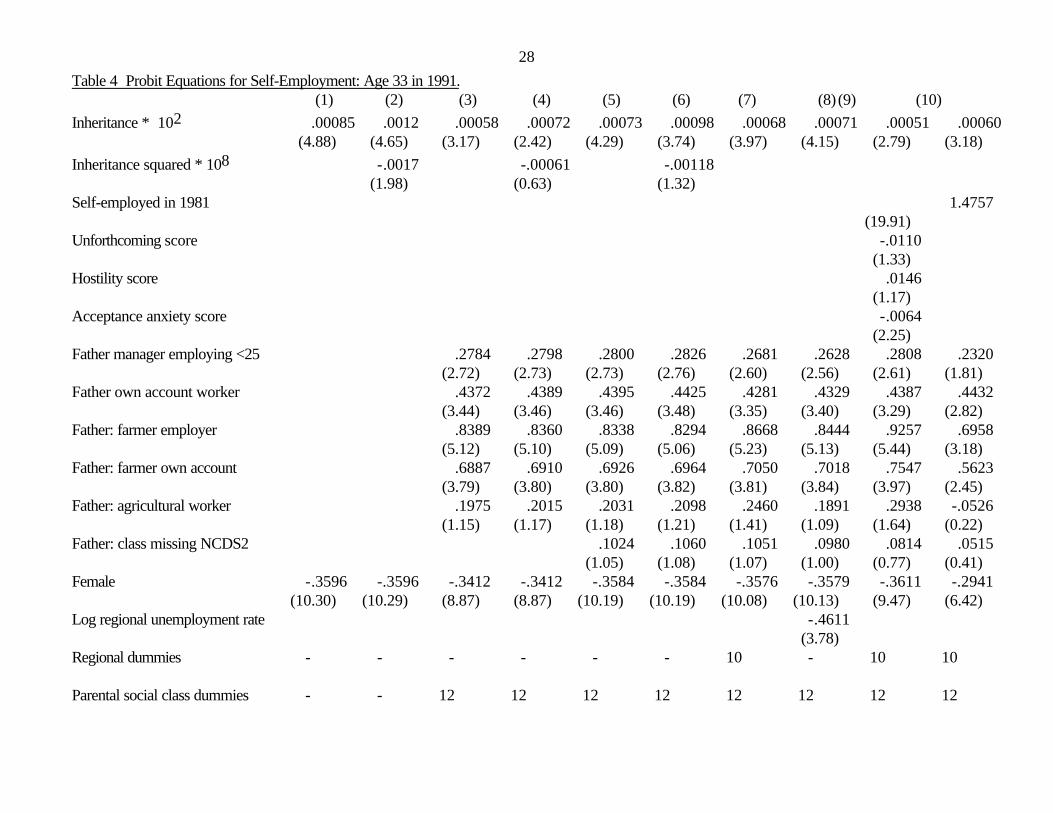
28Table 4 Probit Equations for Self-Employment: Age 33 in 1991. (1) (2) (3) (4) (5) (6) (7) (8) (9) (10)Inheritance * 102 .00085 .0012 .00058 .00072 .00073 .00098 .00068 .00071 .00051 .00060
(4.88) (4.65) (3.17) (2.42) (4.29) (3.74) (3.97) (4.15) (2.79) (3.18)Inheritance squared * 108 -.0017 -.00061 -.00118
(1.98) (0.63) (1.32)Self-employed in 1981 1.4757
(19.91)Unforthcoming score -.0110 (1.33)Hostility score .0146
(1.17)Acceptance anxiety score -.0064
(2.25)Father manager employing <25 .2784 .2798 .2800 .2826 .2681 .2628 .2808 .2320
(2.72) (2.73) (2.73) (2.76) (2.60) (2.56) (2.61) (1.81)Father own account worker .4372 .4389 .4395 .4425 .4281 .4329 .4387 .4432
(3.44) (3.46) (3.46) (3.48) (3.35) (3.40) (3.29) (2.82)Father: farmer employer .8389 .8360 .8338 .8294 .8668 .8444 .9257 .6958
(5.12) (5.10) (5.09) (5.06) (5.23) (5.13) (5.44) (3.18)Father: farmer own account .6887 .6910 .6926 .6964 .7050 .7018 .7547 .5623
(3.79) (3.80) (3.80) (3.82) (3.81) (3.84) (3.97) (2.45)Father: agricultural worker .1975 .2015 .2031 .2098 .2460 .1891 .2938 -.0526
(1.15) (1.17) (1.18) (1.21) (1.41) (1.09) (1.64) (0.22)Father: class missing NCDS2 .1024 .1060 .1051 .0980 .0814 .0515
(1.05) (1.08) (1.07) (1.00) (0.77) (0.41)Female -.3596 -.3596 -.3412 -.3412 -.3584 -.3584 -.3576 -.3579 -.3611 -.2941
(10.30) (10.29) (8.87) (8.87) (10.19) (10.19) (10.08) (10.13) (9.47) (6.42)Log regional unemployment rate -.4611
(3.78)Regional dummies - - - - - - 10 - 10 10
Parental social class dummies - - 12 12 12 12 12 12 12 12
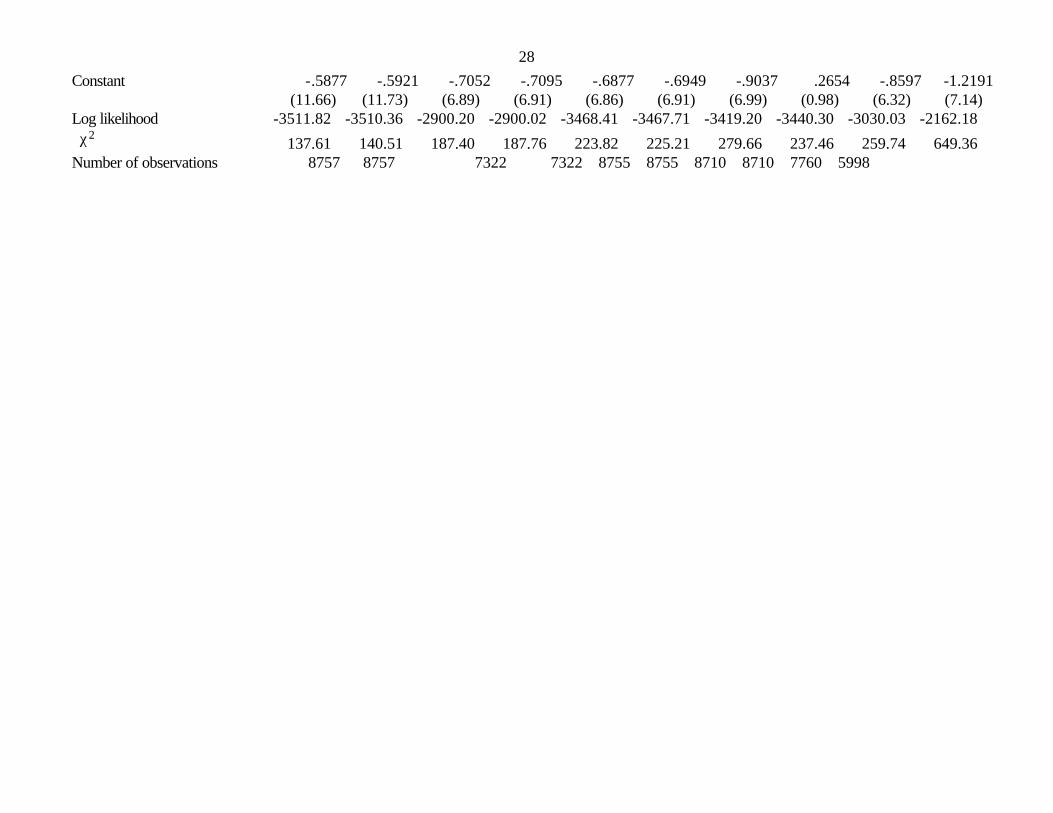
28Constant -.5877 -.5921 -.7052 -.7095 -.6877 -.6949 -.9037 .2654 -.8597 -1.2191
(11.66) (11.73) (6.89) (6.91) (6.86) (6.91) (6.99) (0.98) (6.32) (7.14)Log likelihood -3511.82 -3510.36 -2900.20 -2900.02 -3468.41 -3467.71 -3419.20 -3440.30 -3030.03 -2162.18 χ2 137.61 140.51 187.40 187.76 223.82 225.21 279.66 237.46 259.74 649.36Number of observations 8757 8757 7322 7322 8755 8755 8710 8710 7760 5998

Table 5. Probability (%) of Being Self-Employed at Age 33 by Size of Inheritance/Gift, 1991: TwoTypes of Individuals
Male Female Male Female(1) (2) (3) (4)
Zero 32.4 20.9 15.4 8.4£25000 37.4 24.8 18.7 10.6
Columns 1 and 2 relate to a typical individual who lives in the South East, whose father was a managerwith <25 employees, with the personality scores set to their means. Columns 3 and 4 relate to a typicalindividual who lives in Scotland, whose father was a manager with >25 employees, with the personalityscores set to their means.All estimates are derived using the coefficients in column 9 of Table 4.
Source: National Child Development Study, 1991
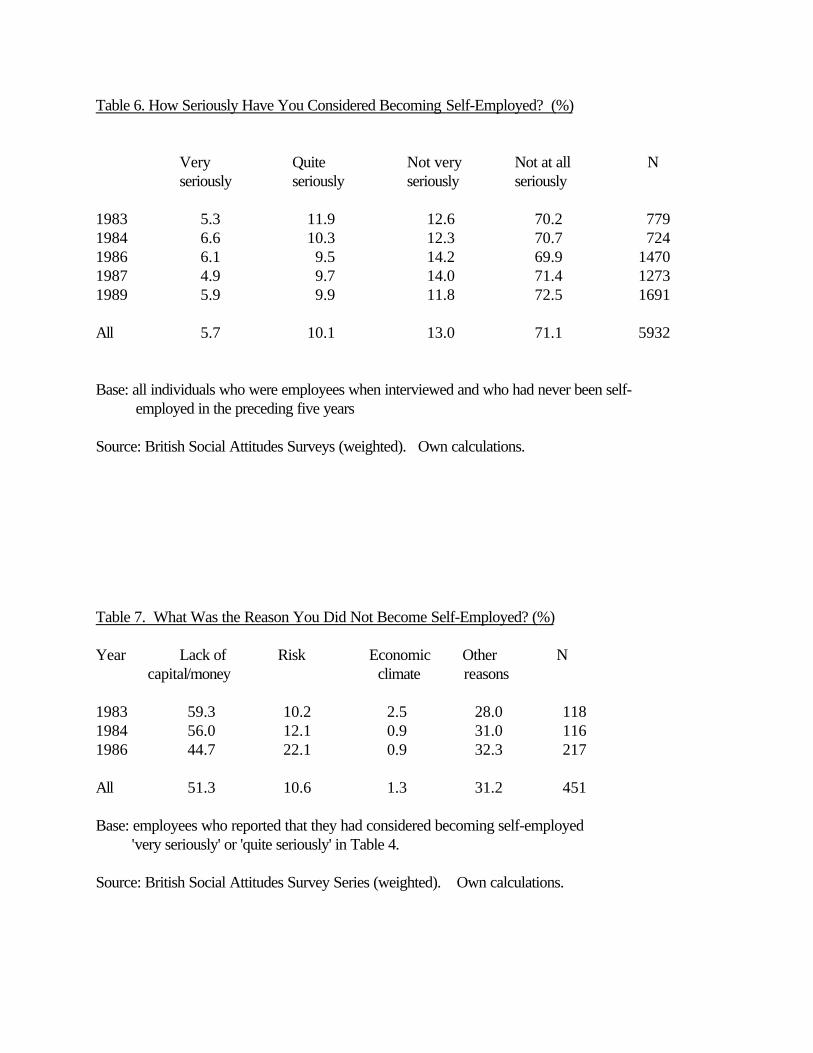
Table 6. How Seriously Have You Considered Becoming Self-Employed? (%)
Very Quite Not very Not at all Nseriously seriously seriously seriously
1983 5.3 11.9 12.6 70.2 7791984 6.6 10.3 12.3 70.7 7241986 6.1 9.5 14.2 69.9 14701987 4.9 9.7 14.0 71.4 12731989 5.9 9.9 11.8 72.5 1691
All 5.7 10.1 13.0 71.1 5932
Base: all individuals who were employees when interviewed and who had never been self- employed in the preceding five years
Source: British Social Attitudes Surveys (weighted). Own calculations.
Table 7. What Was the Reason You Did Not Become Self-Employed? (%)
Year Lack of Risk Economic Other N capital/money climate reasons
1983 59.3 10.2 2.5 28.0 1181984 56.0 12.1 0.9 31.0 1161986 44.7 22.1 0.9 32.3 217
All 51.3 10.6 1.3 31.2 451
Base: employees who reported that they had considered becoming self-employed 'very seriously' or 'quite seriously' in Table 4.
Source: British Social Attitudes Survey Series (weighted). Own calculations.

Table 8. What Help Would Have Been Most Useful to You in Setting-up in Business? (%)
Money/finance 26.3How to start-up 7.8Govt regulations 0.8Tax advice 9.1Bookkeeping 4.1Legal advice 1.2Finding premises 2.5Finding clients 3.7Marketing/advertising 1.6General advice 5.3Others 5.1No help desired 32.5
# of observations 243
Base: adults who had become self-employed in the previous four years, were still self-employed and had fewer than six employees.
Source: National Survey of the Self-employed. Own calculations.
Table 9. What Was Your Biggest Concern with Becoming Self-employed? (%)
Where to get finance 20.1
Cashflow 10.8How to start 4.3Where to get advice 5.0Finding premises 5.0Finding clients 10.1Competition 3.6No guaranteed income 14.4Losing savings 2.9Understanding tax14.4Understanding book-keeping 3.6Pension 2.9Employing people 2.2Effect on family 4.3Others 8.0No concerns 3.6# of observations 139Base: those 'seriously intending' to become self-employed in the next few months.Source: National

Survey of the Self-employed. Own calculations.
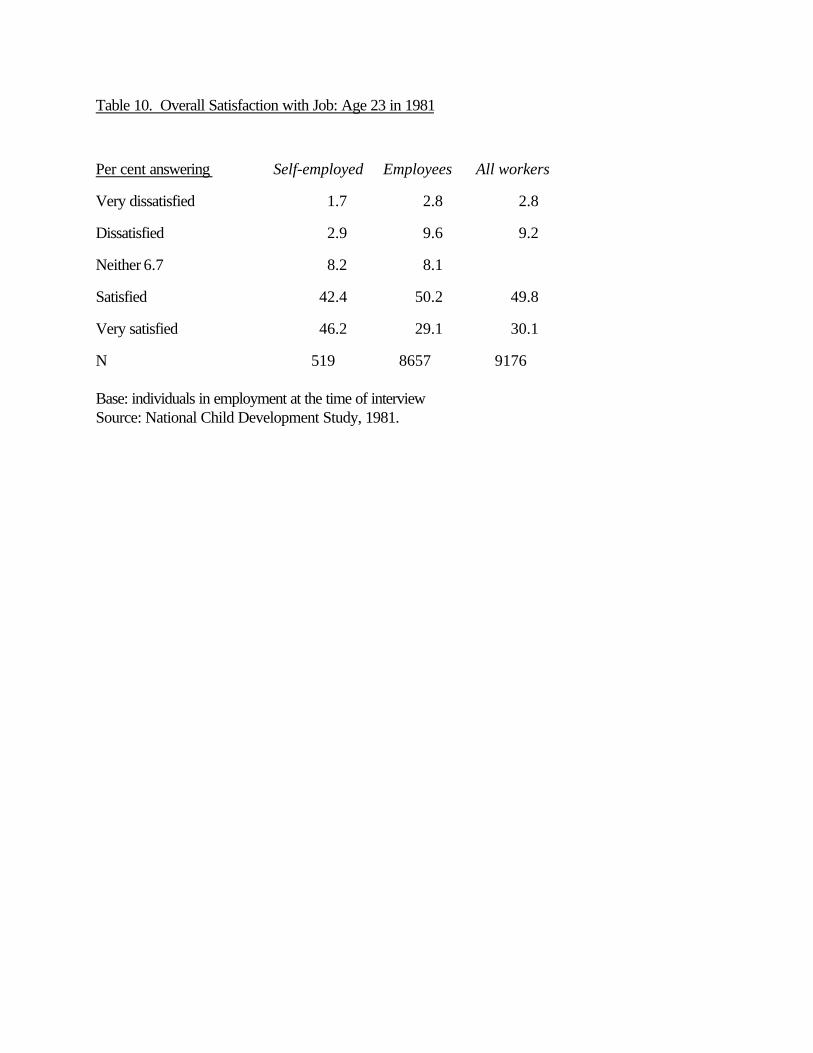
Table 10. Overall Satisfaction with Job: Age 23 in 1981
Per cent answering Self-employed Employees All workers
Very dissatisfied 1.7 2.8 2.8
Dissatisfied 2.9 9.6 9.2
Neither 6.7 8.2 8.1
Satisfied 42.4 50.2 49.8
Very satisfied 46.2 29.1 30.1
N 519 8657 9176
Base: individuals in employment at the time of interviewSource: National Child Development Study, 1981.
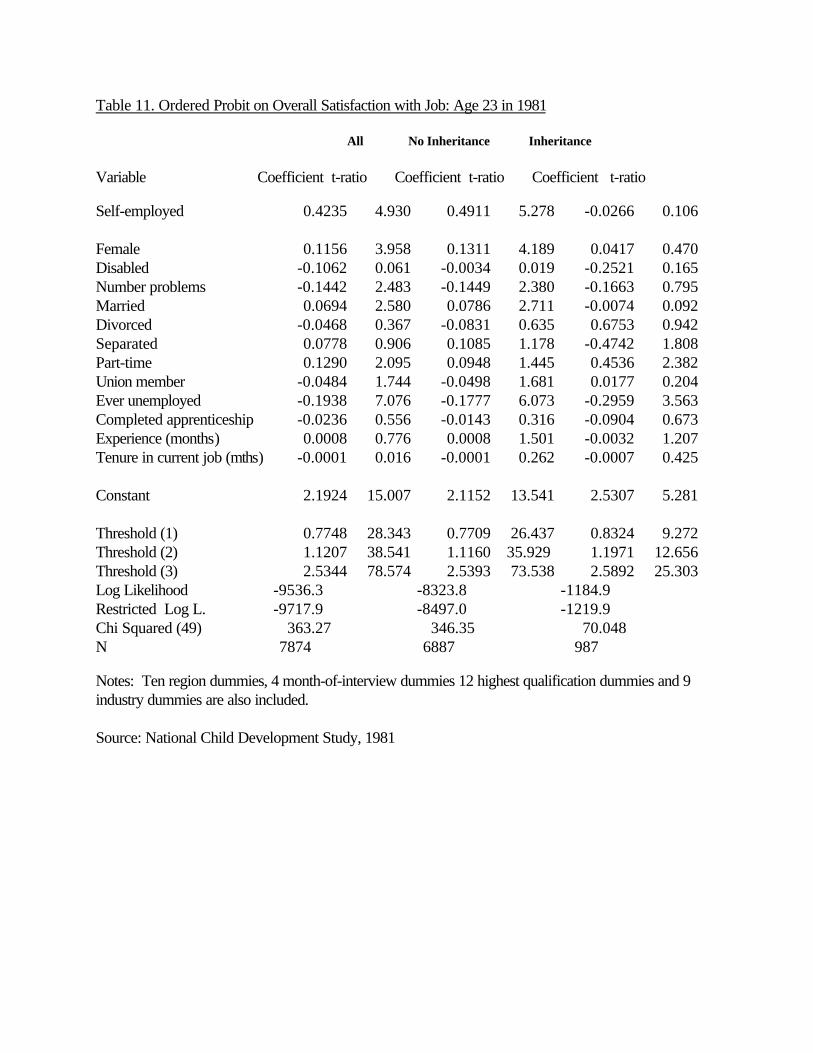
Table 11. Ordered Probit on Overall Satisfaction with Job: Age 23 in 1981
All No Inheritance Inheritance
Variable Coefficient t-ratio Coefficient t-ratio Coefficient t-ratio
Self-employed 0.4235 4.930 0.4911 5.278 -0.0266 0.106
Female 0.1156 3.958 0.1311 4.189 0.0417 0.470Disabled -0.1062 0.061 -0.0034 0.019 -0.2521 0.165Number problems -0.1442 2.483 -0.1449 2.380 -0.1663 0.795Married 0.0694 2.580 0.0786 2.711 -0.0074 0.092Divorced -0.0468 0.367 -0.0831 0.635 0.6753 0.942Separated 0.0778 0.906 0.1085 1.178 -0.4742 1.808Part-time 0.1290 2.095 0.0948 1.445 0.4536 2.382Union member -0.0484 1.744 -0.0498 1.681 0.0177 0.204Ever unemployed -0.1938 7.076 -0.1777 6.073 -0.2959 3.563Completed apprenticeship -0.0236 0.556 -0.0143 0.316 -0.0904 0.673Experience (months) 0.0008 0.776 0.0008 1.501 -0.0032 1.207Tenure in current job (mths) -0.0001 0.016 -0.0001 0.262 -0.0007 0.425
Constant 2.1924 15.007 2.1152 13.541 2.5307 5.281
Threshold (1) 0.7748 28.343 0.7709 26.437 0.8324 9.272Threshold (2) 1.1207 38.541 1.1160 35.929 1.1971 12.656Threshold (3) 2.5344 78.574 2.5393 73.538 2.5892 25.303Log Likelihood -9536.3 -8323.8 -1184.9 Restricted Log L. -9717.9 -8497.0 -1219.9Chi Squared (49) 363.27 346.35 70.048N 7874 6887 987
Notes: Ten region dummies, 4 month-of-interview dummies 12 highest qualification dummies and 9industry dummies are also included.
Source: National Child Development Study, 1981
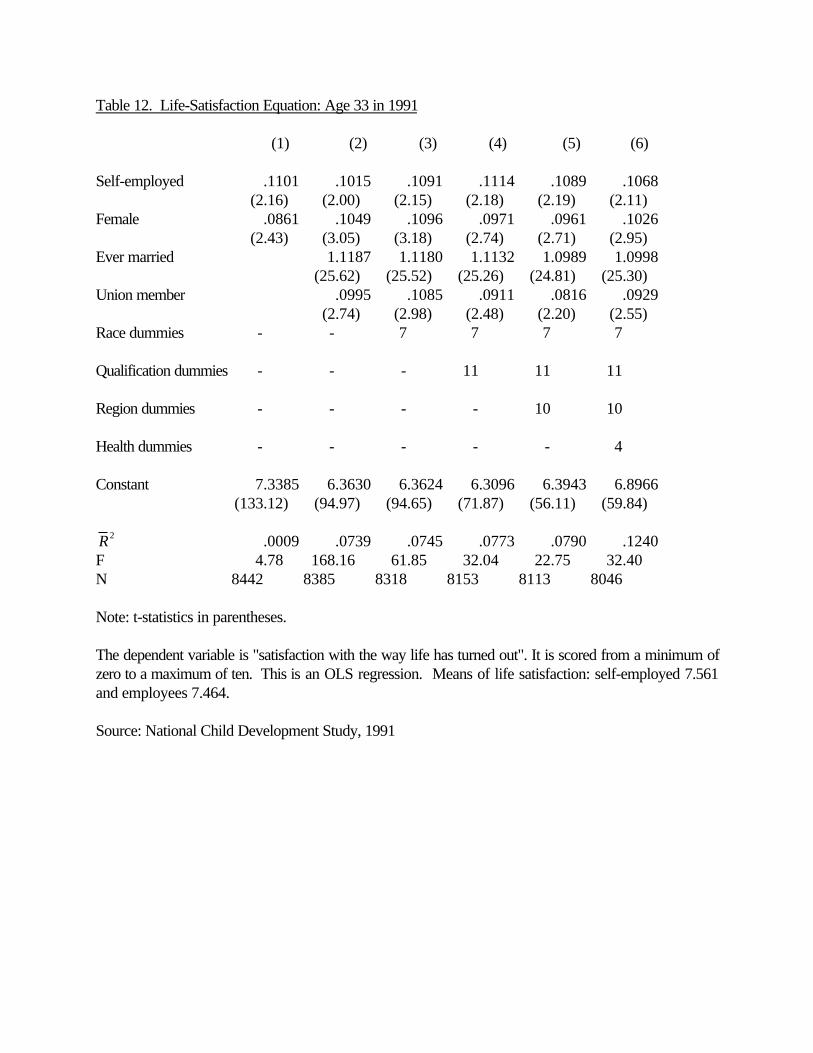
Table 12. Life-Satisfaction Equation: Age 33 in 1991
(1) (2) (3) (4) (5) (6)
Self-employed .1101 .1015 .1091 .1114 .1089 .1068(2.16) (2.00) (2.15) (2.18) (2.19) (2.11)
Female .0861 .1049 .1096 .0971 .0961 .1026(2.43) (3.05) (3.18) (2.74) (2.71) (2.95)
Ever married 1.1187 1.1180 1.1132 1.0989 1.0998(25.62) (25.52) (25.26) (24.81) (25.30)
Union member .0995 .1085 .0911 .0816 .0929(2.74) (2.98) (2.48) (2.20) (2.55)
Race dummies - - 7 7 7 7
Qualification dummies - - - 11 11 11
Region dummies - - - - 10 10
Health dummies - - - - - 4
Constant 7.3385 6.3630 6.3624 6.3096 6.3943 6.8966(133.12) (94.97) (94.65) (71.87) (56.11) (59.84)
R 2 .0009 .0739 .0745 .0773 .0790 .1240F 4.78 168.16 61.85 32.04 22.75 32.40N 8442 8385 8318 8153 8113 8046
Note: t-statistics in parentheses.
The dependent variable is "satisfaction with the way life has turned out". It is scored from a minimum ofzero to a maximum of ten. This is an OLS regression. Means of life satisfaction: self-employed 7.561and employees 7.464.
Source: National Child Development Study, 1991

Appendix A: Proofs
Proof of Proposition 3
It cannot be the case that p(e*) + i < w, because entrepreneurs would leave for the wage-sector, which
pays w. Thus, either marginal entrepreneurial utility, p(e*) + i, is equal to w, or, because people are
held back by capital constraints, it exceeds it. As p(e) is a decreasing function -- it is an array of
decreasingly desirable projects -- all other entrepreneurs earn higher profit than the one operating the
marginal project. Hence, all but the marginal entrepreneur receives strictly more utility than regular
workers, and the marginal entrepreneur gets no less utility than regular workers.
Proof of Proposition 4
The sum of entrepreneurs' utilities is given by
(π(e) + i) de0
e*
(5)and average entrepreneurial utility by

(π(e) + i) de0
e*
βZ . (6)
Each worker in the wage sector gets utility equal to the wage w. There are P - ßZ individuals working
in that sector. This is because the supply of entrepreneurs is constrained to be the product of ß (those
with entrepreneurial vision) and Z (those with capital).
Assuming that the equilibrium is one where there is an aggregate shortage of individuals with
capital, free-entry does not eliminate the difference in returns to the marginal entrepreneur between the
wage sector and the entrepreneurial sector. Let the average utility gap between the entrepreneurial

sector and the wage sector be denoted ν. It is given algebraically by
ν =
π(e) + i0
βZ
de
βZ - f' (P - βZ)
(7)
where the latter term is the marginal product of labor in the wage sector. A rise in Z, the total number of
individuals with sufficient capital to run their own business, increases the numbers setting up enterprises.
This drives down the marginal entrepreneurial return and, by inducing workers to leave the wage-sector,
raises the marginal product of labor there. Hence the utility difference, ν, changes by:
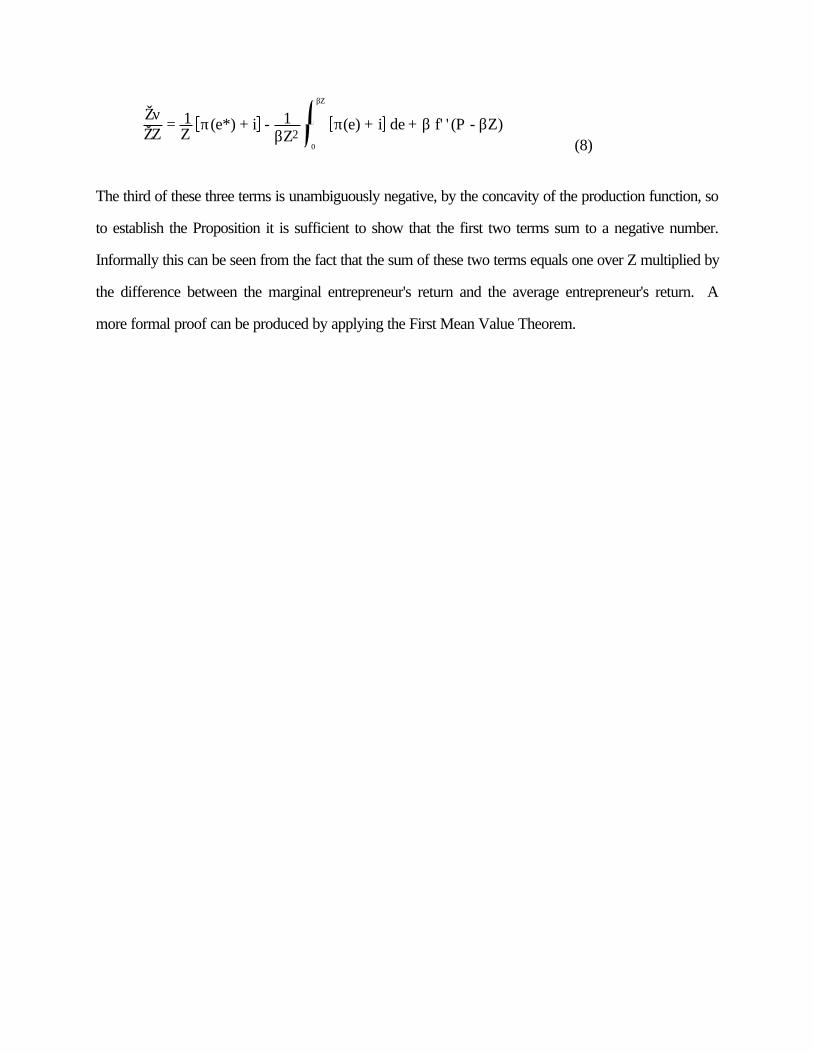
ŽνŽZ
= 1Z
π(e*) + i - 1βZ2
π(e) + i0
βZ
de + β f' ' (P - βZ) (8)
The third of these three terms is unambiguously negative, by the concavity of the production function, so
to establish the Proposition it is sufficient to show that the first two terms sum to a negative number.
Informally this can be seen from the fact that the sum of these two terms equals one over Z multiplied by
the difference between the marginal entrepreneur's return and the average entrepreneur's return. A
more formal proof can be produced by applying the First Mean Value Theorem.

Appendix B: Further Data Sources
1. British Social Attitudes Survey Series, 1983-1989This series of surveys, core-funded by the Sainsbury Family Trusts, was designed to chart movements ina wide range of social attitudes in Britain. The data derive from annual cross-sectional surveys from arepresentative sample of adults aged 18 or over living in private households in Great Britain whoseaddresses were on the electoral register. The first three surveys involved around 1800 adults; thenumbers were increased to 3000 in 1986. The sampling in each year involved a stratified multi-stagedesign with four separate stages of selection. For further details of the survey designs, non-responsesetc. see British Social Attitudes, 1983, 1984, 1985, 1986, 1987, 1989, 1990 edited by R. Jowell, S.Witherspoon and L. Brook, SCPR, Gower Press.
2. National Survey of the Self-Employed, 1987In February and March 1987 the British Department of Employment commissioned a nationallyrepresentative sample of 12,000 British adults. Interviews were then conducted with three sub-groupsdrawn from this initial sample: past, present and future self-employed. In this paper we focus on thelatter two groups. They were selected according to the following criteria.1) Current self-employed - adults who had become self-employed in the previous four years, 1983-1987, were still self-employed and had fewer than six employees (243 interviews).2) Potential self-employed - adults who said they were 'seriously intending' to take up self-employmentin the next 12 months (139 interviews).
3. The International Social Survey Programme, 1989 and 1991.The International Social Survey Programme (ISSP) is a voluntary grouping of study teams (11 in 1989and 13 in 1991) each of which undertakes to run a short, annual self-completion survey containing thesame set of questions in each country. The surveys are probability-based national samples of adults.The topics change from year to year, with a view to replication every five years or so. Surveys arecurrently available for the years 1985-1991.
4. The General Social Surveys 1972-1990.The General Social Surveys (GSS) have been conducted by the National Opinion Research Center atthe University of Chicago for the years 1972-1990. There were no surveys in 1979 and 1981. Eachsurvey is an independently drawn sample of English-speaking persons 18 years of age or over, living innon-institutional arrangements within the United States.

38Appendix C: Variable Definitions in the National Child Development Study (NCDS)
Variable Definitions Year of NCDS Description Mean
1. Independent variables
a) NCDS4
Inheritance/gift 4 the value of any inheritance or gift received above a threshold value (£) 378.21Unforthcoming score 1T unforthcoming score in psychological test: 0 = forthcoming 1.6588Hostility score 1T hostility-to-children score in psychological test : 0 = not hostile 0.6658Acceptance anxiety score 1T anxiety-for-acceptance-by-children score in psychological test: 0 = not anxious .2994Father manager (< 25) 2P (1,0) dummy if father was a manager in central, local government,
industry or commerce in an establishment employing < 25 people .1209Father: own account worker 2P (1,0) dummy if father worked "on his own account" .0341Father: farmer employer 2P (1,0) dummy if father was a farmer and employer .0108Father: farmer own account 2P (1,0) dummy if father was a farmer on his own account .0098Father: agricultural worker 2P (1,0) dummy if father was an agricultural worker .0131County unemployment rate 4 the county unemployment rate in natural logarithms 2.4032Female 4 (1,0) dummy if female .4425Apprenticeship 4 (1,0) dummy if the respondent had ever taken an apprenticeship .1784
b) NCDS5Mean
Inheritance/gift 5 the value of inheritance or gift received (£) 1563.0Unforthcoming score 1T unforthcoming score: 0 = forthcoming 1.6839Hostility score 1T hostility-to-children score: 0 = not hostile 0.6715Acceptance anxiety score 1T anxiety-for-acceptance-by-children score: 0 = not anxious 0.3403Father manager (< 25) 2P (1,0) dummy if father was a manager in central, local government,
industry or commerce in an establishment employing < 25 people .0925Father: own account worker 2P (1,0) dummy if father worked on his own account .0266Father: farmer employer 2P (1,0) dummy if father farmer - employer .0102Father: farmer own account 2P (1,0) dummy if father farmer - own account .0085Father: agricultural worker 2P (1,0) dummy if father agricultural worker .0117
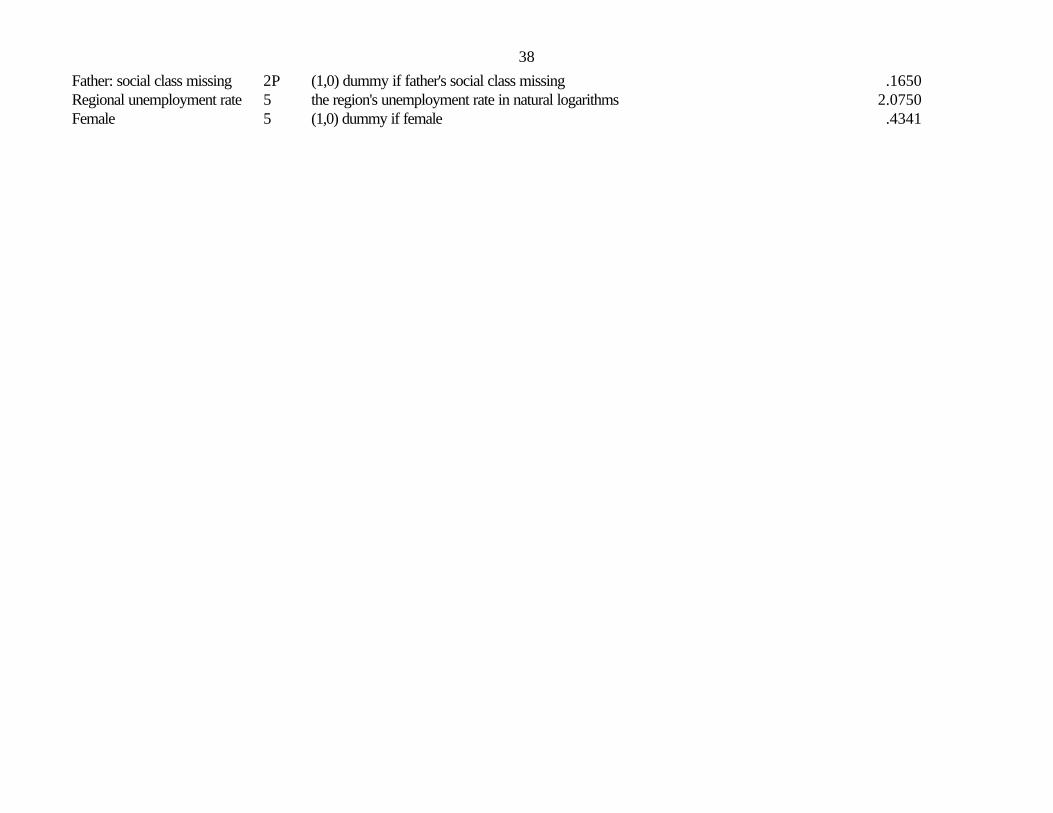
38Father: social class missing 2P (1,0) dummy if father's social class missing .1650Regional unemployment rate 5 the region's unemployment rate in natural logarithms 2.0750Female 5 (1,0) dummy if female .4341
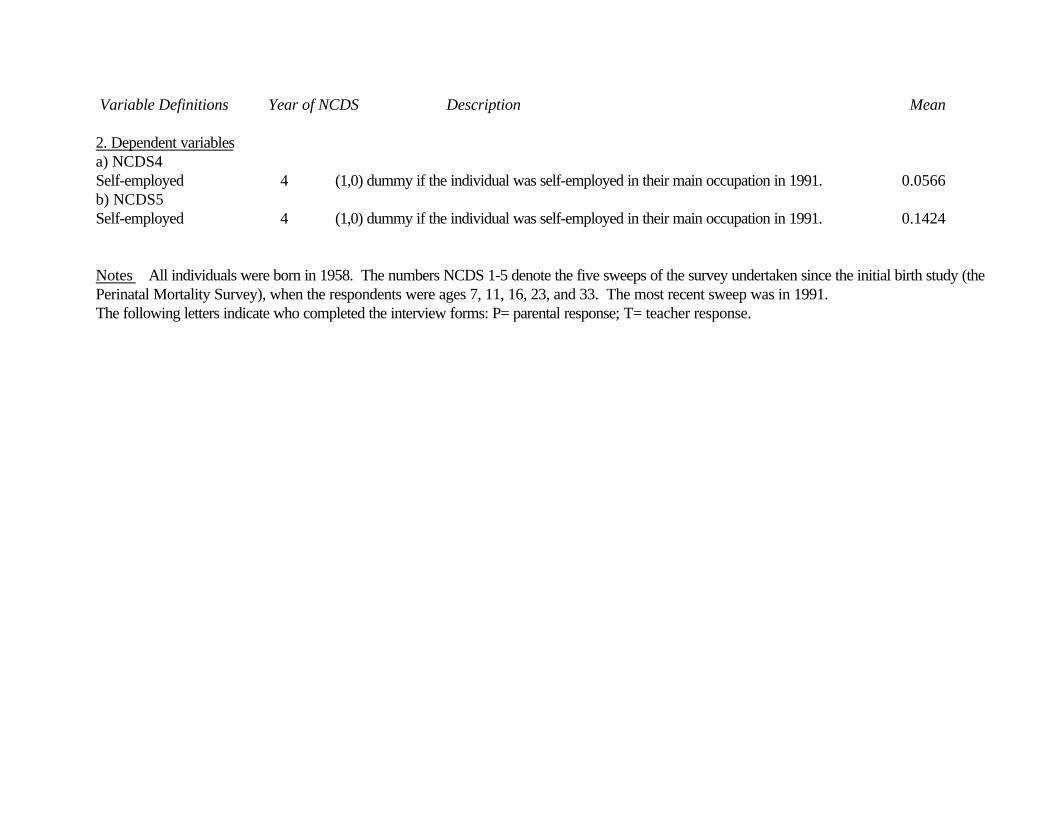
Variable Definitions Year of NCDS Description Mean
2. Dependent variablesa) NCDS4Self-employed 4 (1,0) dummy if the individual was self-employed in their main occupation in 1991. 0.0566b) NCDS5Self-employed 4 (1,0) dummy if the individual was self-employed in their main occupation in 1991. 0.1424
Notes All individuals were born in 1958. The numbers NCDS 1-5 denote the five sweeps of the survey undertaken since the initial birth study (thePerinatal Mortality Survey), when the respondents were ages 7, 11, 16, 23, and 33. The most recent sweep was in 1991.The following letters indicate who completed the interview forms: P= parental response; T= teacher response.
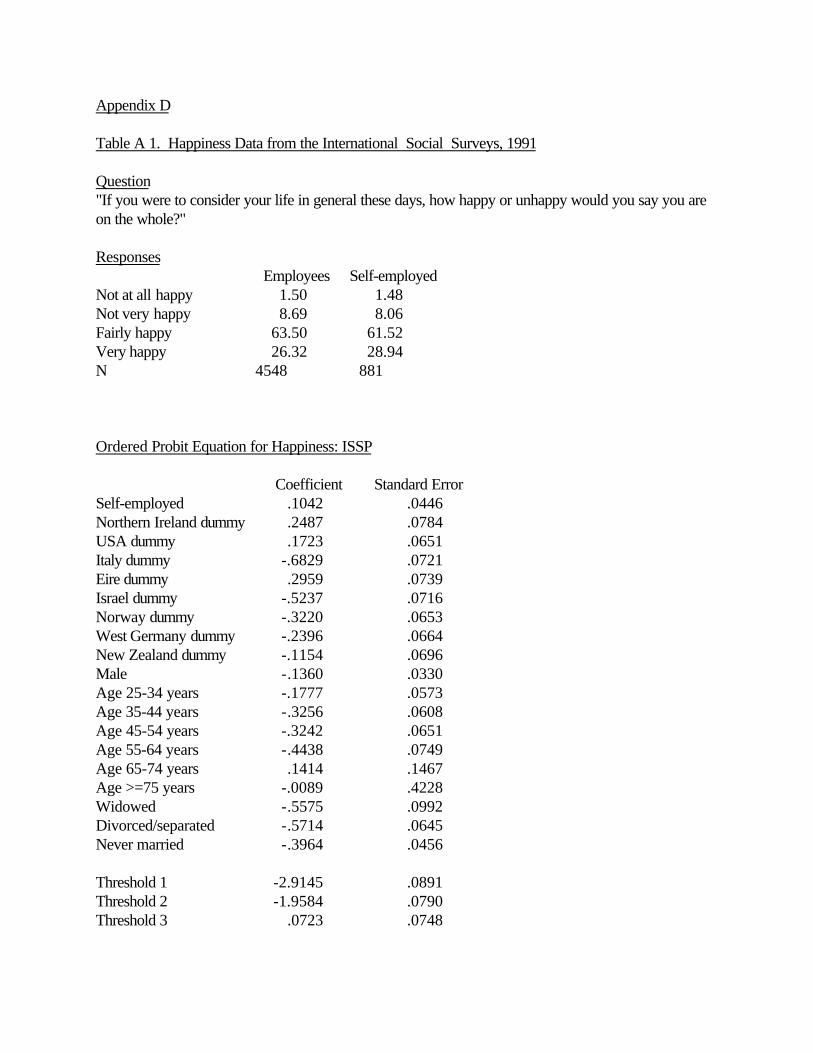
Appendix D
Table A 1. Happiness Data from the International Social Surveys, 1991
Question"If you were to consider your life in general these days, how happy or unhappy would you say you areon the whole?"
Responses Employees Self-employedNot at all happy 1.50 1.48Not very happy 8.69 8.06Fairly happy 63.50 61.52Very happy 26.32 28.94N 4548 881
Ordered Probit Equation for Happiness: ISSP
Coefficient Standard ErrorSelf-employed .1042 .0446Northern Ireland dummy .2487 .0784USA dummy .1723 .0651Italy dummy -.6829 .0721Eire dummy .2959 .0739Israel dummy -.5237 .0716Norway dummy -.3220 .0653West Germany dummy -.2396 .0664New Zealand dummy -.1154 .0696Male -.1360 .0330Age 25-34 years -.1777 .0573Age 35-44 years -.3256 .0608Age 45-54 years -.3242 .0651Age 55-64 years -.4438 .0749Age 65-74 years .1414 .1467Age >=75 years -.0089 .4228Widowed -.5575 .0992Divorced/separated -.5714 .0645Never married -.3964 .0456
Threshold 1 -2.9145 .0891Threshold 2 -1.9584 .0790Threshold 3 .0723 .0748

Log Likelihood -4665.5664N 5387chi2(19) 517.32Pseudo R2 0.0525
Excluded categories: Great Britain, <25 years, marriedBecause of missing values, N is slightly smaller than the sum of 4548 and 881.
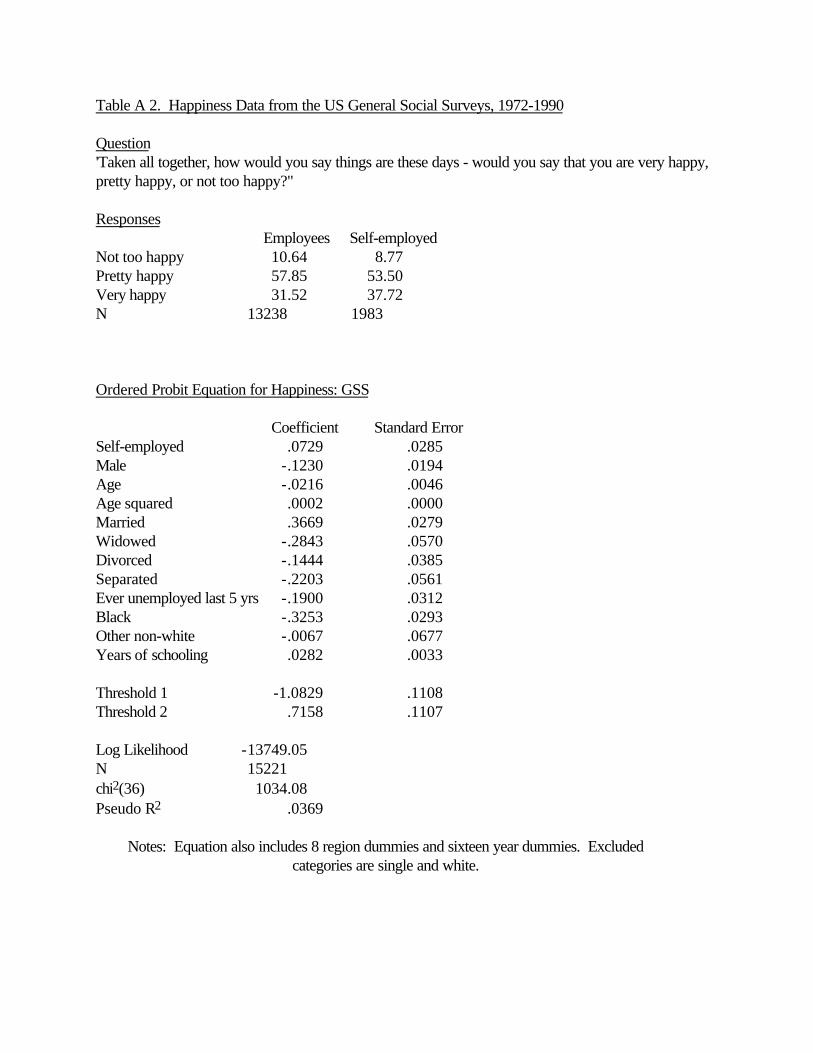
Table A 2. Happiness Data from the US General Social Surveys, 1972-1990
Question'Taken all together, how would you say things are these days - would you say that you are very happy,pretty happy, or not too happy?"
Responses Employees Self-employedNot too happy 10.64 8.77Pretty happy 57.85 53.50Very happy 31.52 37.72N 13238 1983
Ordered Probit Equation for Happiness: GSS
Coefficient Standard ErrorSelf-employed .0729 .0285Male -.1230 .0194Age -.0216 .0046Age squared .0002 .0000Married .3669 .0279Widowed -.2843 .0570Divorced -.1444 .0385Separated -.2203 .0561Ever unemployed last 5 yrs -.1900 .0312Black -.3253 .0293Other non-white -.0067 .0677Years of schooling .0282 .0033
Threshold 1 -1.0829 .1108Threshold 2 .7158 .1107
Log Likelihood -13749.05 N 15221chi2(36) 1034.08 Pseudo R2 .0369
Notes: Equation also includes 8 region dummies and sixteen year dummies. Excludedcategories are single and white.
References
Argyle, Michael (1989), The psychology of happiness, Routledge, London.
Black, Jane and David de Meza (1992), 'House prices and entrepreneurship', mimeo, Exeter University.
Blanchflower, David G. and Freeman, R.B. (1994), 'The legacy of communist labor relations', National Bureau of Economic Research, Working Paper 4740, Cambridge, Mass.
Blanchflower, David G. and Oswald, Andrew J. (1990a), 'What makes a young entrepreneur?', National Bureau of Economic Research, Working paper 3252, Cambridge, Mass.
_____________________________(1990b), 'Self-employment and the enterprise culture', in British Social Attitudes: the 1990 Report, edited by Jowell, R., Witherspoon, S. and Jowell,
R., Gower Press, Aldershot.
Blanchflower, David G. and Meyer, Bruce (1994), 'A longitudinal analysis of the young self-employed in Australia and the United States', Small Business Economics, 6, 1-20.
Blau, David (1987), 'A time-series analysis of self-employment in the United States', Journal of PoliticalEconomy, 95, 445-467.
Borjas, George J. (1979), 'Job satisfaction, wages and unions', Journal of Human Resources, 14, 21-40.
Borjas, George J. and Stephen Bronars, S. (1989), 'Consumer discrimination and self- employment',Journal of Political Economy, 97, 581-605.
Casson, Mark C.(1990), 'Entrepreneurship: a model of risky innovation under capital constraints', DP235, University of Reading.
Clark, Andrew E. and Oswald, Andrew J. (1992), 'Satisfaction and comparison income', mimeo,Essex University and Centre for Economic Performance, London School of Economics.
Clark, Andrew E. and Oswald, Andrew J. (1994), 'Unhappiness and unemployment', EconomicJournal, 104, 648-659..
Cox, Donald (1987), 'Motives for private income transfers', Journal of Political Economy, 95,508-546
De Witt, Gerrit and Van Winden, Frans A. (1990), ‘An empirical analysis of self-employment in the Netherlands’, Economics Letters, 32, 97-100.
Elias, Peter and Blanchflower, David G. (1989), The occupations, earnings and work histories of
young adults - who gets the good jobs?, Research Paper No. 68, Department of Employment, London.
Evans, David and Leighton, Linda (1989), 'Some empirical aspects of entrepreneurship', American Economic Review, 79, 519-535.
_________ and Jovanovic, Boyan (1989), 'An estimated model of entrepreneurial choice under liquidity constraints', Journal of Political Economy, 97, 808-827.
Freeman, Richard B. (1978), 'Job satisfaction as an economic variable', American Economic Review, 68, 135-141.
Fuchs, Victor (1982), 'Self-employment and labor force participation of older males', Journal of Human Resources, 17, Fall, 339-357.
Goffee, Robert and Richard Scase (1987), Entrepreneurship in Europe. The social processes (eds.), Croom Helm, London.
Grossman, Gene (1984), 'International trade, foreign investment and the formation of the entrepreneurial class', American Economic Review, 74, 4, 605-614.
Hamermesh, Daniel S. (1977), 'Economic aspects of job satisfaction', in O. Ashenfelter and Wallace Oates (ed.), Essays in Labor Market Analysis, John Wiley, New York.
Holmes, Thomas J. and Schmitz, James A. (1990), 'A theory of entrepreneurship and itsapplication to the study of business transfers', Journal of Political Economy, 89, 265-294.
Holmes, Thomas J. and Schmitz, James A. (1991), 'Measuring small business dynamics when ownersand their businesses can be separately identified', mimeo.
Holtz-Eakin, Douglas, Joulfaian, David, and Rosen, Harvey S. (1994a), 'Entrepreneurial decisions and liquidity constraints', Journal of Political Economy, 102, 53-75.
___________________________________________________ (1994b), 'Sticking it out: entrepreneurial survival and liquidity constraints', Rand Journal of Economics, forthcoming.
Jowell, Roger et al (1990), British Social Attitudes: The 7th Report, Gower Press, Aldershot.
Kanbur, S.M.Ravi (1982), 'Entrepreneurial risk taking, inequality, and public policy: an application ofinequality decomposition analysis to the general equilibrium effects of progressive taxation', Journal ofPolitical Economy, 90, 1-21.
Kihlstrom, Richard.E. and Laffont, Jean Jacques (1979), 'A general equilibrium entrepreneurial theoryof firm formation based on risk aversion', Journal of Political Economy, 87, 719- 848.

Kirzner, Israel M. (1973), Competition and entrepreneurship, University of Chicago Press, Chicago.
Knight, Frank H. (1921), Risk, uncertainty and profit, New York, Houghton Mifflin.
Lentz. B.F. and Laband, D.N. (1990), 'Entrepreneurial success and occupational inheritance amongproprietors', Canadian Journal of Economics, 23, 563-579.
Meng, Ronald (1990), 'The relationship between unions and job satisfaction', Applied Economics, 22, 1635-1648
Meyer, Bruce (1990), 'Why are there so few black entrepreneurs?', Working Paper No. 3537, National Bureau of Economic Research.
Miller, Paul (1990), 'Trade unions and job satisfaction', Australian Economic Papers, December, 226-248.
OECD (1986), 'Self-employment in OECD countries', OECD Economic Outlook, September,43-65.
Pickles, A.R. and O'Farrell, P.N. (1987), 'An analysis of entrepreneurial behavior from malework histories', Regional Studies, 21, 425-444.
Rees, Hedley and Shah, Anup (1986), 'An empirical analysis of self-employment in the UK',Journal of Applied Econometrics, 1, 95-108.
Reid, Gavin C. and Jacobsen, L.R. (1988), The small entrepreneurial firm, Aberdeen University Press, Aberdeen.
Reid, Gavin C. (1990), 'Analysing rankings, with an application to the financing of small entrepreneurial firms', Economic Journal, 100, Supplement, 200-205.
Rosen, Sherwin (1983), 'Economics and entrepreneurs', in Entrepreneurship, edited by JoshuaRonen, Lexington Books, Lexington, Mass.
Schumpeter, Joseph A. (1939), Business cycles: a theoretical, historical and statistical analysis of thecapitalist process, 2 volumes, New York, McGraw-Hill.
Shorrocks, Anthony F. (1988), 'Wealth holdings and entrepreneurial activity' in Kessler, D. and Masson, A. (eds), Modelling the accumulation and distribution of wealth, Clarendon Press,
Oxford.
Schwochau, Susan (1987), 'Union effects on job attitudes', Industrial and Labor Relations Review, 40, 2, 209-224.

Warr, Peter B. (ed.) (1985), Psychology at work, Harmondsworth, Penguin.
Wilhelm, Mark (1991), 'Inheritance and labor earnings', Working paper, Penn State University.