What is the Cost of Formality?
31
What is the Cost of Formality? Experimentally estimating the demand for formalization # Suresh de Mel, University of Peradeniya David McKenzie, World Bank Christopher Woodruff, University of Warwick Revised July 2011 Abstract: Does reducing the cost of registering firms lead to significant formalization by firms in the informal sector? In spite of moves by many governments to simplify procedures and reduce costs of registration, answering this question has proven difficult because none of the programs, to date, have been implemented in a random fashion. We report on the results of a field experiment which approaches this question from a different angle. We provided incentives to register to randomly selected informal sector firms in Sri Lanka. In our lightest treatment, we offered only information about the registration process and reimbursement for direct registration costs. This treatment induced less than two percent of firms to register. Adding payments of one-half to one month’s (median firm’s) profit leads to registration of around one-fifth of firms. A larger payment of two month’s (median firm’s) profit induces half of the firms to register. Among the firms not registering after being offered this larger incentive, most faced issues related to ownership of land. Follow-up surveys 15 and 22 months after the intervention finds some evidence for higher profits and sales among firms which formalized, although this seems largely due to the experiences of a few firms which grew rapidly. Firms which formalized were more likely to advertise and use receipt books, but there were no significant impacts on other channels such as use of bank finance or sales to the government. Formalizing is also found to result in a large increase in trust in the state. Keywords: Informality, Small Enterprises, Entrepreneurship JEL codes: O17, O12, C93, D21, L26 # We thank the World Bank, the Knowledge for Change Program Trust Fund, DFID, and the Ewing Marion Kauffman Foundation for funding for this project. We thank Bill Maloney and seminar participants at LSE, Cambridge, UC Berkeley, the University of Washington-St Louis, and the World Bank for helpful comments. All opinions offered represent those of the authors alone, and do not necessarily reflect the views of the World Bank, its Executive Directors, or the countries they represent.
Transcript of What is the Cost of Formality?

What is the Cost of Formality?
Experimentally estimating the demand for formalization#
Suresh de Mel, University of Peradeniya
David McKenzie, World Bank
Christopher Woodruff, University of Warwick
Revised July 2011
Abstract:
Does reducing the cost of registering firms lead to significant formalization by firms in the informal
sector? In spite of moves by many governments to simplify procedures and reduce costs of registration,
answering this question has proven difficult because none of the programs, to date, have been
implemented in a random fashion. We report on the results of a field experiment which approaches this
question from a different angle. We provided incentives to register to randomly selected informal sector
firms in Sri Lanka. In our lightest treatment, we offered only information about the registration process
and reimbursement for direct registration costs. This treatment induced less than two percent of firms to
register. Adding payments of one-half to one month’s (median firm’s) profit leads to registration of
around one-fifth of firms. A larger payment of two month’s (median firm’s) profit induces half of the
firms to register. Among the firms not registering after being offered this larger incentive, most faced
issues related to ownership of land. Follow-up surveys 15 and 22 months after the intervention finds some
evidence for higher profits and sales among firms which formalized, although this seems largely due to
the experiences of a few firms which grew rapidly. Firms which formalized were more likely to advertise
and use receipt books, but there were no significant impacts on other channels such as use of bank finance
or sales to the government. Formalizing is also found to result in a large increase in trust in the state.
Keywords: Informality, Small Enterprises, Entrepreneurship
JEL codes: O17, O12, C93, D21, L26
# We thank the World Bank, the Knowledge for Change Program Trust Fund, DFID, and the Ewing Marion
Kauffman Foundation for funding for this project. We thank Bill Maloney and seminar participants at LSE,
Cambridge, UC Berkeley, the University of Washington-St Louis, and the World Bank for helpful comments. All
opinions offered represent those of the authors alone, and do not necessarily reflect the views of the World Bank, its
Executive Directors, or the countries they represent.
1
1. Introduction
The majority of firms in most developing countries are informal. In Sri Lanka, for example, only
one-fifth of firms operating without paid workers are registered with any government agency. Even
among firms employing paid workers, a significant percentage are also unregistered at every agency.
Policymakers are concerned about high levels of informality for two reasons. First, informality is
associated with lower tax collection, restricting the government’s ability to finance public services (Levy
2008). Second, the coexistence of formal and informal firms means that firms competing in the same
industry face different marginal production costs (e.g., labor costs and taxes), which leads to an inefficient
allocation of resources in the economy (Hsieh and Klenow 2009; Levy 2008). How can informal firms be
induced to formalize?
A firm’s decision to become formal depends on the costs and benefits of formality. There are two
prevailing views of informality, dubbed by Perry et al. (2007) as exclusion and exit. The exclusion view
focuses on the costs of registering. This view is most notably associated with the work of de Soto (1989),
who argued that burdensome entry regulations prevent small firms from becoming formal. These firms
suffer a loss in productivity as a result of remaining informal. The natural policy response is then to
remove the burdensome regulations. Spurred in part by the World Bank/IFC Doing Business project,
governments around the world have in recent years streamlined the process of becoming formal. Indeed,
since 2004, 75 percent of the countries included in the Doing Business survey have adopted at least one
reform making it easier to register a business (Doing Business 2010 Overview, p. 8), with many countries
establishing one-stop registration systems. Sri Lanka fares reasonably well by this measure, ranking 41st
out of 183 countries in the cost of opening a formal enterprise.1
But is streamlining the registration process sufficient to spur formality? The exit view focuses
more attention on the balance between the costs and benefits of formality. The decision to become formal
is comparable to any other investment decision taken by the firm. Each firm compares its perceived costs
of being formal—including both initial registration and ongoing costs (e.g., tax payments)—with its
perceived benefits of being formal (e.g., access to banks and courts). More able firm owners with larger
efficient scales rationally become formal as they grow large enough to benefit from the formal institutions
of civil society. Smaller, less productive, firms do not find formality desirable because they receive no
benefit from access these formal institutions (Maloney, 2004).
At a cross country level, countries with more burdensome entry regulations have larger informal
sectors (Djankov et al, 2002) and costly entry regulations are also associated with the creation of fewer
limited liability companies (Klapper et al, 2006).2 But the endogeneity of regulatory choices complicates
any claim of causation based on the cross country patterns. Endogeneity also complicates the
1 Other aspects of formality are found to be relatively more burdensome in Sri Lanka. The country ranks 96th in the
difficulty of formally employing workers, 148th in registering property and 166th in paying taxes. Sri Lanka ranked
97th in the overall cost of doing business in the 2010 Doing Business report (www.doingbusiness.org), very close to
the median. In our exercise, formalization is closest to starting a business, though our firms are all proprietorships
rather than limited liability companies. 2 There is also firm-level evidence for an impact of entry regulations. Bertrand and Kramarz (2002) find that entry
regulations are associated with significantly slower employment growth among French retail firms.

2
interpretation of data from changes in registration costs within countries: While many countries have
reduced the time and monetary costs of registration, none have done so in a randomized manner.
At the firm level, perhaps the most carefully studied reform is one adopted by Mexico beginning
in 2002, in which the time required to register at the municipal level was reduced from 30 to 2 days for
firms operating in specified sectors. The program was rolled out across cities, but in a non-random
fashion. Using different data sets, each with some advantages over the other, Bruhn (2010) and Kaplan,
Piedra, and Seira (2010) reach different conclusions about the effectiveness of the program. Kaplan et al,
who find relatively modest effects of the program, document the challenges with disentangling the factors
affecting the sequencing of the rollout from program effects. Fajnzylber et al. (2011) analyze a
simplification program in Brazil and find that the firms which open just after a reform are larger and more
likely to operate in a permanent location - a finding which they interpret as evidence of formalizing
improving firm performance, but which could also be the result of selection into firm entry.3 Finally,
using distance to the registration office as an instrument for registration costs, McKenzie and Sakho
(2010) find that some firms in Bolivia facing high costs of formalizing would gain on net from registering
for taxes, but that other firms would lose from doing so and so appear to be rationally informal.
Given the difficulty of implementing a randomized rollout of programs to reduce the costs of
registration, we focus instead on increasing the benefits of registration. Working with a sample of
informal firms with 1 to 14 paid employees in Sri Lanka, we conduct a field experiment which provides
randomly selected firms with information about registration, and various levels of monetary incentives for
completing the registration process. We divided a sample of informal firms into four treatment groups and
a control group. The first treatment group was given information about the costs and benefits of, and
procedures for, registering their firm with the District Secretariat. Additionally, they were reimbursed for
the (modest) direct cost of registration if they registered. The second, third, and fourth treatment groups
were provided the same information and also offered a payment of 10,000 Rs, 20,000 Rs and 40,000 Rs
(approximately US$88, $175 and $350 respectively) to register. The resulting data allow us to map out
the demand curve for formality, and examine the characteristics of owners associated with registering.
To briefly preview the results, we find no effect of providing information and reimbursing the
cost of registration. In contrast, 17-22 percent of eligible firms register when offered 10,000 or 20,000 Rs,
just under half a month’s and one month’s profits for the median firm respectively, and 48 percent register
when offered 40,000 Rs. Few of those who didn’t register when offered 40,000 Rs registered when given
additional time or when offered 80,000 Rs. The experiment sheds light not only on the demand for
informality, but also on the nature of barriers to formal registration. An important share of the firms not
registering after receiving the largest incentive report that issues related to land tenancy prevented them
from doing so. These firms operated with informal leases or agreement—ironically, often on government-
owned land—and hence were unable to provide authorities with the required proof of ownership of the
land on which the firm operated.
3 An ongoing study by Alcázar et al. (2010) in Lima, Peru carries out an experiment that also tries to formalize firms
through subsidizing the costs of registration, although they focus on municipal level registration. Whilst their study
has very high attrition levels (over half their sample attrits), the preliminary results we have seen suggest the results
of our study may generalize to other contexts. We discuss this study in more detail in Section 6.

3
Two follow-up surveys of these same firms were conducted at 15 months and 22 months after the
intervention, enabling us to examine whether and how the firms benefited from formalization. Firms
which formalized are found to have higher profits and sales, although this impact seems largely due to the
experiences of a few firms which grew a lot. Examining the channels through which formalization might
benefit firms, we find increased advertising and use of receipt books, but no increases in receipt of
government contracts, use of bank accounts or loans, or participation in government programs. Consistent
with the effect of formal land titling reported in Di Tella et al (2007), we also find impacts in terms of
attitudes: firms that formalize are more likely to trust local government and agree that paying taxes is a
civic duty, but also more likely to agree that small businesses are taxed too much.
The remainder of the paper is set out as follows. Section 2 describes the process of becoming
formal as a small firm in Sri Lanka, and gives evidence as to the extent of formality by firm size. Section
3 describes our intervention, Section 4 the results, and Section 5 the consequences of formalizing. Section
6 discusses the extent to which these results may generalize, and Section 7 concludes.
2. Becoming Formal in Sri Lanka
The process of becoming fully formal in Sri Lanka is similar to that in many other developing
countries, with multiple levels of registration. There are two levels of registration required of all firms,
regardless of size. First, firms are required to obtain a license at the municipal level. Depending on
whether the firm is located in a rural, urban, or semi-urban area, this implies registration with the
Pradeshiya Saba, Municipal Council or Urban Council (P.S. or UCMC). In some sectors, obtaining a
license requires a site visit from a revenue officer and/or a public health inspector, or approval by a police
officer and the municipal chairman. Firms must also pay an annual license fee which depends on the
sector, but typically ranges from 500 to 5000 Rs. These license fees are an important source of local
revenue. The main benefit is being able to operate without fear of being harassed by local officials, who
typically cover most visible enterprises since these license fees are an important local revenue source.
Second, all firms must also register at the district level with the District Secretariat (D.S.). 4 The
one-time registration with the D.S. establishes the business as an entity for tax purposes and provides the
business with a Business Registration Certificate (BRC). The BRC serves as legal proof of the
enterprise’s existence and is needed, for instance, for the firm to be able to sell to government institutions
and to larger firms which require formal transaction receipts. The BRC is also needed to open a bank
account in the name of the business, and to obtain a loan from most commercial banks. Registration at the
D.S. level involves payment of a modest fee, but does not by itself imply the firm is liable for taxes.
Taxes need to be paid only if annual net profits are in excess of Rs. 300,000, and theoretically, are
payable regardless of the registration status of the firm. In practice, registration makes the firm more
visible to tax authorities, and hence increases the expected tax payments for firms with incomes
exceeding this threshold.
4There are four administrative levels in Sri Lanka: Provinces (9), Districts (25), DS Divisions (324), and Grama
Nilidaris (GNs, 14,008). Political councils are elected at both the Provincial and local levels. The local councils are
called by different names depending on the area they cover, with Municipal Councils in the 18 largest urban areas,
Urban Councils in a further 42 urban/semi-urban areas, and Pradeshiya Sabhas in rural areas. Rural Sri Lanka is
divided into 270 Pradeshiya Sabhas. Registration of enterprises thus takes place both at the local and district level.

4
Larger firms are subject to two additional registrations. Firms with paid workers are required to
register these workers with the Ministry of Labour for the Government Social Security Schemes: the
Employee’s Provident Fund (EPF) and the Employee’s Trust Fund (ETF). EPF consists of a monthly
payment of 20 percent of the employee’s earnings (consisting of a 12% employer contribution and an 8%
employee contribution), and ETF a further 3% employer contribution. Formal employers with more than
14 workers also face high severance pay costs if they lay workers off. Finally, firms with revenues
exceeding Rs. 500,000 per quarter or Rs 1.8 million per year must also register for VAT. The VAT tax
rate is 20% of value-added for most goods, with producers of some goods paying a lower 10% rate and
others exempt entirely.
2.1 Formality Levels in Practice
Figure 1 summarizes the percentage of firms which reported being registered with each of the
four Government entities according to the number of paid employees in the firm. The data come from the
baseline of the Sri Lanka Longitudinal Survey of Enterprises (SLLSE), collected by the authors between
January and May 2008. The survey contains 2865 enterprises, and is representative of enterprises in the
31 largest cities and towns (outside the Northern province which was inaccessible due to civil conflict). A
door-to-door listing exercise of households was carried out, to ensure the survey was able to detect both
formal and informal firms. The vast majority of enterprises have zero paid workers, and we see that only
23 percent of these non-employers are registered at the local (P.S. / UCMC) level and only 20 percent are
registered at the district (D.S.) level. Less than 1 percent of the non-employers report being registered for
VAT. Registration at all four levels rises quickly with firm size, so that 75 percent of those with 5 paid
employees are registered with the P.S. or UCMC and 68 percent with the D.S. However, the percent
registered then appears to plateau, with approximately 70 to 80 percent registered with the D.S. for firms
with 6 to 20 employees. There are fewer firms in the SLLSE sample as the number of paid workers
grows, making the point estimates more variable at larger firm sizes. Registration of at least some of the
workers of the firm with EPF/ETF is less common in firms with fewer than 5 workers, but also increases
rapidly with firm size so that 87 percent firms with 10 employees have registered at least some of their
workers. VAT registration is the least common, but also grows with firm size, so that about half of firms
with 10 or more workers are registered for VAT.
Among those firms with 1 to 10 paid workers which were not registered with any of the four
Government entities, only 23 percent said they had ever considered registering their business, with the
majority of the remainder saying that they felt their businesses were too small to have to register. There is
often a presumption that the informal sector faces a high amount of de facto fees in terms of fines,
penalties and bribes which arise from operating without a license. However, this does not appear to be the
case in Sri Lanka: fewer than 0.5 percent of unregistered firms with 1 to 10 paid workers reported paying
a fine, penalty or bribe in the last year because of their unregistered status. Indeed, most informal firms
report having little interaction with officials at all: only 5 percent reported receiving a visit from a
Pradeshiya Saba official, 2 percent from a D.S. official, and 1 percent from a tax official in the past year.
2.2. Focusing on D.S. registration
Figure 1 shows that the registration at all levels increases markedly with the number of
employees. While most firms with 1 or 2 workers are entirely unregistered, a majority of firms with 10 or
more workers are registered with each of the relevant agencies. Our goal is to understand the demand for
5
formality among firms in this size range. We focus on one particular dimension of formalizing,
registering with the D.S. This D.S. registration most closely corresponds to much of the discussion of
formalization in the literature, because it establishes a legal and tax presence, and is the prerequisite for
undertaking business with the government and other firms which require registration, as well as for
applying for most bank loans.
3. The Experiment
3.1 Selection of the Sample
We chose to carry out our study in the two largest cities in Sri Lanka—Colombo and Kandy.
Since the goal of our intervention is to gauge the demand for formality among informal firms, we needed
to construct a sample of firms not registered with the D.S. at the time of the baseline survey. There was no
existing sample frame which could be used for this, so we carried out our own screening exercise.5 We
randomly selected 5 Division Secretariat (D.S.) areas in each city and then in December 2008 had
research assistants go door-to-door in these areas to screen firms, with the goal of surveying
approximately 50 unregistered firms in each of the 10 selected D.S.s. Firms were selected for the baseline
survey if they were not registered with the D.S., were not in seasonal agriculture or fisheries, had 1 to 14
paid employees, and had an owner aged 20 to 55 who worked at least 20 hours in the enterprise each
week. Few firms of this size are owned by women, and so we chose to restrict the sample to male owners
and to businesses jointly owned by a husband and wife. A sixth D.S. was added in Kandy due to
difficulty finding enough informal firms which satisfied these criteria – there are lots of informal firms
without paid workers, but fewer with paid workers.
An obvious concern in attempting to construct a sample of the unregistered is whether firms will
reveal that they are not registered (and hence that they are breaking the law). We used university students
to carry out the surveying, and they presented firm owners with a letter on University of Peradeniya
letterhead emphasizing that this was a research study. In an environment where informality is
commonplace among smaller firms we believe that most unregistered firms did tell the truth. Indeed, as
we will discuss in more detail, a non-trivial of firms which were ―quasi-registered‖ answered that they
were not registered, suggesting that there were not strong incentives for firms to pretend to be registered.
The resulting baseline sample consists of 520 firms, evenly split between Colombo and Kandy.
Although our screening criteria allowed firms to have up to 14 paid employees, there are more firms in
general with 1-5 employees than with 6-14, and a larger percentage of the smaller firms are informal. As a
result, 90 percent of the baseline sample has 5 or fewer paid employees, with a median of 3 paid
employees. Although all of the firms said they were not registered with the D.S., 68 percent reported
being registered with the municipal council or Pradeshiya Saba, so they are only partially informal.
However, only 5 percent have any of their workers registered with EPF/ETF. The firms cover a range of
industries, with 44 percent in services (e.g. motor vehicle repair, restaurants), 32 percent in manufacturing
(e.g. manufacturing fabricated metal products and glass products) and 23 percent in retail. Mean (median)
5 We decided against using the sample from our previous survey, the SLLSE, since logistically it was infeasible for
us to implement the experiment island-wide, and there were too few firms in the SLLSE that were in Kandy and
Colombo and which were not part of a separate experiment.

6
monthly profit for the firms in our sample was 33,886 Rs (25,000 Rs), approximately US$300 (220) at
market exchange rates, with a 10-90 percentile range of 9000-75000 Rs (US$79-658). The median firm
had been in business for 6 years, with 80 percent of the firms being more than three years old. Most of the
businesses were standalone enterprises, with only 8 percent located inside the home.
3.2. Why are these firms informal, and what do they see as the costs and benefits of formalizing?
Firm owners were asked open-ended questions about the possible costs and benefits of registering
with the D.S. The most common perceived cost or disadvantage was having to pay taxes and being more
likely to be visited by tax authorities, mentioned by 46 percent of the owners. The next most common
concern, mentioned by 37 percent of the owners, was that the process of registration was too burdensome
or too time consuming. A third common concern was that D.S. registration would requiring the firm to
pay EPF/ETF, or subject the firm to a greater risk of being visited by labor inspectors, which 24 percent
of owners mentioned.6 Only 13 percent believed the initial cost of registration was high.
With regard to the benefits of registration, more than half of the owners (58 percent) mentioned
being able to get a bank account in the business name or apply for a bank loan. The second most common
response to this question (23 percent of owners) was that there is no particular advantage of registering
with the D.S. Approximately 10 to 15 percent of firms mentioned a number of other advantages, such as
being able to operate on a larger and more visible scale, qualifying for participation in government
programs, being able to sell to the government and firms that require registration, and having less risk of
being fined. As with the nationwide sample, less than 1 percent reported actually having had to pay any
fines or bribes in the last year for operating informally, so the risk of being fined is already low.
These responses suggest that firms have at least somewhat accurate information about some of
the advantages and disadvantages of registering. They have much less knowledge of the specifics of how
to register. Only 17 percent knew the correct cost of registering at the D.S. The most common response
when asked how long it takes to register—given by 22 percent of the owners—was ―don’t know‖. The
next most common responses were 30 days, 60 days, and 90 days. Firms also lacked knowledge of their
income tax responsibilities. Firm owners were asked how much a business owner would have to pay as
income tax if their annual income was 100,000 Rs. Only 2 percent got the correct answer of zero, with 55
percent saying don’t know. The median answer amongst those professing to know was 2,000 Rs. When
asked the same question with respect to an annual income of 400,000 Rs, again 50 percent said they
didn’t know, and 88 percent of those answering with a number gave an answer higher than the true rate of
3,400 Rs, with the median answer 8000 Rs.
Finally, firm owners were asked in the baseline a hypothetical question of whether they would
register with the D.S. if someone would pay the fixed cost of registration. 61 percent of firm owners
answered yes to this question, suggesting some willingness to formalize if the costs were reduced.
6 We note that this perception is not accurate—the ETF/EPF registration is separate and there is no formal
communication between the two agencies.

7
3.3 The Intervention
The baseline survey and hypothetical questions suggest that the informal firms are not perfectly
informed about the process of registration or its costs and benefits, and that many express a willingness to
register if someone would pay the upfront costs. We therefore designed an intervention which provided
information about the costs, benefits, and process of registration, and which promised to reimburse firms
for the direct costs of registering. If the stylized de Soto/Doing Business view is true, and firms want to
formalize but for the costs, then we should expect to see a large response from this intervention. Likewise,
if firms really want to formalize but time-inconsistency means they have never gotten around to it, a
limited time offer to reimburse registration costs and a nudge from an outsider might be expected to spur
registration. In contrast, if firms have decided not to formalize because they don’t think the benefits
outweigh the costs, we would expect few firms to be at the margin where just the upfront registration cost
alone was enough to change this calculus. Such firms would need additional incentive to register, and so
we experiment by seeing how much we need to pay firms to get them to find it worthwhile to formalize.
We therefore designed the following four treatments:
Treatment 1: Information and Reimbursement. We designed an information brochure in consultation
with the Chamber of Commerce and local District Secretariat which clearly set out the advantages and
disadvantages of registering with the D.S. and explained the steps needed to register if a firm wished to.
This information brochure was given to firm owners, with trained research assistants available to answer
any questions the firm owner had about how to register. Firm owners were also told that we would
reimburse the registration fee of Rs. 1000 if they registered within one month and mailed us a copy of
their business registration certificate. This offer was presented in person and written on official university
letterhead to increase credibility.
The information brochure was entitled ―Could Business Registration Lead to the Success of Your
Enterprise‖, and covered what is meant by business registration, the reasons a business should be
registered and the potential benefits from registering, the reasons why some owners do not register, and
correction of some of the incorrect beliefs, and details of where to go to register, what the cost and time to
register is, and what documents are needed.
Treatments 2, 3 and 4: Information and Payments. The other three treatment groups also received the
information brochure, but instead of reimbursement were offered a larger monetary payment if they
registered within a one month timeframe. The amounts offered were 10,000, 20,000 and 40,000 Rs
respectively (approximately US$88, $175 and $350). This offer was delivered on a certificate which
specified the name of the person offered the treatment, and the date by which registration must be
submitted to us to qualify for payment. The certificate came with the signature of Dr. de Mel, and a
project seal to increase credibility. We conducted an open house in both Colombo and Kandy where firm
owners could come after receiving the offer to ask any questions. The open house also served to reassure
the owners that the offer of payment was credible. To receive their payment firm owners had to present
themselves at one of these locations with their new business registration certificate and their national
identity card. To guard against false registrations we also required that the nature and address of the
business on the BRC should be the same as on the baseline survey, or that if the registered address was
going to be different for a legitimate reason, the owner needed to inform us in advance and then they
would receive the payment only after we had verified the new address.
8
The payments offered are quite sizeable relative to the size of the firms and to the time required to
complete the registration process. As noted above, the median profit for the firms in our sample was
25,000 Rs, so treatments 2, 3 and 4 were approximately half a month’s, one month’s, and two months’
profits respectively. A firm earning 25,000 Rs per month faces no income tax, so the payments are also
very large relative to the direct cost of formalizing (the 1000 Rs fee) for these firms. The 90th percentile of
monthly profits in our data was 75,000 Rs, which would require an annual income tax of 33,000 Rs. So
our larger treatment exceeds the annual income tax cost of formalizing if they were to report their entire
income.7
One immediate question is then whether firms could easily register to take the payment offered,
and then de-register the business to continue operating informally. If this were the case, our experiment
would be less informative about the incentives needed to get firms to formalize. However, in practice this
does not appear easy to do. Canceling of business registration can occur if the enterprise ceases to
operate. The enterprise needs to notify the D.S. office within 3 months of closing the business, and
provide certification from the local G.N. official to verify that the business is closed. Therefore for a firm
to accept our payment and then revert back to unregistered status, they would have to actually close their
business and have this verified, before re-opening it again.
Our sample size of 520 was randomly assigned by computer into these four treatment groups and
a control group as follows. Firms were first stratified by province (Colombo or Kandy), Industry (retail,
manufacturing, or services), whether or not they had more than 2 paid employees, and whether or not in
the baseline survey they had said they would register if someone were to pay the costs, and had also said
they perceived some benefit to registration. Then within each of these 24 strata we sorted firms according
to their sales rank, and formed matched quintuplets. Where the number of firms in a strata was not
perfectly divisible by 5, the additional firms were randomly assigned within strata to one of the five
treatment groups with equal probability. This method of randomization was chosen on the basis of the
recommendations of Bruhn and McKenzie (2009) with the aim of increasing baseline balance and power,
given that we only have 102-105 firms in each treatment group. The variables chosen for stratification
were chosen on the basis that local regulations make the process of registration slightly different in
Colombo and Kandy, while the incentives to register were a priori believed to possibly differ by industry,
firm size, and self-professed desire to register.
The initial offers were given to treatment groups 1 and 2 in late February/early March 2009.
Firms in these two treatment groups were then given to the end of March/start of April to provide their
business registration certificates and receive payment. Given budget constraints and the desire to map out
as much of the demand curve for formality as possible, we waited to decide on the amount to offer
treatment groups 3 and 4 until observing the take-up rates of these first groups. Treatment groups 3 and 4
were then given their offers in late April, with a deadline of late May to show their paperwork. However,
on May 18 the Sri Lankan Government declared victory in the 25-year civil conflict, leading to a national
holiday and making it difficult for paperwork to get processed towards the end of May. We therefore
7 de Mel, McKenzie and Woodruff (2009) estimate that micro enterprise owners underestimate reported profits by as
much as 30 percent. If firms in our sample are under-reporting profits by a similar amount, then the median firm
would be liable for annual taxes of 3000 Rs, implying that our smallest payment would compensate for three years
of tax payments. If firms under report profits in the survey, they might also do so in tax reports.

9
decided to give all four treatment groups an extra month to carry out their registration if they desired, with
a new deadline of the end of July 2009. Any firms which had completed their registration between the
previous deadline and the new deadline would also be eligible to receive the payment.
3.4 Quasi-registration and actually receiving the treatment offer
Owners of the firms assigned to treatment were asked to confirm their registration status on a
follow-up visit in which we made the offer corresponding to their treatment group. We were surprised to
learn that a non-trivial number of the firms were already registered with the D.S. Recall that all of the
firms stated they were not registered with the D.S. in the baseline survey. A handful of these firms had
registered in the 3 to 4 months since the baseline survey (this was confirmed by examined the BRC,
which shows the date of registration), but the majority of those registered had either misunderstood the
question in the baseline survey or were what we term ―quasi-registered‖. The latter refers to a number of
cases where the business had been registered in some form, but the registration did not match the current
circumstances of the business. For example, in some cases the business had been registered by another
family member, who was no longer running it. In other cases the registration had been for another
location. The firm thus had a BRC, but it didn’t match the firm in all details. This BRC could still
presumably be used to access government contracts or in dealing with a bank. We therefore chose not to
offer the treatment to firms in this category. We subsequently also re-visited the control group firms to
determine which of them also fell into this quasi-registered status.
In total, 152 out of the 415 firms which were assigned to one of the four treatment groups did not
receive the registration offer. The majority of time (106 cases) this was because the firm was already-
registered or quasi-registered at the time of the baseline survey, as just described. In 14 cases, the business
had closed since the baseline survey, in 18 cases, the owner could not be found in the follow-up, and in 14
cases the business had registered on its own between the baseline survey and the intervention. Five of the
owners rejected the offer outright; we count these cases as having received the offer. Follow-up visits
with the control group revealed 30 firms which were already registered, and a further 12 had closed or
moved or couldn’t be located.
Table 1 reports summary statistics for the full sample according to assignment to treatment, and
also for the subsample which actually received the treatment offer (or were eligible to do so after
rechecking in the control group). The randomization succeeded in achieving balance for both the
variables explicitly stratified or matched on, and for other key variables. With the possible exception of
treatment group 1 (the information and reimbursement only group), there is also balance in the share of
the group already registered or quasi-registered. As a result, we can not reject balance for any of the
variables in subsample for which the offers were actually made.
4. Results
4.1 Which Treatments Increased Formalization?
We estimate both the intention-to-treat effect (effect of being randomized into one of the 4
different treatment groups), and treatment effect on the treated (effect of being randomized into one of the
4 different treatment groups and actually being offered the treatment). The intention-to-treat effect is
obtained by means of the following regression:

10
Registered During Intervention Windowi = α+β’TREATMENTi + γ’STRATAi + εi (1)
Where TREATMENTi is a vector of dummies for each of the four treatment groups, and STRATAi is a
vector consisting of dummies for each of the strata used in the randomization. To estimate the treatment
effect on the treated we replace TREATMENT with dummies for actually being offered the treatments,
and then instrument these with assignment to treatment.
Table 2 shows the results. Only 1 of the 104 firms in the information and reimbursement group
registered during our intervention window, compared to 16 in the 10,000 Rs treatment group, 13 in the
20,000 Rs treatment group, and 30 in the 40,000 Rs treatment group. The large majority of firms
registered during the initial month period given to them – only 8 registered when given the extra time and
the new end of July deadline. During the intervention time window, 2 firms in the control group
registered. Columns 1 and 2 show the treatment effects as proportions of those in each treatment group,
while the TOT effects in Columns 3 and 4 are effectively these numbers as a proportion of those who
were actually offered the treatment. Thus when only information and reimbursement of costs is offered,
there is no significant effect, with fewer firms registering than the control group. The 10,000 Rs and
20,000 Rs offers have similar effects (we can’t reject equality), with 17 to 22 percent of firms registering
when actually offered this amount, while the 40,000 Rs effect leads to 48 percent of those offered taking
up the treatment. The effect of the 40,000 Rs treatment is different from either the 10,000 or 20,000 Rs
treatment at all standard significance levels. Controlling for the strata dummies increases slightly the
precision of the estimates and the share of variation in registration explained by the regression, but does
not change the magnitude of the coefficients – as one would expect given baseline balance.
4.2 What was the registration process like for these firms?
The firms which registered as a result of our intervention were given a brief survey at the time of
payment of their treatment amount in order to collect some details of their experience registering. Table 3
summarizes some of the key details of the registration process. The first point to note is that there was a
big difference in practice between the process of registration in Colombo, and that in Kandy. In Colombo
four of the five D.S.s had been centralized to the Provincial Council level and the process of registration
was very efficient. Firm owners in Colombo were generally not asked to provide any documents at the
time of registration other than their national identity card. They were also able to pay 1000 Rs instead of
the usual 500 Rs registration fee and get their business registration certificate in one day. Many firms
chose to do this. We see in Colombo 85 percent of firms registering classified the process as very easy,
with the registration process typically involving a total of 2 days and 2 visits to the D.S.
In contrast, the procedure for registering was more burdensome in Kandy, where the D.S. office
generally required the firm owner to provide three documents in addition to their national identity card: a
Grama Sevaka certificate from their local G.N. (the smallest local administrative area) testifying that the
business existed; proof of being licensed at the Pradeshiya Saba or Municipal council level; and, if their
business was operated on a property they did not own, a letter from the property owner indicating no
objection to business registration. These other documents typically required 3 to 4 days to obtain and
involved fees of 385 to 1300 Rs for the Pradeshiya Saba or Municipal council license, and in some cases,
500-1000 Rs for the letter from the property owner. The D.S. itself then took longer to process the
registration. There was an average of 8 days between the time all of the necessary documents were
submitted and BRC was issued. We asked firm owners to tell us when they had submitted the paperwork

11
to the D.S., so our payments to them were not denied if delays occurred at the D.S. Thus even in Kandy it
was easily feasible to register within the time window given to firms. Nevertheless, 26 percent of firms
who registered in Kandy described the process as not that easy, or as very difficult.
4.3 Which owners formalized?
We modify the framework introduced in McKenzie and Sakho (2010) to model the choice of a
firm owner deciding whether or not to formalize his firm. A firm owner will formalize if the expected
discounted value of the net benefits from doing so exceeds the upfront costs. That is, if
tEU F,t I ,t t1
T
CMoney CTime CInformation liquidity (2)
where πF,t denotes the firm’s profits if it is formally registered at time t, and πI,t denotes the firm’s profits
if it is not formally registered at time t. CMoney, CTime, and CInformation denote the monetary, time, and
information costs from registering. The shadow value of capital for liquidity-constrained firms is given
by λliquidity.8
This framework can be used to capture several competing, although not necessarily mutually
exclusive, reasons as to why firms are informal.
1. The Exclusion/De Soto/Doing Business Hypothesis: the viewpoint underlying the De Soto and
Doing Business view of informality is that the left-hand side of equation (2) is (strongly) positive,
and it is only the presence of the monetary, time, and information costs of registering which
prevent firms from becoming formal. Under this viewpoint we should see that simply reducing
the monetary cost of registering to zero and lowering the information and time costs through
facilitating the process of registration should lead many firms to register. We should see more
registration in locations where the process is easiest to undertake. Under this viewpoint we should
also see the less-informed firms being the ones most likely to formalize under the intervention,
since the information reduction should be greatest for them.
2. The Exit Hypothesis: an alternative viewpoint is that firms rationally chose not to become formal
because they don’t see the benefits from registering. The left-hand side of equation (2) might be
negative—that is, (after tax) profits may fall with registration, or πF,t – πI,t may be negative. Under
this viewpoint we should expect to see firms register only if the benefits of formality are
increased, which in the present context corresponds to the firm receiving a payment for
registering. We should also observe less formalization among firms expecting to face greater
costs from formalizing in future periods. One measure of this is profits - firms whose profits
exceed 300,000 Rs will be liable for income tax. A second measure is based on expected
employment growth. Firms which expect to employ 15 or more workers in the future may be
especially nervous about becoming formal because of the high severance pay regulations which
8 For simplicity of exposition we assume here that the value of being formal at time t does not depend on formality
status in previous periods. If it does, the problem can be written as a dynamic optimization problem with a value
function, and the same intuition as exposited here will apply.

12
kick in at 15 workers. 45 percent of firms have profits exceeding the threshold to pay income tax,
and 28 percent expect to grow to 15 or more workers within 5 years.
3. The Behavioral Hypothesis: Equation (2) allows for the possibility of (quasi-) hyperbolic
preferences (if β<1), whereby the firm owner is present-biased. Under this view, firm owners may
see future benefits from formalizing, but have time-inconsistent preferences and so while they
would like to be formal in the future, never wish to pay the upfront costs today. Under this view
we should see a large effect of reducing the current costs to as close to zero as possible, with
firms which are hyperbolic discounters being the ones who register. We measure hyperbolic
discounting by asking firms hypothetical questions about how much they would be prepared to
take today compared to in one month, and how much in 5 months compared to 10,000 Rs at 6
months, with firms who have a higher discount rate between today and 1 month, compared to
between 5 and 6 months deemed hyperbolic. 20 percent of firms in our sample are classified this
way.
4. The Risk Hypothesis: A fourth reason firms might be informal is that they view formalizing as a
risky investment, with uncertain payoffs. For example, they may think there is a chance that they
will be able to expand and get more customers and greater access to credit as a result of
formalizing, but also a chance that they will not and simply end up with higher costs as a result of
taxes. Firm owners who are less risk averse should then be the ones most likely to register when
the costs of registering are reduced. We measure risk preferences on an 11 point scale taken from
the German Socioeconomic Survey, where firm owners are asked ―are you generally a person
who is fully prepared to take risks, or do you try and avoid taking risks?‖, where higher values
indicate greater willingness to take risk.
5. The Credit Constraints Hypothesis: A fifth reason firms might be informal in this framework
arises from the λliquidity term. They may view the discounted benefits as exceeding the costs of
registering, but find the initial upfront costs too high given their current lack of access to capital.
We have found very high returns to capital to smaller firms in Sri Lanka (de Mel et al, 2008), but
it is not clear if these high returns apply to larger firms such as those in this sample. Under this
hypothesis we should find high take-up when we just reduce the costs of registering, and higher
take-up for poorer firm owners. Under the assumption that business assets are correlated with
personal wealth, we proxy owner wealth with log business assets.9
6. Other Legal Barriers: A final reason that firms may be informal is that other legal barriers
prevent them registering with the D.S. Some firms told us they operate on land which they do not
have legal title to operate on, such as temple or government land. In such cases the business
would have to move to another location, so the monetary costs of formalizing, CMoney, greatly
exceed the business registration fee. We proxy for this by a dummy variable for whether the firm
operates on a public space, which 14 percent of firms do.
9 The low direct cost of registration makes liquidity constraints an unlikely candidate for failure to register.
However, since a large percentage of owners either overestimate the cost of registration or are unaware of the cost,
the perception of higher costs might lead to a perceived liquidity constraint. Thus, the information intervention
might also operate through a relaxation of this perceived liquidity constraint.

13
We test these hypotheses by means of a probit of the likelihood of registering. We restrict the sample
here to firms in treatment groups 2, 3 and 4 who received the monetary offers, since almost all the
registration occurs for this group of firms. Table 4 presents the results. We begin with a base specification
which includes dummies for the 20,000 and 40,000 treatment offer levels, and controls for the different
variables which we stratified or matched on. We see firms were significantly more likely to register in
Colombo than in Kandy, which is consistent with the evidence above showing that the process was easier
in Colombo. Nevertheless, only one firm registered under the information / direct cost reimbursement
treatment (and that firm was located in Kandy), so an easy registration process is apparently not sufficient
to get informal firms to register. There was no difference in registration by industry, by baseline monthly
sales, or by whether the firm employed more than 2 paid workers in the baseline. Moreover, firms which
said in the baseline survey that they would register if someone paid the costs of doing so and that they
saw a benefit to registering are no more likely to have registered.
Column 2 of Table 4 then tests whether the less knowledgeable and less informed owners are more
likely to register. The fact that the treatment involving only information and direct cost reimbursement did
not lead to registrations casts doubt on the De Soto/Doing Business view that information and upfront
costs are the main barriers to formalization. Indeed we see that there is no significant effect of education,
with a very small point estimate, while the point estimates for both digitspan recall and for whether the
owner knew the cost of registering suggest that, if anything, it is more able, more knowledgeable owners
who registered when given the monetary treatments.
Column 3 then tests the exit view. The fact that the likelihood of registration is increasing with the
amount paid as a monetary incentive is consistent with firms needing some payment to make up for the
potential added costs of formalization. We see a strong negative and significant effect of expecting to
grow to 15 or more workers, where the costs of being formal are large due to labor regulations (although
registration is separate for workers), and a large, but not significant, negative effect of having profits
exceed the threshold for taxation. This is then consistent with firms who have the most to lose from
formalizing in terms of additional costs being the ones who rationally decide not to formalize, even when
offered monetary incentives.
Column 4 shows a negative, and insignificant, effect of being a hyperbolic discounter on the
likelihood of registering. This is evidence against the view that those who are informal are those who are
at the margin of registering but for their discount rates. If this were the case, we should expect those with
time-inconsistent preferences to be the ones who register now the rewards of formalizing are bought
forward in time and the upfront costs reduced. The point estimate in Column 5 does offer suggestive
support for the view that registration involves risks and that risk preferences in part determine the net
benefit of becoming formal. Those individuals who say they are risk-seeking are more likely to formalize,
but not significantly so. Column 6 shows that it is firms with more business assets which are more likely
to formalize when offered a payment. This is contrary to the view that it is liquidity constraints which
have prevented poor individuals from formalizing now to get benefits later, and more in line with the
view that it is bigger firms who might be closer to the threshold where the benefits from formalizing start
to appear.
In column 7 we see that firms operating on public premises are 27 percentage points less likely to
register when offered a monetary incentive. We interpret this as evidence that there may be other legal

14
barriers to formalizing, which we investigate further below. We also include an indicator for whether a
firm has a clear and visible business sign, which is one indicator that they are not otherwise flouting the
law. The owner of a highly visible enterprise may also feel that he will have to register at some point
anyway, since he is at more risk of being discovered by officials. We see a positive and insignificant
effect of this variable, which becomes significant in column 8 once we control for other variables.
Controlling for all factors in column 8 does not change the signs of each of the key variables, but does
change some of the significance levels. We find that it is less-educated owners, who don’t operate on
public premises, and who have a clear and visible business sign that register, especially when offered
more money. Overall we view the results as suggesting that most of those becoming formal are informed
owners who are rationally weighing up the costs and benefits of formalizing, while some legal barriers
concerning operating on public property stop some other firms from formalizing.
4.4 What prevents firms from registering?
In August 2009, we followed up with all of the 29 firms in the 40,000 Rs treatment group who
were offered the payment but chose not to register, to ask them why they had not done so. The firms can
be divided into three groups. The largest number, 14, said they had started the process of registering, only
to learn that, because they did not own the land they operated on, they would need to obtain the land
owner’s permission to register. In many of these cases, the land was owned by the government or a
temple, and owners told us that registration was impossible. There were also cases of those leasing or rent
land not being able to obtain permission from the land owner to register the business. In the case of those
operating on government land, some owners told us that permission could only be obtained by making
extra legal payments. With this group we therefore made no further offers, concluding that land issues
was the reason for lack of registering.
Six of the firms told us they were willing to register at 40,000 Rs, but had either needed more
time or had not understood the offer (for example, one of these owners told us he thought we would give
him a loan of 40,000 Rs upon registration, rather than making a payment). We therefore gave them one
more final month for the offer at 40,000, during which only one business registered. The final group of
nine firms had not completed the registration process because they felt the benefits did not outweigh the
costs even with the 40,000 Rs payment. We told these firms that we had some money left over from the
project, and would increase the offer for a final offer of 80,000 Rs. Only two of the nine firms registered
when given this higher offer. It therefore seems that these remaining informal firms are resolutely
informal, with extra time or extra money not getting many more to register.
5. What are the consequences of formalizing?
In August 2010 we carried out a follow-up survey of the firms, corresponding to a period of between
12 and 18 months after firms were induced to register. The follow-up was able to re-interview 465 of the
original 520 firms (89%), with the most common reasons for attrition being not being able to find the
owner (20 out of the 55 cases), the owner being abroad (9 out of 55 cases), and firm owners refusing to be
re-interviewed (9 out of 55 cases). We cannot reject the null hypothesis that attrition is unrelated to
treatment status at conventional significance levels (p=0.17). A second follow-up survey was conducted
in March 2011, at period of 2 years after the start of the intervention, and included 445 firms, with
attrition again unrelated to treatment status (p=0.35).
15
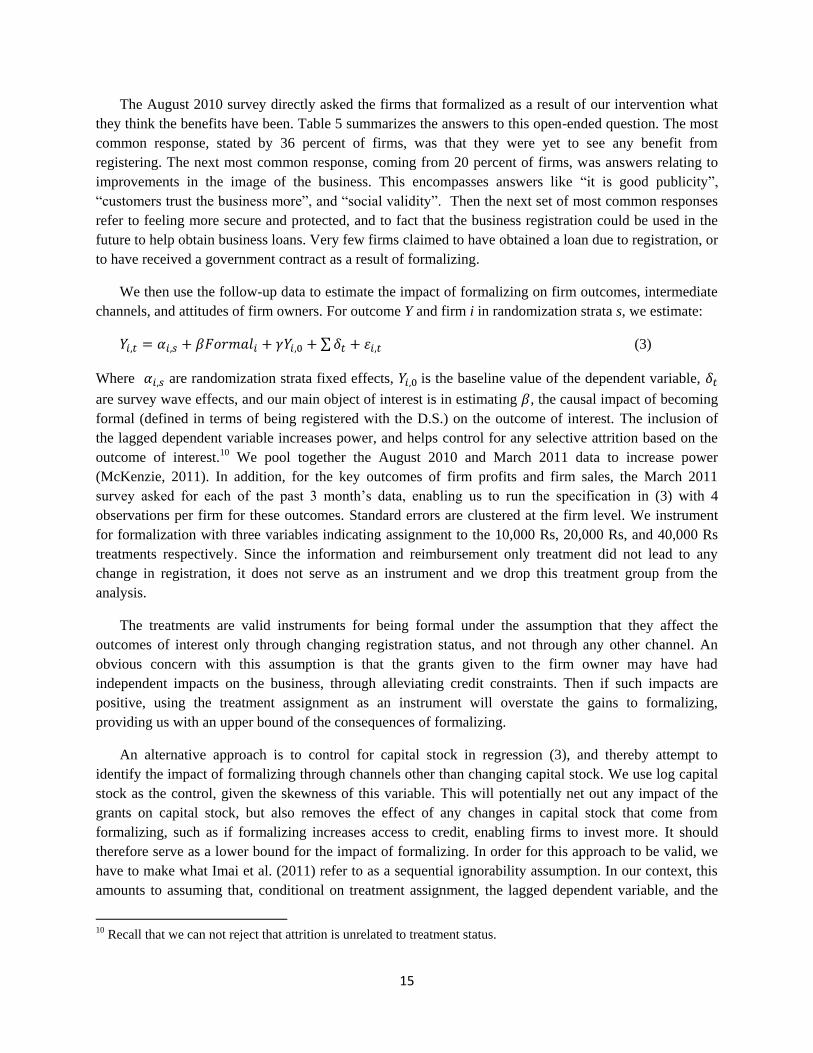
The August 2010 survey directly asked the firms that formalized as a result of our intervention what
they think the benefits have been. Table 5 summarizes the answers to this open-ended question. The most
common response, stated by 36 percent of firms, was that they were yet to see any benefit from
registering. The next most common response, coming from 20 percent of firms, was answers relating to
improvements in the image of the business. This encompasses answers like ―it is good publicity‖,
―customers trust the business more‖, and ―social validity‖. Then the next set of most common responses
refer to feeling more secure and protected, and to fact that the business registration could be used in the
future to help obtain business loans. Very few firms claimed to have obtained a loan due to registration, or
to have received a government contract as a result of formalizing.
We then use the follow-up data to estimate the impact of formalizing on firm outcomes, intermediate
channels, and attitudes of firm owners. For outcome Y and firm i in randomization strata s, we estimate:
(3)
Where are randomization strata fixed effects, is the baseline value of the dependent variable,
are survey wave effects, and our main object of interest is in estimating , the causal impact of becoming
formal (defined in terms of being registered with the D.S.) on the outcome of interest. The inclusion of
the lagged dependent variable increases power, and helps control for any selective attrition based on the
outcome of interest.10 We pool together the August 2010 and March 2011 data to increase power
(McKenzie, 2011). In addition, for the key outcomes of firm profits and firm sales, the March 2011
survey asked for each of the past 3 month’s data, enabling us to run the specification in (3) with 4
observations per firm for these outcomes. Standard errors are clustered at the firm level. We instrument
for formalization with three variables indicating assignment to the 10,000 Rs, 20,000 Rs, and 40,000 Rs
treatments respectively. Since the information and reimbursement only treatment did not lead to any
change in registration, it does not serve as an instrument and we drop this treatment group from the
analysis.
The treatments are valid instruments for being formal under the assumption that they affect the
outcomes of interest only through changing registration status, and not through any other channel. An
obvious concern with this assumption is that the grants given to the firm owner may have had
independent impacts on the business, through alleviating credit constraints. Then if such impacts are
positive, using the treatment assignment as an instrument will overstate the gains to formalizing,
providing us with an upper bound of the consequences of formalizing.
An alternative approach is to control for capital stock in regression (3), and thereby attempt to
identify the impact of formalizing through channels other than changing capital stock. We use log capital
stock as the control, given the skewness of this variable. This will potentially net out any impact of the
grants on capital stock, but also removes the effect of any changes in capital stock that come from
formalizing, such as if formalizing increases access to credit, enabling firms to invest more. It should
therefore serve as a lower bound for the impact of formalizing. In order for this approach to be valid, we
have to make what Imai et al. (2011) refer to as a sequential ignorability assumption. In our context, this
amounts to assuming that, conditional on treatment assignment, the lagged dependent variable, and the
10 Recall that we can not reject that attrition is unrelated to treatment status.
16
strata randomization controls, capital stock is independent of the outcome of interest. Given the rich set of
controls used here, this may be reasonable.
5.1. Impact on Major firm outcomes
Table 6a presents the results of estimating equation (3) for the key outcomes of firm profits, sales,
employment, and capital stock. Consider first the impact on firm profits. Column 1 shows an upper bound
estimate of 17,915 Rs increase in monthly profits from formalizing, which is large relative to the mean
profits in the control group of 32,567 Rs and significant at the 10 percent level. The lower bound estimate
obtained when we control for capital stock is not much smaller (17,179), but not quite significant at
standard levels (p=0.116). These point estimates are sizeable relative to both the upfront costs of
registering (1000 Rs), and the annual income taxes for a typical firm of this level (3000 Rs). They are also
sizable relative to the incentives provided to register. Columns 2 and 3 show the results of truncating
profits at the 99th and 95th percentiles respectively. The latter halves the point estimate of the impact on
profits. In contrast, eliminating the few observations in which profits were zero raises the point estimate
(column 4), and as a result, log profits which eliminate these zeros, are highly significant (column 5).
Columns 6-8 show large positive coefficients for sales, which are not statistically significant in levels, and
only marginally significant in logs. The remaining columns show positive, but insignificant, impacts on
employment and capital stock.
5.2 Impact on Mediating Channels
We next ask whether the firms who formalized in response to the incentives we provided change their
behavior in ways that advocates of formalization claim they might. For example, do they gain access to
formal credit, participate in government programs for small enterprises, bid on government contracts, or
increase their visibility? A failure to identify the channels through which formality changes the firms
might raise questions about whether the weakly significant changes in profitability we find are an illusion.
Table 6b presents the impact of formalizing on channels through which formalization might be
expected to influence firm outcomes. The assumption that the grants are not independently affecting these
channels is more plausible here than for profits or capital stock, and consistent with this, we find that the
upper and lower bounds are quite close to one another. We therefore just present the upper bound
estimates, which do not control for capital stock.
The results show that formalizing results in firms being more likely to use receipt books, and being
more likely to advertise. This is consistent with the increase in sales suggested in Table 6a, and with the
non-experimental evidence in McKenzie and Sakho (2010) who suggest one of the main effects of
formalizing in Bolivia is to expand sales through increasing the use of receipts. In contrast, the results
show little evidence that formalizing impacts firms through many of the other channels through which
formalization is often hypothesized to benefit firms. We find no significant effect on relationships with
the financial sector—applying for business or personal loans or having a business bank account, or on
relationships with the government—having an electricity connection in the business name, applying for a
government contract, making sales to the government, or participating in any government SME program.
Moreover, the point estimate on most of these variables is close to zero. The point estimates suggest
businesses are not any more likely to pay taxes, this and the point estimate is actually negative on the

17
amount of taxes paid. We do not find any evidence that businesses are changing location after
formalizing.
5.3 Impacts without channels?
Table 6a suggests that formalization increased the average profit level of firms, but Table 6b finds
evidence for only a couple of the channels through which firms may have changed behavior. This should
raise some additional concern about the robustness of the first set of results. In this regard, we note first
that the two sets of results differ in an important way. While a few firms with much larger profits might
drive the average profit level higher, the channels explored in Table 6b mostly come from 0/1 responses.
Hence, a few firms are unlikely to drive average outcomes in the same way they might by dramatically
increasing profits or sales. The average impacts of zero for all treated firms may mask some heterogeneity
in benefits.
To address the question of whether the increases in profits represent genuine changes or whether they
represent measurement error and/or idiosyncratic shocks for a few firms, in June 2011 we conducted
open-ended discussions with a set of firms experiencing large increases in profits after registering. We
wanted to see whether they had taken specific actions following registration and whether they appeared to
benefit from doing so. Although small in number, these more detailed case studies provide support for the
idea that a few firms had benefited substantially from formalizing. For example, two of the firms were in
the vehicle repair business—one automobiles and one autorickshaws. Both said that an important
consequence of registration was the ability to become parts distributors for an auto parts manufacturer.
Previously, they had purchased parts from another dealer, i.e., at higher than the wholesale price. Both
had also undertaken expansions of the physical facilities, with one adding an auto lift and a customer
waiting room, while increasing employment from 2 to 8 workers. A saw mill which registered said the
key was to be able to put the forest service stamp on the receipts which he issued. The stamp allows
customers to transport the wood across municipal boundaries without obtaining further permissions. His
estimate was that he had previously lost 25 percent of sales to other mills which could provide this stamp.
Finally, a grocery store and tea (snack) shop had used the license to obtain a loan to purchase a delivery
truck. The truck was used in the business, but also leased out. (The profits from leasing are considered a
separate business, and not included in the profits reported to us.) On his own, he had gone to the health
department to request a health inspection for his tea shop. He was intent on improving his score so that he
would obtain a health sticker he could display, and so that he could open a bakery and wholesale bread. In
all four cases, there were clear changes in the business operation, and in the attitude and vision of the
owners. Of course, any one of these may have registered on his own, without our incentive. But the
outcomes we measure account for this by comparing the treated firms with controls who did not receive
any incentive to register.
5.4 Impacts on attitudes
The tea shop owner who contacted the health department about an inspection raises the question of
whether formalization may have changed attitudes about the government and market regulations more
generally. Di Tella et al. (2007) study formalization in a different domain – formalization of property
rights among land squatters – and find very large effects of obtaining formal property title on beliefs that
favor the workings of the market. Motivated partly by this, we examine the impact of formalizing on the
attitudes that firm owners have towards government, the courts and police, and taxation.

18
Table 6c shows the results. We find very strong positive effects of formalizing on trust in the
provincial government and trust in the municipal government, the two levels of government that business
owners interact with during the registration process. The p-value on trust in the provincial government is
0.007, so remains significant even after controlling for multiple hypothesis testing over the 9 outcomes in
the table. In contrast, we find no significant impact on trust in the national government, trust in the courts,
or trust in the police, and that formalizing does not make firms any more likely to be confident in the
police and courts to resolve business disputes.
One interpretation of this increase in trust is that those firms that formalized had to deal with the D.S.
and municipal governments in the registration process, and may have been surprised to find the process
less burdensome and less subject to bribes than they had imagined. That is, the process of formalizing
might be the lever for attitude change, by demonstrating that these levels of government can be trusted.
An alternative potential explanation is that the change in attitudes is a consequence of being formalized, if
firm owners no longer worry about the provincial and municipal governments shutting them down for
lack of compliance, thereby causing them to trust these levels of government more.
We also see formalizing leads to changes in attitudes towards taxes. Firms that formalize are much
more likely to agree that part of being a good citizen means paying taxes. However, they are no more
likely to think the government spends its revenue on items important to them, and also significantly more
likely to agree that the government charges businesses too much in taxes. Recall that actual taxes are quite
low for most businesses in this sample, so this perception contrasts with the reality facing most firms.
6. Discussion and External Validity
Our baseline sample was a random sample of informal firms in the two largest cities in Sri Lanka. As
with all microeconomic studies, there is a question of external validity. We present two pieces of evidence
here to suggest that our results from Sri Lanka are likely to be informative of constraints to formalizing
firms in other countries.
First, we note that the pattern of informality with regard to firm size, and what firms say are the
potential advantages and disadvantages of formalizing are similar to those we see in other countries for
which data exists. Figure 2 compares municipal government and tax authority registration rates by firm
size in Sri Lanka, Bangladesh and Mexico. In all three countries, the data are representative of firms in
the largest urban areas.11 Sri Lanka has tax registration rates which lie between those in Mexico and
Bangladesh. The figure shows that in these other countries, registration also typically occurs over the size
range considered in our study – not with the smallest microenterprises. The Bangladesh survey asked firm
owners what they saw as the main advantages firms of formalizing are. Owners give responses which are
similar to those in the Sri Lanka survey: links to bank financing, better reputation for the business, a
lower chance of being fined, and the ability to operate visibly at a large scale without fear of being
caught. Smaller and more informal firms in Bangladesh are more likely to say they see no potential
11 The Sri Lankan data come from the Sri Lankan Longitudinal Survey of Entrepreneurs, which draws a random
sample of 2255 firms from household listings in 31 cities outside the northern province. In Mexico, the data are from
the 2002 version of the National Microenterprise survey, conducted in urban areas with a sample drawn from a
household-based nationally representative labor survey. The Bangladesh survey data come from a census of 55,817
firms in randomly selected sampling areas from 19 districts conducted by the World Bank in 2009-2010.

19
benefits and all firms saying the main disadvantages were paying taxes and having to deal with the cost
and process of registering (McKenzie, 2010). These same channels also appear in discussions of the costs
and benefits of formalizing in different Latin American countries (Perry et al, 2007; World Bank, 2009).
As a result, it seems reasonable to believe that our results are informative outside Sri Lanka about the
number of firms at the margin who will be induced to formalize by relatively small changes in the costs
and benefits, and also about the characteristics of those firms. Our results suggest that taking the costs of
registering from the levels in Sri Lanka to zero induces few firms to formalize, but increasing the cost-
benefit calculation further (in our case by paying firms) draws more firms to formalize. This is consistent
with recent cross-country panel data, in which Klapper and Love (2010) find that changes in business
environment reforms which involve less than a 40 percent reduction in costs are not associated with
changes in firm entry – only larger reforms are.12
7. Conclusions
Prior to the intervention, owners of unregistered firms were either ignorant of, or vastly overestimated
the costs of registration. We might therefore have expected that simply informing firms about the costs of
registration would be sufficient to induce registration. But we find that information and reimbursement
for the modest direct costs do not result in any increase in registration. Instead, registration is spurred only
when the information is combined with incentive payments.
The incentive required to induce registration is modest compared to reported profits levels of the
sample enterprises. A payment of two month’s profit is sufficient to induce half of the firms to register.
Among those not registering after receiving an offer of this magnitude, more than half took some steps
toward registering. They stopped only when learning that issues of land ownership would prevent them
from registering without paying significant fees to landlords, temples, or the government. Thus, the net
costs of formality appear to be modest for almost all of the informal firms represented by our sample in
the absence of land issues. However, the net benefit also appears modest for most firms. While we do find
an increase in profits and sales after formalization, this mean treatment effect seems to be driven by a
successful upper tail. Firms that formalize do more advertising and are more likely to use receipt books,
but don’t appear to get the more touted benefits of formalizing such as increased access to credit,
obtaining government contracts, or participating in government programs. Most firms seem therefore to
be rationally refraining from formalizing unless paid to do so, while a few seem to be suboptimally
informal.
12 Our results are also consistent with evidence from an ongoing experiment in Lima, Peru which randomly
encouraged firms to obtain a municipal license (Jaramillo, 2009; Alcázar et al, 2010). About one-quarter of firms
offered information and reimbursement of direct costs obtained the municipal license. One-third of those who didn’t
register reported problems with other regulations such as zoning, consistent with our finding that land issues prevent
many firms from registering. A follow-up survey 18 months after baseline failed to find any significant impact of
registration obtaining the municipal license on firm size, access to credit, or profitability, but their power to detect an
effect is low. Moreover, since banks and the government typically require a tax license rather than municipal license
as proof of formality in many countries, there may be less ex ante reason to expect a positive impact on firms of
municipal registration.

20
This finding is important for two reasons. First, while governments clearly should not mimic our
experiment with a policy of direct payments, the results do suggest that modest increases in the perceived
benefits of being formal could be expected to dramatically increase rates of formalization among firms
currently operating informally. Second, while there may indeed be substantial variance in the marginal
costs faced by firms in Sri Lanka, there is little evidence that formality is the critical divide on which that
variance depends. Perhaps this is because even formal forms are able to avoid a large share of the taxes
and other payments due, or at least expect to be able to do so at the time of deciding to become formal.
Given the pervasive interest in Governments around the world in trying to increase the size of their formal
sector, our results overall suggest little in the way of pent-up demand to become formal among existing
firms. If they are drawn by the lure of the large number of informal firms, policymakers should think
twice before devoting considerable resources to such formalization efforts. There may well be benefits
from the simplification of registration at the extensive margin, if high-ability entrepreneurs not currently
operating a business are induced to enter. Our experiment does not allow us to say anything this margin,
which remains a key area for future research.
References
Alcázar, Lorena, Raúl Andrade, and Miguel Jaramillo, 2010. ―Panel/tracer study on the impact of
business facilitation processes on enterprises and identification of priorities for future business enabling
environment projects in Lima, Peru – Report 5: impact evaluation after the third round‖, Report to the
International Finance Corporation, Mimeo.
Bertrand, Marianne and Francis Kramarz, 2002, "Does Entry Regulation Hinder Job Creation? Evidence
From The French Retail Industry," The Quarterly Journal of Economics, vol. 117(4), pp. 1369-1413.
Bruhn, Miriam. 2010. ―License to sell: the effect of business registration reform on entrepreneurial
activity in Mexico.‖ Review of Economics and Statistics, forthcoming.
Bruhn, Miriam and David McKenzie, 2009, ―In Pursuit of balance: Randomization in Practice in
Development Field Experiments,‖ American Economic Journal: Applied Economics 1(4): 200-232.
de Mel, Suresh, David McKenzie and Christopher Woodruff. 2009, ―Measuring Microenterprise Profits:
Must we ask how the sausage is made?,‖ Journal of Development Economics, 88(1): 19-31.
de Mel, Suresh, David McKenzie and Christopher Woodruff. 2008. ―Returns to Capital in
Microenterprises: Evidence from a Field Experiment‖, Quarterly Journal of Economics 123(4): 1329-
72.
De Soto, Hernando. 1989. The Other Path, New York: Harper and Row Publishers.
Di Tella, Rafael, Sebastian Galiani and Ernesto Schargrodsky, 2007. ―The formation of beliefs: Evidence
from the allocation of land titles to squatters‖, Quarterly Journal of Economics 122(1): 209-241.
Djankov, Simeon, Rafael La Porta, Florencio Lopez-de-Silanes and Andrei Schleifer 2002. ―The
Regulation of Entry,‖ Quarterly Journal of Economics, 117(1), pp. 1-37.
Hsieh, Chang-tai and Peter J. Klenow, 2009, ―Misallocation and Manufacturing TFP in China and India,‖
Quarterly Journal of Economics, 124(4): 1403-48.
Fajnzylber, Pablo, William Maloney and Gabriel Montes-Rojas (2011) ―Does formality improve micro-
firm performance? Evidence from the Brazilian SIMPLES program‖, Journal of Development Economics
94: 262-76.
21
Imai, Kosuke, Luke Keele, Dustin Tingley and Teppei Yamamoto, 2011. ―Unpacking the black box:
Learning about causal mechanisms from experimental and observational studies‖, Mimeo. Princeton
University.
Jaramillo, Miguel, 2009. ―Is there demand for formality among informal firms? Evidence from
microfirms in downtown Lima‖, German Development Institute Discussion Paper 12/2009.
Kaplan, David, Eduardo Piedra, and Enrique Seira. 2010. “‖Entry regulation and business start-ups:
Evidence from Mexico‖” Mimeo. IADB.
Klapper, Leora, Luc Laeven and Raghuram Rajan. 2006. ―Entry regulation as a barrier to
entrepreneurship‖, Journal of Financial Economics 82(3): 591-629
Klapper, Leora and Inessa Love. 2010. ―The impact of business environment reforms on new firm
registration‖, World Bank Policy Research Working Paper no. 5493.
La Porta, Rafael and Andrei Shleifer. 2008. ―The Unofficial economy and economic development‖,
Brookings Papers on Economic Activity 2: 275-363.
Levy, Santiago, 2008, Good Intentions, Bad Outcomes: Social Policy, Informality and Economic Growth
in Mexico, Washington: Brookings Institution Press
Maloney, William. 2004. ―Informality Revisited‖, World Development 32(7): 1159-78.
McKenzie, David. 2010. ―Dimensions of informality in Bangladesh‖, Mimeo. World Bank.
McKenzie, David. 2011. ―Beyond baseline and follow-up: The case for more T in experiments‖, World
Bank Policy Research Working Paper no. 5639.
McKenzie, David and Yaye Seynabou Sakho. 2010. ―Does it pay firms to register for taxes? The impact
of formality on firm profitability‖, Journal of Development Economics 91(1): 15-24.
Mullainathan, Sendhil. 2008. ―Development Economics Through the Lens of Psychology‖, Mimeo.
Harvard University.
Perry, Guillermo, William Maloney, Omar Arias, Pablo Fajnzylber, Andrew Mason and Jaime Saavedra.
2007. Informality: Exit and Exclusion. World Bank Latin America and Caribbean Studies: World Bank,
Washington D.C.
World Bank. 2009. Increasing Formality and Productivity of Bolivian Firms. World Bank, Washington
D.C.

22
Figure 1: Percentage of Firms Registered with different
Government Entities by Firm Size
0
10
20
30
40
50
60
70
80
90
100
0 1 2 3 4 5 6 7 8 9 10 11 to
14
15 to
20
Number of Paid Employees
P
e
r
c
e
n
t
DS
PS or UCMC
VAT
EPF/ETF
0
10
20
30
40
50
60
70
80
90
100
1 2 3 4 5 6 7 8 9 10 11 to 15
Pe
rce
nta
ge o
f Fi
rms
Re
gist
ere
d
Number of Workers
Figure 2: Formality against Firm Size in Different Countries
Sri Lanka municipal
Sri Lanka D.S.
Bangladesh tax
Bangladesh Municipal
Mexico SHCP (tax)
Mexico IMSS
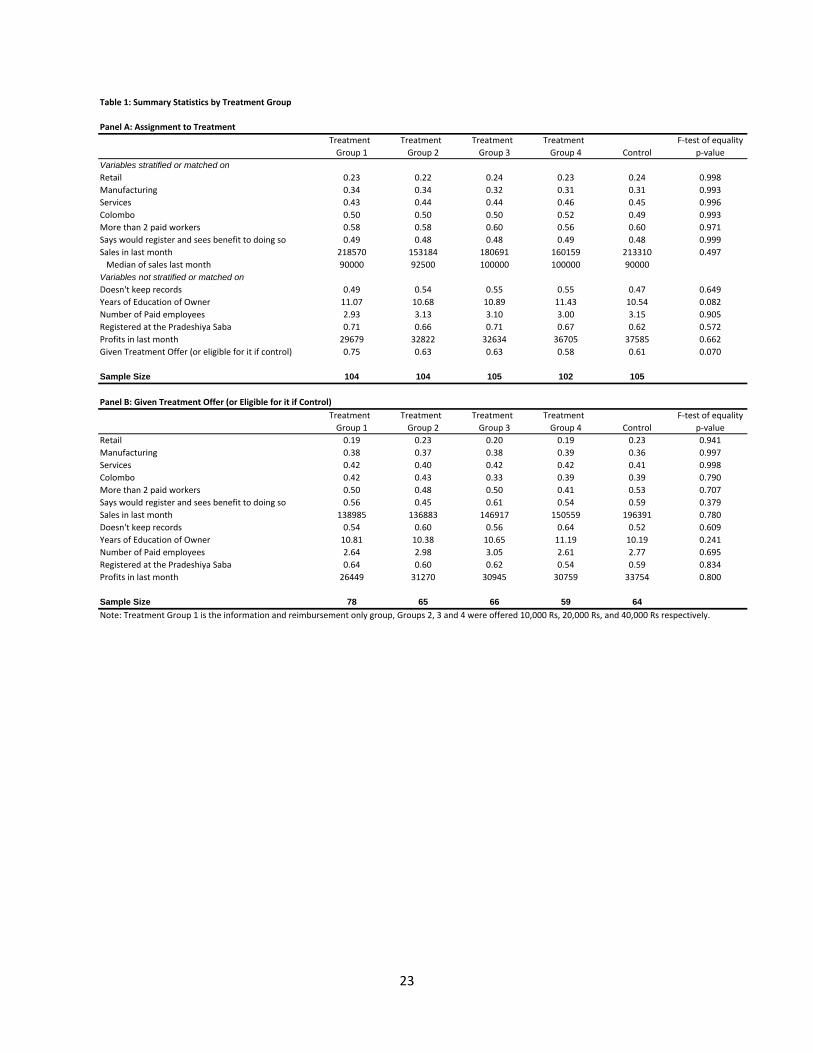
23
Table 1: Summary Statistics by Treatment Group
Panel A: Assignment to Treatment
Treatment Treatment Treatment Treatment F-test of equality
Group 1 Group 2 Group 3 Group 4 Control p-value
Variables stratified or matched on
Retail 0.23 0.22 0.24 0.23 0.24 0.998
Manufacturing 0.34 0.34 0.32 0.31 0.31 0.993
Services 0.43 0.44 0.44 0.46 0.45 0.996
Colombo 0.50 0.50 0.50 0.52 0.49 0.993
More than 2 paid workers 0.58 0.58 0.60 0.56 0.60 0.971
Says would register and sees benefit to doing so 0.49 0.48 0.48 0.49 0.48 0.999
Sales in last month 218570 153184 180691 160159 213310 0.497
Median of sales last month 90000 92500 100000 100000 90000
Variables not stratified or matched on
Doesn't keep records 0.49 0.54 0.55 0.55 0.47 0.649
Years of Education of Owner 11.07 10.68 10.89 11.43 10.54 0.082
Number of Paid employees 2.93 3.13 3.10 3.00 3.15 0.905
Registered at the Pradeshiya Saba 0.71 0.66 0.71 0.67 0.62 0.572
Profits in last month 29679 32822 32634 36705 37585 0.662
Given Treatment Offer (or eligible for it if control) 0.75 0.63 0.63 0.58 0.61 0.070
Sample Size 104 104 105 102 105
Panel B: Given Treatment Offer (or Eligible for it if Control)
Treatment Treatment Treatment Treatment F-test of equality
Group 1 Group 2 Group 3 Group 4 Control p-value
Retail 0.19 0.23 0.20 0.19 0.23 0.941
Manufacturing 0.38 0.37 0.38 0.39 0.36 0.997
Services 0.42 0.40 0.42 0.42 0.41 0.998
Colombo 0.42 0.43 0.33 0.39 0.39 0.790
More than 2 paid workers 0.50 0.48 0.50 0.41 0.53 0.707
Says would register and sees benefit to doing so 0.56 0.45 0.61 0.54 0.59 0.379
Sales in last month 138985 136883 146917 150559 196391 0.780
Doesn't keep records 0.54 0.60 0.56 0.64 0.52 0.609
Years of Education of Owner 10.81 10.38 10.65 11.19 10.19 0.241
Number of Paid employees 2.64 2.98 3.05 2.61 2.77 0.695
Registered at the Pradeshiya Saba 0.64 0.60 0.62 0.54 0.59 0.834
Profits in last month 26449 31270 30945 30759 33754 0.800
Sample Size 78 65 66 59 64
Note: Treatment Group 1 is the information and reimbursement only group, Groups 2, 3 and 4 were offered 10,000 Rs, 20,000 Rs, and 40,000 Rs respectively.
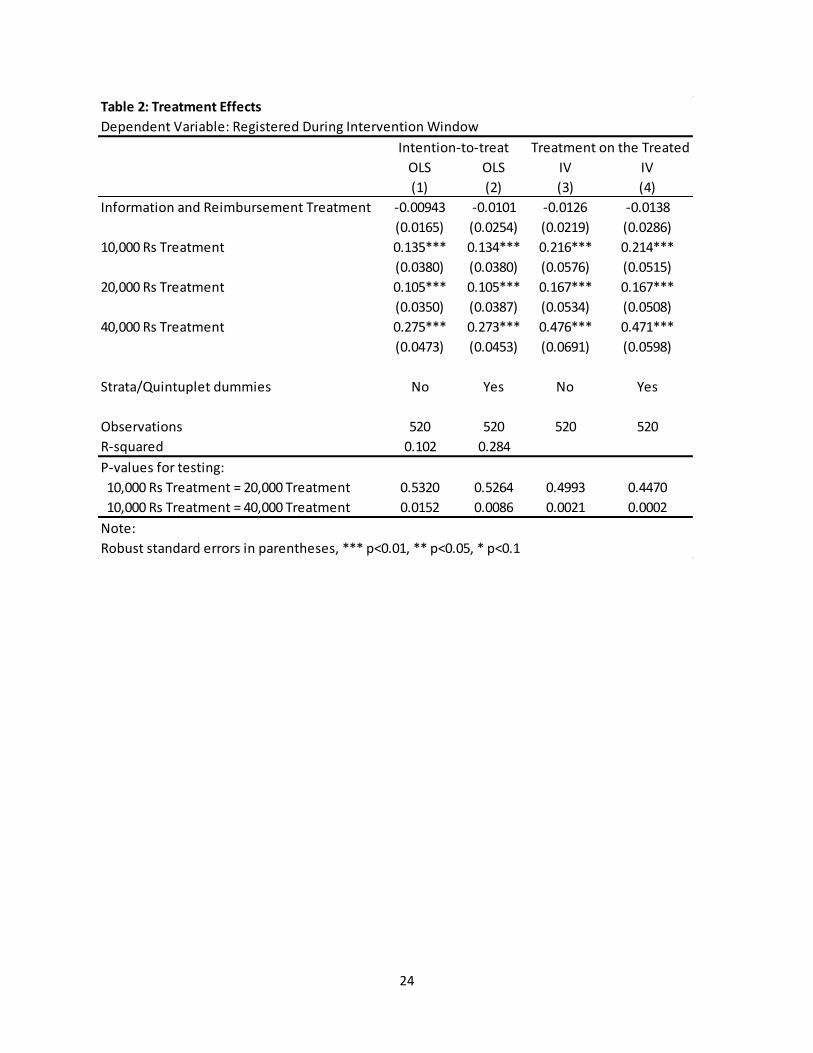
24
Table 2: Treatment Effects
Dependent Variable: Registered During Intervention Window
OLS OLS IV IV
(1) (2) (3) (4)
Information and Reimbursement Treatment -0.00943 -0.0101 -0.0126 -0.0138
(0.0165) (0.0254) (0.0219) (0.0286)
10,000 Rs Treatment 0.135*** 0.134*** 0.216*** 0.214***
(0.0380) (0.0380) (0.0576) (0.0515)
20,000 Rs Treatment 0.105*** 0.105*** 0.167*** 0.167***
(0.0350) (0.0387) (0.0534) (0.0508)
40,000 Rs Treatment 0.275*** 0.273*** 0.476*** 0.471***
(0.0473) (0.0453) (0.0691) (0.0598)
Strata/Quintuplet dummies No Yes No Yes
Observations 520 520 520 520
R-squared 0.102 0.284
P-values for testing:
10,000 Rs Treatment = 20,000 Treatment 0.5320 0.5264 0.4993 0.4470
10,000 Rs Treatment = 40,000 Treatment 0.0152 0.0086 0.0021 0.0002
Note:
Robust standard errors in parentheses, *** p<0.01, ** p<0.05, * p<0.1
Intention-to-treat Treatment on the Treated

25
Table 3: The Registration Process for those registering
Colombo Kandy
Had to provide the following:
Grama Sevaka certificate 11.1 95.7
Pradeshiya Saba or Municipal License 0.0 100.0
Public Health Inspection Report 0.0 4.3
Environmental Authority Report 3.7 0.0
Wildlife Conservation Department Report 3.7 0.0
Certificate of Technical Skills 0.0 4.3
Letter from property owner showing no objection 11.1 95.7
Classify the registration process as:
Very Easy 85 17
Somewhat easy 15 57
Not that easy or very difficult 0 26
Total number of visits to institutions
Mean 2.11 5.9
Median 2 5
Number of Days at D.S. between submission and receipt of BRC
Mean 2.4 8.1
Median 2 6
Number of Days getting other documents processed
Mean 0.3 4.2
Median 0 3
Percent

26
Table 4: Among Firms Offered Money, Which Ones Formalized?
Marginal effects from probit estimation of Registration among sample offered 10,000, 20,000 or 40,000 treatments
(1) (2) (3) (4) (5) (6) (7) (8)
20,000 Rs Treatment -0.0344 -0.0365 -0.0233 -0.0313 -0.0309 -0.0552 -0.0356 -0.0777
(0.0884) (0.0885) (0.0879) (0.0888) (0.0889) (0.0934) (0.0897) (0.0919)
40,000 Rs Treatment 0.285*** 0.283*** 0.277*** 0.280*** 0.289*** 0.300*** 0.304*** 0.274***
(0.0903) (0.0912) (0.0914) (0.0904) (0.0901) (0.0929) (0.0895) (0.0943)
Colombo 0.171** 0.132 0.180** 0.159* 0.170** 0.201** 0.133 0.120
(0.0825) (0.0862) (0.0833) (0.0841) (0.0830) (0.0913) (0.0842) (0.0983)
Retail 0.0176 0.0491 -0.00322 0.0112 0.0230 -0.0319 0.0129 -0.0182
(0.105) (0.107) (0.105) (0.104) (0.105) (0.103) (0.102) (0.104)
Manufacturing -0.00179 0.0131 0.00856 -0.000840 0.00330 -0.0833 -0.00225 -0.0194
(0.0810) (0.0822) (0.0817) (0.0814) (0.0815) (0.0851) (0.0849) (0.0920)
More than 2 paid workers 0.0314 0.0637 0.0572 0.0446 0.0439 -0.0110 0.0639 0.104
(0.0795) (0.0814) (0.0813) (0.0805) (0.0804) (0.0853) (0.0808) (0.0914)
Says would register and sees benefit to doing so 0.0112 0.0305 0.0180 0.00591 0.0211 0.0207 0.0178 0.0356
(0.0737) (0.0738) (0.0739) (0.0732) (0.0745) (0.0770) (0.0784) (0.0796)
log monthly sales in December 2008 -0.0290 -0.0304 0.00393 -0.0290 -0.0320 -0.0420 -0.0321 0.00276
(0.0430) (0.0428) (0.0534) (0.0432) (0.0424) (0.0465) (0.0433) (0.0549)
Education of Owner (years) -0.00962 -0.0266*
(0.0131) (0.0141)
Digitspan recall of owner 0.0371 0.0393
(0.0309) (0.0300)
Owner knows cost of registering 0.110 0.135
(0.0796) (0.0829)
Expects to have 15 or more employees in 5 years -0.154** -0.111
(0.0748) (0.0803)
Profits in December 2008 exceed income tax threshold -0.0926 -0.164
(0.0986) (0.101)
Hyperbolic discounter -0.0966 -0.0796
(0.0894) (0.103)
Risk seeker 0.0256 0.0182
(0.0183) (0.0183)
Log Business Assets in December 2008 0.0540* 0.0515
(0.0307) (0.0332)
Clear and Visible Business Sign 0.152 0.286**
(0.0938) (0.113)
Operate on publicly owned premises -0.266*** -0.240***
(0.0719) (0.0721)
Observations 181 181 181 181 181 163 180 162
Note:
Robust standard errors in parentheses, *** p<0.01, ** p<0.05, * p<0.1
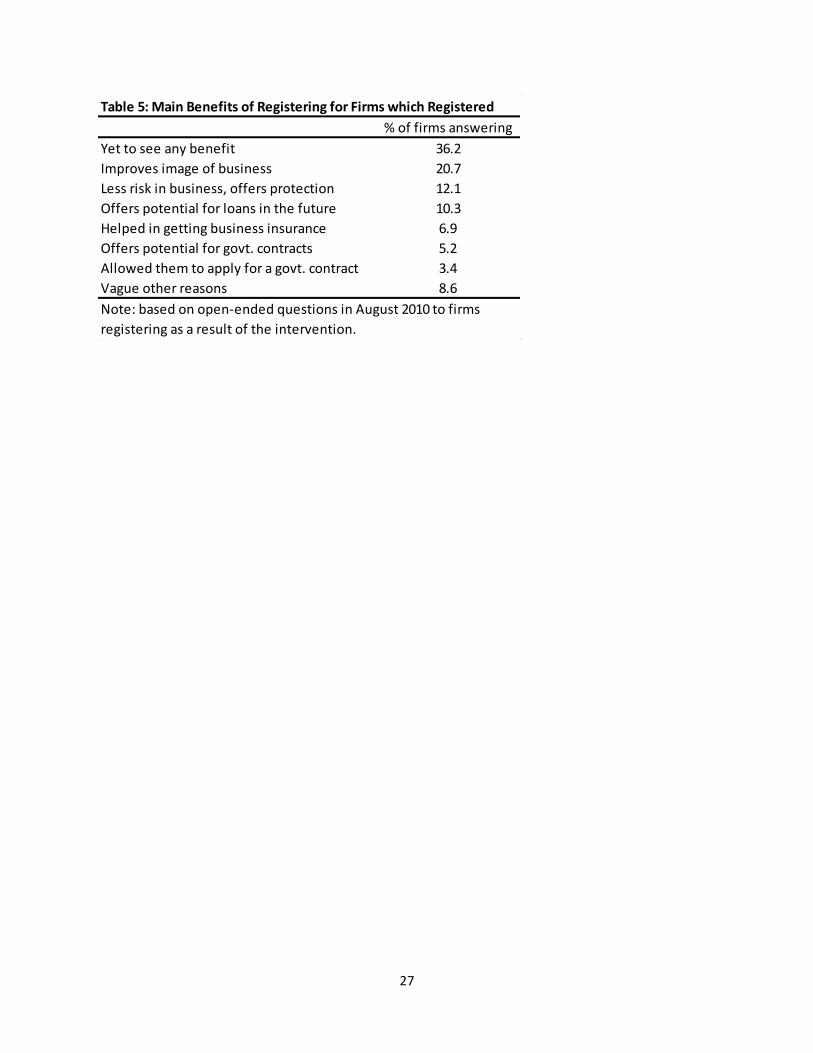
27
Table 5: Main Benefits of Registering for Firms which Registered
% of firms answering
Yet to see any benefit 36.2
Improves image of business 20.7
Less risk in business, offers protection 12.1
Offers potential for loans in the future 10.3
Helped in getting business insurance 6.9
Offers potential for govt. contracts 5.2
Allowed them to apply for a govt. contract 3.4
Vague other reasons 8.6
Note: based on open-ended questions in August 2010 to firms
registering as a result of the intervention.

Table 6a: Effect of formalizing on firm outcomes
Monthly Truncated Truncated Positive Log Monthly Truncated Log Number of Recruited a Log
Profits Profits (99th) Profits (95th) Profits Profits Sales Sales (99th) Sales Paid Workers New worker Capital Stock
Full effect (Upper bound)
Registered with the D.S. 17,007* 14,252 8,525 20,290* 0.440** 205,967 160,542 0.619* 0.681 0.0450 0.231
(10,263) (8,743) (6,023) (10,375) (0.213) (127,563) (109,164) (0.358) (0.491) (0.111) (0.277)
Effect after controlling for log capital stock (lower bound)
Registered with the D.S. 15,961 13,076 7,092 18,659* 0.345* 151,495 108,411 0.455 0.734 0.0591 n.a.
(10,150) (8,532) (5,793) (10,321) (0.203) (126,258) (107,206) (0.337) (0.497) (0.113)
Number of Observations 1,288 1,288 1,288 1,242 1,242 1,270 1,270 1,230 693 693 1,365
Mean for control group in sample 32567 31348 27323 32665 10.13 252950 247950 11.63 2.35 0.36 12.319
Notes:
Registration with the D.S. instrumented with offer of the 10,000 Rs, 20,000 Rs, or 40,000 Rs registration treatments.
Information only treatment group excluded from these regressions.
All regressions include controls for randomization strata and for the lagged dependent variable.
Robust standard errors in parentheses, clustered at the firm level.
*, **, and *** indicate significance at the 10, 5 and 1 percent significance levels respectively.

29
Table 6b: Effect of formalizing on different channels
Paid Amount of Formal Has Business Applied for Applied for
Taxes Taxes Accounting Receipt book Bank A/c. Business Loan Personal Loan
Registered with the D.S. -0.0416 -635.6 -0.0654 0.332*** 0.0335 0.0479 -0.0451
(0.152) (579.8) (0.0802) (0.129) (0.103) (0.0756) (0.0690)
Lag included No Yes Yes No Yes No No
Observations 724 693 693 724 724 724 724
Mean for control group in sample 0.64 1081 0.141 0.31 0.14 0.10 0.056
Share of Electric Applied for Participate Advertised Business has
Sales made Connection Govt. in Govt. in Last six clear and Changed
to Govt. (%) in Bus. Name Contract SME program Months visible sign Location
Registered with the D.S. 3.161 -0.152 0.000453 0.0535 0.259** -0.191 -0.0807
(2.667) (0.116) (0.0540) (0.0449) (0.103) (0.136) (0.0954)
Lag included No No No No Yes Yes No
Observations 696 724 724 724 712 707 692
Mean for control group in sample 0.96 0.40 0.022 0.033 0.16 0.56 0.18
Notes:
Registration with the D.S. instrumented with offer of the 10,000 Rs, 20,000 Rs, or 40,000 Rs registration treatments.
Information only treatment group excluded from these regressions.
All regressions include controls for randomization strata, and for the lagged dependent variable if it was collected.
Robust standard errors in parentheses, clustered at the firm level.
*, **, and *** indicate significance at the 10, 5 and 1 percent significance levels respectively.
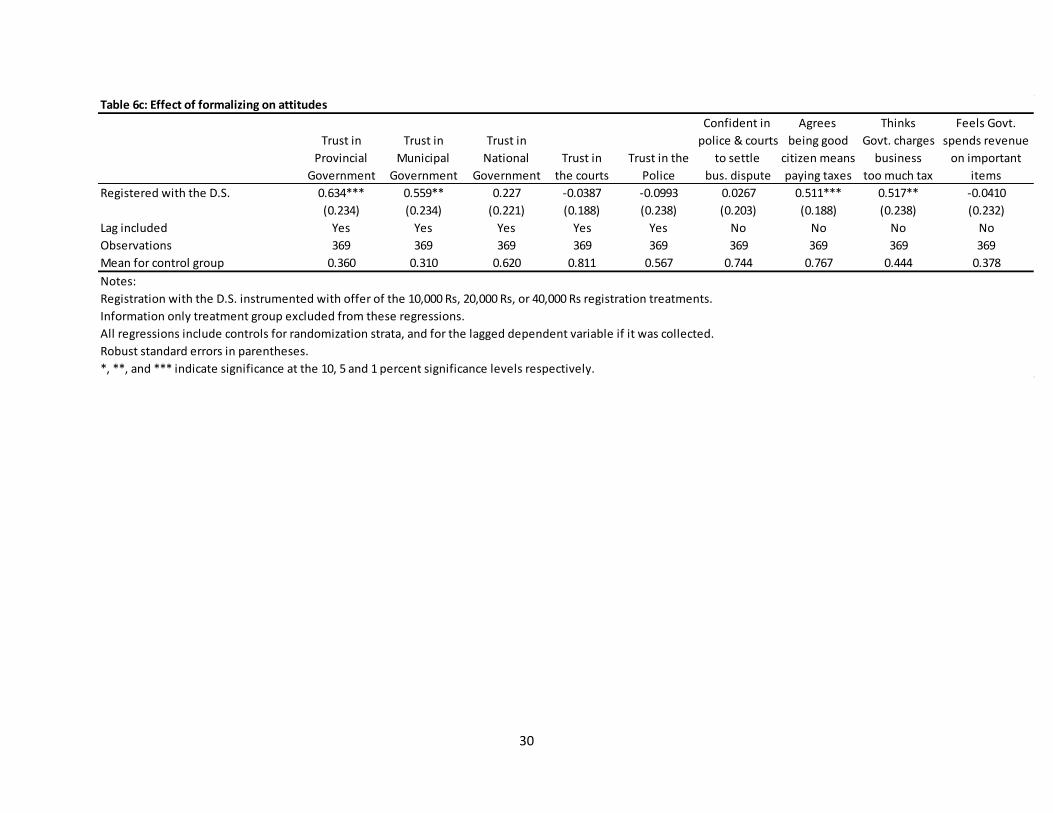
30
Table 6c: Effect of formalizing on attitudes
Confident in Agrees Thinks Feels Govt.
Trust in Trust in Trust in police & courts being good Govt. charges spends revenue
Provincial Municipal National Trust in Trust in the to settle citizen means business on important
Government Government Government the courts Police bus. dispute paying taxes too much tax items
Registered with the D.S. 0.634*** 0.559** 0.227 -0.0387 -0.0993 0.0267 0.511*** 0.517** -0.0410
(0.234) (0.234) (0.221) (0.188) (0.238) (0.203) (0.188) (0.238) (0.232)
Lag included Yes Yes Yes Yes Yes No No No No
Observations 369 369 369 369 369 369 369 369 369
Mean for control group 0.360 0.310 0.620 0.811 0.567 0.744 0.767 0.444 0.378
Notes:
Registration with the D.S. instrumented with offer of the 10,000 Rs, 20,000 Rs, or 40,000 Rs registration treatments.
Information only treatment group excluded from these regressions.
All regressions include controls for randomization strata, and for the lagged dependent variable if it was collected.
Robust standard errors in parentheses.
*, **, and *** indicate significance at the 10, 5 and 1 percent significance levels respectively.