
What Is It Worth? - marshberry.com. As 2015 comes to a close we, ... The Boom of the 2015 M&A...
16
n The Importance of GETTING IT RIGHT n The Boom of the 2015 M&A Market: SUSTAINABILITY OR ANOMALY? n TEN YEAR Stock Investment Return DECEMBER | 2015 JANUARY | 2016 www.MarshBerry.com What Is It Worth? Strategy is the game-changer in valuation—is your agency driving a hard bargain?
Transcript of What Is It Worth? - marshberry.com. As 2015 comes to a close we, ... The Boom of the 2015 M&A...

n The Importance of GETTING IT RIGHT
n The Boom of the 2015 M&A Market: SUSTAINABILITY OR ANOMALY?
n TEN YEAR Stock Investment ReturnD E C E M B E R| 2 0 1 5
J A N U A R Y| 2 0 1 6
www.MarshBerry.com
What Is It Worth?Strategy is the game-changer in valuation—is your agency driving a hard bargain?

CONGRATULATIONS TO OUR APPEX PARTNERS
To learn more about MarshBerry’s Peer Exchange NetworksContact Tommy McDonald at [email protected] or by calling 440.392.6700.
Selected by
as their 2015 BEST AGENCIES TO WORK FOR!
O V E R A L L N A T I O N A L W I N N E R
M I D W E S T R E G I O N S O U T H C E N T R A L R E G I O N G O L D W I N N E R G O L D W I N N E R
S O U T H E A S T R E G I O N W E S T R E G I O N
G O L D W I N N E R
G O L D W I N N E R
W E S T R E G I O N B R O N Z E W I N N E R

letter from John Wepler
It’s a good time for reflection.As 2015 comes to a close we, like you, take time to reflect on what has transpired throughout the year — and how to carry the momentum created into next year.
It’s been a staggering year for mergers and acquisitions. Deal count for the 3rd quarter of 2015 continued its record breaking pace with 94 announced transactions. Although it was the slowest quarter in 2015 (107 in 1st quarter and 105 in 2nd quarter), it was the most active 3rd quarter in the last ten years. The total deal count for year-to-date 2015 (as of 11/30/15) was at 349 U.S. based transactions, which is a 21.2% increase over the number of announced transactions over the same time period in 2014. This is the highest deal count through the 3rd quarter of the year in the last 10 years. For the third quarter of 2015, 35 deals closed in July, 34 in August and 25 in September. Activity has already been busy with 33 deals announced in October and 10 in November.
As we discussed in the November edition of CounterPoint, this pace cannot likely be sustained long-term — and multiples will likely drop. However, there are ways to prepare your organization to be sustainable. In this edition, we dive into the strategy behind improving your business operations and your overall value.
We are excited to see what the ensuing year holds for our organization and yours. We wish you a happy and healthy holiday season and look forward to bringing you new ideas and helping you challenge the status quo in your organization.
Sincerely,
Chairman & Chief Executive Officer, MarshBerry
n PG. 4 What Is It Worth?
n PG. 6 Metric of the Month • Ten Year Stock Investment Return
n PG. 8 The Importance Of Getting It Right
n PG. 10 The Boom of the 2015 M&A Market: Sustainability or Anomaly?
n PG. 12 Quarter in Review Q&A
n PG. 13 The Broker Tear Sheet
n PG. 15 Agency Peak Performance Exchange: Year in Review
n PG. 16 On the Horizon
TABLE OF CONTENTS
CONTRIBUTING AUTHORSMEGAN BOSMA, Senior Vice President
MICHAEL D’ALESSANDRO, Financial Analyst
CANDICE ENSINGER, Senior Analyst
COURTNEY FERRARA, Consultant
KYLE HOEFT, Consultant
MITCH MIKOLETIC, Consultant
CHRISTINA MORAN, Business Unit Manager
WAYNE WALKOTTEN, Executive Vice President
JOHN WEPLER, Chairman & CEO
Selected by
as their 2015 BEST AGENCIES TO WORK FOR!
Securities offered through MarshBerry Capital, Inc., Member FINRA Member SIPC and an affiliate of Marsh, Berry & Company, Inc., 28601 Chagrin Blvd., Suite 400, Woodmere, Ohio 44122 440.354.3230.

What Is It Worth?by Wayne Walkotten, Executive Vice President
Strategy is the game-changer in valuation— is your agency driving a hard bargain?
Securities offered through MarshBerry Capital, Inc., Member FINRA Member SIPC and an affiliate of Marsh, Berry & Company, Inc., 28601 Chagrin Blvd., Suite 400, Woodmere, Ohio 44122 440.354.3230.

5CounterPoint | December 2015 • January 2016
Today’s dynamic insurance market is ripe with buyers chasing opportunities to acquire agencies, inspiring some owners to ask the question: What’s my business worth, anyway? With a virtual feeding frenzy of private equity buying into the insurance space, some agency owners wonder if now is the time to sell. And, seeing the prices those buyers might pay push up higher than in the past, now certainly seems like it could be an ideal time to cash out if that’s your succession plan. You might be wondering: Could my agency fetch an attractive price like that?
The answer is not so simple. Certainly, the acquisition market in the insurance industry is hot right now—and that’s helping to drive up prices and giving more agencies the confidence to proceed with an exit plan that ends with an external sale. But there’s a bit of an optical illusion with the buying activity vs. an agency’s true value. The prices you hear may not be the same as the value your agency gets. And, value is a variable number: It’s a math equation with lots of factors, including whether buyers are internal or external.
We want agencies to improve their business operations and make the most of today’s market, whether that means capitalizing on opportunities to sell to forthcoming external buyers, or creating more value internally so the business can profit and perpetuate. That’s why understanding how valuation works is important.
Strategy First— Valuation will Follow“What’s it worth?” is the first question agency owners ask when they’re considering a sale, and for good reason.
Owners want to assign a number to the hard work they’ve poured their careers into, and also want to determine whether they’ll get the magic number they need to cash out. Is selling going to pay off?
Before jumping into the actual valuation process, the first step in succession planning (whether you hope to sell externally or perpetuate internally) is to define your strategy. Do not allow a valuation to drive your decision. Instead, determine what path you want to take your agency—set the
end goal—then create a plan to maximize the value of your firm. After that, consult your trusted advisors on the internal versus external value of your firm.
Back to your goal: Now is the time, before the valuation, to do some soul searching and consider what you actually want to do with the business. Do you hope to perpetuate the agency internally and pass on the legacy to another key leader or family? Do you want to maximize the return on a sale to an external buyer and “cash out?” (Recognize, you’ll likely still be involved during the ownership transition—selling to an outsider doesn’t usually mean collecting a check and walking out the door.)
What do you want to do with the business?
Next, step back and take a good hard look at where your business operations stand today? As we often point out, it is our opinion that “If you run your agency like it is for sale, you win whether you sell internally or externally.” What are you doing to drive profitability? Are you operating with a “same-old” mentality, or have you challenged your firm and people to improve production? Do you have a sales culture? Have you recruited young blood and given younger top producers opportunities to rise in the agency and take on more responsibility? And, concerning company stock, are you actively engaging leaders in ways they acquire ownership? Is there a plan so they can acquire stock, or are you holding on to the lion’s share, resistant to sell it?
Asking these critical “strategy” questions is important because your firm will likely not get the valuation you hope for if everyday business operations are on autopilot. If your goal is to maximize agency value—and it should be—then we believe you first must look inside and make business changes to improve profitability, sales performance and recruiting.
Working with a knowledgeable industry consultant to improve business operations is a wise step as you embark on a potential sale, whether to an internal or external buyer.

METRIC OF THE MONTH
6 December 2015 • January 2016 | CounterPoint
Despite the recent historic run in the stock market since the lows of the recession, an investment in an independent agency continues to offer a strong ROI. There are numerous external and internal factors that enhanced growth and improved profitability, which have had a positive impact on agency valuations. Since 2013, the Public Broker Index has significantly outpaced the other indices resulting in a superior ten year investment return. Numerous factors, including economic improvements and premium increases have benefited both public brokers and
Ten Year Stock Investment ReturnThe S&P 500 Index and Dow Jones Industrial Average (DJIA) are two of the most commonly used benchmarks in the investment industry. Many investors compare their investment performance or return on investment (ROI) against the performance of these two U.S. stock indices. MarshBerry’s Private Independent Agency Index, which is comprised of MarshBerry’s agency valuations, can be used to calculate the ROI an investment in an independent agency could produce. This ROI is then compared against the S&P 500, DJIA, and MarshBerry’s Public Broker Index.
The Valuation Gap: Understanding Worth So, what exactly is a fair market valuation—and why does value look so different when you’re considering an external vs. internal buyer/market?
The latter point is what confuses many owners, even those who have been in the business for decades. It just doesn’t make sense, right? Why is an insurance business valued at a higher price for an external buyer than for someone who’s been working at the agency for years and wants to become its owner?
First, looking at internal and external valuations side by side is like comparing apples and oranges. There are different variables involved in determining the fair market value for these two audiences. The end goal is different. The strategy to prepare for the sale is different. The valuation is also different.
We refer to the discrepancy between external and internal value as the valuation gap, and here’s why it exists. Traditionally, owners preparing to sell to an outside buyer may make changes to their businesses that they might not ordinarily execute in order to help drive up the value. Their moves are focused on improving the proforma and income
Multiples calculated based on deals closed in 2014. EBITDA: Earnings Before Interest, Taxes, Depreciation, and AmortizationBase Purchase Price: The amount of proceeds paid at closing, including any escrow amounts for indemnification items, (i.e., Paid at Close) plus amounts that the buyer may initially hold back, but which are paid as long as the sellers performance does not materially decline, or which may be paid at closing but are subject to a potential adjustment (i.e., Live Out).Realistic Earn Out: The likely earn out to be achieved in the future based on a number of factors including actual seller performance, buyer and seller realistic discussion of earn out metrics, etc.Maximum Earn Out: The additional earn out above the realistic level, that if achieved, would generate the maximum possible earn out payment.Source: MarshBerry proprietary database. Data compiled from transactions in which we were directly involved, those from which we have detailed information, and transactions in the public record. Past performance is not necessarily indicative of future results.
AGENCY VALUE COMPARABLES: MAXIMUM PURCHASE PRICE AS A MULTIPLE OF EBITDA

7CounterPoint | December 2015 • January 2016
statement. The changes are not centered on creating a sales culture, for example; or recruiting young talent to take the firm to the next level. The motivation is to get paid more at the time of sale, so these moves are financially focused and not always the best decisions for the agency’s long-term health. Basically, decisions are made with the goal of making the business look good on paper.
When the buyer is internal, an owner probably will not make sweeping changes designed to pump up profit or drive up the agency price. In fact, the owner may get a valuation on the business as it stands; and many businesses can stand some improvement. If the agency has been getting stale, and the owner has neglected to take proactive steps to drive growth, sales, or recruiting, then the value will likely not be as high as expected.
In addition, for strategic reasons or because of access to inexpensive capital, external buyers can also often times afford to pay a higher multiple on the profit, than those internal buyers that need to cash flow the debt financing that enabled the transaction.
Therein lies the gap between external and internal value, both the level of profitability and the multiple a buyer can/or will, pay. Owners can help to try and close this gap and improve internal value by going back to the strategy and continually working to improve operations and growth.
Determining Fair Market ValueWith a pool of willing buyers casting lines in the insurance industry today, agency owners are wise to ask how a fair market value is determined. What factors play into the price a buyer will pay?
privately-held agencies. Large investments in health insurance exchanges and benefits-related consulting capabilities due to the Affordable Care Act (ACA) have resulted in higher multiples and valuations for the public brokers. In general, agency growth and profitability has continued to grow in 2015, which we believe should lead to increased values of both public brokers and independent agencies in 2015 and 2016. n
TEN YEAR STOCK PERFORMANCE (2005-2014)
Public Broker Index is a weighted composite which includes Aon, Arthur J. Gallagher & Co., Brown & Brown, Inc., Marsh & McLennan Cos., and Willis Group Holdings Plc.Private Independent Agency Index is a weighted composite of MarshBerry’s agency valuations based on year end 2014.Sources: SNL Financial and MarshBerry.Past performance is not indicative of future results. Nothing herein shall constitute a recommendation or opinion to buy or sell any security of any publicly traded entity mentioned within this document.
Valuation is in the eye of the beholder. It’s the price at which a business could change hands between a willing buyer and seller, with no external pressures. That’s why a fair market value is different than sales price. An external buyer may have strategic motivation for paying more; an internal buyer may not have the ability to pay what an owner wants; and there are countless other variables that figure into what a buyer will actually pay. But as for fair market value, these “pressures” are stripped from the equation, and what is left is a number that’s subjective and impacted by a firm’s position at a given place and time.
That’s why we return to strategy as the game-changer in valuation. In our experience, no matter your buyer, if you dedicate time and resources to improving your business operations with a mind toward its long-term health and success—and not just how it looks on paper—then its value will escalate.
Agency owners dedicate their careers and make sacrifices in life to grow their businesses and help them succeed. Keep that momentum as you near the finish line, whether that’s an external sale or perpetuation. By doing so, you’ll help to continue to improve the agency value and what you’ll take to the bank. n
Valuation is in the eye of the beholder.

While a vast majority of agency owners identify the long-term solution to perpetuation is structuring an internal transaction, per MarshBerry’s experience, most firms end up selling or partnering with another firm
externally. This is due in large part to a lack of perpetuation planning and inflated internal values. For a firm to be viable long-term, remain independent, and continue with a strong competitive advantage, we believe that management must remain diligent and disciplined when valuing the firm and creating an internal perpetuation plan. Our experience has shown most agencies who intend to internally perpetuate have not done this.
In our opinion, three pillars of a successful plan are: transitioning books of business, transitioning management responsibilities, and transitioning ownership. While all three have independent challenges, transitioning ownership is particularly burdensome because determining the value of the firm is difficult, requiring an expertise most agency owners do not have. Based on MarshBerry’s 2015 Market and Financial survey, only 22% of companies engage a third party to perform a fair market valuation while 71% of companies utilize an internal formula or specific dollar amount to determine the value of the firm. Relying on an internal formula, or specific dollar amount, will likely result in incorrect values.
Two main concerns with utilizing an internal formula, or specific dollar amount, are overvaluing the company (for those who will be buying the stock) or undervaluing the company (for those who would be selling the stock). When determining a fair market valuation, a great deal of importance is placed on the external marketplace as well as the growth and profitability of specific firm being valued. The external marketplace is ever-changing and can have a dramatic effect on the internal valuation of a company at any given time. For example, interest rates, external transaction pricing, etc. By foregoing external factors, owners are inevitably creating a perpetuation plan based on a valuation that could easily be overvalued or undervalued.
Our experience indicates a majority of companies are overvalued when an internal formula or specific dollar amount is used. If a firm is overvalued the new ownership will not have enough cash flow to satisfy debt associated with the transaction. This can force the firm into a challenging position, making it difficult to remain independent. In contrast, if the company is undervalued the new ownership will have enough cash flow to support the transaction, but the exiting owners will not receive the proper consideration for the ownership interest.
The importance of getting your company’s valuation right can be the difference between maintaining your legacy by remaining independent and being acquired by an external buyer. For the agency owners who prefer to internally perpetuate, we believe you should support your perpetuation plan with the requirement to use a fair market valuation for any internal transaction. n
Getting It Right
For the Record
The Importance of
8 December 2015 • January 2016 | CounterPoint
by Mitch Mikoletic, Consultant440.220.5432 | [email protected]
Source: 2015 MarshBerry Market & Financial Survey
Figure 1
HOW IS VALUE DETERMINED IN YOUR BUY-SELL AGREEMENT?

MarshBerry Named ‘Best of the Best’ 2015
Insurance Business America has named MarshBerry as one
of their magazine’s ‘Best of the Best 2015.’ The award recognizes the leading companies and products
that support the industry as chosen by independent
agents and brokers.
9CounterPoint | December 2015 • January 2016
Gain knowledge. Network on the slopes.MarshBerry’s Peak Performance event is the preeminent event for Specialty Distributors in the insurance space. Originally hosted by Neilson Marketing, we’re building on the experiences they built with their audiences and creating an intimate networking opportunity for executives to learn and improve their business — while enjoying the slopes of Park City, Utah.
February 21-23, 2016 Hyatt Escala Lodge Park City 3551 North Escala Court • Park City, Utah 84098
Who Should Attend?n Wholesale Brokers, Managing General
Agents (MGAs) & Program Administrators n Specialty Carriers n Reinsurers with Specialty Books
of Business n Specialty Retailers
Agenda Highlights: n State of the Industry for Specialty Distribution n Best Practices: Results from MarshBerry’s
Industry Exclusive Survey n Perpetuation and How Carriers Can Help n Latest Trends in Internet Marketing with
Neilson Marketing Services n Ski and Winter Recreational Activities
Throughout the Event
Register now at 800.426.2774 or www.MarshBerry.com/Peak Space is limited. Reserve your spot by November 30, 2015 using code MB25 to secure the early bird rate.
Platinum Sponsor: Oak Street Funding, LLCMarsh, Berry & Co., Inc. and its affiliates are non-affiliated entities with Neilson Marketing Services and Oak Street Funding, LLC
W E W A N T T O H E A R F R O M Y O U !
We want to make sure we’re providing the content you want to read and want feedback on the articles we’re publishing. Send an email to us at [email protected] and let us know your thoughts!
“I’m so honored that MarshBerry has been recognized by Insurance Business America and its readers as the ‘Best of the Best’ in the consulting category,” said John Wepler, chairman and CEO of MarshBerry. “We pride ourselves in the relationships that we build with our clients. The key to this is the exceptional team we’ve built.”
“Their hard work and innovative spirit is what truly makes our organization the best of the best.”Insurance Business America conducted a nationwide survey asking agents to rate companies and products that help them take their business to the next level. The report highlights 21 outstanding providers in seven areas: agency management systems, comparative rater/quoting tools, banking and finance, marketing, consulting, errors and omissions (E&O) coverage, and law firms.
“In an age of increasing specialization, the modern agency relies on any number of third-party service providers to free up staff time and allow everyone from principals to account managers to focus on the most important business of insurance,” said Mike Shipley, CEO of Insurance Business America publisher Key Media. n

10 December 2015 • January 2016 | CounterPoint
Sustainabilityor Anomaly?
Dealmaker’s Dialogue
by Kyle Hoeft, Consultant616.723.8428 | [email protected]
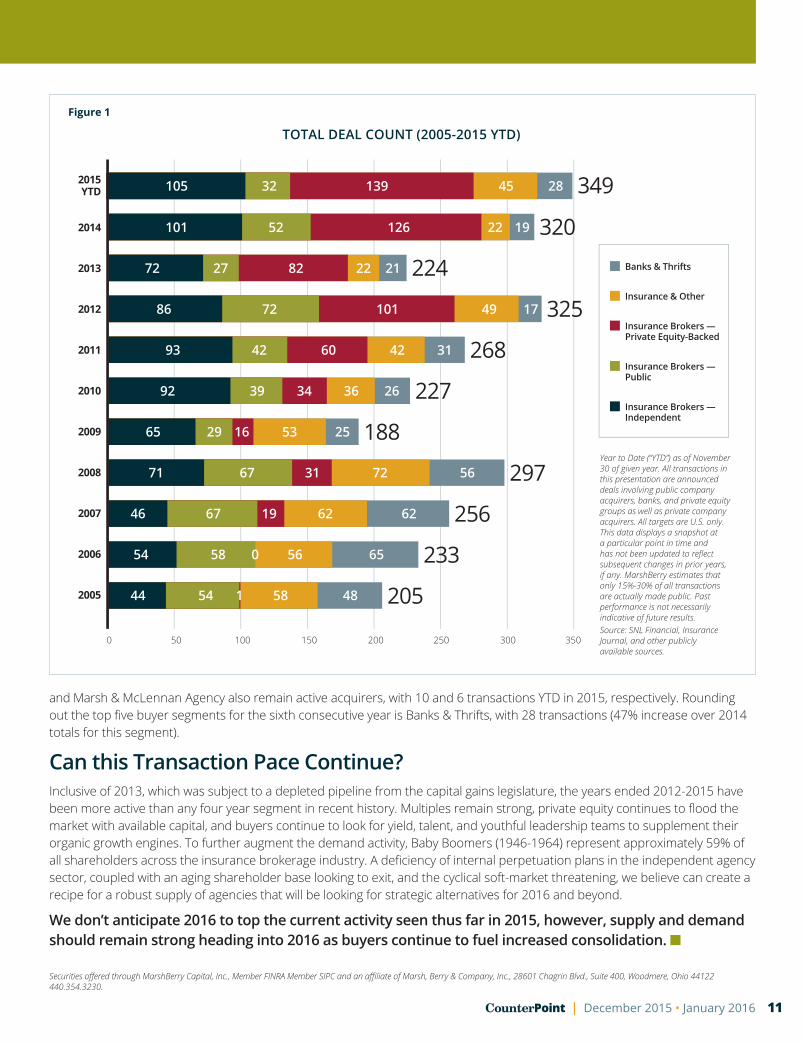
The total deal count for 2015 is on a remarkable pace to become the most active year on record with over 400 announced transactions projected. The rising tide of transactions in the insurance brokerage space in 2015 continues to reach an unprecedented level yet to be seen in recent history. In total, over the past decade there have been over 2,600 publicly announced transactions in the United States and many more that have gone unannounced. Year-to-date (YTD) deal activity through November shows that the total number of announced transactions (349) have already eclipsed the record of 325 set back in 2012, instigated by the capital gains tax rate increase. In comparison to 2014, we have already seen a 9% increase in deal activity, with what has been historically the most active transaction month (December) left on the calendar for 2015’s deal count. Extrapolating the 2015 deal count out through December suggests that the market could experience an estimated 25% increase in announced transactions as compared to the second highest year on record (2014). Truly a torrid pace.
Who are the Most Active Buyer Segments? Two words: Private Equity. Similar to Banks and Thrifts emerging as viable buyers in the early 2000’s, the fervor of the new kids on the block, private equity backed buyers, have placed their insignia on the merger & acquisition market over the past four years. Private equity continues to stand atop the podium in 2015 leading the charge for the fourth consecutive year, with 139 announced transactions (40% deal activity), spread between 20 private equity buyers, YTD through November. The top five private equity players represent 98 of the 139 announced transactions YTD in this segment, paced by Hub International Limited with 29 acquisitions. A close second on the list is Assured Partners, Inc., completing 28 acquisitions, followed by Confie Seguros Insurance Services (18), NFP (12), and Acrisure, LLC (11).
The independent insurance broker segment remains strong as well, with 105 transactions (30% of deal activity) YTD through November, eclipsing the 2014 total for this segment. Many of these transactions were made by large independent agencies buying smaller agencies or books of business. Insurance & Other (includes underwriters, financial technology firms, specialty lenders and other unclassified buyers) currently ranks third, with 45 transactions dispersed between 36 buyers, which has been fueled by increased interest in specialty distributors. Public Insurance brokers currently ranks fourth, with 32 transactions, once again led by Arthur J. Gallagher & Co. (13), for the third consecutive year. Brown & Brown, Inc.
The Boom of the 2015 M&A Market:
The line of business appetite remains heavily focused on Property & Casualty acquisitions which currently comprises 54% of the total deal count for 2015 across all buyer segments.
11CounterPoint | December 2015 • January 2016
Securities offered through MarshBerry Capital, Inc., Member FINRA Member SIPC and an affiliate of Marsh, Berry & Company, Inc., 28601 Chagrin Blvd., Suite 400, Woodmere, Ohio 44122 440.354.3230.
and Marsh & McLennan Agency also remain active acquirers, with 10 and 6 transactions YTD in 2015, respectively. Rounding out the top five buyer segments for the sixth consecutive year is Banks & Thrifts, with 28 transactions (47% increase over 2014 totals for this segment).
Can this Transaction Pace Continue?Inclusive of 2013, which was subject to a depleted pipeline from the capital gains legislature, the years ended 2012-2015 have been more active than any four year segment in recent history. Multiples remain strong, private equity continues to flood the market with available capital, and buyers continue to look for yield, talent, and youthful leadership teams to supplement their organic growth engines. To further augment the demand activity, Baby Boomers (1946-1964) represent approximately 59% of all shareholders across the insurance brokerage industry. A deficiency of internal perpetuation plans in the independent agency sector, coupled with an aging shareholder base looking to exit, and the cyclical soft-market threatening, we believe can create a recipe for a robust supply of agencies that will be looking for strategic alternatives for 2016 and beyond.
We don’t anticipate 2016 to top the current activity seen thus far in 2015, however, supply and demand should remain strong heading into 2016 as buyers continue to fuel increased consolidation. n
Year to Date (“YTD”) as of November 30 of given year. All transactions in this presentation are announced deals involving public company acquirers, banks, and private equity groups as well as private company acquirers. All targets are U.S. only. This data displays a snapshot at a particular point in time and has not been updated to reflect subsequent changes in prior years, if any. MarshBerry estimates that only 15%-30% of all transactions are actually made public. Past performance is not necessarily indicative of future results.Source: SNL Financial, Insurance Journal, and other publicly available sources.
Figure 1
TOTAL DEAL COUNT (2005-2015 YTD)

12 December 2015 • January 2016 | CounterPoint
1 How are Public Brokers positioning themselves to grow in and out of the market cycles?
Business diversification is key to avoiding the ups and downs of the brokerage market, so many companies are looking to new opportunities within areas such as human resource consulting, risk management, claims processing and other advisory services that are less cyclical. Almost all public brokers mentioned rate pressure in certain areas during the 3Q review and highlighted strategies to offset the impact. Acquiring revenue is another strategy many employ in order to grow in unfavorable market conditions, although year-to-date merger and acquisition (M&A) activity by the public brokers is lower than last year due to high levels of competition by private equity elevated pricing.
2 How is technology playing a role in growth? As with other industries, technology, data and analytics are hot topics for insurance
brokers. Many public brokers are investing in technology to drive organic growth. These types of investments usually take several quarters, or years, to move from investment stage to profit generation. For example, in 2015 AON is beginning to see margin expansion of its Global Risk Insight Platform (GRIP), an international database of risk and placement information in which it began to invest heavily during 2013.
Many of the large public brokers have also invested in technology for proprietary online health care exchange platforms related to Affordable Care Act legislation, as they look to take advantage of anticipated growth in this distribution platform over the next several years. Many brokers acknowledge that the exchanges are contributing negligible amounts of revenue and the programs are either unprofitable or only modestly so. However, it is anticipated that rapid growth in the number of lives on the exchanges should help drive margin expansion, though continued investment over the next several years will likely be needed to support the platform build-out.
3 During Q3, some brokers re-evaluated their cash management strategies, advanced debt plans, and accelerated share repurchase programs. Why are we seeing this activity?
In our experience, brokers typically employ a share buyback strategy to grow earnings per share with excess cash when higher return on invested capital (ROIC) opportunities are not available. Share buybacks are a relatively low risk and can immediately boost earnings per share. We have seen that public brokers have accelerated share buybacks in part due to the increased competition within the acquisition landscape that is driving purchase multiples higher. The increased purchase prices are likely resulting in projected ROIC below the levels generated through share buybacks, causing the company to move towards the more conservative cash deployment approach. Acquisitions are more likely to drive long-term earnings growth, but in the current market environment can be less desirable if the anticipated returns are not up to minimum requirements. For example, Arthur J. Gallagher & Co. mentioned on its investor call that it would prefer acquisitions in the 6-8x Earnings Before Interest, Taxes, Depreciation & Amortization (EBITDA) range to share buybacks, but we have seen current M&A market push multiples to the high end of this range (or above) in many cases. Willis Group indicated there have been acquisition targets that are being bid-up by private equity-backed buyers to the point where they can’t “make the economics work.” To put the buying activity into perspective, the industry has seen 32 transactions through November 30 from public brokers, while private equity-backed agencies have acquired 139 targets in the same timeframe.
Securities offered through MarshBerry Capital, Inc., Member FINRA Member SIPC and an affiliate of Marsh, Berry & Company, Inc., 28601 Chagrin Blvd., Suite 400, Woodmere, Ohio 44122 440.354.3230.
Quarter in Review Q&Awith John Wepler

BROKERAon
CorporationArthur J.
Gallagher & Co.
Brown & Brown, Inc.
Marsh & McLennan
Companies, Inc.
Willis Group Holdings
Public Limited Company
Ticker AON AJG BRO MMC WSH
Total Revenue LTM (in $ mil) 11,718 3,977 1,649 12,854 3,857
Number of Employees (FTEs)1 68,633 21,098 7,591 57,000 18,400
Number of Offices1 500 650 237 500 400
Revenue per Employee ($) 170,734 188,487 217,222 225,509 209,620
Revenue per Office ($) 23,436,000 6,118,000 6,957,519 25,708,000 9,642,500
ENTERPRISE VALUE2
Common Stock Price ($) 88.61 41.28 30.97 52.22 40.97
Number of Shares Outstanding (in 000s) 273,900 176,695 140,970 522,300 179,950
Market Capitalization (in $ mil) 24,270 7,294 4,366 27,275 7,373
Plus: Total Debt (in $ mil) 6,126 2,393 1,160 4,484 2,571
Plus: Preferred Stock & Minority Interest in Subsidiaries (in $ mil) 59 56 0 95 145
Less: Cash & Short Term Investments (in $ mil) 398 370 449 1,330 466
Equals: Enterprise Value (in $ mil) $30,057 $9,372 $5,077 $30,524 $9,623
BOOK OF BUSINESS VALUE2
Market Capitalization (in $ mil) 24,270 7,294 4,366 27,275 7,373
Less: Tangible Net Worth (in $ mil) -4,886 -1,614 -1,131 -1,999 -1,329
Equals: Book of Business Value (in $ mil) $29,156 $8,907 $5,497 $29,274 $8,702
ORGANIC GROWTH
Organic Growth3 2.0% 4.1% 2.4% 4.0% 3.3%
Total Growth3 -4.8% 7.8% 2.6% -0.7% 6.5%
The Broker Tear Sheet has been prepared by Marsh, Berry & Co., Inc. This is an overview and analysis of the five publicly traded insurance brokers, and is not intended to provide investment recommendations on any company. It is not a research report; as such term is defined by applicable laws and regulations. It is not to be construed as an offer to buy or sell or a solicitation of an offer to buy or sell any securities, financial instruments or to participate in any particular trading strategy. This tear sheet is distributed with the understanding that the publisher and distributor are not rendering legal, accounting, financial or other advice and assume no liability in connection with its use. This tear sheet does not rate or recommend securities of individual companies, nor does it contain sufficient information upon which to make an investment decision. These materials are based solely on information contained in publicly available documents and certain other information provided to Marsh, Berry & Co., Inc., and Marsh, Berry & Co., Inc. has not independently attempted to investigate or to verify such information. Marsh, Berry & Co., Inc. has relied, without independent investigation, upon the accuracy, completeness and reasonableness of such information and therefore has assumed no obligation to update this data for financial restatements. These materials are intended for your benefit and use and may not be reproduced, disseminated, quoted or referred to, in whole or in part, or used for any other purpose, without the prior written consent of Marsh, Berry & Co., Inc. Nothing herein shall constitute a recommendation or opinion to buy or sell any security of any publicly traded entity mentioned in this document. Numbers may not add up due to rounding, however, this does not materially affect the data integrity.
The Broker Tear Sheet is a proprietary quarterly report from MarshBerry that highlights critical ratios and statistics on the performance and market value of the five publicly traded insurance brokers. The information is compiled from a number of credible sources including: SNL Financial, Yahoo! Finance, Morningstar and Reuters reports along with company websites.
The one and five year Financial Performance Indicators are updated after each broker’s year end filing (Q4), while the remaining metrics are updated on a quarterly basis.
D e c e m b e r 2 0 1 5 / J a n u a r y 2 0 1 6
Q3 2015 Snapshot (as of 09.30.15)
1 Number of employees and number of offices are estimates based on data provided in annual reports, SNL Financial and on corporate websites by each company. 2 Numbers may not add up due to rounding.3Both Organic Growth and Total Growth represent the most recent quarter (MRQ) in comparison to the same period for the prior year for all reported segments. As such, the difference is comprised of growth by acquisition and disposition of applicable business units for the MRQ. It could include items such as contingent revenue, acquisition revenue and disposed revenue from those that would exclude it from their organic growth calculation. Organic Growth calculations vary by broker (see reverse side).
The Broker TearSheet
13CounterPoint | December 2015 • January 2016
Securities offered through MarshBerry Capital, Inc., Member FINRA Member SIPC and an affiliate of Marsh, Berry & Company, Inc., 28601 Chagrin Blvd., Suite 400, Woodmere, Ohio 44122 440.354.3230.

4As reported in the MD&A published by each company; and calculated and reported slightly differently by each. AON: Includes all revenue (excludes fiduciary investment income, business unit transfers, unusual items and reimbursable expenses). AJG: Includes base organic commission & fee revenue (excludes supplemental and contingent commission revenues, South Australia ramp up fees and New Zealand claims administration). BRO: Includes total commissions and fees and Colonial Claims’ revenue related to Hurricane Sandy from 1Q13, among other items (excludes profit sharing and supplemental commissions). MMC: Includes all segments of revenue, using consistent currency translation (Excluding divestitures, business unit transfers, and acquisitions). WSH: Includes total commissions & fees (excludes legacy contingent commission, investment, and other income). All broker calculations exclude the impact of foreign currency translation, divestitures/disposed operations, and the first twelve months of acquisition commission & fee revenue, except where noted.5EBITDA is not adjusted to include the add-back of non-recurring expenses written off throughout the year.
TERMINOLOGY KEY: LTM: LAST 12 MONTHS (12.31.14); CAGR: COMPOUND ANNUAL GROWTH RATE (12.31.14); EBITDA: EARNINGS BEFORE INTEREST, TAXES, DEPRECIATION & AMORTIZATION; NM: NON-MEASURABLE; YOY: YEAR OVER YEAR
EBITDA5 LTM (in $ mil)
Marsh McLennan 2,688 Aon 2,605 Willis Group Hldgs 769 AJ Gallagher 708 Brown & Brown 494
Median 769
EBITDA YOY Growth as of 12.31.14
AJ Gallagher 22.3%Aon 9.7%Marsh McLennan 4.5%Willis Group 3.2%Brown & Brown 2.7%
Median 4.5%
EBITDA Growth 5 Year CAGR
Marsh McLennan 17.6%Aon 14.8%AJ Gallagher 13.6%Brown & Brown 7.3%Willis Group -1.4%
Median 13.6%
EBITDA Margin LTM
Brown & Brown 30.0%Aon 22.2%Marsh McLennan 20.9%Willis Group Hldgs 19.9%AJ Gallagher 17.8%
Median 20.9%
EBITDA Margin 5 Year Average
Brown & Brown 33.1%Aon 19.9%Marsh McLennan 17.9%AJ Gallagher 17.8%Willis Group 16.5%
Median 17.9%
PROFIT
Organic GrowthQuarter End 3Q154
AJ Gallagher 4.1%Marsh McLennan 4.0%Willis Group Hldgs 3.3%Brown & Brown 2.4%Aon 2.0%
Median 3.3%
Revenue YOY Growth as of 12.31.14
AJ Gallagher 30.1%Brown & Brown 15.6%Marsh McLennan 5.4%Willis Group Hldgs 3.6%Aon 1.9%
Median 5.4%
Revenue Growth 5 Year CAGR
AJ Gallagher 15.6%Brown & Brown 10.2%Aon 9.6%Marsh McLennan 5.7%Willis Group 3.1%
Median 9.6%
Total Revenue LTM (in $ mil)
Marsh McLennan 12,854 Aon 11,718 AJ Gallagher 3,977 Willis Group Hldgs 3,857 Brown & Brown 1,649
Median 3,977
GROWTHOrganic Growth Year to
Date as of 09.30.154
AJ Gallagher 5.3%Marsh McLennan 3.0%Willis Group Hldgs 2.8%Brown & Brown 2.6%Aon 2.3%
Median 2.8%
Tangible Net Worth (in $ mil)
Brown & Brown (1,131)Willis Group Hldgs (1,329)AJ Gallagher (1,614)Marsh McLennan (1,999)Aon (4,886)
Median (1,614)
Working Capital/LTM Revenue
Brown & Brown 16.9%Marsh McLennan 16.5%Willis Group Hldgs 11.7%AJ Gallagher 7.3%Aon 3.2%
Median 11.7%
Days of Working Capital
Brown & Brown 78.2 Marsh McLennan 72.2 Willis Group Hldgs 48.8 AJ Gallagher 28.8 Aon 13.6
Median 48.8
BALANCE SHEETTangible Net Worth
as % of Revenue
Marsh McLennan -15.6%Willis Group Hldgs -34.5%AJ Gallagher -40.6%Aon -41.7%Brown & Brown -68.6%
Median -40.6%
Debt to LTM EBITDA (Lower performance is usually best)
Marsh McLennan 1.7 Brown & Brown 2.3 Aon 2.4 Willis Group Hldgs 3.3 AJ Gallagher 3.4
Median 2.4
Market Cap (in $ mil)
Marsh McLennan 27,275 Aon 24,270 Willis Group Hldgs 7,373 AJ Gallagher 7,294 Brown & Brown 4,366
Median 7,373
Book of Biz Value as Multiple of LTM EBITDA
AJ Gallagher 12.6 Willis Group Hldgs 11.3 Aon 11.2 Brown & Brown 11.1 Marsh McLennan 10.9
Median 11.2
Enterprise Value as Multiple of LTM EBITDA
AJ Gallagher 13.2 Willis Group Hldgs 12.5 Aon 11.5 Marsh McLennan 11.4 Brown & Brown 10.3
Median 11.5
Price-Earnings Multiple
Brown & Brown 21.2 AJ Gallagher 20.6 Aon 20.3 Marsh McLennan 18.7 Willis Group Hldgs 15.8
Median 20.3
VALUEBook of Biz Value as
Multiple of LTM Revenue
Brown & Brown 3.3 Aon 2.5 Marsh McLennan 2.3 Willis Group Hldgs 2.3 AJ Gallagher 2.2
Median 2.3
Dividend Yield Quarter End 3Q15
AJ Gallagher 3.6%Willis Group Hldgs 3.0%Marsh McLennan 2.4%Brown & Brown 1.4%Aon 1.2%
Median 2.4%
RETURNEarnings Yield
Quarter End 3Q15
AJ Gallagher 1.8%Willis Group Hldgs 1.6%Brown & Brown 1.5%Aon 1.2%Marsh McLennan 1.2%
Median 1.5%
Price Per Share Growth LTM
Aon 1.1%Marsh McLennan -0.2%Willis Group Hldgs -1.0%Brown & Brown -3.7%AJ Gallagher -9.0%
Median -1.0%
Price Per Share Growth 5 Year CAGR
Marsh McLennan 21.0%Aon 19.9%AJ Gallagher 15.9%Brown & Brown 12.9%Willis Group 11.2%
Median 15.9%
Total Return LTM
Willis Group Hldgs 3.6%Aon 3.5%Marsh McLennan 3.1%Brown & Brown -1.9%AJ Gallagher -4.9%
Median 3.1%
Securities offered through MarshBerry Capital, Inc., Member FINRA, Member SIPC, and an affiliate of Marsh, Berry & Co., Inc. 28601 Chagrin Blvd., Suite 400, Woodmere, Ohio 44122 • 800.426.2774 No portion of this publication may be reproduced without express written consent from Marsh, Berry & Company, Inc. All rights reserved © 2015.
Q3 2015 Financial Performance Indicators (as of 09.30.15)
14 December 2015 • January 2016 | CounterPoint

15CounterPoint | December 2015 • January 2016
The books are closed on another amazing year within MarshBerry’s Agency Peak Performance Exchange (APPEX) network meetings. Built under a theme of “Building an Organic Growth Machine,” the energy and content were unrivaled.
Conference highlights included:n John Wepler, Chairman and CEO of MarshBerry, presented the “State of the Industry,” covering the macroeconomic
and microeconomic factors affecting the insurance industry landscape today. n Susan Ershler’s keynote presentation, “Conquering the Seven
Summits of Sales,” drew upon her experiences as a sales executive, history-making mountain-climber, and best-selling author.
n Educational breakout sessions addressed talent acquisition, sales management, cyber liability, and the increasingly strengthening bond between technology and insurance delivery.
n The inaugural APPEX “Women in Leadership” event brought together female APPEX attendees to discuss experiences and objectives as significant and important contributors to the insurance industry.
The differentiator of our APPEX meetings is the time spent in our Strategic Issues Groups (SIGs). Agency leaders meet in groups of ten agencies or fewer to delve into their goals, challenges, and commitments. Our SIG members provide feedback and insight to other non-competing agencies on their respective strategies for improvement and hold each other accountable to value-enhancing change. All participants that attend are not only invested in improving their organization, but also in improving the organizations of their SIG peers.
Mark your calendars!2016 Spring APPEX April 19-22, The Cosmopolitan of Las Vegas, NV
2016 Fall APPEX October 18-21, Hilton • Nashville, TN
Thanks to all our APPEX partners—past and present—for the support and value they’ve added to the best Peer Exchange Network in the industry.
To learn more about MarshBerry’s Peer Exchange Networks, contact Tommy McDonald at [email protected] or by calling 440.392.6700.
Building an Organic Growth Machine APPEX
Agency Peak Performance Exchange
by Christina M. Moran, Ph.D., Business Unit Manager, Networks440.220.5273 | [email protected]
Congratulations to Our 2015 Pinnacle & PIN Up Winners!Both accomplishments are awarded in relation to an organization’s Performance Indicator Number (PIN) score, a proprietary calculation that summarizes a firm’s financial performance.
The Pinnacle AwardThe Pinnacle Award is an honor that acknowledges the agency with the highest PIN score, excluding agencies who have won within the last five years. The 2015 Pinnacle award winners were York International and Overmyer Hall Associates.
The PIN Up Award This award recognizes the agency with the largest increase in PIN score since joining the networks. The 2015 PIN Up award winners were Lighthouse Insurance Group and Gannon Associates Insurance.

MARSHBERRY28601 Chagrin Blvd., Suite 400, Woodmere, Ohio 44122
ON THE HORIZON
FEBRUARY 20162.21 - 23 MarshBerry’s Peak Performance MarshBerry’s Peak Performance event is the preeminent event for specialty distributors in the
insurance space. Originally hosted by Neilson Marketing Services, we’re building on the experiences they built with their audiences and creating an intimate networking opportunity for executives to learn and improve their business — while enjoying the slopes of Park City, Utah.
Register today at www.MarshBerry.com/Peak
MAY 2016S A V E T H E D A T E S ! 2016 MarshBerry 3605.03 Trump International Hotel & Tower, Chicago, IL5.05 The Ritz-Carlton Orlando, Grande Lakes, Orlando, FL5.17 Park Central Hotel New York, New York, NY5.19 The Cosmopolitan of Las Vegas, Las Vegas, NV
Register today at www.MarshBerry.com/360
Log on to www.MarshBerry.com to register for events and to view all other MarshBerry news and events.


