What is Interaction for Data Visualization?
12
HAL Id: hal-02197062 https://hal.archives-ouvertes.fr/hal-02197062 Submitted on 30 Jul 2019 HAL is a multi-disciplinary open access archive for the deposit and dissemination of sci- entific research documents, whether they are pub- lished or not. The documents may come from teaching and research institutions in France or abroad, or from public or private research centers. L’archive ouverte pluridisciplinaire HAL, est destinée au dépôt et à la diffusion de documents scientifiques de niveau recherche, publiés ou non, émanant des établissements d’enseignement et de recherche français ou étrangers, des laboratoires publics ou privés. What is Interaction for Data Visualization? Evanthia Dimara, Charles Perin To cite this version: Evanthia Dimara, Charles Perin. What is Interaction for Data Visualization?. IEEE Transactions on Visualization and Computer Graphics, Institute of Electrical and Electronics Engineers, 2020, 26 (1), pp.119 - 129. 10.1109/TVCG.2019.2934283. hal-02197062
Transcript of What is Interaction for Data Visualization?
HAL Id: hal-02197062https://hal.archives-ouvertes.fr/hal-02197062
Submitted on 30 Jul 2019
HAL is a multi-disciplinary open accessarchive for the deposit and dissemination of sci-entific research documents, whether they are pub-lished or not. The documents may come fromteaching and research institutions in France orabroad, or from public or private research centers.
L’archive ouverte pluridisciplinaire HAL, estdestinée au dépôt et à la diffusion de documentsscientifiques de niveau recherche, publiés ou non,émanant des établissements d’enseignement et derecherche français ou étrangers, des laboratoirespublics ou privés.
What is Interaction for Data Visualization?Evanthia Dimara, Charles Perin
To cite this version:Evanthia Dimara, Charles Perin. What is Interaction for Data Visualization?. IEEE Transactions onVisualization and Computer Graphics, Institute of Electrical and Electronics Engineers, 2020, 26 (1),pp.119 - 129. �10.1109/TVCG.2019.2934283�. �hal-02197062�

What is Interaction for Data Visualization?Evanthia Dimara and Charles Perin∗
Abstract—Interaction is fundamental to data visualization, but what “interaction” means in the context of visualization is ambiguousand confusing. We argue that this confusion is due to a lack of consensual definition. To tackle this problem, we start by synthesizingan inclusive view of interaction in the visualization community – including insights from information visualization, visual analytics andscientific visualization, as well as the input of both senior and junior visualization researchers. Once this view takes shape, we look athow interaction is defined in the field of human-computer interaction (HCI). By extracting commonalities and differences between theviews of interaction in visualization and in HCI, we synthesize a definition of interaction for visualization. Our definition is meant to bea thinking tool and inspire novel and bolder interaction design practices. We hope that by better understanding what interaction invisualization is and what it can be, we will enrich the quality of interaction in visualization systems and empower those who use them.
Index Terms—interaction, visualization, data, definition, human-computer interaction.
1 INTRODUCTION
The notion of interaction has been a challenging concept to define inthe field of Human-Computer Interaction (HCI). Only recently, an HCIreview entitled “What is interaction?” [56] summarized concepts thatdescribe the causal relationships between the human and the computer.While this HCI review outlines opportunities for enriching interactivitywith computer systems, it is unclear how these concepts relate to visu-alization. Therefore, while visualization researchers and practitionersmay be aware of such interaction concepts, they do not necessarily seehow to apply them to their own data-oriented practices and needs.
Meanwhile in the past decade we have witnessed a growing callfor enriching interactivity in visualization systems. Forward-lookingresearch on interaction for visualization advocate for visualizationsystems that give absolute freedom to end users to actively restruc-ture [73, 100], sketch [75], author [69, 119] and personalize [57, 111]visualizations; to construct visualizations from scratch [59], performdata-aware annotations on them [54, 117], and unruly remove distract-ing information [29]; to enrich visualizations with external knowl-edge [118], control fluently [36] both data presentations [101] and datapre-processing statistical functions [37]; to indicate uncertainty [82],collaborate with peers [55, 80], and interact with visualizations usingnatural means [66, 74] within physically situated settings [63, 73, 121].
We argue that a strong barrier to achieving this vision is not only thatof the technical challenges, but like in HCI, that of defining interactionfor visualization. In the visualization pipeline [16], interaction occurs atall stages of the visualization process of turning raw data into views onthe data. While the visualization community has iteratively structuredand formalized the representation aspect of the pipeline, significantlyless attention has been paid to the interaction aspect [36, 72, 74, 99].The nature and role of interaction has actually sparked discussions andarguments since the visualization field was created. As of today there isno consensus on what interaction is, and what its role for visualizationis – as interaction is an elusive and overloaded term [74, 92, 126].
To address this problem, we first capture the current view of interac-tion from the visualization community based on the input of researchers.Once this view takes shape, we revisit the view of interaction from theHCI community [56] to understand how the two views differ and relateto each other. Combining these two perspectives, we then propose a
• Evanthia Dimara is with Sorbonne University. E-mail:[email protected].
• Charles Perin is with University of Victoria. E-mail: [email protected].∗All authors contributed equally to this manuscript, with the exception of the
first author who did most of the work.
This is the author’s version of the work.To appear in IEEE Transactions on Visualization and Computer Graphics.
definition of interaction for visualization. This definition attempts tobroaden the scope of interaction in visualization and is inclusive as itconsiders the perspectives of information visualization, visual analyt-ics, and scientific visualization. We further extend this definition tooperationalize flexibility within visualization systems, based on whereinteractions occur semantically in the visualization pipeline. We hopethat this definition will spur novel, bolder interaction design practicesin visualization, and the growth of more flexible visualization tools.
2 A REVIEW OF INTERACTION FOR VISUALIZATION
To capture the view of interaction in visualization, we started with a listof papers based on our own expertise and expert input. Then we applieda recursive process to expand our review while accounting for our ownbias. We describe our methodology rationale, method for collectingpapers, questionnaire we sent to experts, paper collection method, andtagging method. Then we present the summary statistics of the review.
2.1 Methodology Rationale
The topic of interaction in visualization is broad; arguably most visual-ization papers mention interaction at a point. Thus we discarded thesystematic review and instead opted for a critical review, that needs notbe exhaustive but requires a more detailed examination of the litera-ture [46]. Because critical reviews seek to identify the most significantitems in the field [46], we set the three following requirements:
R1:: The view of interaction of the community cannot be captured onlyby citation number, it needs to include expert input.
R2:: The snowballing approach alone (starting with a set of seed papersand expanding using back- and forward-references) is not sufficientbecause it is biased by the selection of seed papers.
R3:: The review must not include HCI papers unrelated to visualization.
We used two metrics to measure the impact and relevance of a paperP based on publication year Py. IIImmmpppaaaccctttPPP = (Pc/10)/(current year−Py +1) measures the importance of the paper to the community basedon its number of citations Pc. RRReeellleeevvvaaannnccceeePPP = Pf /(current year−Py +1)+(Pb +1)/(Py −1980+1) measures the relevance to the topic ofinteraction based on its number of forward references Pf and backwardreferences Pb (i.e., papers that cite, and that are cited by, P) that containboth “interaction” and “visualization” in their title. 1980 is the year ofthe oldest paper [17] we collected. These metrics identify both highlyrelevant and impactful papers, while not relying solely on bibliometrics.
We set the inclusion criteria to ImpactP > 0.5, keeping papers withroughly more than 10 citations a year, and to RelevanceP > 0.2, keepingpapers with roughly more than two forward or backward referenceswith the keywords “interaction” and “visualization” in their title every10 year. These cutoffs (which are broad to prevent false negatives)include important papers but exclude some clearly non-relevant ones.
2.2 Review QuestionnaireWe sent visualization researchers an online form asking for: (1) defini-tion papers, the papers that attempt to define interaction in visualization;(2) relevant papers to the topic of interaction; (3) their years of visu-alization experience; and (4) their interaction experience on a 7-pointscale describing how often their own papers focus on interaction. Therewere also three optional fields: name, email, and comments.
2.3 Method for Collecting PapersWe created a list of seed papers with the following snowballing method:Step 1: We started from our own list of 5 definition papers (R1).Step 2: We sent the questionnaire to expert visualization researchers
who suggested both definition and linked papers (R1,R2).Step 3: We included in the list of seed papers each paper P that:
• was included in our initial list of 5 definition papers or wassuggested as a definition paper at least once; and
• is a journal article or conference paper – to avoid non-peerreviewed entries such as demos; and
• has the term “visualization” in the title or abstract (R3); and• has RelevanceP > 0.2 and ImpactP > 0.5.
In addition, considering that expert input can provide insights notcaptured by our computational method (R1), we included in thelist of seed papers those that did not fulfill these inclusion criteriabut that were suggested as definition paper three times or more.
Step 4: We repeated Step 2, sending the questionnaire to all (non-previously contacted) authors of the added seed papers. Wethen repeated Step 3 with the new suggestions. We stopped therecursion when no new seed paper or author was found.
Once the list of seed papers finalized, we derived a set of linked papers.A paper P is linked if it is not seed and one of the following is true:
• P is suggested by two or more experts as definition or relevant;• P cites or is cited by a seed paper and its title contains both
“visualization” and “interaction”.
2.4 Method for Tagging Papers with Interaction ThemesWe (the two authors of this paper) developed tags (short labels) tocharacterize the seed and linked papers using an iterative deductivecoding method [88]. Specifically, we identified emerging themes fromreading seed papers with the lens of capturing: i) the current view ofinteraction in visualization; ii) problems raised by the community; andiii) existing archetypal descriptions and categorizations of interactions.We then refined these tags incrementally until we obtained a highinter-coder agreement. We then coded all seed and linked papers. Wemeasured inter-coder agreement using Cohen’s Kappa [24] (K), thataccounts for the possibility that agreement occurs by chance. There isno strict rule regarding how to interpret values of K, but inter-reliabilityis considered satisfactory for K ≥ 0.7 and excellent for K > 0.75 [41].
For the first coding iteration, we used plain tag names. We indepen-dently tagged 6 seed papers using the tag names described below withbinary values (a paper either has the tag or not). We obtained K = 0.57.We discussed similarities and differences in our tagging, then wrote thedetailed definitions for each tag presented below. We switched to threevalues: 0 (not applicable tag), 1 (partial fit of the tag), and 2 (good fitof the tag). For the second iteration, we independently coded againthe 6 first seed papers (K = 0.83), as well as 6 additional seed papers(K = 0.78), showing excellent agreement (K > 0.75). For the thirditeration, we independently coded 12 new seed papers. We obtainedK = 0.87, which allowed us to have a single coder per remaining paper.Tag — Definition of Interaction: attempt to define, explain or de-scribe interaction. A rating of 1 marks implicit attempts, includingdefinitions based on specific properties or attributes of interaction. Arating of 2 marks direct definitions (formal or informal, e.g., “interac-tion is ...”).Tag — Critical on Interaction: complaints and frustrations (using anegative tone) about interaction, to reveal areas of improvement andchallenges. A rating of 1 marks brief complaints. A rating of 2 marksextensive discussions of complaints.
Tag — Benefits of Interaction: positive aspects of interaction (actualor expected). A rating of 1 marks brief (or moderately phrased) dis-cussions of benefits. A rating of 2 marks more elaborated (or stronglyphrased) discussions of benefits.Tag — Interaction Concepts: archetypal description of interaction.Given to papers that contribute one of: “concept”, “model”, “frame-work”, “design space”, “paradigm”. A rating of 1 marks concepts withsmall or unclear relation to interaction. A rating of 2 marks conceptswith interaction as a key element (e.g., an interaction model).Tag — Interactive Pipeline: discussion of interaction in relation tothe visualization pipeline, a fundamental concept that transcends sub-domains of visualization and explicitly includes interaction. It is givento papers that use the word “pipeline” or cite one of [16, 20, 21, 48]. Arating of 1 indicates that the existence of interaction is unclear. A ratingof 2 indicates that the interaction component is clearly discussed.Tag — List: contribution of a list (e.g., of interaction techniques, tasks,or intents). We call formal a list that is described with one of the follow-ing words: “taxonomy”, “classification”, “typology”, “categorization”.A rating of 1 marks an informal review (it does not contain any of theformal keywords). A rating of 2 marks a formal review.
2.5 Summary Statistics of the Review1
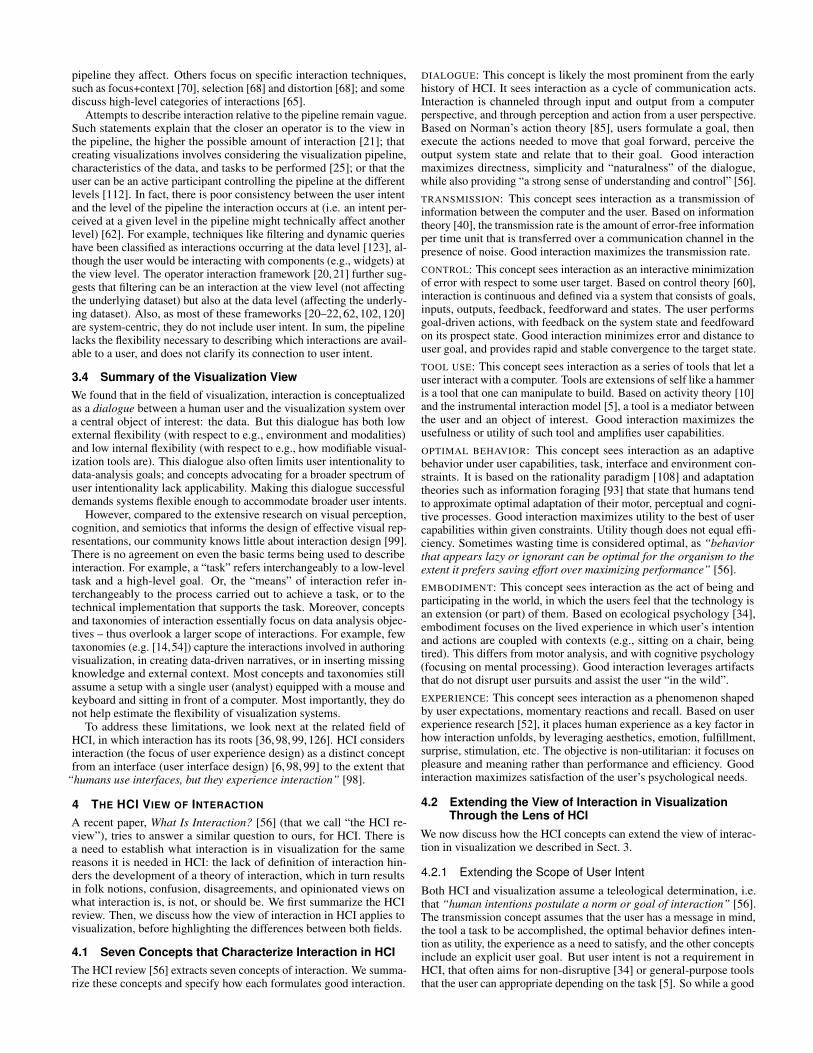
RECRUITING: We emailed 77 visualization experts over a two-monthperiod. 64/77 were successfully delivered. 34/77 were in our initiallist of experts and the remaining 43/77 were derived through our re-cursive algorithm. While we started with a bias toward informationvisualization (e.g., [36, 72, 79, 106]), our algorithm expanded the scopenaturally to visual analytics (e.g., [37, 45, 50, 92]), scientific visualiza-tion (e.g., [1, 66, 67, 77]) and digital cartography (e.g., [98, 99]).PARTICIPANTS: 22 visualization researchers responded to the survey.They had 5–32 (M : 13.6, SD : 6.2) years of visualization experience.12/22 were authors of seed papers, and 14/22 were authors of linkedpapers; 2/22 completed the survey anonymously. Participants ratedtheir interaction expertise with a mean of 5.9/7 (SD : 0.8).SEED PAPERS: Fig. 1 presents all 59 tagged papers. We started with5 definition paper based on our expertise. Participants suggested 114(83 unique) definition papers (6 did not suggest any definition paper).Applying our recursive algorithm resulted in a set of 23 seed papers.LINKED PAPERS: Participants suggested 61 (51 unique) relevant papers.Forward and backward searches gave 105 papers citing, and 104 papersbeing cited by a seed paper. Our linked paper collection algorithmgave 47 linked papers. We excluded 7 theses, 3 unpublished and 1non-English reports. This resulted in 36 linked papers.TAGS: The derived tags were: definition: 32; benefit: 39; critical: 36;concept: 20; pipeline: 12; and list: 35.
3 THE VISUALIZATION VIEW OF INTERACTION
In this section, we synthesize the current view of interaction in visu-alization based only on the points of view of the 59 seed and linkedpapers we reviewed (see Fig. 1). We elaborate on our own critique ofthis literature in Sect. 4 and Sect. 5. While we reviewed all 59 papers,due to space limitations, we only cite papers which have been citedmore than twice – and provide all papers in supplementary material.
3.1 Definitions of Interaction for VisualizationInteraction has been identified as an overloaded [92] and elusive [36,74]term, and it is challenging to find a solid definition of interaction[36, 74, 126]. Therefore, we consider the 32 papers with a definitiontag – whether they attempt to define interaction implicitly or explicitly.
3.1.1 What Interaction for Visualization Must InvolveThe definition papers reveal mandatory components of interaction,namely: external and internal entities, external and internal actions.EXTERNAL ENTITIES: The two most cited mandatory entities arethe user and the data. The user (or analyst [8, 37, 112]) is a human
1Material: https://osf.io/ej7xg/?view only=51485163dfc94d0c8499af17cb2038b2

THE INFORMATION VISUALIZER, AN INFORMATION WORKSPACETHE EYES HAVE IT: A TASK BY DATA TYPE TAXONOMY FOR INFORMATION VISUALIZATIONS.ON THE SEMANTICS OF INTERACTIVE VISUALIZATIONS.AN OPERATOR INTERACTION FRAMEWORK FOR VISUALIZATION SYSTEMSA TAXONOMY OF VISUALIZATION TECHNIQUES USING THE DATA STATE REFERENCE MODELINFORMATION VISUALIZATION AND VISUAL DATA MININGBEYOND MOUSE AND KEYBOARD: EXPANDING DESIGN CONSIDERATIONS FOR INFORMATION VISUALIZATION INTERACTIONSINTERACTION SPACES IN DATA AND INFORMATION VISUALIZATIONAN INTERACTION VIEW ON INFORMATION VISUALIZATIONLOW-LEVEL COMPONENTS OF ANALYTIC ACTIVITY IN INFORMATION VISUALIZATIONTOWARD A DEEPER UNDERSTANDING OF THE ROLE OF INTERACTION IN INFORMATION VISUALIZATIONA FRAMEWORK OF INTERACTION COSTS IN INFORMATION VISUALIZATIONSPATIAL REASONING WITH EXTERNAL VISUALIZATIONS: WHAT MATTERS IS WHAT YOU SEE, NOT WHETHER YOU INTERACTTHE SCIENCE OF INTERACTIONCHARACTERIZING USERS’ VISUAL ANALYTIC ACTIVITY FOR INSIGHT PROVENANCEMENTAL MODELS, VISUAL REASONING AND INTERACTION IN INFORMATION VISUALIZATION: A TOP-DOWN PERSPECTIVEFLUID INTERACTION FOR INFORMATION VISUALIZATIONSEMANTIC INTERACTION FOR VISUAL TEXT ANALYTICSINTERACTIVE DYNAMICS FOR VISUAL ANALYSIS : A TAXONOMY OF TOOLS THAT SUPPORT THE FLUENT AND FLEXIBLE USE OF VISUALIZATIONSAN EMPIRICALLY-DERIVED TAXONOMY OF INTERACTION PRIMITIVES FOR INTERACTIVE CARTOGRAPHY AND GEOVISUALIZATIONA MULTI-LEVEL TYPOLOGY OF ABSTRACT VISUALIZATION TASKSINTERACTION DESIGN FOR COMPLEX COGNITIVE ACTIVITIES WITH VISUAL REPRESENTATIONS: A PATTERN-BASED APPROACHA DESIGN SPACE OF VISUALIZATION TASKSBRUSHING SCATTERPLOTSSTARTING SIMPLE: ADDING VALUE TO STATIC VISUALISATION THROUGH SIMPLE INTERACTIONREADINGS IN INFORMATION VISUALIZATION : USING VISION TO THINKILLUMINATING THE PATH: THE RESEARCH AND DEVELOPMENT AGENDA FOR VISUAL ANALYTICSA TAXONOMY OF TEMPORAL DATA VISUALIZATION TECHNIQUES ???? (NOT SURE HOW THIS PAPER APPEARED)A PROPOSAL FROM THE POINT OF VIEW OF INFORMATION VISUALIZATION AND HUMAN COMPUTER INTERACTION FOR THE VISUALIZATION OF DISTRIBUTED SYSTEM LOADINFORMATION VISUALIZATION : DESIGN FOR INTERACTIONVISUAL PERCEPTION AND MIXED-INITIATIVE INTERACTION FOR ASSISTED VISUALIZATION DESIGNSTACK ZOOMING FOR MULTI-FOCUS INTERACTION IN TIME-SERIES DATA VISUALIZATIONADVANCED INTERACTION FOR INFORMATION VISUALIZATION.INTEGRATING VISUALIZATION AND INTERACTION RESEARCH TO IMPROVE SCIENTIFIC WORKFLOWSAN EXPLORATORY STUDY OF INTERACTIVITY IN VISUALIZATION TOOLS:'FLOW'OF INTERACTIONFI3D: DIRECT-TOUCH INTERACTION FOR THE EXPLORATION OF 3D SCIENTIFIC VISUALIZATION SPACESEXPLORING INFORMATION VISUALIZATION: DESCRIBING DIFFERENT INTERACTION PATTERNSANALYSTS AREN'T MACHINES: INFERRING FRUSTRATION THROUGH VISUALIZATION INTERACTIONCARTOGRAPHIC INTERACTION PRIMITIVES: FRAMEWORK AND SYNTHESISAN INTERACTION MODEL FOR VISUALIZATIONS BEYOND THE DESKTOPREIMAGINING THE SCIENTIFIC VISUALIZATION INTERACTION PARADIGMMULTILEVEL INTERACTION MODEL FOR HIERARCHICAL TASKS IN INFORMATION VISUALIZATIONINTERACTION IN THE VISUALIZATION OF MULTIVARIATE NETWORKSDECLARATIVE INTERACTION DESIGN FOR DATA VISUALIZATIONMOVEXP: A VERSATILE VISUALIZATION TOOL FOR HUMAN-COMPUTER INTERACTION STUDIES WITH 3D PERFORMANCE AND BIOMECHANICAL DATAAN INTERACTION FRAMEWORK FOR LEVEL-OF-ABSTRACTION VISUALIZATION OF 3D GEOVIRTUAL ENVIRONMENTSADAPTIVE VISUALIZATION INTERFACE THAT MANAGES USER'S COGNITIVE LOAD BASED ON INTERACTION CHARACTERISTICSINTERACTION FOR VISUALIZATION SYNTHESIS LECTURES ON VISUALIZATIONTOWARDS THE UNDERSTANDING OF INTERACTION IN INFORMATION VISUALIZATIONQUERY2QUESTION: TRANSLATING VISUALIZATION INTERACTION INTO NATURAL LANGUAGENATURAL INTERACTION WITH VISUALIZATION SYSTEMSA VISUALIZATION-ANALYTICS-INTERACTION WORKFLOW FRAMEWORK FOR EXPLORATORY AND EXPLANATORY SEARCH ON GEO-LOCATED SEARCH DATA USING THE MEME MEDIA DIGITAL DASHBOARDEVALUATION OF TWO INTERACTION TECHNIQUES FOR VISUALIZATION OF DYNAMIC GRAPHSA CASE STUDY USING VISUALIZATION INTERACTION LOGS AND INSIGHT METRICS TO UNDERSTAND HOW ANALYSTS ARRIVE AT INSIGHTSFLEXIBLE ORGANIZATION, EXPLORATION, AND ANALYSIS OF VISUALIZATION APPLICATION INTERACTION EVENTS USING VISUAL ANALYTICSSPATIALVIS: VISUALIZATION OF SPATIAL GESTURE INTERACTION LOGSIVORPHEUS 2.0-A PROPOSAL FOR INTERACTION BY VOICE COMMAND-CONTROL IN THREE DIMENSIONAL ENVIRONMENTS OF INFORMATION VISUALIZATIONVISUALIZATION BY DEMONSTRATION: AN INTERACTION PARADIGM FOR VISUAL DATA EXPLORATIONVISUALIZATION AND INTERACTION WITH MULTIPLE DEVICES. A CASE STUDY ON REACHABILITY OF REMOTE AREAS FOR EMERGENCY MANAGEMENT
AUTHORSTITLEYEAR
LOW HIGH
0 1 2
SE
ED
PA
PE
RS
LIN
KE
D P
AP
ER
S
TAGS
METRICSTAGS
METRIC
SCONCEPT
PIPELINE
RELEVANCE P
FORWARD PEXPERT INPUT
PC (citations)
IMPACT P
BACKWARD P0
12
CRITICALBENEFITS
DEFINITION
19911996199619982000200220032004200420052007200820082009200920102011201220122013201320132013198719981999200520052005200720082010201020102010201020102011201220132013201320142014201420142014201520152015201520152016201620162016201620172017
CARD ET AL.SHNEIDERMAN
CHUAH AT AL.CHI & RIEDL
CHIKEIM
LEE ET AL.WARD & YANG
KOSARA ET AL.AMAR ET AL.
YI ET AL.LAM
KEEHNER ET AL.PIKE ET AL.
GOTZ & ZHOULIU & STASKO
ELMQVIST ET AL.ENDERT ET AL.
HEER & SHNEIDERMANROTH
BREHMER & MUNZNERSEDIG & PARSONS
SCHULZ ET AL.BECKER & CLEVELAND
DIX AND ELLISCARD ET AL.
COOK & THOMASDAASSI ET AL.
LARREA ET AL.SPENCE
HEALEY ET AL.JAVED & ELMQVIST
FEKETEKEEFE
LIANG ET AL.YU ET AL.
POHL ET AL.HARRISON ET AL.
ROTHJANSEN & DRAGICEVIC
KEEFE & ISENBERGREN ET AL.
WYBROW ET AL.SATYANARAYAN ET AL.
PALMAS ET AL.SEMMO & DÖLLNER
YELIZAROV & GAMAYTOMINSKI
FIGUEIRASNAFARI & WEAVER
AMANTSJÖBERGH ET AL.
FEDERICO & MIKSCHGUO ET AL.HAN ET AL.
PALUKA & COLLINSFURTADO ET AL.
SAKET ET AL.TOST & HEIDMANN
LIST
Fig. 1. The 23 seed and 36 linked papers in our review, ordered by year.It shows expert input, the algorithm metrics, and our tagging scores.
being who can be characterized by skills [36], abilities, expertise andmotivation [99], and who initiates the interaction [104]. Some papersdifferentiate between end-users and designers [22]. The data is anintangible information source that is the user’s main object of interest.
The mean with which the user interacts with the data is a mediating[98, 99] entity that we call the visualization system. The visualizationsystem (either as a whole or some of its components) is referred to astechnology [74, 99, 104], computational tools [92] and computer [8]with hardware and software [8], when emphasizing its technologicalproperties; representation [76,104,126], visualization [16,19,22,45,67,68,72,79,99,120], map [98], graphical marks [2,22], display [8,74,106],visual metaphor [37] and non-static image [70], when emphasizing itsvisual properties; and interface [19, 22, 36, 76, 92, 98, 99, 104], system[19, 36, 45, 62, 74, 123, 126], analysis tool [92], workspace [19] andinteraction space [104], when referring to a more abstract mediatingentity. Some papers add that the mediating entity should provide a setof controls [92] for the user to access the data.
Most papers identify time as a fundamental entity of interaction [16,62, 76, 126]. Interaction, unlike representation [126], is seen as a real-time [8, 98] action with a start and an end [74] that should result in animmediate response from the visualization system [16,19,36,106,123].INTERNAL ENTITIES: Interaction is characterized as a goal-orientedactivity [53, 62, 92] involving a data-oriented intent. Intent [36, 45,74, 76, 79, 84, 92] is also phrased as goal [45, 62, 76, 92, 97–99, 123],task [45, 67, 106] or problem [53, 92]. Intent can describe a high-leveldata exploration [19, 45, 62, 68, 84, 92, 126], the generation of insights[45, 62, 92, 98, 99, 126], and the need to acquire multiple perspectiveson the data [62,92,104,126]. Intent can go beyond exploration, such asthe intent to collect and correct data [62], or social intents to coordinatein collaborative setups and to present data to an audience [62]. Intent isboth identified at a low, operational level, e.g., to alter the representation[19, 126], and at a higher level, e.g., for information foraging [79],sensemaking [99, 104], and knowledge creation [92].
EXTERNAL ACTIONS: Interaction is described as a dialogue betweenthe user and the visualization system [36,76,92,98,104,123,126] madeof action-reaction pairs [76, 104]. The user performs an action (orinput [22,102]) on the visualization system [45,67,72,76,79,104]. Thevisualization system returns a reaction [74,76,104] (or response [19,67,74,76,98,106,120,126], change [8,16,22,98,120,126], output [22,102])that is perceived by the user [72, 104, 120]. This reaction has beencalled permutation of graphical marks [2], change of transformationparameters [123], and alteration of the pipeline [62].INTERNAL ACTIONS: Along with its physical acts, interaction with avisualization system involves a cognitive act of the user [37,92,104] or,similarly, a reasoning/analytic process [67, 76, 79, 97] on the data.
3.1.2 What Interaction for Visualization Can InvolveInteraction for visualization can involve additional external and internalentities, and additional external and internal actions.EXTERNAL ENTITIES: Interaction can involve external physical objects[62, 74, 106] such as mouse [79], pen [74] keyboard [79] and physicalconstraints [99]. It can also involve a variety of modalities such asbody movements [19, 74], speech [74], head [79] and eye movement[79]. Many modalities (e.g., gaze, head) tend to be overlooked invisualization. Restricting modalities leads to a “disjointed picture ofhuman performance” [79] and lost opportunities to capture user intent[79]. Interaction also involves the environment under which interactionoccurs, for example whether it is a casual or working environment [99],and whether there are multiple users involved [62, 74, 92, 99].INTERNAL ENTITIES: Users’ prior knowledge [92], internal mentalrepresentation [104], skills [36] and abilities [99] can be involved wheninteracting with a visualization system. While interaction can startwith a concrete user query [19, 45, 84, 106], it can also lead to theinternalization of new goals [104]. Moreover, interactions might occurwith an absence of intent, such as with proxemics interactions [74].EXTERNAL ACTIONS: Interaction can involve many user actions. Suchaction can change the data [16, 22, 45, 76, 84, 92, 102, 104], e.g., withfiltering and aggregation [102]. It can change the representation andpresentation of information [8, 16, 19, 37, 45, 68, 79, 84, 104], e.g., withsorting [45] or when switching from a map to a timeline [45]. Itcan create metadata, for example by temporarily marking data to track,annotate or bookmark [37,45,84]. It can create new data representations[74, 79] and new data, to express and manipulate new knowledge [37,45, 104], e.g., with note taking and when manipulating a knowledgemanagement component [45]. A user can perform an action that doesnot occur on the data or their representation, e.g. adjusting a movablebaseline to compare the heights of a histogram [126], performing ametaction on their own action history, (undo/redo) [45], and steering astatistical data model [37]. Last, along with the dialogue between theuser and the visualization system, there is also the dialogue of userswith the external environment [92] and with their peers [62, 74, 92, 99].INTERNAL ACTIONS: While interaction with a data source is enabledwithin the context of a tangible visualization system, much of it canoccur internally in user’s mind [74, 92], for example information pro-cessing [104], memory encoding [104], and simulative reasoning [79].On a deeper level, the interaction takes the form of a dialogue betweenthe “internal representations and processes of the user and the externalrepresentations and processes” of the visualization system [104].
3.1.3 Properties of InteractionInteraction for visualization is characterized as a goal-oriented [62,76, 92, 97–99, 123] activity that contains semantics [22, 45], that issequential [22, 45, 98, 104], incremental [16, 36, 37, 106], and iterative[19, 98, 104], and preserves the following properties:GRANULARITY: Interaction is characterized at multiple levels of gran-ularity [2, 45, 62, 76, 102, 104]. Such levels include micro-level (e.g.,mouse clicks), macro-level (e.g. hypothesis generation) and levels inbetween (e.g., filter, sort). To distinguish these levels, terms such as{subtasks, tasks, activities} [2], {events, actions, subtasks, tasks} [45]and {events, streams, signals, predicates} [102] have been used. Yet,

it is often unclear whether these levels refer to interaction per se or touser intent. The lack of distinction between levels of interaction resultsin no established conceptualization and vocabulary [104].CONTINUOUS VS. DISCRETE: The temporal dimension, which is afundamental entity of interaction (see Sect. 3.1.1), is either continuousor discrete [76, 84]. Continuous interactions involve a sequence ofintermediate visualization states between an initial state and a goal state(e.g., mouse drags to perform a lasso selection) [84]. Such interactionshappen over a span of time [76]. With discrete interactions, action andreaction occur in a distinct manner [76] (e.g., clicking on a checkbox totoggle filtering [84]). Action and reaction can have different continuity(e.g., a continuous action can have a discrete reaction [76]).DIRECT VS. INDIRECT: Directness is associated with continuous repre-sentation of the objects of interest, rapid, incremental, and reversibleuser actions; allowing for usage with minimal knowledge [16, 36]. Di-rectness was first associated with techniques such as dynamic queries[16] that provide widgets to explore the data interactively – as opposedto command-line interfaces. But the meaning of directness has changedand dynamic queries are now said to be indirect because the user in-teracts with intermediate, likely spatially distant widgets – as opposedto interacting directly with the representation of the data itself. Ratherthan (quite arbitrarily) classifying interactions as either direct or indi-rect, it is useful to consider that interactions have degrees of directnesson an indirect–direct continuum [62].
3.1.4 Terms Related to Interaction
Interaction is distinct from interaction technique, interactivity, and sci-ence of interaction. Interaction technique is less broad [104] and moretangible [126] than interaction, and refers to the user means with whichinteraction can occur [92] (in terms of hardware and software [62]). Un-like interaction, an interaction technique does not necessarily embed thenotion of intent [92]. Whereas interaction refers to the action-reactiondialogue between a user and visualization system, interactivity refers tothe feel, properties, and quality of this interaction [76]. Yet, the termsare sometimes used interchangeably [21, 62]. Science of interaction isbroader than interaction [92]. It is the study of methods by which hu-mans create knowledge through interaction, and it involves developingand testing theories and practices to better support interaction [92]. Allthese terms internalize the notion of interaction. Thus, making themactionable requires a precise view of what interaction is.
3.2 Reported Benefits & Critiques on Interaction
39 papers reveal benefits of interaction. At first, interaction was seen asa necessity to handle increasing amounts of data [32, 38, 64, 106, 126].But interaction has moved beyond its necessity. It is now seen as amean to amplify cognition in active, human-driven data exploration[37, 47, 54, 68, 70, 79, 95, 104, 125, 126] in which the user is in controlof the information space [36, 100, 106]. It is via interactive manipula-tion that “knowledge is constructed, tested, refined and shared” [92].Further, interaction leverages humans’ natural abilities through newvisualization shapes, modalities, and input technologies [36, 62, 74, 77],helping to make visualizations accessible to broader audiences [74].
Despite these benefits, the 36 critical papers highlight frustrationsaround the topic of interaction. The most frequent one is that in compar-ison to representation, interaction is rarely the focus of research effortsin visualization [2, 21, 36, 38, 72, 74, 99, 126]. When interaction is thefocus of research, the angle is often more on engineering or implemen-tation than on designing for interaction [36, 99] and facilitating useranalytic activities [2]. A key concern is the limited consideration forhuman (e.g., gaze, speech, haptics, sound, full-body) and technologymodalities (e.g., pen, sketch, multi-touch surfaces), compared to theclassic desktop-mouse-keyboard setups [36, 54, 65, 66, 74]. Beyondmodalities, visualization systems are often not flexible when users wantto express complex data queries [16, 54, 66, 120], integrate annota-tions [39, 54], input new data [21], bookmark and extract insights [39],iterate over their activity history [39, 84], organize freely elements ofthe layout [54], choose their own statistical [37, 54] and visualizationmodels [54, 79, 100, 102], and collaborate in real-time [39, 54].
This lack of flexibility stems from several factors, including tech-nical challenges [90, 102], costs [72] and the lack of theoretical foun-dations that bridge external representations with internal cognitiveprocesses [47, 79, 104]. Two other factors are seemingly conflicting.On one hand, there is the failure of visualization systems to infer usergoals. This is attributed to a strong focus from the community ondata, tasks [14, 72] and domains [104] rather than on human goals;and to a difficulty to infer user goals via activity logs [51, 76, 84]. Onthe other hand, there is an overfocus on operationalizing user goals.As a result the visualization community ignores other objectives thatbroaden the interaction palette, such as engagement, playfulness andgamification [36, 39, 74], which reflect softer, or even lack of, user goal.
3.3 How Visualization Conceptualizes InteractionWe identified the need for more flexible interactions with respect tothe outside world (e.g., environment, social aspect, modalities) and tothe tool itself (e.g., user input, fluid interface permutation). We alsoidentified the need to resolve the ambiguity between intent and lack offlexibility. Next, we review papers with a concept or a list tag to learn(i) how they conceptualize human intent, and (ii) how a visualizationsystem can account for such intent to offer flexibility to the user.
3.3.1 System, Task or Human?The concept and list papers reveal three approaches to conceptualizeinteraction for visualization: system-, task-, and human-centric.
System-centric approaches describe interaction in terms of opera-tors [20–22, 28, 120]. These operators have been adapted to specificdomains such as temporal visualizations [28] and visualizations of 2Ddata [99], and have been organized in a network [20] and in a hierar-chy [22]. Focusing on system operations, system-centric approachesdo not clarify neither the role of the user nor how the user interacts.
Task-centric approaches describe interaction in terms of low leveltasks (also primitives or components) [2, 99, 103]. Such low-leveltasks have been put in relation with data types [106], means, target,cardinality, (temporal) order, and user roles (developers, authors, endusers) [103]. It has been argued that high-level visualization tasks buildon low-level interactions [66], but the relations and boundaries betweenlow, intermediate, and high-level interactions are ill-specified [14, 112].
Human-centric approaches describe interaction in terms of user in-tent [32,39,47,99,126] rather than low-level mechanisms for supportingthese intents. High-level cognitive activities introduce interactions suchas notes (external source of data and external knowledge) and historythat relate to insight actions [45], meta actions [45], and provenanceactions [54], as opposed to exploration actions. Most human-centric ap-proaches assume a high-level user intent in a data analysis context, suchas making profitable investments with stock market data [45] or address-ing the low productivity of a virtual factory network [97]). However, afew human-centric approaches expand the scope of user intent [79] byconsidering factors of interaction beyond data, system and tasks. Suchfactors include the environment (e.g., academic, museum), the context,the technology, the domain, the audience (e.g., web, analyst, casual),the task (e.g., exploration, immersion), and the properties of interaction(e.g., direct, embodied, aesthetic, rewarding) [36, 112]. Consideringthese factors builds higher-level views of interaction, that relate forexample to mental models [79] and epistemic actions that take placeduring sense making, problem solving and decision making [104].
The broader the approach in terms of user intent, the less clear itis how a visualization system can operationalize the flexibility that isneeded to accommodate this wider spectrum of user intents.
3.3.2 Interaction & Visualization PipelineOne of the most prominent concepts that describes a visualization sys-tem as a whole, from user’s high level goal to low level data operations,is the visualization reference model, or visualization pipeline [16].However, only 12/59 papers discuss the role of interaction in it. Mostof those papers [16,20,21,25,28,62,98] stress that interaction can affectall levels of the pipeline i.e., transformations of raw data, processeddata, visual mappings and view. A few papers organize transforma-tions [100] or interaction techniques [123] according to the level of the
pipeline they affect. Others focus on specific interaction techniques,such as focus+context [70], selection [68] and distortion [68]; and somediscuss high-level categories of interactions [65].
Attempts to describe interaction relative to the pipeline remain vague.Such statements explain that the closer an operator is to the view inthe pipeline, the higher the possible amount of interaction [21]; thatcreating visualizations involves considering the visualization pipeline,characteristics of the data, and tasks to be performed [25]; or that theuser can be an active participant controlling the pipeline at the differentlevels [112]. In fact, there is poor consistency between the user intentand the level of the pipeline the interaction occurs at (i.e. an intent per-ceived at a given level in the pipeline might technically affect anotherlevel) [62]. For example, techniques like filtering and dynamic querieshave been classified as interactions occurring at the data level [123], al-though the user would be interacting with components (e.g., widgets) atthe view level. The operator interaction framework [20, 21] further sug-gests that filtering can be an interaction at the view level (not affectingthe underlying dataset) but also at the data level (affecting the underly-ing dataset). Also, as most of these frameworks [20–22, 62, 102, 120]are system-centric, they do not include user intent. In sum, the pipelinelacks the flexibility necessary to describing which interactions are avail-able to a user, and does not clarify its connection to user intent.
3.4 Summary of the Visualization ViewWe found that in the field of visualization, interaction is conceptualizedas a dialogue between a human user and the visualization system overa central object of interest: the data. But this dialogue has both lowexternal flexibility (with respect to e.g., environment and modalities)and low internal flexibility (with respect to e.g., how modifiable visual-ization tools are). This dialogue also often limits user intentionality todata-analysis goals; and concepts advocating for a broader spectrum ofuser intentionality lack applicability. Making this dialogue successfuldemands systems flexible enough to accommodate broader user intents.
However, compared to the extensive research on visual perception,cognition, and semiotics that informs the design of effective visual rep-resentations, our community knows little about interaction design [99].There is no agreement on even the basic terms being used to describeinteraction. For example, a “task” refers interchangeably to a low-leveltask and a high-level goal. Or, the “means” of interaction refer in-terchangeably to the process carried out to achieve a task, or to thetechnical implementation that supports the task. Moreover, conceptsand taxonomies of interaction essentially focus on data analysis objec-tives – thus overlook a larger scope of interactions. For example, fewtaxonomies (e.g. [14,54]) capture the interactions involved in authoringvisualization, in creating data-driven narratives, or in inserting missingknowledge and external context. Most concepts and taxonomies stillassume a setup with a single user (analyst) equipped with a mouse andkeyboard and sitting in front of a computer. Most importantly, they donot help estimate the flexibility of visualization systems.
To address these limitations, we look next at the related field ofHCI, in which interaction has its roots [36, 98, 99, 126]. HCI considersinteraction (the focus of user experience design) as a distinct conceptfrom an interface (user interface design) [6, 98, 99] to the extent that
“humans use interfaces, but they experience interaction” [98].
4 THE HCI VIEW OF INTERACTION
A recent paper, What Is Interaction? [56] (that we call “the HCI re-view”), tries to answer a similar question to ours, for HCI. There isa need to establish what interaction is in visualization for the samereasons it is needed in HCI: the lack of definition of interaction hin-ders the development of a theory of interaction, which in turn resultsin folk notions, confusion, disagreements, and opinionated views onwhat interaction is, is not, or should be. We first summarize the HCIreview. Then, we discuss how the view of interaction in HCI applies tovisualization, before highlighting the differences between both fields.
4.1 Seven Concepts that Characterize Interaction in HCIThe HCI review [56] extracts seven concepts of interaction. We summa-rize these concepts and specify how each formulates good interaction.
DIALOGUE: This concept is likely the most prominent from the earlyhistory of HCI. It sees interaction as a cycle of communication acts.Interaction is channeled through input and output from a computerperspective, and through perception and action from a user perspective.Based on Norman’s action theory [85], users formulate a goal, thenexecute the actions needed to move that goal forward, perceive theoutput system state and relate that to their goal. Good interactionmaximizes directness, simplicity and “naturalness” of the dialogue,while also providing “a strong sense of understanding and control” [56].TRANSMISSION: This concept sees interaction as a transmission ofinformation between the computer and the user. Based on informationtheory [40], the transmission rate is the amount of error-free informationper time unit that is transferred over a communication channel in thepresence of noise. Good interaction maximizes the transmission rate.CONTROL: This concept sees interaction as an interactive minimizationof error with respect to some user target. Based on control theory [60],interaction is continuous and defined via a system that consists of goals,inputs, outputs, feedback, feedforward and states. The user performsgoal-driven actions, with feedback on the system state and feedfowardon its prospect state. Good interaction minimizes error and distance touser goal, and provides rapid and stable convergence to the target state.TOOL USE: This concept sees interaction as a series of tools that let auser interact with a computer. Tools are extensions of self like a hammeris a tool that one can manipulate to build. Based on activity theory [10]and the instrumental interaction model [5], a tool is a mediator betweenthe user and an object of interest. Good interaction maximizes theusefulness or utility of such tool and amplifies user capabilities.OPTIMAL BEHAVIOR: This concept sees interaction as an adaptivebehavior under user capabilities, task, interface and environment con-straints. It is based on the rationality paradigm [108] and adaptationtheories such as information foraging [93] that state that humans tendto approximate optimal adaptation of their motor, perceptual and cogni-tive processes. Good interaction maximizes utility to the best of usercapabilities within given constraints. Utility though does not equal effi-ciency. Sometimes wasting time is considered optimal, as “behaviorthat appears lazy or ignorant can be optimal for the organism to theextent it prefers saving effort over maximizing performance” [56].EMBODIMENT: This concept sees interaction as the act of being andparticipating in the world, in which the users feel that the technology isan extension (or part) of them. Based on ecological psychology [34],embodiment focuses on the lived experience in which user’s intentionand actions are coupled with contexts (e.g., sitting on a chair, beingtired). This differs from motor analysis, and with cognitive psychology(focusing on mental processing). Good interaction leverages artifactsthat do not disrupt user pursuits and assist the user “in the wild”.EXPERIENCE: This concept sees interaction as a phenomenon shapedby user expectations, momentary reactions and recall. Based on userexperience research [52], it places human experience as a key factor inhow interaction unfolds, by leveraging aesthetics, emotion, fulfillment,surprise, stimulation, etc. The objective is non-utilitarian: it focuses onpleasure and meaning rather than performance and efficiency. Goodinteraction maximizes satisfaction of the user’s psychological needs.
4.2 Extending the View of Interaction in VisualizationThrough the Lens of HCI
We now discuss how the HCI concepts can extend the view of interac-tion in visualization we described in Sect. 3.
4.2.1 Extending the Scope of User IntentBoth HCI and visualization assume a teleological determination, i.e.that “human intentions postulate a norm or goal of interaction” [56].The transmission concept assumes that the user has a message in mind,the tool a task to be accomplished, the optimal behavior defines inten-tion as utility, the experience as a need to satisfy, and the other conceptsinclude an explicit user goal. But user intent is not a requirement inHCI, that often aims for non-disruptive [34] or general-purpose toolsthat the user can appropriate depending on the task [5]. So while a good

design should reveal how to use the tool (e.g., using affordances [87]),it should not impose what to do with it. Tools that support unforeseenuser intents actually indicate successful interaction design [31].
Visualization includes user intent more explicitly, even within high-level concepts (Sect. 3.1.1). Insight, or generation of new knowledge,is often said to be the ultimate goal of visualization [25, 65]. While thismight be true in a data analysis context, interaction with a visualizationcan have many goals. The goal might be to engage in your localcommunity [9], to feel emotions through a representation of self [11],to reminisce about personal memories [111], to relate to ‘humanized’data [33], or to experience a data-driven video [49]. In professionalsetups also, a decision maker might have some unanticipated goals suchas to unruly remove visual information [29]. So, while an intent-drivenperspective is more human-centric than a data- or task-driven one [14],extracting intent is not always feasible. We argue that interactionfor visualization will benefit from expanding the scope of user intentand embracing intent-agnostic concepts [36]. As Dix summarizedinteraction design for appropriation, “You may not be able to designfor the unexpected, but you can design to allow the unexpected” [31].
4.2.2 Extending the Scope of User Profiling
The user is a mandatory entity for interaction in both HCI and visu-alization. For HCI though, the spectrum of who is this user is broad;mainly any human being. That is because user profiling is a full stageof interaction design, with a variety of methods such as personas anal-ysis [81], where designers construct various hypothetical archetypesnarrating concrete details on each user’s mental model, environment,skills, frustrations, attitudes, etc [42]. To foster designs that are easy touse while supporting complex needs, it is common that a novice andan expert persona co-exist [42]. In fact, HCI designs often promote atransition from novice to expert usage within the same tool [23], forexample by revealing progressively interface complexity [107] or byproviding visual guidance [71]. In contrast, the common approach todesigning interactive systems in visualization is the design study [83],that establishes user profiles from the very beginning. Narrowing userprofiles allows for a thorough characterization of a domain-specificproblem and of the tasks to be supported. However, design studiestend to not consider user profiles from an interaction perspective (e.g.,technology expertise, device, psychological state, environment, etc..).
In contrast to HCI, the visualization research is more explicit aboutwho the user is. According to Keefe [65], research on interaction in vi-sualization differs from HCI in that it concerns “complex analysis tasksdefined by a specific, highly motivated user population”, particularly
“scientists (or other domain experts)”. This difference becomes lesstrue with the emergence of casual [96] and personal [57] visualizationresearch, as well as visualization democratization movements [59, 116].Yet, our review reveals that the profile of novice user is overlooked, asmost papers refer to analysts and formal data analysis objectives whenconceptualizing interaction. Visualization research also distinguishesdesigners and end-users when referring to data operations [22]. How-ever, we saw in Sect. 3.3 that the roles of designers and end-users on thepipeline are ill-specified. The line between designer and end-user blurseven more with approaches that reduce the burden for programmaticgeneration of interactions [59, 100, 102], placing custom visualizationsin the hands of broader audiences [54].
Overall, dichotomies of users (i.e. analyst vs. non-analyst, expertvs. novice) likely contribute to shaping research sub-domains thatare poorly connected to each other – in other words, contributes topoor external validity [12]. We argue that user profiles need not bebinary, as visualization literacy is an often misunderstood metric [26,27]. Also, many user profiles exist along the spectrum of expertise.Some analysts might experience novice needs such as a period offamiliarization and sporadic usage of a tool; while “novices” may dealwith complex tasks such as choosing a profitable real-estate investmentamong multiple trade-offs. We advocate for visualization research toadopt HCI methods to identify broader spectra of user profiles – evenfor a single tool – at the forefront of the design process.
4.2.3 Extending the Scope of what Good Interaction isThe most pronounced view of interaction both in visualization and inHCI is that of a dialogue, where human and computer communicate viaaction-reaction pairs. HCI further stresses that such dialogue should feelnatural (e.g., using effective mapping [86] and quality feedback [94])and be as direct and simple as possible (e.g., by comparing systems oninteraction complexity using GOMS [18] or stochastic [3] models).
HCI concepts emphasize other desirable properties of interactionthat can apply to visualization. The behavior concept suggests thatvisualization research could consider bounded rationality [44] contexts,in addition to strict normative rationality [30]. In some contexts, vi-sualization users face massive cognitive overload under stress – forexample decision makers that need to react real-time to tasks such asplanning evacuation routes [113]. In such context, good interactionmight equal simple interaction over minimum information, even at thecost of missing better alternatives [113]. Minimum information relatesto the transmission concept, that is already considered when designingdata representations (e.g., Tufte’s data-ink-ratio [114]). This conceptcan also be applied to designing interaction. For example, the BIGNavtechnique for map navigation over uncertainty reduces user steps byprogressively acquiring knowledge of the user’s intent [78], instead ofrequiring the user to execute navigation commands.
Several HCI concepts are further overlooked in visualization, in-cluding user experience [36] and embodiment [74]. These relate to thenotion of ubiquitous interaction, promoting interaction that supportsmultiple contexts (e.g., the field, the office, the home) while remainingconsistent across them – as opposed to context-dependent interactionsdesigned for point solutions [92,109]. To design for such environments,visualization can embrace concepts such as embedded data representa-tions that integrate visual or even physical representations of data withthe physical world [121], and design principles such as polymorphismfor carrying interactive tools across different visualization systems [7].
5 DEFINING INTERACTION FOR VISUALIZATION
Although we saw that HCI can extend the view of interaction in visu-alization, determining the fundamental differences between the twofields is a longstanding challenge [35]. By comparing the visualization(Sect. 3) and the HCI (Sect. 4) views of interaction, we articulate thesedifferences and propose a definition of interaction for visualization toencourage novel and more flexible interaction design practices.
5.1 Key Differences in Interaction Between VIS and HCIWe identify key differences between visualization and HCI that arerelated to entities, focus, intent and flexibility of interaction:ENTITIES AT PLAY: According to the HCI review, “The folk notionbehind such uses [interaction] seems to be that of two entities (computer,human) engaged in an interplay of sorts.” [56]. In visualization, thisfolk notion differs in that it must include a data entity. The entitiesengaged in an interplay of sorts would then be (data, computer, human),with the computer being a mediator between human and data.PERFORMANCE FOCUS: Most HCI concepts aim for tools that areeasy and intuitive to use with the objective to minimize effort, whilemaximizing performance. In contrast, visualization aims further atfacilitating knowledge construction and sense-making [76]. Instead ofminimizing effort, visualizations aim to engage users into thinking andreflecting on the data being explored [76]. Therefore, in contrast to theembodiment concept, constructing a mental model of a visualizationcan be essential [79]. Good interaction in that case may equal effortand seemingly slow interaction to get a deep understanding of the data.NATURE OF INTENT: We saw in Sect. 4.2.1 that the intent of usersinteracting with visualization can be softer than those related to formaldata analysis – such as being related to emotions when interacting withartistic data-artifacts and engagement while interacting with a data-driven story. Yet even this broader notion of intent differs from intentrelated to general-purpose HCI tool in that it is related to data. WhileHCI systems might contain data, visualization by definition is a datainterface that exposes a human to an intangible data source. Therefore,intent in visualization can be refined as being a data-related intent.

INTENT INTEGRATION: The HCI review indicates that in HCI it isoften assumed that users form their goals and intentions outside of theinteraction cycle. For example, a person might have the goal to orderfood online, and HCI concepts will help make the interaction with acomputer better to make this goal of ordering food efficient, satisfying,or a unique experience. The HCI review calls it a blind spot in HCIresearch: “while all concepts subscribe to teleological reasoning, mostsay little about how intentions are formed or affected by interaction”.In visualization, this is clearly not the case. Data exploration is studiedas an iterative process that takes many steps, during which goals andintentions evolve based on views that are updated through interaction.FLEXIBILITY WITHIN-THE-TOOL: We saw in Sect. 4.2.3 that the HCIconcepts can expand the flexibility of a tool within the outside world(e.g., not to disrupt other activities with the embodiment concept) aswell as within our internal world (i.e. to satisfy psychological needswith the experience concept). Visualization differs in that it requiresflexibility within the tool itself. Interacting with a visualization oftenresults in changing tasks on the fly, to iteratively build an understandingof the data through a series of smaller data questions. So while withHCI the user would mostly interact at the view level of the visualizationpipeline, with visualization they might need to interact with all levelsof the pipeline. This means that the user likely benefits from havingaccess to a large variety of means of interacting with the visualization.
To summarize, by comparing the visualization and HCI literaturewe extend the view of interaction in visualization in terms of: scopeof user intentionality, user profiling, and our notion of what goodinteraction means – especially with respect to the external world. Yetsome questions cannot be answered by the HCI literature, mainlybecause HCI lacks an explicit tie to the data component. Specifically,it is unclear how to conceptualize interaction when (i) there is a data-related user intent and (ii) there is a need for interaction flexibilitywithin-the-tool with respect to that intent. We address the first pointabout data-related intent next, through our definition of interaction. Wewill clarify the second point about flexibility within-the-tool in Sect. 6.
5.2 What is Interaction for Visualization?Our definition of interaction for visualization is based on two assump-tions: i) interactions with visualizations are a subset of the interactionswith interactive systems – thus we do not capture all interactions cap-tured by the HCI concepts; and ii) interactions with interactive systemsare a subset of interactions with people’s own mind and environment –thus our definition does not capture all interactions people might per-form while exposed to interactive systems. By comparing findings fromthe visualization (Sect. 3) and the HCI (Sect. 4) literature, we synthesizethe following compact definition of interaction for visualization:
Interaction for visualization is the interplay between a person anda data interface involving a data-related intent, at least one actionfrom the person and an interface reaction that is perceived as such.
This definition consists of the following mandatory interaction compo-nents (i.e. describing interaction requires all of these components):INTERPLAY: We frame the definition via a dialogue metaphor as it is thecommon schema we observed in both visualization and HCI. The word“dialogue” itself though is an overloaded term in HCI, which might beassociated with interfaces that work sequentially, like human-to-humancommunication. Therefore we use its synonym word interplay.PERSON: We replace the commonly reported entity of human “user”with the term person, that is more likely to be perceived as gender-neutral [13]. Although we assume that the person is a human being,the term does not exclude non-human entities [110]. Thus we do notexclude mixed initiatives [53] nor humans becoming “data interfaces”.DATA INTERFACE: A key concern in visualization was the limiteduse of human and technology modalities. To broaden the modalityscope, we call the visualization system entity data interface. This al-lows for a technology-agnostic perspective including non-computerizedvisualization such as physicalizations, infographics and bio-inspiredvisualizations [89]. We do not specify the modality (e.g, “visual”) as
many modalities might apply [91], such as sonification and tactilization(described by Card et al. as “perceptualization” [16]). The data inter-face is a system containing a set of controls that are perceivable by theperson, and linked to a data entity. The data interface can contain otherentities (e.g., a computer). The data entity itself is an abstracted intan-gible source that, like other abstracted notions such as “knowledge”,cannot physically constitute an actor in a two-way communication.Technically, the person interacts with the data interface (not the dataentity), as the data interface is the one capable of providing a response.ACTION: We adopt the term action performed by the person withoutconstraining its granularity (e.g., it can be a low or a high level action).We include any action, physical or mental, and regardless of modality,that causes the reaction of the data interface.ACTION-REACTION: Visualization and HCI agree that the interactiondialogue requires that the interface responds to a person’s action. Whilesuch action-reaction does not limit to a specific modality, (e.g. touch,or thought), it is a cause-effect relationship. Consider two people A andB separated by a wall. If A speaks and B does not respond verbally, thisis not a dialogue. Now, A and B are in the same room, B still does notrespond verbally but A sees B smile. There was a response to the action,regardless of the modality being used (voice or facial expression).REACTION PERCEIVED AS SUCH: Visualization and HCI agree thatthe interaction dialogue requires that the person perceives the reactionof the data interface. If A and B are separated by a wall and B respondstoo quietly to be heard by A, then the reaction is not perceived. If Bresponds loudly but in an incomprehensible way, the reaction is per-ceived, although the dialogue is a bad one. We saw that the perceptionof the reaction is constrained by a time entity. Time expectations candiffer depending on the context [16]. For example, a system that re-quires a long time to compute a statistical model can provide a timelyreaction even if it is not immediate. Therefore, we refrain from usingthe common descriptors of “rapid” or “immediate” reaction. Timelinessis only one factor to the person perceiving the reaction as a response totheir action. In a broader sense, for a dialogue to occur the person mustperceive the causality of their action (i.e., self-agency [62]). To capturecausality, we specify that the reaction must be perceived as such.DATA-RELATED INTENT: Visualization and HCI agree that interactioninvolves a teleological determination (i.e. a norm or goal of interaction).What differs is that the visualization intent (Sect. 5.1) is tied to a datasource and is formed iteratively within the interaction cycle. We use theterm data-related intent to stress this difference. We do not use a termsuch as “data-oriented intent” to not enforce interaction as a goal-drivenactivity but include implicit interaction [61] and coarsely approximatedintent [74]. We also do not enforce the temporality of the intent (i.e.,it can be formed in advance of the interaction or not). We also do notenforce who the beholder of the data-related intent is. Although thebeholder is usually the person, this leaves open the possibility that thebeholder of the intent be the designer of the data interface.
To further highlight the boundaries of our definition, we now answerthe question “Is this an interaction for visualization?” for six scenarios.SCENARIO 1: Joe is staring at a visualization without performing anyaction that is interpretable by the visualization. He is reasoning (men-tally) about the visualized data. There are further (computer initiated)animations, real time changes that show important information that Joetakes into account in his reasoning process.Answer: No. While there were several actions from the person, thevisualization did not return any reaction as a response to those actions.SCENARIO 2: Joe wants to focus on a cluster of data points. Using amouse, he traces a lasso to select the data points. The visualizationdraws the lasso with the exact same color as the background.Answer: No. While there was an action-reaction, the reaction of thesystem was not perceived by the person.SCENARIO 3: Joe notices a slider widget. He intends to filter out somedata points. He moves the slider and the visualization is zoomed-in. Hedoes not understand what is going on.Answer: Yes. Because the reaction of the visualization (although notunderstood) was perceived by the person.

SCENARIO 4: An airport provides a visualization that updates automat-ically to show all departure gate data. Jack looks for his gate number,but the visualization changes too quickly. A gaze detector tracks Jack’sunfocused gaze attempts and slows down the rate at which the visual-ization changes. Jack now locates his gate number.Answer: Yes. There was an action-reaction perceived by the person.Such gazing action was not interpretable by the interface in scenario 1.
SCENARIO 5: Averell cannot remember where he parked his car. In theparking a screen shows car CO2 emission data to motivate car driversto use their car less. Averell is not careful and he bumps his head onthe screen. Because the screen is touch-enabled, this contact rearrangesthe data points. Averell sees some graphics moving around but doesnot pay attention. He ignores the screen and continues his search.Answer: No. While there was an action-reaction perceived by theperson, there was no data-related intent (unless the designer, havingsuch intent, had caused Averell to non-consciously process some data).
SCENARIO 6: Like Averell, William bumps his head on the display.But when he sees the graphics move around he gets curious and startstouching the display to explore what these graphic things are about.Answer: Yes. Although the interaction was not initiated by an explicitintent, there was an implicit data-related intent involved in the process.
6 FLEXIBLE DATA INTERFACES
Definitions are essential to establish foundational knowledge in anyapplied domain. But it is also critical to make definitions actionablethrough applicable concepts. Our definition provides several dimen-sions that the visualization community can investigate to enrich interac-tivity in data interfaces (e.g., action, reaction, perception, intent). In thissection, we provide one example of making the definition actionableby focusing on how to enrich the actions in data interfaces.
Our review of visualization research stressed the need for moreflexible interfaces in visualization (Sect. 3); while we also saw thatthe HCI concepts do not promote flexibility-within-the-tool – whichis essential for visualization (Sect. 5.1). Here we discuss how thenotion of allowable actions offered by a data interface can be used toenrich its flexibility. We first propose a classification of possible actionsthat we then use to operationalize the flexibility of a data interface.Then we present examples of how the concept of flexibility can help topractically describe and compare data interfaces.
6.1 Classifying Actions
Among the different levels of granularity of actions [14, 62, 103], wefocus on intermediate-level actions [62] because: i) they have a data-related meaning thus can support complex cognitive activities, in con-trast to low-level interactions such as mouse clicks; and ii) they areoperationalizable, in contrast to high-level interactions [104].
Such data-level actions are commonly described using the visual-ization pipeline schema [62]. However, Sect. 3.3 revealed that i) thepipeline makes it difficult to describe interaction from a system-centricperspective (e.g., propagation phenomena [62]); and that ii) its re-lation to the person’s intent is ambiguous (e.g., conflicted operationstages [21]). To avoid such problems, we adopt a human-centric inter-pretation of the pipeline. We replace the system-centric interpretationwith a semantic one from a person’s perspective. Particularly, our cate-gorization is based on which are the person’s allowed actions withinthe data interface to achieve their intents. By merging this semanticinterpretation of the pipeline with related taxonomies [45, 54, 62], weconsider three categories of allowable actions within a data interface:data actions, perceptualization data actions, and non-data actions.
DATA ACTIONS operate on the intangible data entity (“data change”[45]). They can be input data actions or processing data actions.• Input data actions operate on raw data values. Examples include:
edit, update, modify and correct data [62]; or add, create, insertand import data or meta data. These actions can be basic, e.g.,importing a dataset in the system [21], sophisticated, e.g., inputtingdata or external knowledge [4, 118] through creating data-awareannotations [54]), and can be disregarded, e.g., collecting data [62].
• Processing data actions apply functions/transformations to the in-put/raw data. Examples include: compile, filter, select subset, andquery data [54]. These actions can be used to transform data “intoa form that is suitable for visualization” [62], to derive from theraw data (e.g., normalized values, statistical summaries and aggre-gates [54]), and to change a statistical model or its parameters [37].
PERCEPTUALIZATION DATA ACTIONS operate on the perceptual for-matting of the data entity (“visual change” [45]). They can be mappingdata actions or presentation data actions.• Mapping data actions assign data entities to perceptual marks and
variables [62], and layout/rearrange the data. These actions constitutethe abstract presentation form of the representation [62].
• Presentation data actions operate on the specific presentation of thedata [62]. Examples include: mark something as interesting, navigate(e.g., pan and zoom) [45]), stylize, highlight, and decorate [62].
NON-DATA ACTIONS do not operate explicitly on the data nor on thedata presentation [45], but on interaction entities not captured by thepipeline model. They can be meta, social or interface actions.• Meta actions operate on the person’s own actions [45]. Examples
include: undo, redo, record activity, log, and change history [45].• Social actions connect the person to other persons. Examples in-
clude: communicate and discuss with peers, share results, and coor-dinate the data analysis work of multiple groups [54].
• Interface actions operate on other data interface components. Ex-amples include: take notes that are not bound to data items (e.g.,document observations/questions/hypotheses/reflections/goals [54]),manage knowledge [45], externalize thoughts [117], and organize,open, close, maximize, and layout/rearrange the interface [54].
6.2 Operationalizing FlexibilitySeveral properties of allowable actions (e.g., complementarity, fitness,genre, diversity, and flexibility [105]) can describe the quality of interac-tion within a data interface. Here we focus on diversity and flexibility.
As diversity, we consider the given interaction means: the set ofdistinct controls that the data interface provides to the person for per-forming actions. Interaction means range from basic to complex, thuswe do not use the term “interaction technique” that is often associatedto elaborated means. An action is allowable only if the data interfaceprovides at least one interaction means for that action. There can bemore than one interaction means per action (e.g., sort data points by:clicking on a button, speaking a voice command, or rearranging datapoints manually). An interaction means can be characterized accordingto its cardinality, human modality, and technology modality.
As flexibility, we consider concept that is broader than diversity andthat builds on our data-oriented interpretation of Gibson’s concept ofaffordance [43] (it differs from the affordance we saw in Sect. 4.2.1 byNorman [87]). In Gibson’s terms, “affordance is what the environmentoffers the individual” [43]. The set of affordances depends on theobject (the data interface) and the person (i.e., a chair affords sittingfor an adult, but not for a baby). By offering more interaction means,a flexible data interface can bolster diversity of affordances, which inturn can help design for inter-individual differences and accessibility.We conflate our classification of allowable data-level actions (what theperson can do with the data) with the concept of interaction means (howthe person can perform these actions) to define flexibility as follows:
Flexibility within a data interface is the number of distinct, allow-able actions of a person on the interface, as well as the number ofinteraction means with which the person can perform each action.
This operationalization of flexibility makes it possible to describe andcompare data interfaces. The purpose is not to plainly count features,but to provide a simple and actionable way of describing interactivevisualization systems. Indeed more interactions does not mean betterinterface, as more interactions than necessary have a cost [72, 115].Next we show through two examples how to compare the flexibility ofexisting tools using i) the cardinality of interaction means and ii) thecardinality of allowable actions based on their category.

Category — Perceptualization data actions: we compare Dust &Magnet [127] with its physical version [73] (“Zooids”).
INTERACTION MEANS
ACTION Dust & Magnet Zooids
PRE
SEN
TAT
ION Mark data
point asinteresting
1) point with finger,2) move mouse cursor ontop, 3) stick object besides
1) point with finger,2) stick object besides,3) put empty glass upside-down over
Highlightdata point
1) click on*, 2) touch* not implemented
*highlights the outline of the point and shows its label
MA
PPIN
G
Rearrangedata points
1) create magnet* 1) create magnet* 2) put points in boxeslabelled with names of dimensions
*attracts points based on their values for the dimension assigned to the magnet
Encodedimension
not implemented 1) map dimension to color using paint,2) map dimension to sticker shape, color,texture, size, etc.. and stick on data points
Both systems allow for three actions. Dust & Magnet offers more in-teraction means for highlighting data points (presentation data action);and Zooids offers more for both mapping data actions. This examplealso stresses that the same action can be performed for different inter-actions. Putting an empty glass upside-down over a data point, marksthe data point as interesting. But this action could also be a data-awareannotation (input data action) because if the Zooid moved, the glass, iflightweight, would move with it. This action, as well as painting on, oradding stickers to Zooids, illustrate that high flexibility in interactionmeans allows for appropriation of a data interface.Category — Data actions: we compare the HomeFinder [122] andthe constructive visualization approach [59] colored tiles (“Token”).
INTERACTION MEANS
ACTION HomeFinder Token
PRO
C.
Make data query 1) move slider widget, 2) dragan icon to a certain location
not implemented
INPU
T
Add data point not implemented 1) add token
Correct data point not implemented 1) replace, 2) recolor token
Add metadata todata point
not implemented 1) annotate token, 2) annotatesurrounding background
The first example focused on cardinality of interaction means. Thisexample focuses on cardinality of allowable actions as a way of reveal-ing what interactions might be lacking in existing tools. For example,HomeFinder allows for data processing actions while Token does not.On the other hand, Homefinder does not support the input actions thatToken does. However, a real-estate agent having information abouta condo and wanting to update the data, or a potential buyer havingvisited a house and wanting to add metadata to it, are credible datainput scenarios that a more flexible system could support.
7 RESEARCH OPPORTUNITIES & CHALLENGES
Broadening the scope of interaction comes with research opportunitiesand challenges for visualization. Increasing the cardinality of allowableinteractions does not necessarily improve the quality of interaction in adata interface. Improving the quality of interaction also requires sup-porting larger numbers of easy to use and fluent [36] interaction meansand providing elaborated interaction techniques [38], while consider-ing the environment [63, 73, 121], leveraging human and technologymodalities [54, 65, 66, 74], and accounting for a broad spectrum of userprofiles [57,59,96,116]. Interaction also has a cost [72]. Similarly to thesavvy concept of Tufte’s data-ink-ratio for visual representations [114],interaction design needs to specify its own boundaries [67]. For ex-ample, offering too many allowable actions may result in increasedinterface complexity and distract from thinking and reflection.
Our categorization of interactions stresses several research chal-lenges. Perceptualization actions stress the challenge of empower-ing the person to form their own visual models (e.g., through author-ing [69, 119] and free-form sketching [75, 124]), by creating repre-
sentations that match their reasoning models [79, 104]. Processingactions stress the challenges of supporting complex data queries [54]and of merging statistical modelling and data exploration within a singleinterface [37]. Non-data actions stress the challenge of fostering col-laboration [55, 80] and reflection over past activities [39, 50, 84]. Inputactions – perhaps the most overlooked actions [62] – stress the chal-lenge of enriching interaction means for data input [4, 26, 62], rangingfrom correcting erroneous data [82] to adding metadata and data-awareannotations [39, 54, 117] to creating knowledge from scratch [59, 111].From a broader perspective, input actions are the actions that allow torefine and integrate human knowledge into the data interface [118].
8 LIMITATIONS
We do not claim that our definition captures all perspectives of inter-action. First and foremost, our definition is one among many possibledefinitions. For example, interactions with absence of intent are aperspective that our definition does not capture.
Second, our critical review is not comprehensive. Some importantperspectives (e.g., on interaction directness [15] and on user engage-ment [58]) are left out due to limitations both of the expert input and ofour paper selection method. For example, papers about interaction tech-niques were often not suggested by experts as they are not framed andrecalled as defining interaction; discarding non-refereed publicationssuch as PhD theses likely results in excluding some controversial work;and the response rate to our questionnaire was relatively small ∼35%(22/64), with senior researchers responding more often than junior re-searchers. Further, our methodology does not include the perspectivesof practitioners, both professional and incidental.
Fourth, the flexibility concept that focuses on allowable actions isonly one way of making our definition actionable. Therefore we see thisdefinition as a thinking tool that the community can use to explore otherways of reasoning about interaction in visualization. For example, onecould focus on the “reaction” of the data interface (e.g., how differenttypes of user feedback can enrich the quality of interaction).
9 CONCLUSIONS
Our methodology for critical reviews that incorporates human exper-tise and quantitative metrics allowed us to analyze (i) mandatory andoptional components of interaction as well as its properties, (ii) thebenefits and critiques on the interaction topic, and (iii) the currentconceptualization of interaction in visualization. By comparing ourfindings from the visualization literature with the view of interactionfrom the HCI literature, we identified opportunities for broadening theview of interaction in visualization on (i) user intentionality, (ii) userprofiling, and (iii) what good interaction is. That comparison led us todistill the fundamental differences between visualization and HCI thatare related to entities, focus, intent and flexibility of interaction.
Building on these findings, we gave one answer to the question “whatis interaction for data visualization?” through a compact definition thatcaptures human intent and interaction causality, is technology agnostic,and includes the full spectrum of human senses.
Finally, our operationalization of the notion of within-the-tool flexi-bility is an example of making this definition actionable. By categoriz-ing interactions based on data-level actions and intents in relation to thevisualization pipeline, we provide a systematic approach for describingand comparing visualization systems. This operationalization can aidvisualization designers estimate how modifiable a visualization systemis, and how diverse the palette of available interactions is.
We hope that our inclusive view of interaction will unify the visual-ization community under a common goal: the creation of visualizationsystems that empower those who use them.
ACKNOWLEDGMENTS
We thank P. Dragicevic, G. Bailly, B. Shneiderman, J-D. Fekete, E. Chi,M. McGuffin, T. Munzner, J. Heer, N. Elmqvist, P. Parsons, M. Tory, M.Brehmer, S. Feiner, H. Siirtola, P. Isenberg, as well as the anonymouscontributors of the survey for their valuable input.
REFERENCES
[1] R. S. Amant. Natural interaction with visualization systems. InternetComput., 19(6):60–64, 2015.
[2] R. Amar, J. Eagan, and J. Stasko. Low-level components of analyticactivity in information visualization. In Proc. InfoVis, pp. 111–117, 2005.
[3] J. R. Anderson. ACT: A simple theory of complex cognition. Am Psychol,51(4):355–365, 1996.
[4] T. Baudel. From information visualization to direct manipulation. InProc. UIST, pp. 67–76, 2006.
[5] M. Beaudouin-Lafon. Instrumental interaction: an interaction model fordesigning post-WIMP user interfaces. In Proc. CHI, pp. 446–453, 2000.
[6] M. Beaudouin-Lafon. Designing interaction, not interfaces. In Proc. AVI,pp. 15–22, 2004.
[7] M. Beaudouin-Lafon and W. E. Mackay. Reification, polymorphism andreuse. In Proc. AVI, pp. 102–109, 2000.
[8] R. A. Becker and W. S. Cleveland. Brushing Scatterplots. Technometrics,29(2):127–142, 1987.
[9] J. Bird and Y. Rogers. The pulse of tidy street: Measuring and pub-licly displaying domestic electricity consumption. In Proc. PervasiveWorkshop, 2010.
[10] S. Bødker. Through the interface - a human activity approach to userinterface design. DAIMI Report Series, 16(224), 1987.
[11] F. Botros, C. Perin, B. A. Aseniero, and S. Carpendale. Go and grow:Mapping personal data to a living plant. In Proc. AVI, pp. 112–119, 2016.
[12] G. H. Bracht and G. V. Glass. The external validity of experiments. Am.Educ. Res. J., 5(4):437–474, 1968.
[13] A. Bradley, C. MacArthur, M. Hancock, and S. Carpendale. Gendered orNeutral? Considering the Language of HCI. In Proc. GI, pp. 163–170,2015.
[14] M. Brehmer and T. Munzner. A multi-level typology of abstract visual-ization tasks. TVCG, 19(12):2376–2385, 2013.
[15] S. Bruckner, T. Isenberg, T. Ropinski, and A. Wiebel. A Model of SpatialDirectness in Interactive Visualization. TVCG, pp. 2514–2528, 2018.
[16] S. K. Card, J. D. Mackinlay, and B. Shneiderman. Readings in informa-tion visualization: using vision to think. Morgan Kaufmann, 1999.
[17] S. K. Card, T. P. Moran, and A. Newell. The keystroke-level modelfor user performance time with interactive systems. Commun. ACM,23(7):396–410, 1980.
[18] S. K. Card, A. T. Newell, and T. P. Moran. The Psychology of Human-Computer Interaction. CRC Press, 1983.
[19] S. K. Card, G. G. Robertson, and J. D. Mackinlay. The informationvisualizer, an information workspace. In Proc. CHI, pp. 181–186, 1991.
[20] E. Chi. A taxonomy of visualization techniques using the data statereference model. In Proc. InfoVis, pp. 69–75, 2000.
[21] E. Chi and J. Riedl. An operator interaction framework for visualizationsystems. In Proc. InfoVis, pp. 63–70, 1998.
[22] M. Chuah and S. Roth. On the semantics of interactive visualizations. InProc. InfoVis, pp. 29–36, 1996.
[23] A. Cockburn, C. Gutwin, J. Scarr, and S. Malacria. Supporting novice toexpert transitions in user interfaces. Comput Surv, 47(2):1–36, 2014.
[24] J. Cohen. A coefficient of agreement for nominal scales. Educ. Psychol.Meas., 20(1):37–46, 1960.
[25] K. A. Cook and J. J. Thomas. Illuminating the Path: The Research andDevelopment Agenda for Visual Analytics. IEEE Press, 2005.
[26] M. Correll. Ethical dimensions of visualization research. In Proc. CHI,pp. 188:1–188:13, 2018.
[27] M. Correll. What does ”visualization literacy” mean, anyway? - MultipleViews: visualization research explained, 2018.
[28] C. Daassi, L. Nigay, and M.-C. Fauvet. A taxonomy of temporal datavisualization techniques. I3, 5(3):41–63, 2005.
[29] E. Dimara, G. Bailly, A. Bezerianos, and S. Franconeri. Mitigating theattraction effect with visualizations. TVCG, 25(1):850–860, 2019.
[30] E. Dimara, S. Franconeri, C. Plaisant, A. Bezerianos, and P. Dragicevic.A task-based taxonomy of cognitive biases for information visualization.TVCG, 2019.
[31] A. Dix. Designing for appropriation. In Proc. BCS-HCI, pp. 27–30,2007.
[32] A. Dix and G. Ellis. Starting simple : Adding value to static visualisationthrough simple interaction. In Proc. AVI, pp. 124 – 134, 1998.
[33] J. Donath, A. Dragulescu, A. Zinman, F. Viegas, and R. Xiong. Dataportraits. In SIGGRAPH Art Gallery, pp. 375–383, 2010.
[34] P. Dourish. Where the action is: the foundations of embodied interaction.
MIT Press, 2004.[35] A. Ebert, G. Veer, G. Domik, N. D. Gershon, and I. Scheler, eds. Building
Bridges: HCI, visualization, and non-formal modeling. Springer, 2014.[36] N. Elmqvist, A. V. Moere, H.-C. Jetter, D. Cernea, H. Reiterer, and
T. Jankun-Kelly. Fluid interaction for information visualization. Inf. Vis.,10(4):327–340, 2011.
[37] A. Endert, P. Fiaux, and C. North. Semantic interaction for visual textanalytics. In Proc. CHI, pp. 473–482, 2012.
[38] J.-D. Fekete. Advanced interaction for information visualization. In Proc.PacificVis, 2010.
[39] A. Figueiras. Towards the understanding of interaction in informationvisualization. In Proc. IV, pp. 140–147, 2015.
[40] P. M. Fitts. The information capacity of the human motor system incontrolling the amplitude of movement. J. Exp. Psychol., 47(6):381–391,1954.
[41] J. L. Fleiss, B. Levin, and M. C. Paik. Statistical methods for rates andproportions. John Wiley & Sons, 2003.
[42] E. Friess. Personas and decision making in the design process. In Proc.CHI, pp. 1209–1218, 2012.
[43] J. J. Gibson. The theory of affordances. Hilldale, USA, 1:2, 1977.[44] G. Gigerenzer and R. Selten. Bounded rationality: The adaptive toolbox.
MIT press, 2002.[45] D. Gotz and M. X. Zhou. Characterizing users’ visual analytic activity
for insight provenance. Inf. Vis., 8(1):42–55, 2009.[46] M. J. Grant and A. Booth. A typology of reviews: an analysis of 14 review
types and associated methodologies. Health Info Libr J, 26(2):91–108,2009.
[47] H. Guo, S. R. Gomez, C. Ziemkiewicz, and D. H. Laidlaw. A case studyusing visualization interaction logs and insight metrics to understand howanalysts arrive at insights. TVCG, 22(1):51–60, 2016.
[48] R. B. Haber and D. A. Mcnabb. Visualization idioms: A conceptualmodel for scientific visualization systems. VISC, pp. 74–93, 1990.
[49] N. Halloran. The Fallen of World War II. http://www.fallen.io/ww2/.[50] Y. Han, G. D. Abowd, and J. Stasko. Flexible organization, exploration,
and analysis of visualization application interaction events using visualanalytics. In Proc. VIS Workshop, 2016.
[51] L. Harrison, W. Dou, A. Lu, W. Ribarsky, and X. Wang. Analysts aren’tmachines: Inferring frustration through visualization interaction. In Proc.VAST, pp. 279–280, 2011.
[52] M. Hassenzahl and N. Tractinsky. User experience - a research agenda.B&IT, 25(2):91–97, 2006.
[53] C. Healey, S. Kocherlakota, V. Rao, R. Mehta, and R. St. Amant. Vi-sual perception and mixed-initiative interaction for assisted visualizationdesign. TVCG, 14(2):396–411, 2008.
[54] J. Heer and B. Shneiderman. Interactive dynamics for visual analysis.Comm. of the ACM, 55(4):1–26, 2012.
[55] J. Heer, F. B. Viegas, and M. Wattenberg. Voyagers and voyeurs: sup-porting asynchronous collaborative information visualization. In Proc.CHI, pp. 1029–1038, 2007.
[56] K. Hornbaek and A. Oulasvirta. What is interaction? In Proc. CHI, pp.5040–5052, 2017.
[57] D. Huang, M. Tory, B. Adriel Aseniero, L. Bartram, S. Bateman,S. Carpendale, A. Tang, and R. Woodbury. Personal visualization andpersonal visual analytics. TVCG, 21(3):420–433, 2015.
[58] Y. Hung and P. Parsons. Assessing User Engagement in InformationVisualization. In Proc. CHI EA, pp. 1708–1717, 2017.
[59] S. Huron, S. Carpendale, A. Thudt, A. Tang, and M. Mauerer. Construc-tive visualization. In Proc. DIS, pp. 433–442, 2014.
[60] R. J. Jagacinski and J. M. Flach. Control theory for humans: quantitativeapproaches to modeling performance. CRC Press, 2003.
[61] L.-E. Janlert and E. Stolterman. The meaning of interactivity-some pro-posals for definitions and measures. Hum.-Comput. Interact., 32(3):103–138, 2017.
[62] Y. Jansen and P. Dragicevic. An interaction model for visualizationsbeyond the desktop. TVCG, 19(12):2396–2405, 2013.
[63] Y. Jansen, P. Dragicevic, P. Isenberg, J. Alexander, A. Karnik, J. Kildal,S. Subramanian, and K. Hornbæk. Opportunities and challenges for dataphysicalization. In Proc. CHI, pp. 3227–3236, 2015.
[64] W. Javed and N. Elmqvist. Stack zooming for multi-focus interaction intime-series data visualization. In Proc. PacificVis, pp. 33–40, 2010.
[65] D. Keefe. Integrating visualization and interaction research to improvescientific workflows. CG&A, 30(2):8–13, 2010.
[66] D. Keefe and T. Isenberg. Reimagining the scientific visualization inter-

action paradigm. Computer, 46(5):51–57, 2013.[67] M. Keehner, M. Hegarty, C. Cohen, P. Khooshabeh, and D. Montello.
Spatial reasoning with external visualizations: What matters is what yousee, not whether you interact. Cognitive Science, 32(7):1099–1132, 2008.
[68] D. Keim. Information visualization and visual data mining. TVCG,8(1):1–8, 2002.
[69] N. W. Kim, E. Schweickart, Z. Liu, M. Dontcheva, W. Li, J. Popovic,and H. Pfister. Data-driven guides: supporting expressive design forinformation graphics. TVCG, 23(1):491–500, 2017.
[70] R. Kosara, H. Hauser, and D. L. Gresh. An interaction view on informa-tion visualization. In Proc. Eurographics, pp. 123–137, 2003.
[71] G. Kurtenbach and W. Buxton. The limits of expert performance usinghierarchic marking menus. In Proc. CHI, pp. 482–487, 1993.
[72] H. Lam. A framework of interaction costs in information visualization.TVCG, 14(6):1149–1156, 2008.
[73] M. Le Goc, C. Perin, S. Follmer, J.-D. Fekete, and P. Dragicevic.Dynamic composite data physicalization using wheeled micro-robots.TVCG, 25(1):737–747, 2019.
[74] B. Lee, P. Isenberg, N. H. Riche, and S. Carpendale. Beyond mouse andkeyboard: expanding design considerations for information visualizationinteractions. TVCG, 18(12):2689–2698, 2012.
[75] B. Lee, R. H. Kazi, and G. Smith. SketchStory: Telling more engagingstories with data through freeform sketching. TVCG, 19(12):2416–2425,2013.
[76] H.-N. Liang, P. C. Parsons, and H.-C. Wu. An exploratory study ofinteractivity in visualization tools. JILR, 21(1):5–45, 2010.
[77] Lingyun Yu, P. Svetachov, P. Isenberg, M. H. Everts, and T. Isenberg.FI3D: Direct-touch interaction for the exploration of 3D scientific visual-ization spaces. TVCG, 16(6):1613–1622, 2010.
[78] W. Liu, R. L. D’Oliveira, M. Beaudouin-Lafon, and O. Rioul. BIG-nav:Bayesian information gain for guiding multiscale navigation. InProc. CHI, pp. 5869–5880, 2017.
[79] Z. Liu and J. T. Stasko. Mental models, visual reasoning and interactionin information visualization: A top-down perspective. TVCG, 16(6):999–1008, 2010.
[80] N. Mahyar and M. Tory. Supporting communication and coordination incollaborative sensemaking. TVCG, 20(12):1633–1642, 2014.
[81] N. Marsden and M. Probster. Personas and Identity. In Proc. CHI, pp.1–14. New York, New York, USA, 2019.
[82] N. Mccurdy, J. Gerdes, and M. Meyer. A framework for externalizingimplicit error using visualization. TVCG, 25(1):925–935, 2019.
[83] T. Munzner. A nested model for visualization design and validation.TVCG, 15(6):921–928, 2009.
[84] M. Nafari and C. Weaver. Query2Question: Translating visualizationinteraction into natural language. TVCG, 21(6):756–769, 2015.
[85] D. Norman. User centered system design. CRC Press, 1986.[86] D. Norman. Designing interaction. chap. Cognitive artifacts, pp. 17–38.
1991.[87] D. Norman. The design of every day things. Basic Books, 2013.[88] B. J. Oates. Researching information systems and computing. Sage,
2005.[89] N. Oxman. Variable property rapid prototyping. Virtual Phys. Prototyp.,
6(1):3–31, 2011.[90] G. Palmas, M. Bachynskyi, A. Oulasvirta, H.-P. Seidel, and T. Weinkauf.
MovExp: A versatile visualization tool for human-computer interac-tion studies with 3D performance and biomechanical data. TVCG,20(12):2359–2368, 2014.
[91] B. Patnaik, A. Batch, and N. Elmqvist. Information olfactation: Harness-ing scent to convey data. TVCG, 25(1):726–736, 2019.
[92] W. A. Pike, J. Stasko, R. Chang, and T. A. O’Connell. The science ofinteraction. Inf. Vis., 8(4):263–274, 2009.
[93] P. Pirolli and S. Card. Information foraging. Psychol. Rev., 106(4):643–675, 1999.
[94] H. Pohl and R. Murray-Smith. Focused and casual interactions. In Proc.CHI, p. 2223, 2013.
[95] M. Pohl, S. Wiltner, and S. Miksch. Exploring information visualization:describing different interaction patterns. In Proc. BELIV, pp. 16–23,2010.
[96] Z. Pousman, J. Stasko, and M. Mateas. Casual information visualization:Depictions of data in everyday life. TVCG, 13(6):1145–1152, 2007.
[97] L. Ren, J. Cui, Y. Du, and G. Dai. Multilevel interaction model forhierarchical tasks in information visualization. In Proc. VINCI, pp. 11–16, 2013.
[98] R. E. Roth. Cartographic interaction primitives: Framework and synthesis.Cartogr. J., 49(4):376–395, 2012.
[99] R. E. Roth. An empirically-derived taxonomy of interaction primitives forinteractive cartography and geovisualization. TVCG, 19(12):2356–2365,2013.
[100] B. Saket, H. Kim, E. T. Brown, and A. Endert. Visualization by demon-stration: An interaction paradigm for visual data exploration. TVCG,23(1):331–340, 2017.
[101] B. Saket, A. Srinivasan, E. D. Ragan, and A. Endert. Evaluating interac-tive graphical encodings for data visualization. TVCG, 24(3):1316–1330,2018.
[102] A. Satyanarayan, K. Wongsuphasawat, and J. Heer. Declarative interac-tion design for data visualization. In Proc. UIST, pp. 669–678, 2014.
[103] H.-J. Schulz, T. Nocke, M. Heitzler, and H. Schumann. A design spaceof visualization tasks. TVCG, 19(12):2366–2375, 2013.
[104] K. Sedig and P. Parsons. Interaction design for complex cognitive ac-tivities with visual representations: a pattern-based approach. Trans.Hum.-Comput. Interact., 5(2):84–133, 2013.
[105] K. Sedig, P. Parsons, M. Dittmer, and R. Haworth. Human-Centered Inter-activity of Visualization Tools: Micro- and Macro-level Considerations.Springer, 2014.
[106] B. Shneiderman. The eyes have it: a task by data type taxonomy forinformation visualizations. In Proc. VL, pp. 336–343, 1996.
[107] B. Shneiderman. Promoting universal usability with multi-layer interfacedesign. Comput. Phys. Handicap., (73-74):1–8, 2002.
[108] H. A. Simon. Models of man. Wiley, 1957.[109] M. Spindler, C. Tominski, H. Schumann, and R. Dachselt. Tangible
views for information visualization. In Proc. ITS, pp. 157–166, 2010.[110] G. Teubner. Rights of non-humans? Electronic agents and animals as
new actors in politics and law. J. Law Soc., 33(4):497–521, 2006.[111] A. Thudt, D. Baur, S. Huron, and S. Carpendale. Visual mementos:
Reflecting memories with personal data. TVCG, 22(1):369–378, 2016.[112] C. Tominski. Interaction for visualization. Morgan & Claypool, 2015.[113] J. Tost and F. Heidmann. Visualization and interaction with multiple
devices. A case study on reachability of remote areas for emergencymanagement. i-com, 16(3):223–246, 2017.
[114] E. R. Tufte. The visual display of quantitative information. GraphicsPress, 1983.
[115] J. van Wijk. Views on Visualization. TVCG, 12(4):421–432, 2006.[116] F. B. Viegas, M. Wattenberg, F. van Ham, J. Kriss, and M. McKeon.
ManyEyes: a site for visualization at internet scale. TVCG, 13(6):1121–1128, 2007.
[117] J. Walny, S. Huron, C. Perin, T. Wun, R. Pusch, and S. Carpendale.Active reading of visualizations. TVCG, 24(1):770–780, 2018.
[118] X. Wang, D. H. Jeong, W. Dou, S.-w. Lee, W. Ribarsky, and R. Chang.Defining and applying knowledge conversion processes to a visual ana-lytics system. Computers & Graphics, 33(5):616–623, 2009.
[119] Y. Wang, H. Zhang, H. Huang, X. Chen, Q. Yin, Z. Hou, D. Zhang,Q. Luo, and H. Qu. InfoNice: Easy creation of information graphics. InProc. CHI, pp. 335:1–335:12, 2018.
[120] M. Ward and J. Yang. Interaction spaces in data and information visual-ization. In Proc. Eurographics, vol. 22, pp. 37–145, 2004.
[121] W. Willett, Y. Jansen, and P. Dragicevic. Embedded data representations.TVCG, 23(1):461–470, 2017.
[122] C. Williamson and B. Shneiderman. The dynamic HomeFinder. In Proc.SIGIR, pp. 338–346, 1992.
[123] M. Wybrow, N. Elmqvist, J.-D. Fekete, T. von Landesberger, J. J. vanWijk, and B. Zimmer. Interaction in the visualization of multivariatenetworks. In LNCS, vol. 8380, pp. 97–125. 2014.
[124] H. Xia, N. Henry Riche, F. Chevalier, B. De Araujo, and D. Wigdor.Dataink: Direct and creative data-oriented drawing. In Proc. CHI, pp.223:1–223:13, 2018.
[125] A. Yelizarov and D. Gamayunov. Adaptive visualization interface thatmanages user’s cognitive load based on interaction characteristics. InProc. VINCI, pp. 1:1–1:8, 2014.
[126] J. S. Yi, Y. ah Kang, and J. Stasko. Toward a deeper understanding of therole of interaction in information visualization. TVCG, 13(6):1224–1231,2007.
[127] J. S. Yi, R. Melton, J. Stasko, and J. A. Jacko. Dust&magnet: Multivariateinformation visualization using a magnet metaphor. Inf. Vis., 4(4):239–256, 2005.