


What if there is one score to know Social Media performance?
22
What if… there is just one score to know social media performance?
-
Upload
jericho-dignadice -
Category
Social Media
-
view
540 -
download
0
Transcript of What if there is one score to know Social Media performance?

What if… there is just one score to know
social media performance?

Why Holistic?

Why Holistic?• Know what KPI is dragging the overall score down
Why Holistic?• Know what KPI is dragging the overall score down
• It’s not about holistic versus categorical scoring.
In fact, you need KPI categories to determine overall score.
Why Holistic?• Know what KPI is dragging the overall score down
• It’s not about holistic versus categorical scoring.
In fact, you need KPI categories to determine overall score.
• For Executives

Let’s say you have already identified your KPI’s in the social
media world of metrics.
Come on… you know what KPI means.
And assigned them to KPI categories based on the consumer lifecycle approach from Exposure to Advocacy.
Come on… you know what KPI means.

LIKE THESE…
Channel-based model
Metrics-based model

LET’S GET PHYSICAL

LET’S GET PHYSICALMATHEMATICAL
with an example

Variables:
1. Exposure, Owned – Post Reach Frequency
2. Exposure, Earned – Page Likes Frequency
3. Exposure and Engagement, Paid – CTR
4. Engagement, Owned – Page Visits
5. Engagement, Earned – Engagement Frequency (Post Likes, Comments, Shares, Link Clicks)
Data set to compare: Week 1 vs. rest of the month
Problem: What’s my overall Facebook Page Exposure
and Engagement Performance?

2 Easy Steps
1. Get the Z score of each variable listed in the previous slide using the formula below. Translate the z-scores into cumulative percentages. This link will help computing a lot easier - http://easycalculation.com/statistics/z-score-standard.php
2. Assuming each variable has equal importance to your objective, get the average z-score cumulative percentages of each variable with the result being your Social Score.

Exposure, Owned – Organic Post Reach Frequency of Week 1 to compare with the rest of the month
Total Reach of Posts Week 1 (current sample): 8600
Week 2: 2700
Week 3: 3300
Week 4: 10400
Week 5: 10800
Mean: 7160
Standard Deviation: 3892
z score: 0.37
Social score: 65 (as translated to cumulative percentage via
http://clas.sa.ucsb.edu/staff/binh/stdNormalTable.pdf )
Example result of a variable

Now calculate the remaining score of the other variables (Exposure, Earned – Page Likes Frequency,
Engagement, Owned – Page Visits , Engagement, Earned – Engagement Frequency (Post Likes, Comments,
Shares, Link Clicks), CTR and calculate the mean with the end result as your overall social score based on the
channel-based framework.
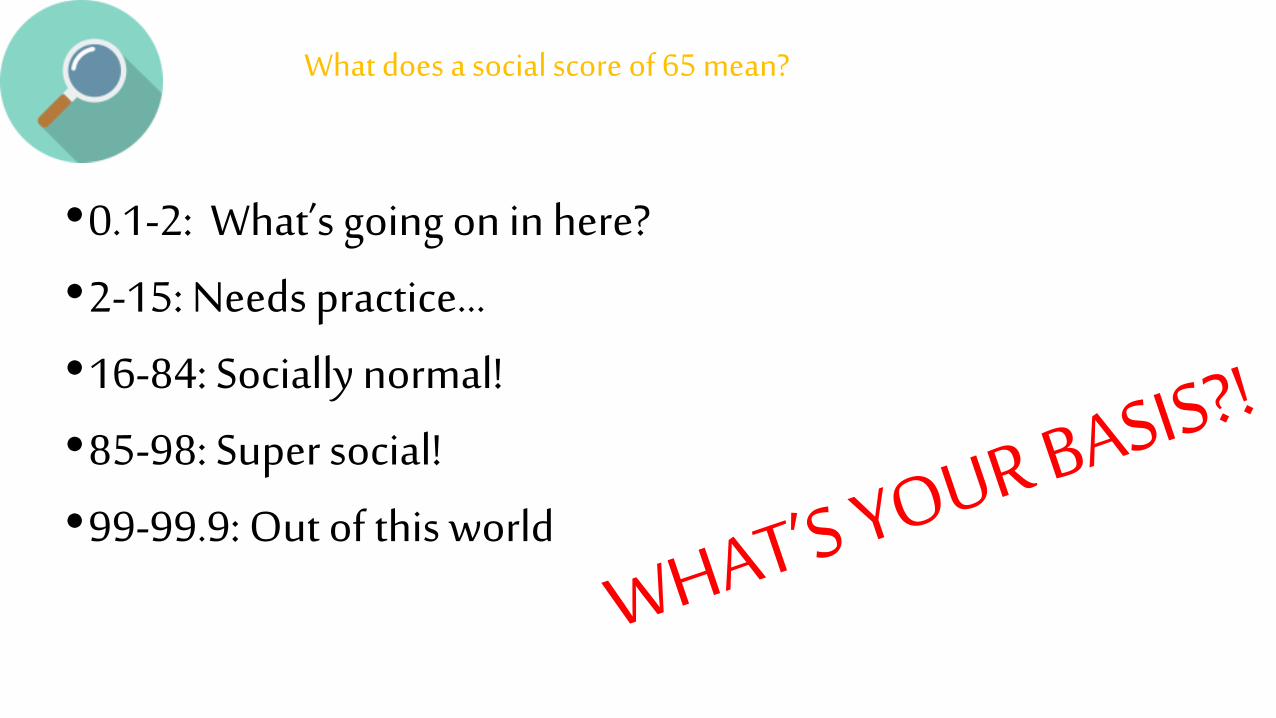
•0.1-2: What’s going on in here?
•2-15: Needs practice…
•16-84: Socially normal!
•85-98: Super social!
•99-99.9: Out of this world
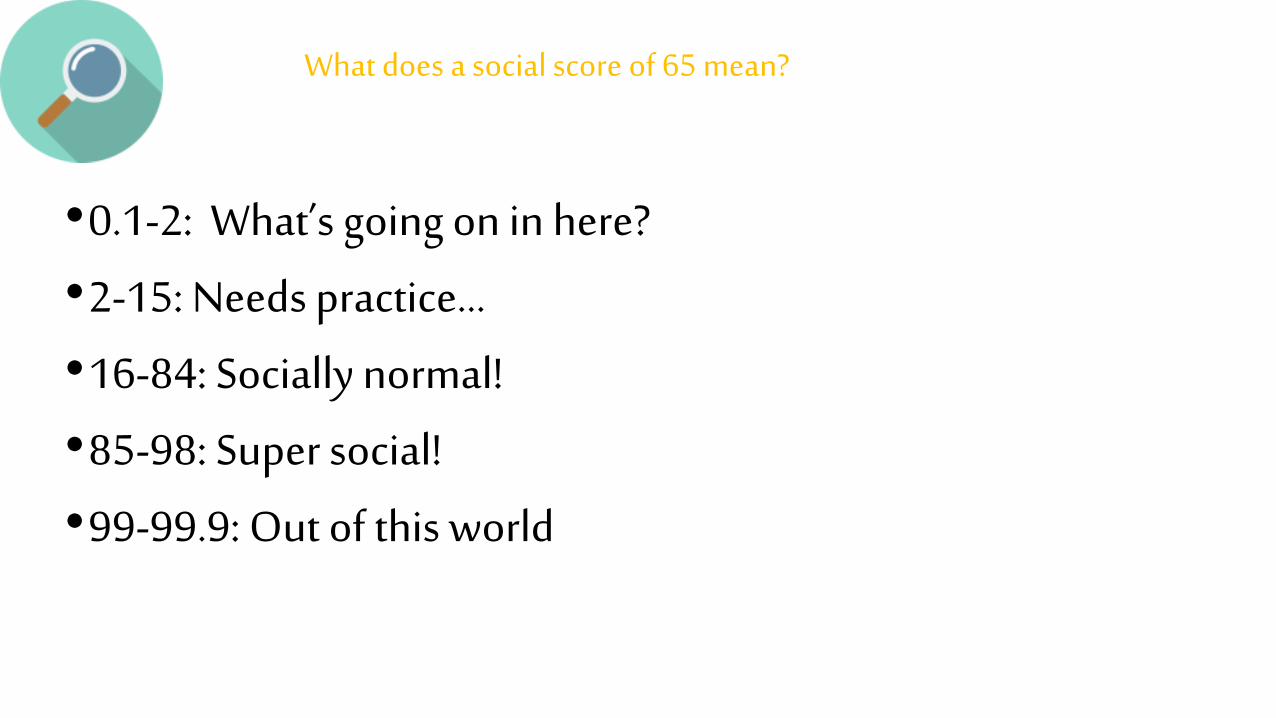
What does a social score of 65 mean?
•0.1-2: What’s going on in here?
•2-15: Needs practice…
•16-84: Socially normal!
•85-98: Super social!
•99-99.9: Out of this world
What does a social score of 65 mean?

IT’S SIMPLE

BUT HEY, DO NOT FORGET
BUT HEY, DO NOT FORGETYou can assign weightage on importance of KPI category

BUT HEY, DO NOT FORGETYou can assign weightage on importance of KPI category
You should have a qualitative review to look at it at a granular level.


