What Hinders Investment in the Aftermath of Financial ... · What Hinders Investment in the...
55
What Hinders Investment in the Aftermath of Financial Crises: Insolvent Firms or Illiquid Banks? * Sebnem Kalemli-Ozcan Department of Economics University of Houston and NBER Houston, TX 77204-5882 United States Herman Kamil Western Hemisphere Department International Monetary Fund Washington DC, 20431 United States Carolina Villegas-Sanchez Department of Economics University of Houston Houston, TX 77204-5882 United States April 2011 Abstract We provide evidence on the real effects of credit supply shocks. By utilizing a new firm-level database from six Latin American countries between 1990 to 2005 and using a differences-in- differences methodology, we empirically test whether bank credit supply shocks affect exporters’ performance holding their creditworthiness constant. We compare investment undertaken by do- mestic exporters to that of foreign-owned exporters, where the latter’s exposure to the liquidity shock in the domestic banking sector is lower. Conditional on changes in firms’ exposure to short term foreign currency debt, we find that foreign-owned exporters increase investment by an amount corresponding to a 5 percent of assets relative to domestic exporters in the aftermath of steep devaluations. This result only holds when the currency crisis occurs simultaneously with a banking crisis, implying that the key factor hindering investment and growth in the aftermath of financial crises is the decline in the supply of credit. JEL Classification: E32, F15, F36, O16 Keywords: foreign ownership, twin crisis, exports, short-term dollar debt, bank lending, growth * Corresponding author: Sebnem Kalemli-Ozcan, email: [email protected], Tel: 713-743-3824, Fax: 713-743- 3798. We thank Hoyt Bleakley, Roberto Chang, Fritz Foley, Mario Crucini, Aimee Chin, Philipp Schnabl and Bent Sorensen for valuable suggestions and the participants of the seminar at Alicante, Bank of Spain, CNMV, 2009 COST Workshop on Firm-Level Data Analysis in Transition and Developing Economies, Dartmouth, ESADE, 10th Jacques Polak IMF Annual Research Conference, 2010 NBER-IFM Spring Meeting, 2010 LACEA Meetings and Valencia for their comments.
Transcript of What Hinders Investment in the Aftermath of Financial ... · What Hinders Investment in the...
What Hinders Investment in the Aftermath of Financial Crises:
Insolvent Firms or Illiquid Banks? ∗
Sebnem Kalemli-OzcanDepartment of Economics
University of Houston and NBERHouston, TX 77204-5882
United States
Herman KamilWestern Hemisphere Department
International Monetary FundWashington DC, 20431
United States
Carolina Villegas-SanchezDepartment of Economics
University of HoustonHouston, TX 77204-5882
United States
April 2011
Abstract
We provide evidence on the real effects of credit supply shocks. By utilizing a new firm-leveldatabase from six Latin American countries between 1990 to 2005 and using a differences-in-differences methodology, we empirically test whether bank credit supply shocks affect exporters’performance holding their creditworthiness constant. We compare investment undertaken by do-mestic exporters to that of foreign-owned exporters, where the latter’s exposure to the liquidityshock in the domestic banking sector is lower. Conditional on changes in firms’ exposure toshort term foreign currency debt, we find that foreign-owned exporters increase investment byan amount corresponding to a 5 percent of assets relative to domestic exporters in the aftermathof steep devaluations. This result only holds when the currency crisis occurs simultaneously witha banking crisis, implying that the key factor hindering investment and growth in the aftermathof financial crises is the decline in the supply of credit.
JEL Classification: E32, F15, F36, O16
Keywords: foreign ownership, twin crisis, exports, short-term dollar debt, bank lending, growth
∗Corresponding author: Sebnem Kalemli-Ozcan, email: [email protected], Tel: 713-743-3824, Fax: 713-743-
3798. We thank Hoyt Bleakley, Roberto Chang, Fritz Foley, Mario Crucini, Aimee Chin, Philipp Schnabl and Bent
Sorensen for valuable suggestions and the participants of the seminar at Alicante, Bank of Spain, CNMV, 2009 COST
Workshop on Firm-Level Data Analysis in Transition and Developing Economies, Dartmouth, ESADE, 10th Jacques
Polak IMF Annual Research Conference, 2010 NBER-IFM Spring Meeting, 2010 LACEA Meetings and Valencia for
their comments.
1 Introduction
How do financial crises turn into real recessions? There are two leading views. The first view
highlights the importance of a troubled banking sector that cuts lending in the face of a negative
liquidity shock (bank lending channel). As argued by Bernanke (1983) if firms cannot smooth out
the liquidity shortage from their banks, this can have large contractionary real effects. Chang and
Velasco (2001) develop a model for a typical emerging market crisis, where deteriorating access to
liquidity is at the center of the problem, hindering investment and growth. During the 2007–2009
global crisis central banks around the world spent hundreds of billions of dollars to rescue their
banking systems in fear of such shortages in lending.
The second view stresses the relevance of firms’ weak balance sheets and the associated decline
in their net worth (balance sheet channel).1 Bernanke and Gertler (1989) show that shocks that
affect net worth can amplify fluctuations. Business downturns deteriorate firms’ net worth, which
increase the cost of borrowing and decrease investment even further (the so-called accelerator
effect). The deterioration of firms’ net worth can be the result of a “maturity mismatch” and/or a
“currency mismatch” in firms’ balance sheets. Maturity mismatch refers to the practice of financing
relatively illiquid long-term assets with short-term debt (e.g. Bernanke, Gertler, and Gilchrist
(1996)). Currency mismatch results from the practice of denominating assets and liabilities in
different currencies and hence exposing the firm to exchange rate fluctuations. Cespedes, Chang
and Velasco (2004) propose a model in which insolvent firms with weak balance sheets cannot
borrow and contract production during depreciations.2 Given the possibility of such balance sheet
effects, central banks have been reluctant to let currencies devalue in response to external shocks,
as shown by Calvo and Reinhart (2002).
Which of these financial constraints is more important for the real economy? Is it the case that
firms cannot borrow due to insolvency or is it the case that banks cannot extend credit given the
credit crunch? Both of these channels may cause firms to decrease investment. Our contribution
in this paper is twofold. First and foremost, we provide systematic evidence on how financial crises
turn into recessions by disentangling these two main sources of financing constraints, bank illiquidity
versus firm insolvency. Second, we provide first-time evidence on substantial real effects of bank
credit supply shocks. Although, there is an extensive empirical literature on the bank lending1Note that the literature also refers to this as the collateral channel since a negative (positive) shock to firms’
collateral (which is part of the balance sheet) causes firms’ borrowing capacity and net worth to go down (up). See
Holmstorm and Tirole (1997).2See also Krugman (1999) and Eichengreen and Hausman (1999).
2
channel that tests the link between shocks to bank capital and the decline in credit provision for
firms, this literature has so far been unsuccessful in providing evidence on the effects of such shocks
on real outcomes.3
The main challenge to identification comes from the necessity of separating the demand for credit
by firms from the supply of credit by banks while conditioning on changes in firms’ creditworthiness
as a result of shocks to their balance sheet. To do so, we utilize the experience of six Latin American
countries that went through a range of crises during 1990–2005. We rest our identification on the
fact that different types of crises—currency versus banking—affect the supply and demand of credit
differentially. During a currency crisis and a twin crisis (which involves both currency and banking
crises) demand for credit by exporters will be relatively higher given the depreciated currency, while
supply for credit will be relatively lower under a twin crisis. Hence, we assume the demand for
credit on the part of exporters goes up under both type of crises while the supply of credit goes
down relatively more under twin crises. The key is to compare the performance of exporters under
currency crises episodes, where there is a positive demand shock on the part of exporters, with the
performance of exporters under a twin crisis. In the latter case, the investment opportunity is still
there but there is also an economy wide credit shortage which is the result of a negative supply
shock to domestic banks. In these twin crisis episodes, prior to the currency crash the banking
system collapses, as shown by Kaminsky and Reinhart (1999) and Reinhart and Rogoff (2010).
We identify from within firm changes and therefore, we must control for the changes in firms’
creditworthiness, if we are to disentangle the financing constraints. Since both types of crises involve
a depreciation of the domestic currency in excess of 25 percent, the creditworthiness of exporters
with foreign currency denominated debt is at stake under both type of crises. Conditioning on
the changes in creditworthiness through holdings of foreign currency debt, we exploit the degree
of foreign ownership of the firm, as a proxy for firm-level liquidity. This strategy allows us to
investigate the differential response of foreign-owned versus domestic exporters to a positive demand
shock—conditioning on their holdings of foreign currency debt—under currency and twin crisis,
where only the latter involves a negative supply shock to the local banking sector.4
3Most of this literature has not focused on real activity. An early exception is the work by Peek and Rosengren
(2000), who investigated using state level data from the U.S., changes in real estate activity in states with large
presence of Japanese banks after the Japan banking crisis. A recent exception is the work by Paravisini, Rappoport,
Schnabl, and Wolfenzon (2011), who investigate the export elasticity of Peruvian firms to the bank credit supply
shock that occurred during the 2007–2009 crisis. See section 2 for a detailed review.4In a recent paper Jimenez , Ongena , Peydro-Alcalde and Saurina (2011) propose an alternative strategy to identify
credit availability based on matched bank-firm level data. They provide evidence that the bank-lending channel is
3
We assume that currency crises, the associated investment opportunity and the increase in
demand for credit are exogenous. We study four episodes of currency crises (Mexico 1995, Argentina
2002, Brazil 1999 and 2002). Two of these episodes were twin crises since they were combined with
a banking crisis (Mexico 1994, Argentina 2001).5 In order to have firm-level measures of insolvency
and liquidity over time, we have hand-collected a unique panel database with annual accounting
information for the whole universe of listed non-financial companies in six Latin American countries,
spanning the period 1990 to 2005. For these 1,300 listed firms, we observe time-varying measures of
the currency denomination and maturity structure of both debt and assets, firm’s export revenue,
and foreign ownership stakes. To our knowledge, the dataset is unique in an emerging market setting
as it contains cross-country, time-varying information on the currency and maturity composition
of firms’ balance sheets, the breakdown of sales into domestic and export revenues, and a precise
measure of foreign ownership.
We define a potentially insolvent firm as one with high leverage and holdings of short-term for-
eign currency denominated debt that are not matched by a dollar denominated stream of income
like dollar assets and/or export revenue. This is based on Allen et al. (2002), who argue that ma-
turity and currency mismatch interact to determine firm’s solvency risk. These firms are obviously
more likely to experience a decline in net worth in the face of a currency crisis. We measure the
liquidity shock, first, at the country-level, by focusing on twin crisis episodes that are characterized
by a general dry up of credit in the year prior to the currency crisis for all firms. Second, we use
different firm-level measures that proxy the relative ease of access to finance, such as bond and
stock issuance abroad. Given that during crises times markets shy away from emerging countries
the former may not be the best measures of access to finance during such times.6 Instead, we
argue that foreign ownership (FDI and portfolio equity investment) is a better measure of access
to finance during financial crises and use it throughout the analysis as our preferred firm-level
measure of access to liquidity. The reason is that foreign firms are likely to have better access
to international markets during crises and/or in the absence of well functioning domestic banks.
Foreign affiliates have the possibility of drawing funds from the parent company through internal
capital-market lending.7
stronger when accounting for unobserved time-varying firm heterogeneity however, their estimation strategy prevents
the study of firm level outcomes and therefore, real effects.5See Table 1 and section 3.4. for a full definition of the crises episodes.6See Reinhart and Reinhart (2010).7Desai, Foley and Forbes (2008) argue that multinational affiliates access parent equity when local firms are most
constrained. Similarly, Antras, Desai and Foley (2009) present evidence that suggests that even during “normal”
times, foreign affiliates increase their reliance on capital flows from the parent company in the presence of weak
4
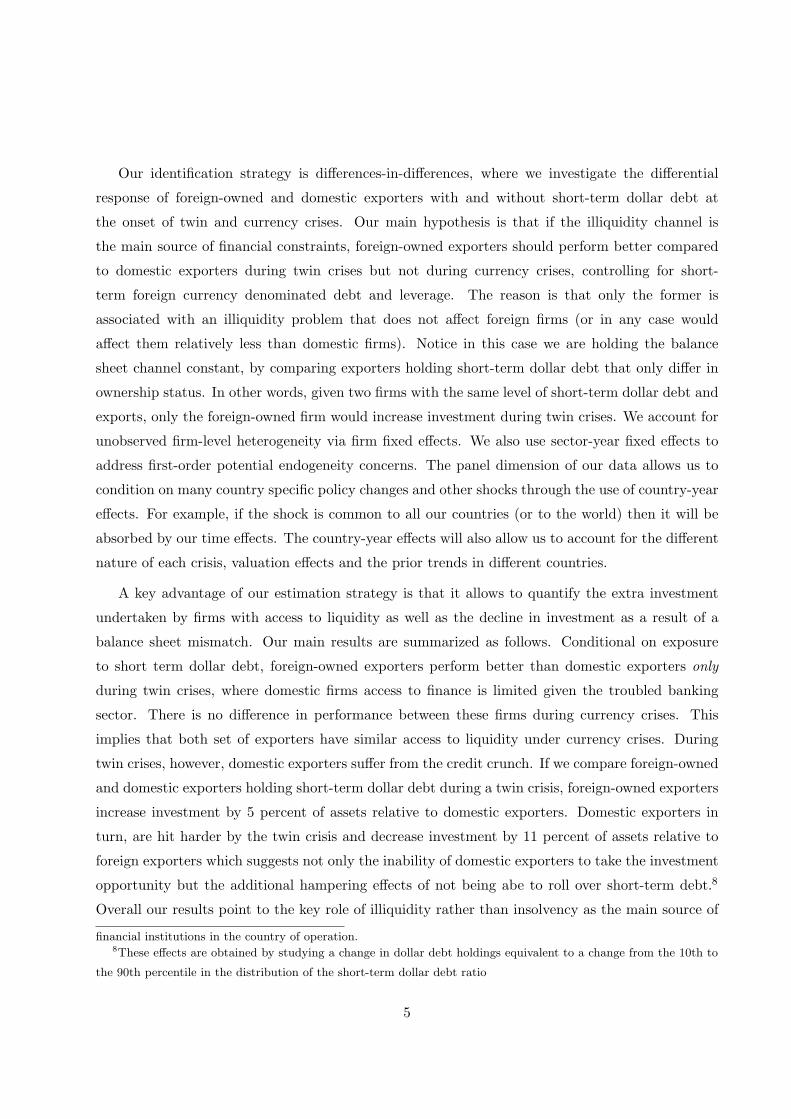
Our identification strategy is differences-in-differences, where we investigate the differential
response of foreign-owned and domestic exporters with and without short-term dollar debt at
the onset of twin and currency crises. Our main hypothesis is that if the illiquidity channel is
the main source of financial constraints, foreign-owned exporters should perform better compared
to domestic exporters during twin crises but not during currency crises, controlling for short-
term foreign currency denominated debt and leverage. The reason is that only the former is
associated with an illiquidity problem that does not affect foreign firms (or in any case would
affect them relatively less than domestic firms). Notice in this case we are holding the balance
sheet channel constant, by comparing exporters holding short-term dollar debt that only differ in
ownership status. In other words, given two firms with the same level of short-term dollar debt and
exports, only the foreign-owned firm would increase investment during twin crises. We account for
unobserved firm-level heterogeneity via firm fixed effects. We also use sector-year fixed effects to
address first-order potential endogeneity concerns. The panel dimension of our data allows us to
condition on many country specific policy changes and other shocks through the use of country-year
effects. For example, if the shock is common to all our countries (or to the world) then it will be
absorbed by our time effects. The country-year effects will also allow us to account for the different
nature of each crisis, valuation effects and the prior trends in different countries.
A key advantage of our estimation strategy is that it allows to quantify the extra investment
undertaken by firms with access to liquidity as well as the decline in investment as a result of a
balance sheet mismatch. Our main results are summarized as follows. Conditional on exposure
to short term dollar debt, foreign-owned exporters perform better than domestic exporters only
during twin crises, where domestic firms access to finance is limited given the troubled banking
sector. There is no difference in performance between these firms during currency crises. This
implies that both set of exporters have similar access to liquidity under currency crises. During
twin crises, however, domestic exporters suffer from the credit crunch. If we compare foreign-owned
and domestic exporters holding short-term dollar debt during a twin crisis, foreign-owned exporters
increase investment by 5 percent of assets relative to domestic exporters. Domestic exporters in
turn, are hit harder by the twin crisis and decrease investment by 11 percent of assets relative to
foreign exporters which suggests not only the inability of domestic exporters to take the investment
opportunity but the additional hampering effects of not being abe to roll over short-term debt.8
Overall our results point to the key role of illiquidity rather than insolvency as the main source of
financial institutions in the country of operation.8These effects are obtained by studying a change in dollar debt holdings equivalent to a change from the 10th to
the 90th percentile in the distribution of the short-term dollar debt ratio
5
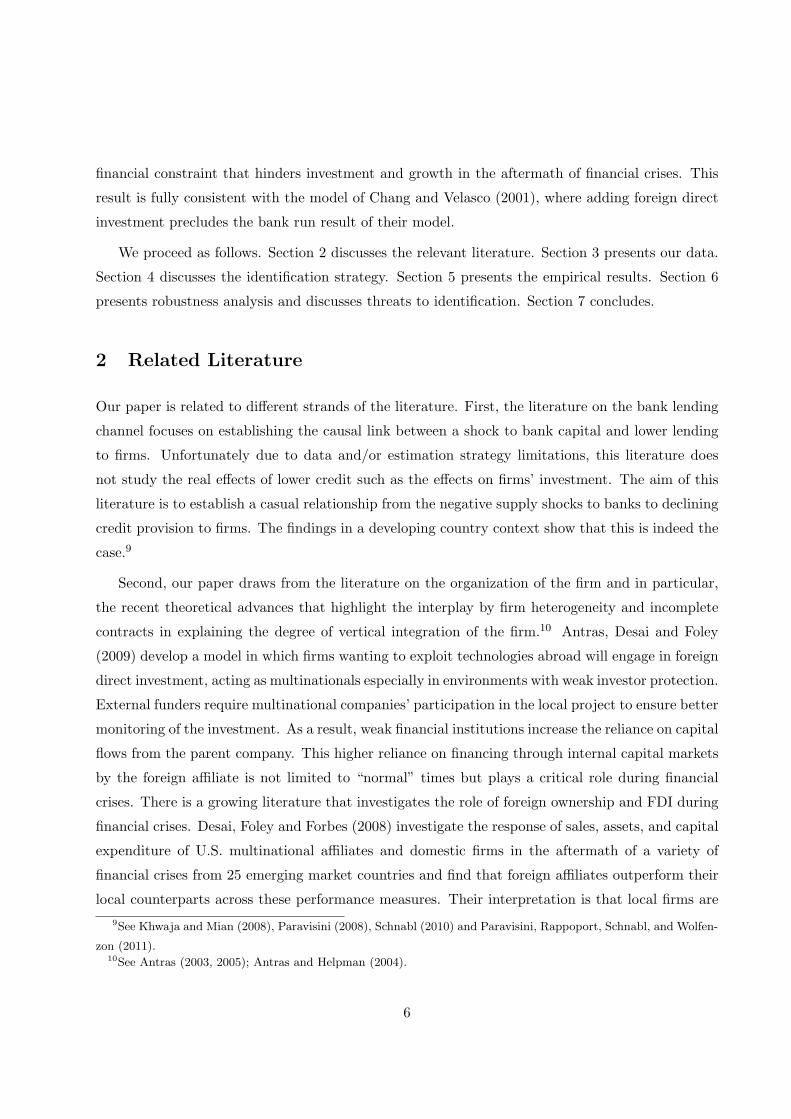
financial constraint that hinders investment and growth in the aftermath of financial crises. This
result is fully consistent with the model of Chang and Velasco (2001), where adding foreign direct
investment precludes the bank run result of their model.
We proceed as follows. Section 2 discusses the relevant literature. Section 3 presents our data.
Section 4 discusses the identification strategy. Section 5 presents the empirical results. Section 6
presents robustness analysis and discusses threats to identification. Section 7 concludes.
2 Related Literature
Our paper is related to different strands of the literature. First, the literature on the bank lending
channel focuses on establishing the causal link between a shock to bank capital and lower lending
to firms. Unfortunately due to data and/or estimation strategy limitations, this literature does
not study the real effects of lower credit such as the effects on firms’ investment. The aim of this
literature is to establish a casual relationship from the negative supply shocks to banks to declining
credit provision to firms. The findings in a developing country context show that this is indeed the
case.9
Second, our paper draws from the literature on the organization of the firm and in particular,
the recent theoretical advances that highlight the interplay by firm heterogeneity and incomplete
contracts in explaining the degree of vertical integration of the firm.10 Antras, Desai and Foley
(2009) develop a model in which firms wanting to exploit technologies abroad will engage in foreign
direct investment, acting as multinationals especially in environments with weak investor protection.
External funders require multinational companies’ participation in the local project to ensure better
monitoring of the investment. As a result, weak financial institutions increase the reliance on capital
flows from the parent company. This higher reliance on financing through internal capital markets
by the foreign affiliate is not limited to “normal” times but plays a critical role during financial
crises. There is a growing literature that investigates the role of foreign ownership and FDI during
financial crises. Desai, Foley and Forbes (2008) investigate the response of sales, assets, and capital
expenditure of U.S. multinational affiliates and domestic firms in the aftermath of a variety of
financial crises from 25 emerging market countries and find that foreign affiliates outperform their
local counterparts across these performance measures. Their interpretation is that local firms are9See Khwaja and Mian (2008), Paravisini (2008), Schnabl (2010) and Paravisini, Rappoport, Schnabl, and Wolfen-
zon (2011).10See Antras (2003, 2005); Antras and Helpman (2004).
6
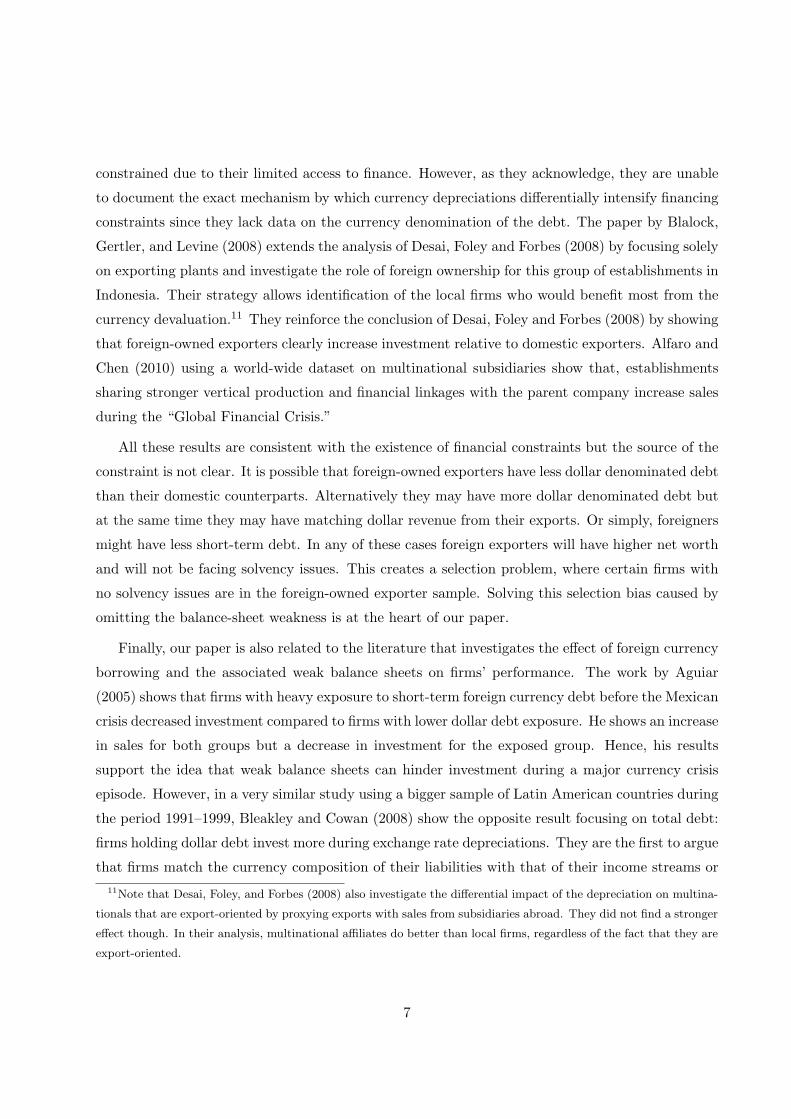
constrained due to their limited access to finance. However, as they acknowledge, they are unable
to document the exact mechanism by which currency depreciations differentially intensify financing
constraints since they lack data on the currency denomination of the debt. The paper by Blalock,
Gertler, and Levine (2008) extends the analysis of Desai, Foley and Forbes (2008) by focusing solely
on exporting plants and investigate the role of foreign ownership for this group of establishments in
Indonesia. Their strategy allows identification of the local firms who would benefit most from the
currency devaluation.11 They reinforce the conclusion of Desai, Foley and Forbes (2008) by showing
that foreign-owned exporters clearly increase investment relative to domestic exporters. Alfaro and
Chen (2010) using a world-wide dataset on multinational subsidiaries show that, establishments
sharing stronger vertical production and financial linkages with the parent company increase sales
during the “Global Financial Crisis.”
All these results are consistent with the existence of financial constraints but the source of the
constraint is not clear. It is possible that foreign-owned exporters have less dollar denominated debt
than their domestic counterparts. Alternatively they may have more dollar denominated debt but
at the same time they may have matching dollar revenue from their exports. Or simply, foreigners
might have less short-term debt. In any of these cases foreign exporters will have higher net worth
and will not be facing solvency issues. This creates a selection problem, where certain firms with
no solvency issues are in the foreign-owned exporter sample. Solving this selection bias caused by
omitting the balance-sheet weakness is at the heart of our paper.
Finally, our paper is also related to the literature that investigates the effect of foreign currency
borrowing and the associated weak balance sheets on firms’ performance. The work by Aguiar
(2005) shows that firms with heavy exposure to short-term foreign currency debt before the Mexican
crisis decreased investment compared to firms with lower dollar debt exposure. He shows an increase
in sales for both groups but a decrease in investment for the exposed group. Hence, his results
support the idea that weak balance sheets can hinder investment during a major currency crisis
episode. However, in a very similar study using a bigger sample of Latin American countries during
the period 1991–1999, Bleakley and Cowan (2008) show the opposite result focusing on total debt:
firms holding dollar debt invest more during exchange rate depreciations. They are the first to argue
that firms match the currency composition of their liabilities with that of their income streams or11Note that Desai, Foley, and Forbes (2008) also investigate the differential impact of the depreciation on multina-
tionals that are export-oriented by proxying exports with sales from subsidiaries abroad. They did not find a stronger
effect though. In their analysis, multinational affiliates do better than local firms, regardless of the fact that they are
export-oriented.
7
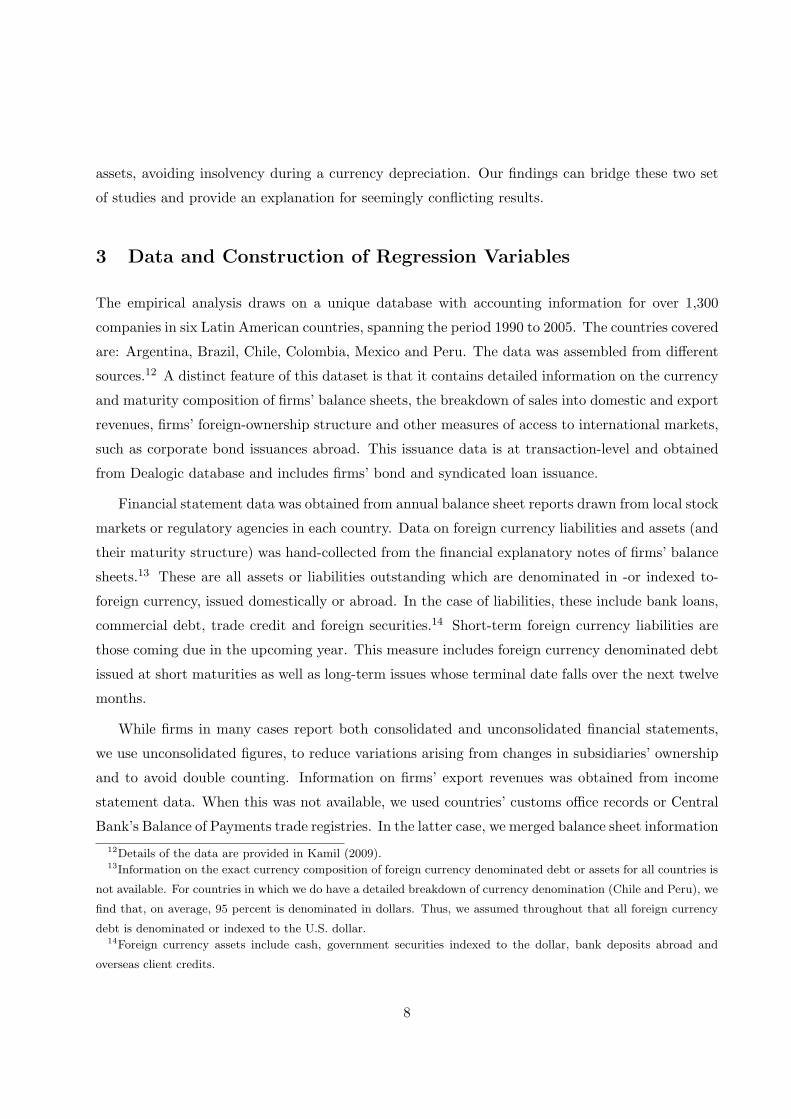
assets, avoiding insolvency during a currency depreciation. Our findings can bridge these two set
of studies and provide an explanation for seemingly conflicting results.
3 Data and Construction of Regression Variables
The empirical analysis draws on a unique database with accounting information for over 1,300
companies in six Latin American countries, spanning the period 1990 to 2005. The countries covered
are: Argentina, Brazil, Chile, Colombia, Mexico and Peru. The data was assembled from different
sources.12 A distinct feature of this dataset is that it contains detailed information on the currency
and maturity composition of firms’ balance sheets, the breakdown of sales into domestic and export
revenues, firms’ foreign-ownership structure and other measures of access to international markets,
such as corporate bond issuances abroad. This issuance data is at transaction-level and obtained
from Dealogic database and includes firms’ bond and syndicated loan issuance.
Financial statement data was obtained from annual balance sheet reports drawn from local stock
markets or regulatory agencies in each country. Data on foreign currency liabilities and assets (and
their maturity structure) was hand-collected from the financial explanatory notes of firms’ balance
sheets.13 These are all assets or liabilities outstanding which are denominated in -or indexed to-
foreign currency, issued domestically or abroad. In the case of liabilities, these include bank loans,
commercial debt, trade credit and foreign securities.14 Short-term foreign currency liabilities are
those coming due in the upcoming year. This measure includes foreign currency denominated debt
issued at short maturities as well as long-term issues whose terminal date falls over the next twelve
months.
While firms in many cases report both consolidated and unconsolidated financial statements,
we use unconsolidated figures, to reduce variations arising from changes in subsidiaries’ ownership
and to avoid double counting. Information on firms’ export revenues was obtained from income
statement data. When this was not available, we used countries’ customs office records or Central
Bank’s Balance of Payments trade registries. In the latter case, we merged balance sheet information12Details of the data are provided in Kamil (2009).13Information on the exact currency composition of foreign currency denominated debt or assets for all countries is
not available. For countries in which we do have a detailed breakdown of currency denomination (Chile and Peru), we
find that, on average, 95 percent is denominated in dollars. Thus, we assumed throughout that all foreign currency
debt is denominated or indexed to the U.S. dollar.14Foreign currency assets include cash, government securities indexed to the dollar, bank deposits abroad and
overseas client credits.
8
with firms’ export sales using their tax code identifier and/or name.
3.1 Sales and Investment
Our main indicators of firm performance are sales and investment in fixed capital. Sales is defined
as gross sales from main operating activities. The measure of investment used in the empirical
analysis is the annual change in the stock of physical capital scaled by total assets to control for the
firm size. This investment to asset ratio is winsorized at the lower and upper 1 percent level at the
country level to control for outliers before it is used in the regression. The stock of physical capital,
in turn, is defined as the sum of property, plant, equipment, plus technical reappraisal (valuation
change), minus cumulated depreciation. We attempt to minimize any exchange rate and valuation
effects by normalizing investment by total assets and including country-year fixed effects, that will
absorb common exchange rate fluctuations and valuation effects. In addition, we try to minimize
the effects of accounting bias in the value of capital stock by estimating the models with firm-level
fixed effects.
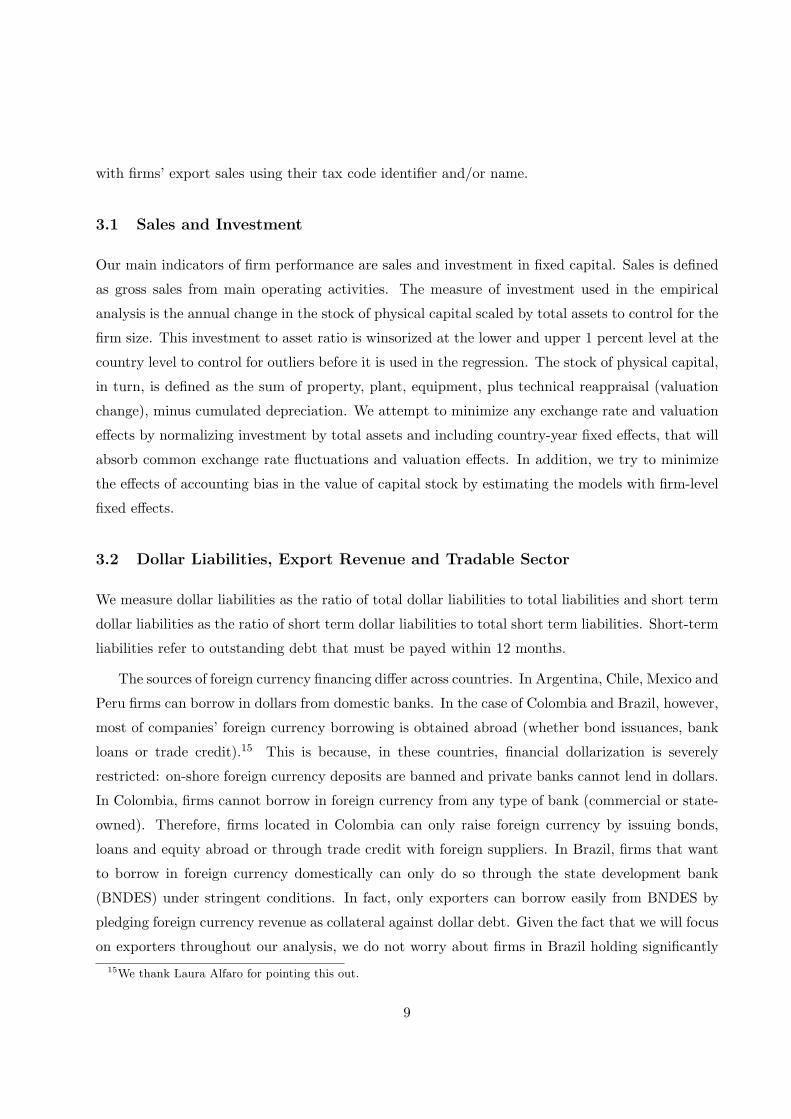
3.2 Dollar Liabilities, Export Revenue and Tradable Sector
We measure dollar liabilities as the ratio of total dollar liabilities to total liabilities and short term
dollar liabilities as the ratio of short term dollar liabilities to total short term liabilities. Short-term
liabilities refer to outstanding debt that must be payed within 12 months.
The sources of foreign currency financing differ across countries. In Argentina, Chile, Mexico and
Peru firms can borrow in dollars from domestic banks. In the case of Colombia and Brazil, however,
most of companies’ foreign currency borrowing is obtained abroad (whether bond issuances, bank
loans or trade credit).15 This is because, in these countries, financial dollarization is severely
restricted: on-shore foreign currency deposits are banned and private banks cannot lend in dollars.
In Colombia, firms cannot borrow in foreign currency from any type of bank (commercial or state-
owned). Therefore, firms located in Colombia can only raise foreign currency by issuing bonds,
loans and equity abroad or through trade credit with foreign suppliers. In Brazil, firms that want
to borrow in foreign currency domestically can only do so through the state development bank
(BNDES) under stringent conditions. In fact, only exporters can borrow easily from BNDES by
pledging foreign currency revenue as collateral against dollar debt. Given the fact that we will focus
on exporters throughout our analysis, we do not worry about firms in Brazil holding significantly15We thank Laura Alfaro for pointing this out.
9
less foreign currency denominated debt than firms in the rest of our five Latin American countries.
As we show later, exporters hold more dollar debt than non-exporters across all our countries.
The firm’s export to sales ratio captures the degree to which a company has some buffer to hedge
dollar debt risk. We also define two exporter dummy variables, one that takes the value of one if the
firm reported export revenue in a given year and zero otherwise. The second one aims to identify
exporters with a high exports to sales ratio, so that it takes the value of one if the firm export
revenue represents more than 10 percent of the sales value and zero otherwise. This is a substantial
improvement over previous studies in the literature that typically used aggregate variables to proxy
for firms’ access to foreign currency (either a binary tradable/non-tradable classification or industry
export shares).
We also define exporting firms based on a predetermined dummy variable. A firm is classified
as exporter if she reported export revenue at any time during the three years prior to the first
crisis.16 In addition, given the severity of the banking crisis in Colombia, exporters in this country
are defined based on whether the firm reported export revenue in 1995, 1996, or 1997 (three years
prior to the banking crisis). Finally, in Peru and Chile where no substantial banking crisis and/or
currency crisis took place during our sample period, predetermined exporters are defined based on
whether firms reported export revenue at any time during the period of analysis.17
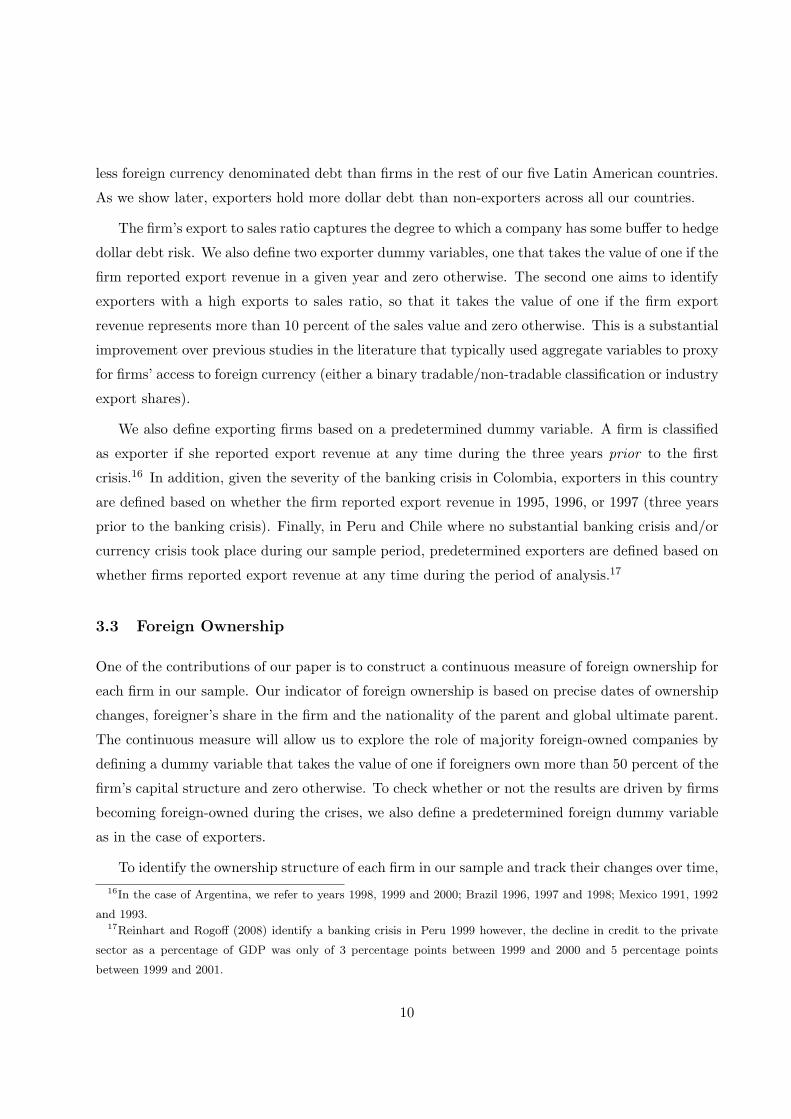
3.3 Foreign Ownership
One of the contributions of our paper is to construct a continuous measure of foreign ownership for
each firm in our sample. Our indicator of foreign ownership is based on precise dates of ownership
changes, foreigner’s share in the firm and the nationality of the parent and global ultimate parent.
The continuous measure will allow us to explore the role of majority foreign-owned companies by
defining a dummy variable that takes the value of one if foreigners own more than 50 percent of the
firm’s capital structure and zero otherwise. To check whether or not the results are driven by firms
becoming foreign-owned during the crises, we also define a predetermined foreign dummy variable
as in the case of exporters.
To identify the ownership structure of each firm in our sample and track their changes over time,16In the case of Argentina, we refer to years 1998, 1999 and 2000; Brazil 1996, 1997 and 1998; Mexico 1991, 1992
and 1993.17Reinhart and Rogoff (2008) identify a banking crisis in Peru 1999 however, the decline in credit to the private
sector as a percentage of GDP was only of 3 percentage points between 1999 and 2000 and 5 percentage points
between 1999 and 2001.
10
we proceed in two steps.18 First, we gathered data on all cross-border Mergers and Acquisitions
(M&A) of Latin-American firms between 1981 to 2005 using the SDC Platinum database from
Thompson (for the period 1981 to 2001) and Zephyr from Bureau Van Dijk (from 1997 to 2005).
We then identified all transactions where the target involved a firm in our sample. Examining
M&As from the 1980s onwards ensures that we capture any change in ownership relationship that
predates the firm’s first appearance in our sample. For each deal, we obtained the date on which
the transaction became effective and characteristics of the target and acquiring firms, in particular,
the nationality of the target and acquiring firm, and that of the acquiror’s ultimate parent.19
The database also includes transaction-specific information on percent of shares acquired and the
percent of shares owned before and after the transaction was completed. In total, we consider
4,406 completed deals that resulted in a change in majority control in a target firm in our sample
as well as acquisitions of minority stakes (some of which involve multiple acquisitions of the same
target). Of the firms in our sample, 28 percent were involved in at least one M&A during the
period. For each firm involved in an M&A, we constructed a continuous, time-varying measure of
foreign ownership based on the percentage fraction of shares held by foreign and domestic investors
in each year.
As a result, the foreign ownership measure can take any value between 0 and 100 and represents
the percentage of capital owned by foreign investors. Figure 1 shows the evolution of average foreign
ownership over time in our sample, in a balanced panel. Many Latin American countries underwent
massive privatization processes during the 90s. Therefore, as expected, foreign ownership has
steadily grown over time. Most of our sampled firms are domestic and hence the distribution of
foreign ownership has a high concentration of firms around zero, where 70 percent of the firms
are domestic, as shown in figure 2.20 Figure 3 shows that among those firms with positive foreign
ownership, 40 percent of the observations are between 85 percent and 100 percent foreign-owned.
Hence foreign investors prefer to have a controlling stake in general. These distributions look similar
by country.18See the data appendix for further details on the construction of the foreign ownership variable.19Note that the foreign-owned acquiror can in principle belong to another Latin American country included in the
sample.20We choose 2000 for being an intermediate year but similar figures are obtained using any other year.
11
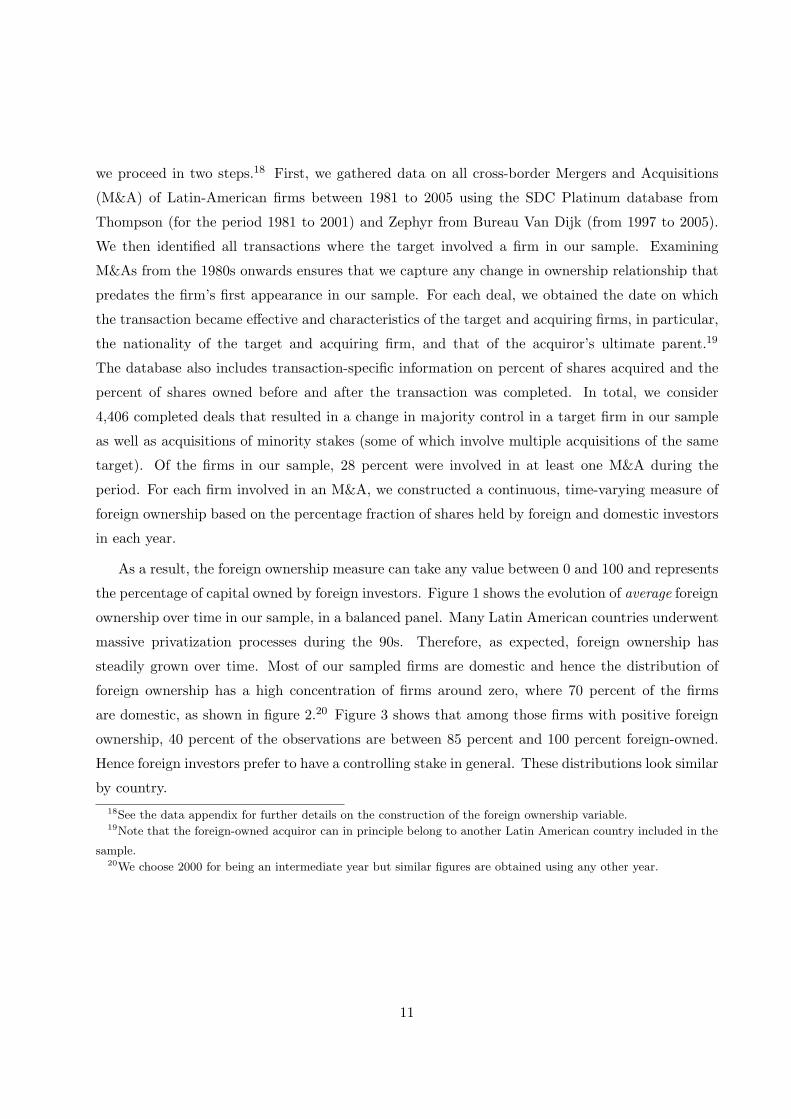
3.4 The Crises Episodes
Table 1 shows the currency crisis and banking crisis episodes for our sample of countries together
with percent changes in macro aggregates before, during and after the crisis episodes. We identify
a currency crisis in a given year if the real exchange rate increased by more than 25 percent with
respect to the previous year. Using data on CPI, the real exchange rates were obtained as the
deflated end-of period exchange rates. We identify four currency crisis episodes in our sample:
Mexico (1995), Brazil (1999), Brazil (2002), and Argentina (2002). Note that Mexico abandoned
the peg in December 1994, Brazil in January 1999 and finally, Argentina in January 2002.21 In
addition, following Reinhart and Rogoff (2008) we identify the following banking crises: Argentina
(1995) and (2001), Brazil (1995), Mexico (1994) and Colombia (1998). Reinhart and Rogoff (2008)
base their classification of banking crises on two types of events. First, they focus on bank runs that
lead to the closure, merging, or takeover by the public sector of one or more financial institutions.
Second, in the absence of bank runs, according to their classification, a banking crisis involves the
closure, merging, takeover, or large-scale government assistance of an important financial institution
(or group of institutions) that marks the start of a string of similar outcomes for other financial
institutions.
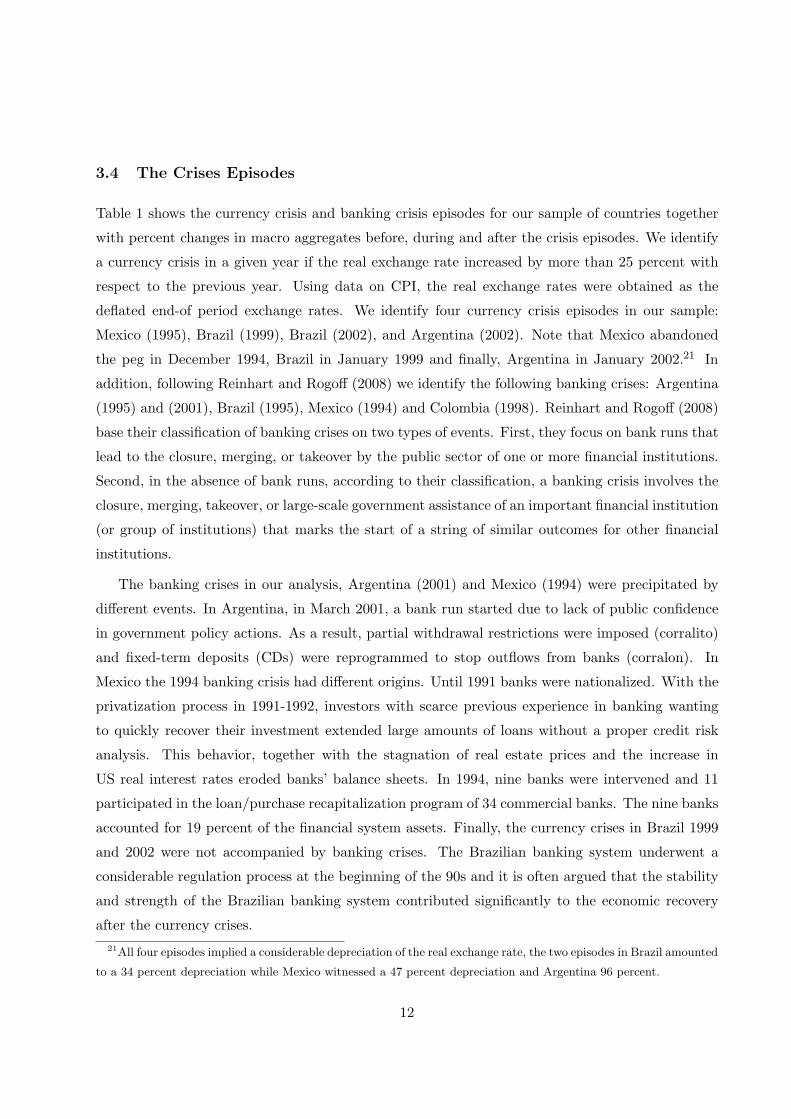
The banking crises in our analysis, Argentina (2001) and Mexico (1994) were precipitated by
different events. In Argentina, in March 2001, a bank run started due to lack of public confidence
in government policy actions. As a result, partial withdrawal restrictions were imposed (corralito)
and fixed-term deposits (CDs) were reprogrammed to stop outflows from banks (corralon). In
Mexico the 1994 banking crisis had different origins. Until 1991 banks were nationalized. With the
privatization process in 1991-1992, investors with scarce previous experience in banking wanting
to quickly recover their investment extended large amounts of loans without a proper credit risk
analysis. This behavior, together with the stagnation of real estate prices and the increase in
US real interest rates eroded banks’ balance sheets. In 1994, nine banks were intervened and 11
participated in the loan/purchase recapitalization program of 34 commercial banks. The nine banks
accounted for 19 percent of the financial system assets. Finally, the currency crises in Brazil 1999
and 2002 were not accompanied by banking crises. The Brazilian banking system underwent a
considerable regulation process at the beginning of the 90s and it is often argued that the stability
and strength of the Brazilian banking system contributed significantly to the economic recovery
after the currency crises.21All four episodes implied a considerable depreciation of the real exchange rate, the two episodes in Brazil amounted
to a 34 percent depreciation while Mexico witnessed a 47 percent depreciation and Argentina 96 percent.
12
In terms of macroeconomic preconditions in these countries at the time of the crisis, with the
exception of Argentina, the other countries were showing similar growth rates of GDP, investment
and trade balance. All these percent changes are averages over two years. During and post crisis
experiences differ from country to country, showing the importance of including country-year effects.
A common feature of recovery in all countries is the increase in investment and exports, during
crisis (which is the crisis year and the year after) leading to a positive growth in the trade balance.
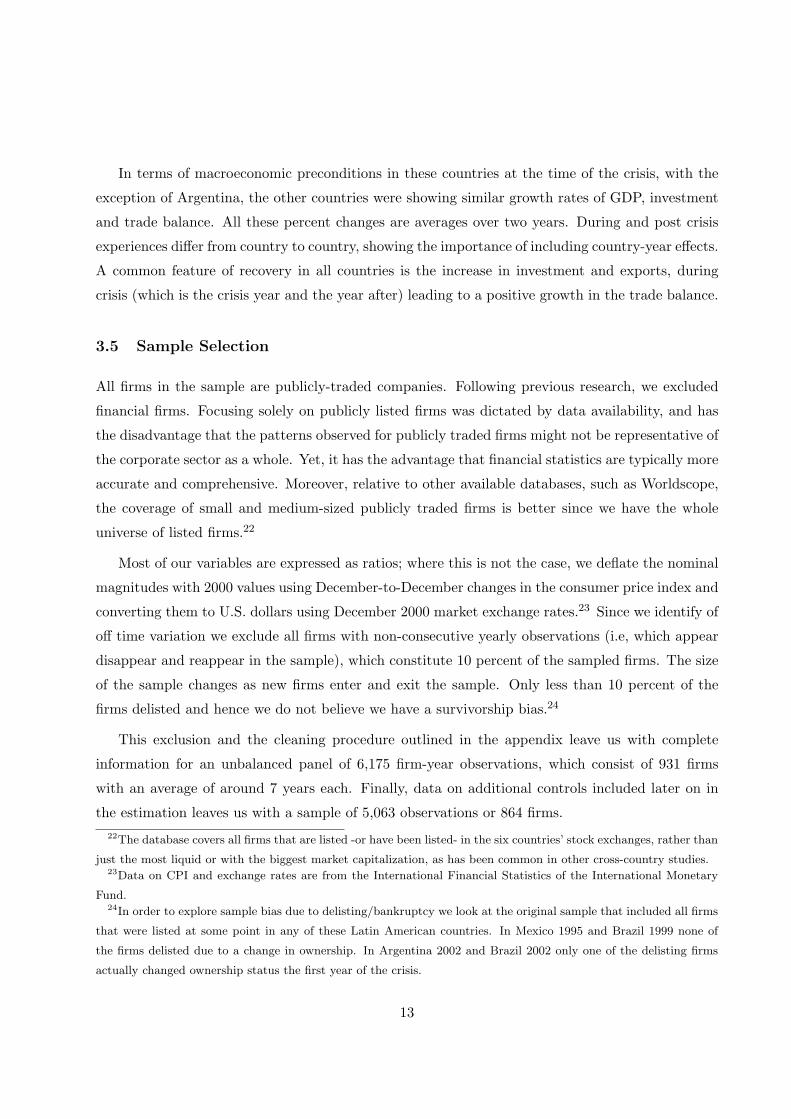
3.5 Sample Selection
All firms in the sample are publicly-traded companies. Following previous research, we excluded
financial firms. Focusing solely on publicly listed firms was dictated by data availability, and has
the disadvantage that the patterns observed for publicly traded firms might not be representative of
the corporate sector as a whole. Yet, it has the advantage that financial statistics are typically more
accurate and comprehensive. Moreover, relative to other available databases, such as Worldscope,
the coverage of small and medium-sized publicly traded firms is better since we have the whole
universe of listed firms.22
Most of our variables are expressed as ratios; where this is not the case, we deflate the nominal
magnitudes with 2000 values using December-to-December changes in the consumer price index and
converting them to U.S. dollars using December 2000 market exchange rates.23 Since we identify of
off time variation we exclude all firms with non-consecutive yearly observations (i.e, which appear
disappear and reappear in the sample), which constitute 10 percent of the sampled firms. The size
of the sample changes as new firms enter and exit the sample. Only less than 10 percent of the
firms delisted and hence we do not believe we have a survivorship bias.24
This exclusion and the cleaning procedure outlined in the appendix leave us with complete
information for an unbalanced panel of 6,175 firm-year observations, which consist of 931 firms
with an average of around 7 years each. Finally, data on additional controls included later on in
the estimation leaves us with a sample of 5,063 observations or 864 firms.22The database covers all firms that are listed -or have been listed- in the six countries’ stock exchanges, rather than
just the most liquid or with the biggest market capitalization, as has been common in other cross-country studies.23Data on CPI and exchange rates are from the International Financial Statistics of the International Monetary
Fund.24In order to explore sample bias due to delisting/bankruptcy we look at the original sample that included all firms
that were listed at some point in any of these Latin American countries. In Mexico 1995 and Brazil 1999 none of
the firms delisted due to a change in ownership. In Argentina 2002 and Brazil 2002 only one of the delisting firms
actually changed ownership status the first year of the crisis.
13
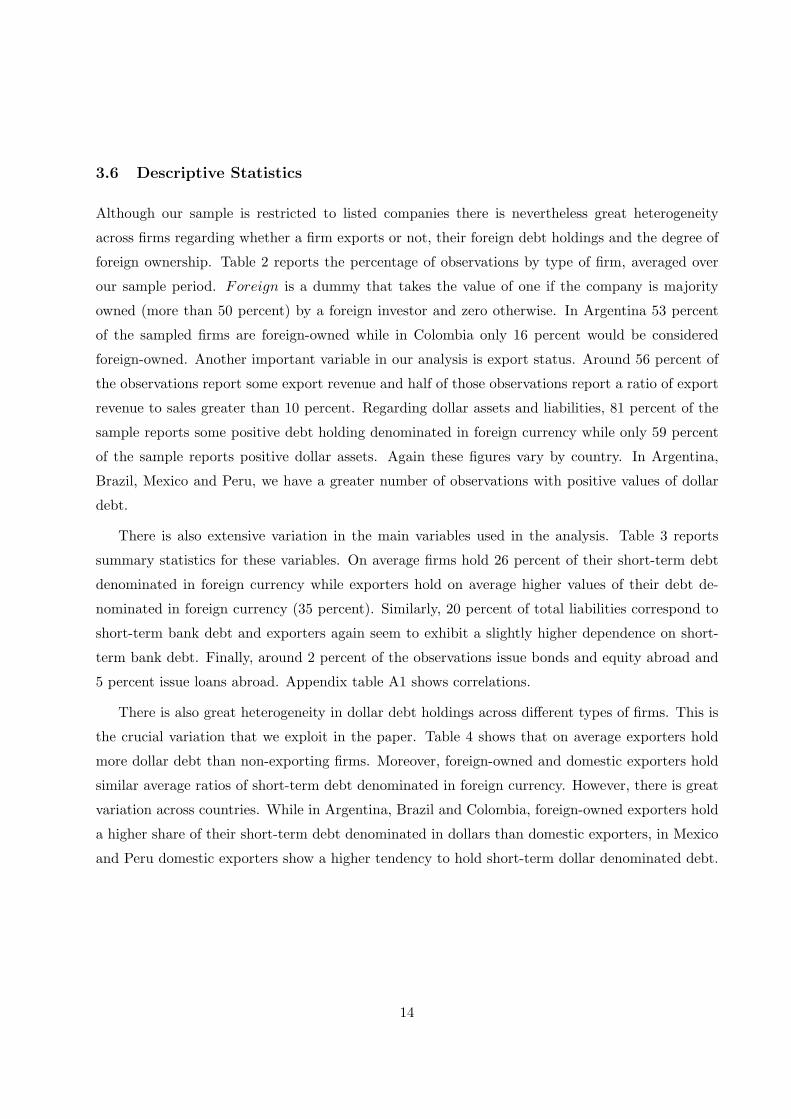
3.6 Descriptive Statistics
Although our sample is restricted to listed companies there is nevertheless great heterogeneity
across firms regarding whether a firm exports or not, their foreign debt holdings and the degree of
foreign ownership. Table 2 reports the percentage of observations by type of firm, averaged over
our sample period. Foreign is a dummy that takes the value of one if the company is majority
owned (more than 50 percent) by a foreign investor and zero otherwise. In Argentina 53 percent
of the sampled firms are foreign-owned while in Colombia only 16 percent would be considered
foreign-owned. Another important variable in our analysis is export status. Around 56 percent of
the observations report some export revenue and half of those observations report a ratio of export
revenue to sales greater than 10 percent. Regarding dollar assets and liabilities, 81 percent of the
sample reports some positive debt holding denominated in foreign currency while only 59 percent
of the sample reports positive dollar assets. Again these figures vary by country. In Argentina,
Brazil, Mexico and Peru, we have a greater number of observations with positive values of dollar
debt.
There is also extensive variation in the main variables used in the analysis. Table 3 reports
summary statistics for these variables. On average firms hold 26 percent of their short-term debt
denominated in foreign currency while exporters hold on average higher values of their debt de-
nominated in foreign currency (35 percent). Similarly, 20 percent of total liabilities correspond to
short-term bank debt and exporters again seem to exhibit a slightly higher dependence on short-
term bank debt. Finally, around 2 percent of the observations issue bonds and equity abroad and
5 percent issue loans abroad. Appendix table A1 shows correlations.
There is also great heterogeneity in dollar debt holdings across different types of firms. This is
the crucial variation that we exploit in the paper. Table 4 shows that on average exporters hold
more dollar debt than non-exporting firms. Moreover, foreign-owned and domestic exporters hold
similar average ratios of short-term debt denominated in foreign currency. However, there is great
variation across countries. While in Argentina, Brazil and Colombia, foreign-owned exporters hold
a higher share of their short-term debt denominated in dollars than domestic exporters, in Mexico
and Peru domestic exporters show a higher tendency to hold short-term dollar denominated debt.
14
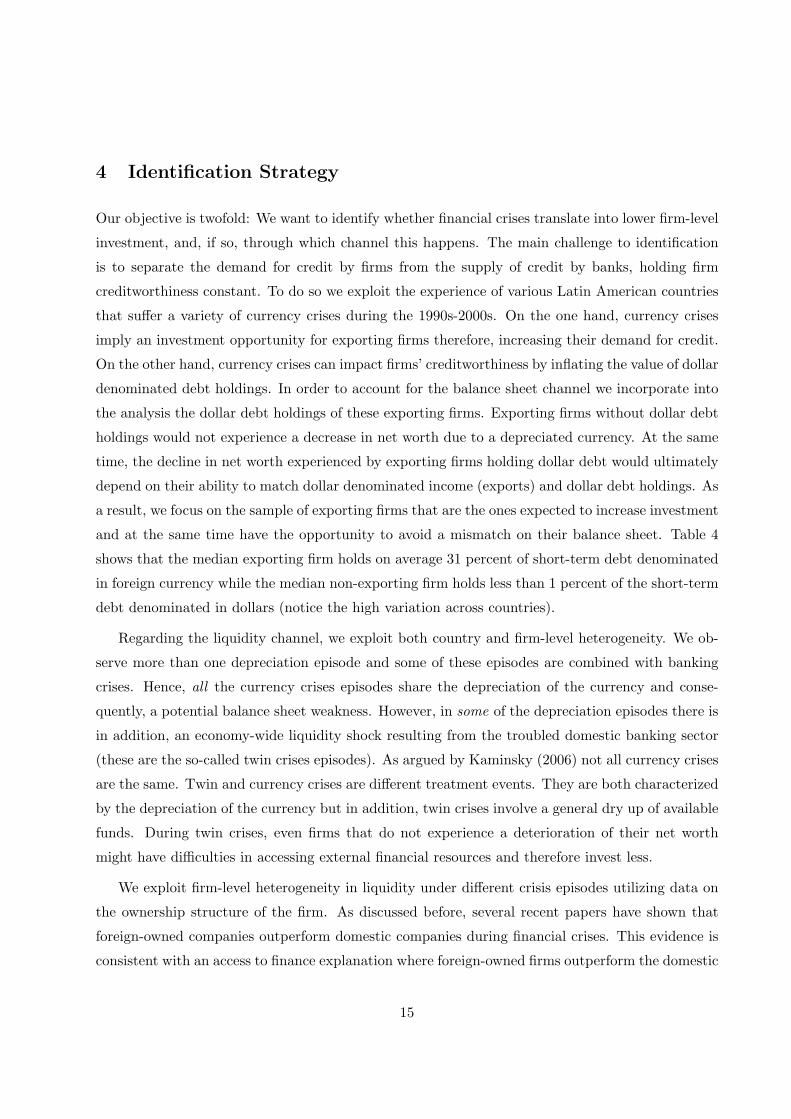
4 Identification Strategy
Our objective is twofold: We want to identify whether financial crises translate into lower firm-level
investment, and, if so, through which channel this happens. The main challenge to identification
is to separate the demand for credit by firms from the supply of credit by banks, holding firm
creditworthiness constant. To do so we exploit the experience of various Latin American countries
that suffer a variety of currency crises during the 1990s-2000s. On the one hand, currency crises
imply an investment opportunity for exporting firms therefore, increasing their demand for credit.
On the other hand, currency crises can impact firms’ creditworthiness by inflating the value of dollar
denominated debt holdings. In order to account for the balance sheet channel we incorporate into
the analysis the dollar debt holdings of these exporting firms. Exporting firms without dollar debt
holdings would not experience a decrease in net worth due to a depreciated currency. At the same
time, the decline in net worth experienced by exporting firms holding dollar debt would ultimately
depend on their ability to match dollar denominated income (exports) and dollar debt holdings. As
a result, we focus on the sample of exporting firms that are the ones expected to increase investment
and at the same time have the opportunity to avoid a mismatch on their balance sheet. Table 4
shows that the median exporting firm holds on average 31 percent of short-term debt denominated
in foreign currency while the median non-exporting firm holds less than 1 percent of the short-term
debt denominated in dollars (notice the high variation across countries).
Regarding the liquidity channel, we exploit both country and firm-level heterogeneity. We ob-
serve more than one depreciation episode and some of these episodes are combined with banking
crises. Hence, all the currency crises episodes share the depreciation of the currency and conse-
quently, a potential balance sheet weakness. However, in some of the depreciation episodes there is
in addition, an economy-wide liquidity shock resulting from the troubled domestic banking sector
(these are the so-called twin crises episodes). As argued by Kaminsky (2006) not all currency crises
are the same. Twin and currency crises are different treatment events. They are both characterized
by the depreciation of the currency but in addition, twin crises involve a general dry up of available
funds. During twin crises, even firms that do not experience a deterioration of their net worth
might have difficulties in accessing external financial resources and therefore invest less.
We exploit firm-level heterogeneity in liquidity under different crisis episodes utilizing data on
the ownership structure of the firm. As discussed before, several recent papers have shown that
foreign-owned companies outperform domestic companies during financial crises. This evidence is
consistent with an access to finance explanation where foreign-owned firms outperform the domestic
15
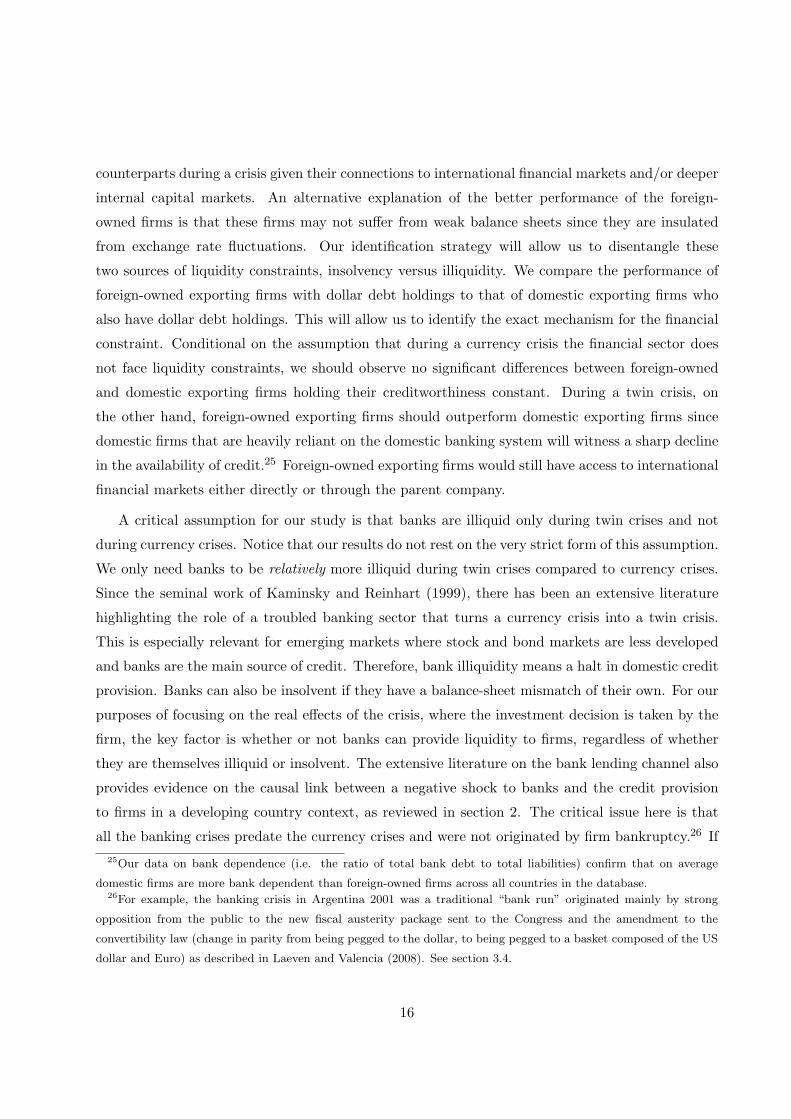
counterparts during a crisis given their connections to international financial markets and/or deeper
internal capital markets. An alternative explanation of the better performance of the foreign-
owned firms is that these firms may not suffer from weak balance sheets since they are insulated
from exchange rate fluctuations. Our identification strategy will allow us to disentangle these
two sources of liquidity constraints, insolvency versus illiquidity. We compare the performance of
foreign-owned exporting firms with dollar debt holdings to that of domestic exporting firms who
also have dollar debt holdings. This will allow us to identify the exact mechanism for the financial
constraint. Conditional on the assumption that during a currency crisis the financial sector does
not face liquidity constraints, we should observe no significant differences between foreign-owned
and domestic exporting firms holding their creditworthiness constant. During a twin crisis, on
the other hand, foreign-owned exporting firms should outperform domestic exporting firms since
domestic firms that are heavily reliant on the domestic banking system will witness a sharp decline
in the availability of credit.25 Foreign-owned exporting firms would still have access to international
financial markets either directly or through the parent company.
A critical assumption for our study is that banks are illiquid only during twin crises and not
during currency crises. Notice that our results do not rest on the very strict form of this assumption.
We only need banks to be relatively more illiquid during twin crises compared to currency crises.
Since the seminal work of Kaminsky and Reinhart (1999), there has been an extensive literature
highlighting the role of a troubled banking sector that turns a currency crisis into a twin crisis.
This is especially relevant for emerging markets where stock and bond markets are less developed
and banks are the main source of credit. Therefore, bank illiquidity means a halt in domestic credit
provision. Banks can also be insolvent if they have a balance-sheet mismatch of their own. For our
purposes of focusing on the real effects of the crisis, where the investment decision is taken by the
firm, the key factor is whether or not banks can provide liquidity to firms, regardless of whether
they are themselves illiquid or insolvent. The extensive literature on the bank lending channel also
provides evidence on the causal link between a negative shock to banks and the credit provision
to firms in a developing country context, as reviewed in section 2. The critical issue here is that
all the banking crises predate the currency crises and were not originated by firm bankruptcy.26 If25Our data on bank dependence (i.e. the ratio of total bank debt to total liabilities) confirm that on average
domestic firms are more bank dependent than foreign-owned firms across all countries in the database.26For example, the banking crisis in Argentina 2001 was a traditional “bank run” originated mainly by strong
opposition from the public to the new fiscal austerity package sent to the Congress and the amendment to the
convertibility law (change in parity from being pegged to the dollar, to being pegged to a basket composed of the US
dollar and Euro) as described in Laeven and Valencia (2008). See section 3.4.
16
banks become insolvent under a currency crisis and halt domestic credit provision as much as in
the case of a twin crisis, then our firm-level access to finance measure –foreign ownership– should
not have differential explanatory power among the types of crisis, i.e., domestic firms should do
worse than foreign-owned firms under both types of crisis.
Figure 4 demonstrates the case in point and shows that in our sample, countries that experienced
a twin crisis witnessed a significant decline in domestic credit provision, whereas this did not happen
in countries that went thorough currency crisis episodes. The top left panel shows domestic credit
to the private sector (as a percent of GDP) in Chile, a country that had no crises during our sample
period. The top right panel shows the case of Colombia, who had a banking crisis in 1998. The
15 percentage point decline in domestic credit is clearly visible. The bottom left panel shows the
case of Mexico where the banking crisis of 1994 is followed by the currency crisis in 1995. Again
domestic credit as percent of GDP dropped sharply, corresponding to a 50 percent decline in credit
provision to the private sector. Finally, the bottom right panel represents Brazil who did not suffer
from a collapse in bank lending during the currency crises of 1999 and 2002.27
For our identification strategy, summarized above, we need to run a triple difference-in-difference
specification that we estimate for the sample of exporting firms:27Notice the beginning of the 90s was a very turbulent period in Brazil. Inflation was rampant with a peak of
82.4 percent in March 1990. A new government designed a stabilization program, Plano Real, aimed to reduced
fiscal deficit and introduced a new currency. During the 1980s, banks acted as intermediaries of the public sector
debt and benefited from high inflation and indexation. To avoid reducing their profits once inflation was brought
down, banks initially expanded credit (mostly through consumer and commercial loans). Although the new currency
brought down inflation, it could not prevent the banking crisis in 1995. The sharp decline in domestic credit to the
private sector is clear from figure 4. The scale of the figure does not show the 15 percentage point decline in credit
from 1995 to 1998 and the subsequent slightly increase from 1998 to 1999. Similarly, prior to the currency crisis of
2002, domestic credit to GDP slightly increased.
17
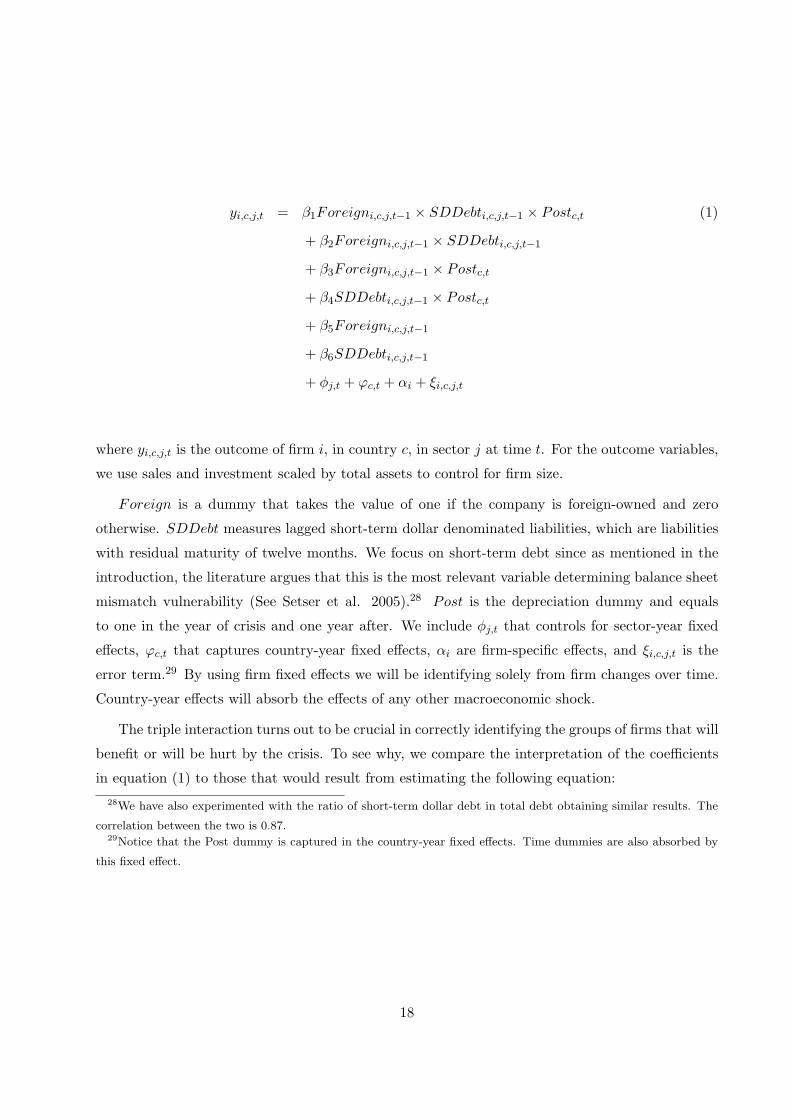
yi,c,j,t = β1Foreigni,c,j,t−1 × SDDebti,c,j,t−1 × Postc,t (1)
+ β2Foreigni,c,j,t−1 × SDDebti,c,j,t−1
+ β3Foreigni,c,j,t−1 × Postc,t
+ β4SDDebti,c,j,t−1 × Postc,t
+ β5Foreigni,c,j,t−1
+ β6SDDebti,c,j,t−1
+ φj,t + ϕc,t + αi + ξi,c,j,t
where yi,c,j,t is the outcome of firm i, in country c, in sector j at time t. For the outcome variables,
we use sales and investment scaled by total assets to control for firm size.
Foreign is a dummy that takes the value of one if the company is foreign-owned and zero
otherwise. SDDebt measures lagged short-term dollar denominated liabilities, which are liabilities
with residual maturity of twelve months. We focus on short-term debt since as mentioned in the
introduction, the literature argues that this is the most relevant variable determining balance sheet
mismatch vulnerability (See Setser et al. 2005).28 Post is the depreciation dummy and equals
to one in the year of crisis and one year after. We include φj,t that controls for sector-year fixed
effects, ϕc,t that captures country-year fixed effects, αi are firm-specific effects, and ξi,c,j,t is the
error term.29 By using firm fixed effects we will be identifying solely from firm changes over time.
Country-year effects will absorb the effects of any other macroeconomic shock.
The triple interaction turns out to be crucial in correctly identifying the groups of firms that will
benefit or will be hurt by the crisis. To see why, we compare the interpretation of the coefficients
in equation (1) to those that would result from estimating the following equation:28We have also experimented with the ratio of short-term dollar debt in total debt obtaining similar results. The
correlation between the two is 0.87.29Notice that the Post dummy is captured in the country-year fixed effects. Time dummies are also absorbed by
this fixed effect.
18
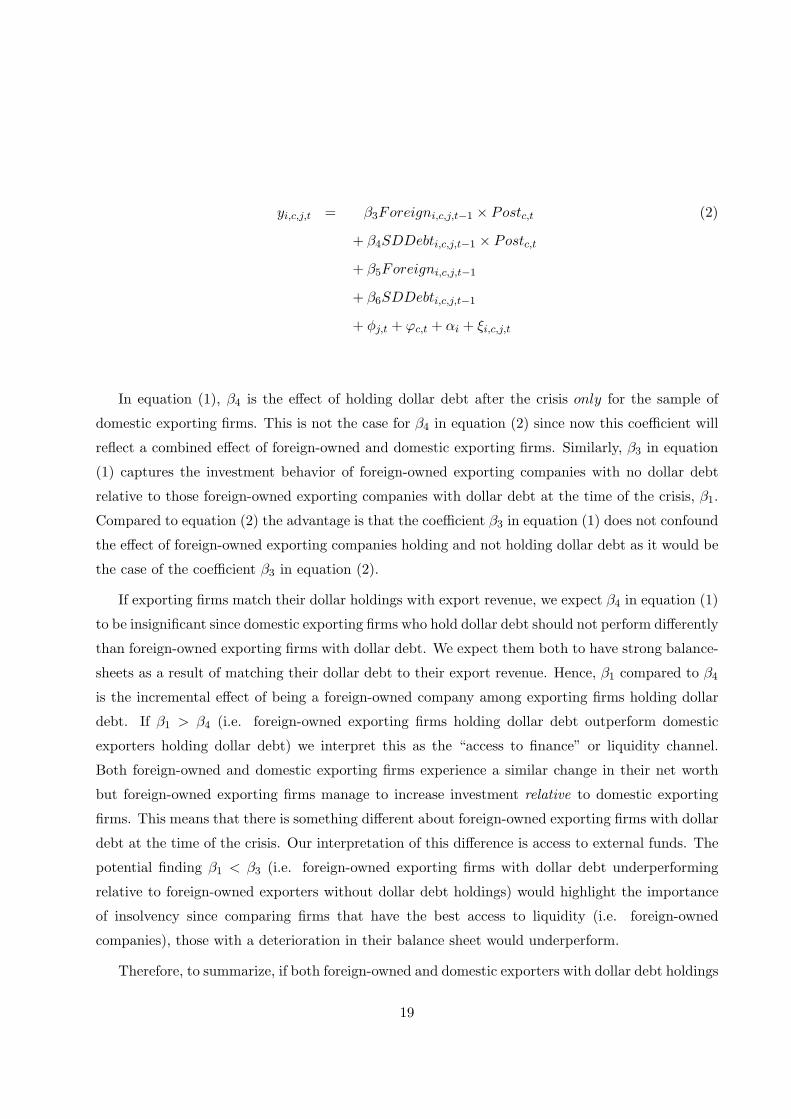
yi,c,j,t = β3Foreigni,c,j,t−1 × Postc,t (2)
+ β4SDDebti,c,j,t−1 × Postc,t
+ β5Foreigni,c,j,t−1
+ β6SDDebti,c,j,t−1
+ φj,t + ϕc,t + αi + ξi,c,j,t
In equation (1), β4 is the effect of holding dollar debt after the crisis only for the sample of
domestic exporting firms. This is not the case for β4 in equation (2) since now this coefficient will
reflect a combined effect of foreign-owned and domestic exporting firms. Similarly, β3 in equation
(1) captures the investment behavior of foreign-owned exporting companies with no dollar debt
relative to those foreign-owned exporting companies with dollar debt at the time of the crisis, β1.
Compared to equation (2) the advantage is that the coefficient β3 in equation (1) does not confound
the effect of foreign-owned exporting companies holding and not holding dollar debt as it would be
the case of the coefficient β3 in equation (2).
If exporting firms match their dollar holdings with export revenue, we expect β4 in equation (1)
to be insignificant since domestic exporting firms who hold dollar debt should not perform differently
than foreign-owned exporting firms with dollar debt. We expect them both to have strong balance-
sheets as a result of matching their dollar debt to their export revenue. Hence, β1 compared to β4
is the incremental effect of being a foreign-owned company among exporting firms holding dollar
debt. If β1 > β4 (i.e. foreign-owned exporting firms holding dollar debt outperform domestic
exporters holding dollar debt) we interpret this as the “access to finance” or liquidity channel.
Both foreign-owned and domestic exporting firms experience a similar change in their net worth
but foreign-owned exporting firms manage to increase investment relative to domestic exporting
firms. This means that there is something different about foreign-owned exporting firms with dollar
debt at the time of the crisis. Our interpretation of this difference is access to external funds. The
potential finding β1 < β3 (i.e. foreign-owned exporting firms with dollar debt underperforming
relative to foreign-owned exporters without dollar debt holdings) would highlight the importance
of insolvency since comparing firms that have the best access to liquidity (i.e. foreign-owned
companies), those with a deterioration in their balance sheet would underperform.
Therefore, to summarize, if both foreign-owned and domestic exporters with dollar debt holdings
19
can avoid a mismatch on their balance-sheet and hence insolvency, then the differential response
between the two captures access to liquidity. This result should only hold when domestic companies
suffer from a liquidity problem. Hence, we should see foreign-owned exporters with dollar debt
investing more relative to domestic exporters with dollar debt holdings only under twin crises.
Thus, this study can only be done by means of a triple interaction rather than a double interaction
that would mask the groups of interest. In addition, one of the key advantages of this specification
is that it allows to quantify the total effect of dollar debt holdings and identify those firms that
are benefited/hurt by the crisis. Finally, the identification strategy relies on the fact that there
are no prior differential trends in outcomes of foreign versus domestic exporters with dollar debt,
especially during a twin crisis. Our robustness section will show this is indeed the case. Next, we
turn to our regression analysis.
5 Results
Table 5 shows the results from estimating equation (1) for the sample of exporting firms.30 Following
Aguiar (2005), an exporter is defined as a firm whose export revenue to sales ratio is more than
10 percent. The 10 percent cut off level corresponds to the 75 percentile of the distribution of
exports to sales ratio. The main reasoning behind choosing this sample is to consider firms with
enough export revenue to compensate any potential mismatch derived from dollar debt holdings.
According to our estimation strategy, columns (1) to (4) of table 5 concentrate on the twin crises
episodes, (i.e., Argentina (2002) and Mexico (1995) where both countries had a banking crises in
the year prior to the currency crisis). Columns (5) to (8) refer to the currency crises episodes (i.e.,
Brazil (1999, 2002) which involved a depreciation of the currency of more than 25 percent but there
was not a decline in the supply of credit (see figure 4)).31
Column (1) in table 5 shows that foreign-owned exporters holding dollar debt increase invest-
ment (0.211) relative to domestic exporters holding dollar debt (-0.150) and foreign-owned exporters30In order to properly implement country-year and sector-year fixed effects in the presence of triple interactions
and continuous variables, through out the analysis we demean all continuous variables by removing country-year and
sector-year averages from firm-level values.31Notice the post dummy always refers to the year of depreciation and year after. Given that the treatment is based
on a time dummy, standard errors are clustered at the year level throughout the analysis. However, similar results
where obtained for most specifications when clustering at the country level. Finally, clustering at the country-year
level turned out to be particularly demanding given our relatively small sample in some regressions and therefore,
although results were not always stable they were qualitatively similar.
20
with no dollar debt (0.127) during twin crises. On the contrary, column (5) shows that foreign-
owned exporters holding dollar debt (-0.068) do not behave significantly differently than domestic
exporters with dollar debt (0.053) or foreign-owned exporters without dollar debt (-0.033) during
currency crises. Notice that according to the F-test in column (5) the total effect from dollar debt
or foreign ownership is not significant during the currency crises years. In fact none of the total
effects are significant under currency crisis episodes.
Columns (2) and (6) show similar results when the exporting sample is defined according to
whether the firm reported export revenue that accounted for more than 10 percent of sales during
the three years prior to the crises. The recent literature on firm heterogeneity and trade shows
that it is most productive firms that enter the export market and among those, only the ones
with the highest productivity will engage in FDI activities (Helpman, Melitz and Yeaple (2004)).
Therefore, the depreciation episode would make firms near the threshold productivity cut-off level
enter the export market. These firms would be more productive than the non exporting ones but
less productive than the ones that were already exporting and that due to the depreciation also
experienced a competitiveness effect. Changes in export status from non-exporter to exporter at
the time of the crisis were relatively limited in our sample and accounted for 5 percent of the
exporting observations at the time of the crisis. These findings are similar to those in Gopinath
and Neiman (2011) that show how during the 2002 Argentinean financial crisis there was not
a significant change in the number of exported varieties.32Nevertheless, to avoid concerns about
selection into the export market at the time of the crises columns (2) to (4) and (6) to (8) use a
predetermined export dummy to define the exporter sample.
We include in all columns firm-specific control variables to account for the following concerns.
First, dollar debt holdings might not be an issue if the firm is not leveraged, i.e, the short-term
debt might not be a big fraction of total debt, then it would not be a concern even if most of the
short-term debt is denominated in dollars. This type of firm may not face an insolvency problem.
Second, we assume that firms in countries that experienced a twin crisis cannot finance investment
and/or working capital at the time of the crisis through banks. Several studies have highlighted
the dependence of firms on the local banking system in Latin America.33 Therefore, we control for32Gopinath and Neiman (2011) show that the extensive margin of imports played a small role during the 2002
Argentinean crisis and it was mainly driven by small importers. However, the churning of inputs within firms played
a sizeable role in aggregate adjustment and large importers were more affected. For our purposes the important
finding is that they show how these differences are not driven by differences between domestic and MNCs.33See Demirguc-Kunt and Levine (2001). Our dataset reveals that the ratio of bank debt to total liabilities is on
average higher for domestic companies relative to foreign-owned companies in all countries under study.
21
the ratio of short-term bank debt to total liabilities to proxy for bank dependence and leverage,
which enters as negative and significant. Third, we also assume that firms are not able to borrow
in international markets at the time of the crisis. This is a typical characteristic of emerging
market crises where foreign investors are dissuaded by the bad economic conditions of any lending
to these firms in the eve of or during the crisis. To check this assumption, we include measures
of access to international markets like the variables “bond abroad” a dummy that takes the value
of one in the year the firm issues a corporate bond abroad, “international loan” a dummy that
takes the value of one in the year the firm issues a syndicated loan abroad, and “equity abroad”
a dummy that takes the value of one in the year the firm issues stock abroad (either as ADR or
GDR, whether in the US or other stock market).34 Although these measures are good proxies for
external sources of financing during tranquil times we believe these measures will be relatively weak
during financial turbulent times as argued by the sudden stop literature since markets shy away
from emerging markets during such times (see for example Reinhart and Reinhart (2010). Indeed
these measures turn out to be insignificant in all specifications. We rely on foreign ownership as a
main arms’ length source of financing for foreign affiliates located in emerging markets, especially
during financial crises.
A potential threat to a proper identification arises from the possibility that productive firms
are bought out by foreigners during the crisis although the evidence so far seems to be showing
the opposite. Aguiar and Gopinath (2005) show that foreign investors buy inferior firms at fire-
sale prices. So, we define foreign status as a dummy based on the ownership status of the firm
three years prior to the crisis in columns (3) and (7). Clearly, the results are not sensitive to the
way foreign and export status are defined. This is expected since although, there are 17 cases
in which a domestic firms changed ownership status to majority foreign-owned at the time of the
devaluation in the total sample, in the exporter subsample there are only 7 of such cases. Finally,
columns (4) and (8) explore whether the results could be driven by foreign-owned firms being on
a different trend than domestic firms. To shed some light on this possibility columns (4) and (8)
add foreign-year fixed effects. The results stay the same.
If insolvency through a worsening of the balance sheet was the dominant channel hindering
investment we should observe no difference between foreign-owned and domestic exporters that
hold dollar debt under any type of crisis. Clearly, foreign-owned firms do not suffer an illiquidity
problem during a twin crisis and do better relative to domestic exporters, regardless of their solvency
issues. The results are also economically significant. Results in column (1) indicate that a domestic34These data is from from Dealogic Bondware and Loanware.
22
exporter facing an increase in the short-term dollar debt ratio of 0.75235 would experience a decline
in investment corresponding to an 11 percent of assets relative to a foreign exporter. At the same
time, a foreign exporter experiencing a similar increase in the short-term dollar debt ratio would
have increased investment by 5 percent of assets relative to a domestic exporter.
6 Robustness and Threats to Identification
6.1 Robustness
We conduct a series of robustness checks for our main results obtained in column (4) of table 5 and
present the results in table 6.
First, although we have emphasized the role of hard currency denominated income as the
main channel to avoid balance sheet mismatches, there are other factors that can contribute to
improve firms’ solvency. The potential negative effect of foreign denominated short-term liabilities
on firms’ balance-sheets during crises could be mitigated by significant holdings of foreign currency
denominated assets. Column (1) shows that results are robust to controlling for dollar assets as
a share of total assets during crises. Notice ideally we would like to control for the share of short
term dollar assets denominated in foreign currency however, this will severely limit the sample.
Thus, we control for cash holdings in column (2) instead since the increase in debt service via the
inflated dollar denominated debt would not translate into a balance sheet worsening if firms hold
enough cash. Our main results are not affected.
Columns (3) and (4) look at other measures of leverage. All the results in table 5 controlled for
the ratio of short term bank debt to total liabilities. Similarly, column (3) adds the ratio of total
liabilities to total assets and column (4) the ratio of long term bank debt to total liabilities, with
no significant effect on our main results.
Another possible explanation for the better performance of foreign-owned exporters with dollar
debt relative to domestic exporters holding dollar debt is that foreign-owned exporters had better
access to export markets. As already mentioned we do not find many companies starting to export
as a result of the devaluation (only 5 percent of the exporting observations at the time of the crises).
However, it might be that foreign-owned exporters have better connections or information about
international markets and are better able to increase their sales abroad. If that was the case we35This corresponds to a change from the 10th percentile (0.085) to the 90th percentile (0.837) in the distribution
of short-term dollar debt within the sample of exporters
23
should see an increase in the share of exports for foreign-owned exporters at the time of the crisis.
We estimate the share of exports as a function of foreign and foreign× post in the sample of
high exporters and find no significant differences in export shares for foreign-owned versus domestic
firms.36 We do find however, that once we account for dollar debt holdings foreign-owned exporters,
with and without dollar debt holdings, significantly increase their share of exports. We also worry
that due to contagion effects, exporters in the crisis country do not face a relative improvement
in their investment prospects if exporters in neighboring countries undergo a parallel depreciation
(relevant for Argentina and Brazil (2002)) or if the instability in the area reduces the demand for
imports from the crisis country. However, there is no reason to believe that foreign and domestic
exporters serve different markets (unfortunately we do not have firm-level data on the destination
of exports).37
Finally, it is also possible that both foreign-owned and domestic firms reduce their dollar liabil-
ities in anticipation to the crisis. This can explain the no-difference result between foreign-owned
and domestic exporting firms in the case of currency crises. Thus, we show in figure 5, that there
was no systematic decrease in dollarization for foreign-owned firms relative to domestic firms in
the eve of crisis. Kamil (2009) also finds no significant change in firms’ dollar debt holdings prior
to the move to a flexible exchange rate regime. Nevertheless, we repeat our basic results using a
predetermined dummy for dollar debt holdings. A firm is defined as having high dollar debt if her
share of short term dollar debt in total short term debt is greater than 35 percent at any time
during the three years prior to the crises.38 Results (available upon request) confirm that our main
results are not driven by foreigners decreasing dollar debt holdings faster at the time of the crisis.36
ExportSharei,c,j,t = β1Foreigni,c,j,t + β2Foreigni,c,j,t × Postc,t + φj,t + ϕc,t + αi + ξi,c,j,t (3)
37An alternative explanation for the better performance of foreign-owned exporters is related to the role of imported
materials. Although the depreciation makes exported goods relatively cheaper, firms importing materials from abroad
would now witness an increase in the relative price of imports. Unfortunately, we could not obtain data on imports
but we defined tradable sectors with a dummy variable that is equal to one if the firm operates in a SIC sector
classified as tradable (see Forbes, 2002), and obtained similar results. The lack of data prevents us from exploring
the possibility that foreign-owned exporters have access to cheaper imported goods through the parent company.38Recall 35 percent corresponds to the mean holdings in the exporter sample.
24
6.2 Threats to Identification
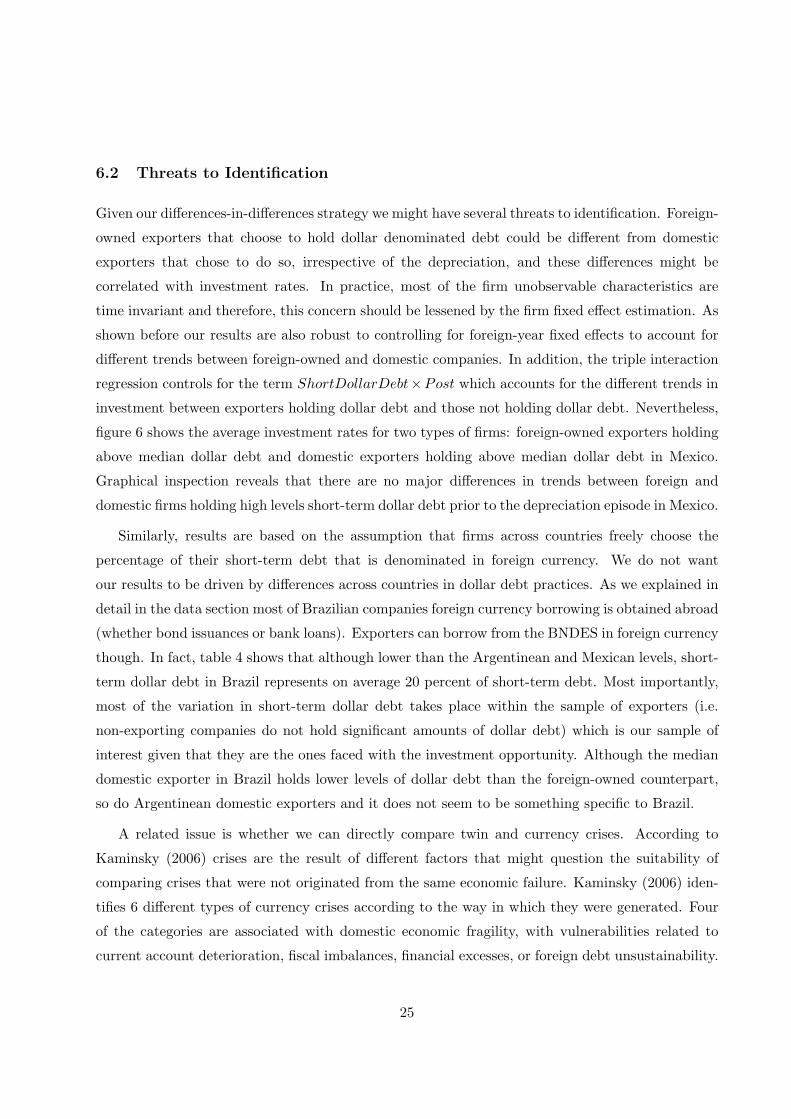
Given our differences-in-differences strategy we might have several threats to identification. Foreign-
owned exporters that choose to hold dollar denominated debt could be different from domestic
exporters that chose to do so, irrespective of the depreciation, and these differences might be
correlated with investment rates. In practice, most of the firm unobservable characteristics are
time invariant and therefore, this concern should be lessened by the firm fixed effect estimation. As
shown before our results are also robust to controlling for foreign-year fixed effects to account for
different trends between foreign-owned and domestic companies. In addition, the triple interaction
regression controls for the term ShortDollarDebt×Post which accounts for the different trends in
investment between exporters holding dollar debt and those not holding dollar debt. Nevertheless,
figure 6 shows the average investment rates for two types of firms: foreign-owned exporters holding
above median dollar debt and domestic exporters holding above median dollar debt in Mexico.
Graphical inspection reveals that there are no major differences in trends between foreign and
domestic firms holding high levels short-term dollar debt prior to the depreciation episode in Mexico.
Similarly, results are based on the assumption that firms across countries freely choose the
percentage of their short-term debt that is denominated in foreign currency. We do not want
our results to be driven by differences across countries in dollar debt practices. As we explained in
detail in the data section most of Brazilian companies foreign currency borrowing is obtained abroad
(whether bond issuances or bank loans). Exporters can borrow from the BNDES in foreign currency
though. In fact, table 4 shows that although lower than the Argentinean and Mexican levels, short-
term dollar debt in Brazil represents on average 20 percent of short-term debt. Most importantly,
most of the variation in short-term dollar debt takes place within the sample of exporters (i.e.
non-exporting companies do not hold significant amounts of dollar debt) which is our sample of
interest given that they are the ones faced with the investment opportunity. Although the median
domestic exporter in Brazil holds lower levels of dollar debt than the foreign-owned counterpart,
so do Argentinean domestic exporters and it does not seem to be something specific to Brazil.
A related issue is whether we can directly compare twin and currency crises. According to
Kaminsky (2006) crises are the result of different factors that might question the suitability of
comparing crises that were not originated from the same economic failure. Kaminsky (2006) iden-
tifies 6 different types of currency crises according to the way in which they were generated. Four
of the categories are associated with domestic economic fragility, with vulnerabilities related to
current account deterioration, fiscal imbalances, financial excesses, or foreign debt unsustainability.
25
But crises can also be provoked by just adverse world market conditions, such as the reversal of
international capital flows. The so-called sudden-stop phenomenon identifies the fifth variety of
crises. As emphasized by the second generation models, crises also happen in economies with im-
maculate fundamentals. Thus, the last variety of crises is labeled self-fulfilling crises. She classifies
both Brazil 1999 and Mexico 1995 as being the result of the same cause: financial excesses.
Table 7 repeats the main specification in table 5 by country and episode. Column (1) shows that
foreign-owned exporters holding dollar debt in Mexico are the ones increasing investment relative to
domestic exporters with dollar debt (although the total effects are not significant in this case notice
that we are dealing with a small sample size). Column (2) examines the case of Brazil 1999 and as
expected there are no significant differences between domestic and foreign exporters holding dollar
debt. Therefore, comparing columns (1) and (2) we can say that results are robust to focusing
on crises that share the same origin and are not driven by the different nature of the depreciation
but rather by the existence of a banking crisis in the preceding year. For completeness column (3)
shows the case of Brazil 2002 where as expected there are no differences across foreign-owned and
domestic exporters with dollar debt.39
6.3 Alternative Estimation Strategy
The results in table 5 are consistent with the interpretation that the real problem is illiquidity.
To further substantiate this point we propose an alternative specification and define a sample of
solvent firms (i.e., firm that do not have a mismatch on their balance sheet). Table 8 shows how
foreign-owned firms perform relative to domestic firms when we focus in a sample of firms with
no currency mismatch. To avoid any selection issues at the time of the crisis, we define matched
balance sheets based on whether the firm had revenue in excess to short-term dollar liabilities at
any time during the three years prior to the crises.40 Columns (1) to (3) show the results under
twin crises while columns (4) to (6) refer to currency crises. Column (1) shows how foreign-owned
firms invest 4 percent more relative to domestic firms during twin crises. It is reassuring that
results are robust to the use of a predetermined variable that classifies firms into foreign-owned
and domestic according to their ownership status three years before the crises (see columns (2)
and (3)). Finally, column (3) examines the sample of exporters. Within solvent firms we expect
exporting firms to be the ones taking the investment opportunity generated by the depreciation of
the currency. To avoid concerns about selection into the export market at the time of the crises39We did not have enough observations to identify the individual effects in Argentina40We define firms with no mismatch as those in which Exports−ShortDollarLiab
Assets≥ 0
26
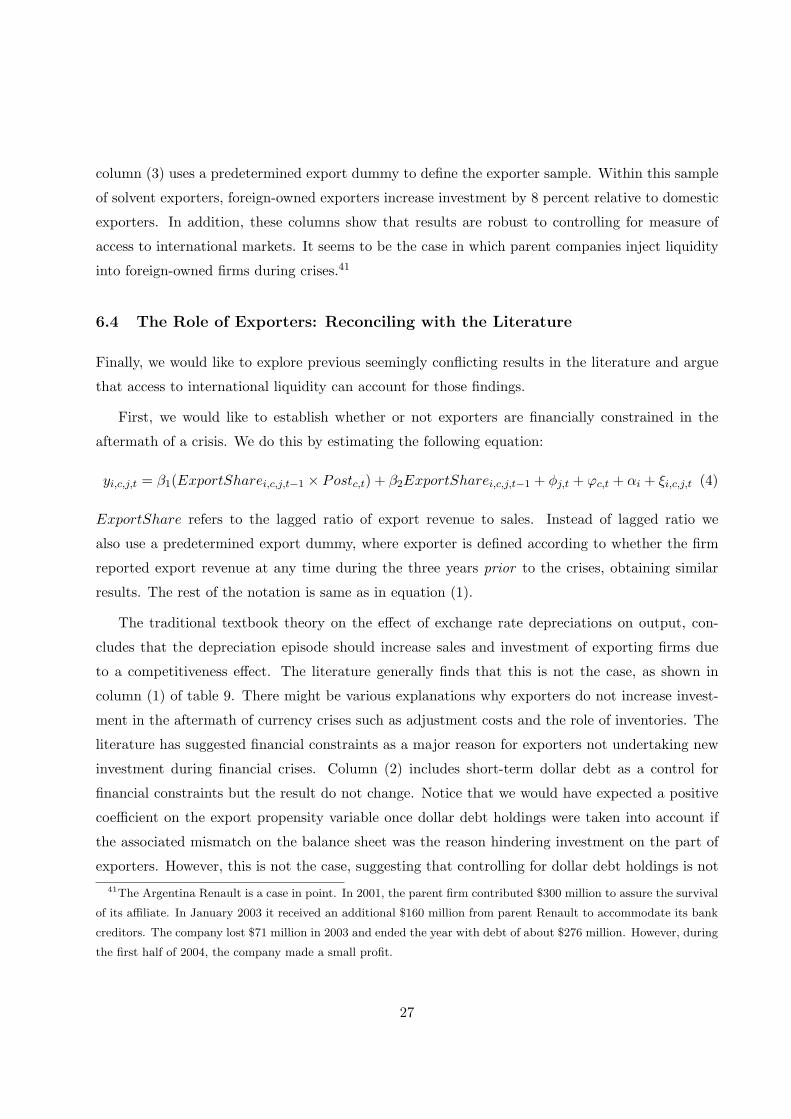
column (3) uses a predetermined export dummy to define the exporter sample. Within this sample
of solvent exporters, foreign-owned exporters increase investment by 8 percent relative to domestic
exporters. In addition, these columns show that results are robust to controlling for measure of
access to international markets. It seems to be the case in which parent companies inject liquidity
into foreign-owned firms during crises.41
6.4 The Role of Exporters: Reconciling with the Literature
Finally, we would like to explore previous seemingly conflicting results in the literature and argue
that access to international liquidity can account for those findings.
First, we would like to establish whether or not exporters are financially constrained in the
aftermath of a crisis. We do this by estimating the following equation:
yi,c,j,t = β1(ExportSharei,c,j,t−1 × Postc,t) + β2ExportSharei,c,j,t−1 + φj,t + ϕc,t + αi + ξi,c,j,t (4)
ExportShare refers to the lagged ratio of export revenue to sales. Instead of lagged ratio we
also use a predetermined export dummy, where exporter is defined according to whether the firm
reported export revenue at any time during the three years prior to the crises, obtaining similar
results. The rest of the notation is same as in equation (1).
The traditional textbook theory on the effect of exchange rate depreciations on output, con-
cludes that the depreciation episode should increase sales and investment of exporting firms due
to a competitiveness effect. The literature generally finds that this is not the case, as shown in
column (1) of table 9. There might be various explanations why exporters do not increase invest-
ment in the aftermath of currency crises such as adjustment costs and the role of inventories. The
literature has suggested financial constraints as a major reason for exporters not undertaking new
investment during financial crises. Column (2) includes short-term dollar debt as a control for
financial constraints but the result do not change. Notice that we would have expected a positive
coefficient on the export propensity variable once dollar debt holdings were taken into account if
the associated mismatch on the balance sheet was the reason hindering investment on the part of
exporters. However, this is not the case, suggesting that controlling for dollar debt holdings is not41The Argentina Renault is a case in point. In 2001, the parent firm contributed $300 million to assure the survival
of its affiliate. In January 2003 it received an additional $160 million from parent Renault to accommodate its bank
creditors. The company lost $71 million in 2003 and ended the year with debt of about $276 million. However, during
the first half of 2004, the company made a small profit.
27
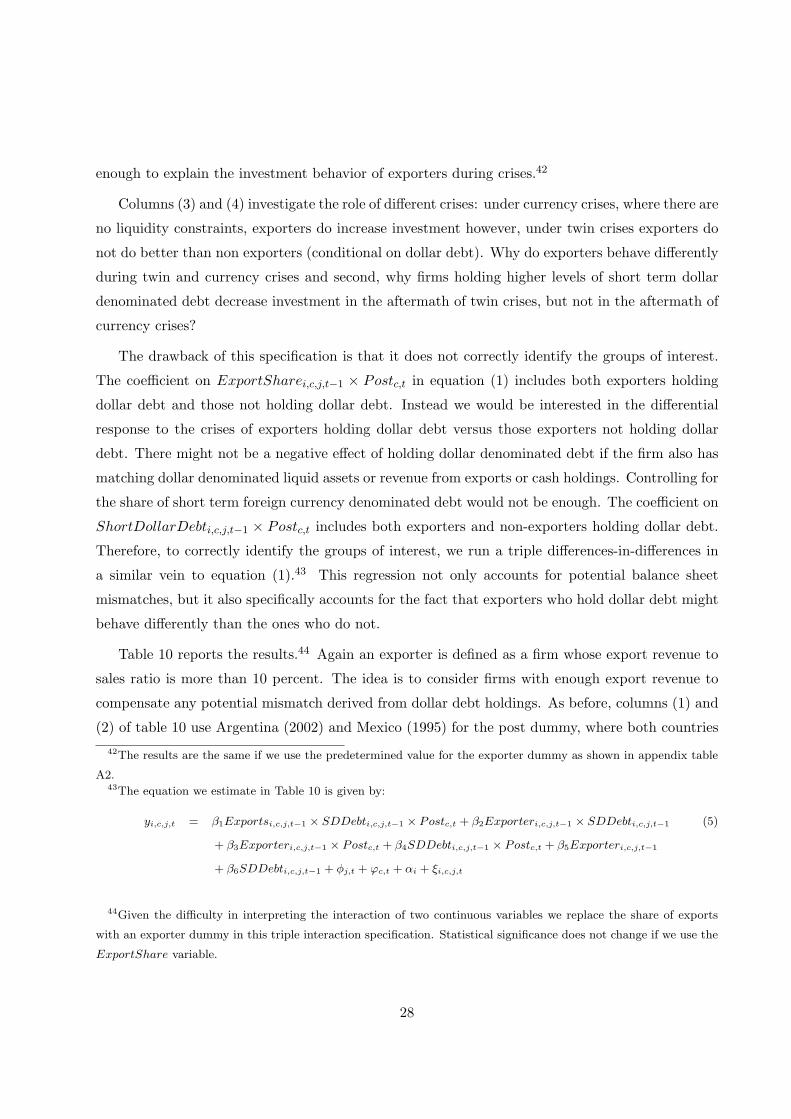
enough to explain the investment behavior of exporters during crises.42
Columns (3) and (4) investigate the role of different crises: under currency crises, where there are
no liquidity constraints, exporters do increase investment however, under twin crises exporters do
not do better than non exporters (conditional on dollar debt). Why do exporters behave differently
during twin and currency crises and second, why firms holding higher levels of short term dollar
denominated debt decrease investment in the aftermath of twin crises, but not in the aftermath of
currency crises?
The drawback of this specification is that it does not correctly identify the groups of interest.
The coefficient on ExportSharei,c,j,t−1 × Postc,t in equation (1) includes both exporters holding
dollar debt and those not holding dollar debt. Instead we would be interested in the differential
response to the crises of exporters holding dollar debt versus those exporters not holding dollar
debt. There might not be a negative effect of holding dollar denominated debt if the firm also has
matching dollar denominated liquid assets or revenue from exports or cash holdings. Controlling for
the share of short term foreign currency denominated debt would not be enough. The coefficient on
ShortDollarDebti,c,j,t−1 × Postc,t includes both exporters and non-exporters holding dollar debt.
Therefore, to correctly identify the groups of interest, we run a triple differences-in-differences in
a similar vein to equation (1).43 This regression not only accounts for potential balance sheet
mismatches, but it also specifically accounts for the fact that exporters who hold dollar debt might
behave differently than the ones who do not.
Table 10 reports the results.44 Again an exporter is defined as a firm whose export revenue to
sales ratio is more than 10 percent. The idea is to consider firms with enough export revenue to
compensate any potential mismatch derived from dollar debt holdings. As before, columns (1) and
(2) of table 10 use Argentina (2002) and Mexico (1995) for the post dummy, where both countries42The results are the same if we use the predetermined value for the exporter dummy as shown in appendix table
A2.43The equation we estimate in Table 10 is given by:
yi,c,j,t = β1Exportsi,c,j,t−1 × SDDebti,c,j,t−1 × Postc,t + β2Exporteri,c,j,t−1 × SDDebti,c,j,t−1 (5)
+ β3Exporteri,c,j,t−1 × Postc,t + β4SDDebti,c,j,t−1 × Postc,t + β5Exporteri,c,j,t−1
+ β6SDDebti,c,j,t−1 + φj,t + ϕc,t + αi + ξi,c,j,t
44Given the difficulty in interpreting the interaction of two continuous variables we replace the share of exports
with an exporter dummy in this triple interaction specification. Statistical significance does not change if we use the
ExportShare variable.
28
had a banking crises in the year before the currency crisis, and columns (3) and (4) use Brazil
(1999, 2002), where both episodes involve depreciation of the currency of more than 25% but there
was not a decline in the supply of credit on the financial sector part.
The coefficient on the triple interaction in column (1) in table 10 (-0.110) indicates that in the
case of twin crises not even high exporters are able to increase investment if they hold dollar debt.
In fact, they decrease investment both relative to exporters with no dollar debt holdings (-0.038)
and non-exporters with dollar debt (-0.042). The F-test shows that the total effect from holding
dollar debt is negative and highly significant and export revenue is not enough to compensate for
the inflated debt. Firms holding dollar debt significantly decrease investment during twin crises
regardless of their export status. During a currency crisis results are exact opposite. Exporters
do increase investment, even those with higher short-term dollar debt holdings. If the issue is an
insolvency one then the coefficient on the triple interaction should be negative significant under
both type of crises and must be smaller than the coefficient on the term Exporter × Post. If
exporters match the dollarized liability with export earnings then the coefficient on the triple
interaction should be positive under both type of crises and should not be statistically different
from the coefficient on the term Exporter×Post. If the issue is insolvency and only exporters can
get around this problem thanks to their foreign currency earnings, then the coefficient on the term
ShortDollarDebt× Post should be negative, under both type of crises.
These regressions as before show that the real problem is illiquidity and hence exporters perform
worse regardless of dollar debt under a twin crisis, but they perform better under a currency
crisis. Both tables 9 and 10 show that under currency crises exporters do increase investment
relative to non exporters, or exporters with dollar debt increase investment relative to non-exporters
with dollar debt. Thus, exporters, having the ability to avoid a balance sheet weakness take the
advantage of investment opportunity under currency crises but not under a twin crises since their
access to liquidity is lower. These results shed some light on the opposite results previously found in
the literature. Our results are consistent with Aguiar (2005) who studies the investment behavior
of firms holding dollar debt in the aftermath of the Mexican crisis, which is a twin crisis, and finds
a negative effect. Our results are also consistent with Bleakley and Cowan (2008) finding that firms
with higher dollar debt holdings do not decrease investment during depreciation episodes. None
of these studies control for the role of foreign ownership and hence access to liquidity. We believe
Aguiar results are driven by domestic exporters who do not have access to liquidity under a twin
crisis and Bleakley and Cowan results are driven by ability of exporters to avoid insolvency as they
highlight and take advantage of investment opportunity during depreciations.
29
7 Conclusion
This paper provides systematic evidence on the key channel behind the contractionary nature of
financial crises. The main reason why firms are constrained and hence investment and growth are
hindered in the aftermath of a financial crisis is international and domestic illiquidity. By using
a unique hand-collected data set for 1,300 listed firms from six Latin American countries between
1990–2005, we disentangle the illiquidity channel from the insolvency channel. Our measure of
liquidity is foreign ownership. We proxy insolvency by balance-sheet mismatch caused by short-
term foreign currency debt conditional on leverage.
Our main result is that foreign-owned exporters with dollar debt perform better than domestic
exporters with dollar debt only during twin crises, where domestic firms access to finance is limited
given the troubled banking sector. There is no difference in performance between these firms during
currency crises. This implies foreign currency denominated debt is not a problem for exporters perse
since they match their short-term dollar debt with export revenue to avoid insolvency. During
twin crises, however, domestic exporters suffer from the problem of illiquidity and hence contract
investment and production as oppose to foreign-owned exporters.
Our results have important policy implications. First, to the best of our knowledge, this paper
is first in quantifying the real effects of shocks to banking sector using firm-level investment data.
The 11 percent decline in firm-level investment relative to assets in the aftermath of banking crisis
is an economically meaningful effect. Second, short-term foreign currency borrowing may not be
detrimental to firms’ balance-sheets as long as their access to finance is not limited during periods
of instability. Hence it is important to provide liquidity to the banking sector during financial crises
especially if the domestic banking sector is the main source of financing for the firms.
30
References
[1] Alfaro,L. and Chen,M. (2010) “Surviving the Global Financial Crisis: Foreign Direct Invest-
ment and Establishment Performance,” Harvard Business School Working Paper 10-110.
[2] Allen,M., Rosenberg,C., Keller,C., Setser,B. and Roubini,N. (2002) “A Balance Sheet Ap-
proach to Financial Crisis,” IMF Working Paper WP/02/210, Washington, D.C.
[3] Antras,P. (2003) “Firms, Contracts, and Trade Structure,” Quarterly Journal of Economics,
118(4), 13751418.
[4] Antras,P. (2005) “Incomplete Contracts and the Product Cycle,” The American Economic
Review, 95(4), 1054-1073.
[5] Antras,P. and Helpman,E. (2004) “Global Sourcing,” Journal of Political Economy, 112(3),
552-580.
[6] Antras,P., Foley,F. and Desai,M. (2009) “Multinational Firms, FDI Flows and Imperfect Cap-
ital Markets,” Quarterly Journal of Economics, 124 (3), 1171-1219.
[7] Aguiar,M.A. (2005) “Investment, Devaluation, and Foreign Currency Exposure: The Case of
Mexico,” Journal of Development Economics, 78, 95-113.
[8] Aguiar,M.A. and Gopinath,G. (2005) “Fire-sale FDI and Liquidity Crises,” Review of Eco-
nomics and Statistics, 87(3), 439-452.
[9] Bernanke,B.S. (1983) “Nonmonetary Effects of the Financial Crisis in Propagation of the Great
Depression,” American Economic Review, 73(3), 257-276.
[10] Bernanke,B.S. and Gertler,M. (1989) “Agency Costs, Net Worth, and Economic Fluctuations,”
The American Economic Review, 79, 14-31.
[11] Bernanke,B.S., Gertler,M. and Gilchrist,S. (1996) “The Financial Accelerator and the Flight
to Quality,” The Review of Economics and Statistics, 78(1), 1-15.
[12] Blalock,G., Gertler,P.J. and Levine,D.I. (2008) “Financial Constraints on Investment in an
Emerging Market Crisis,” Journal of Monetary Economics, 55(3), 568-591.
[13] Bleakley,H. and Cowan,K. (2008) “Corporate Dollar Debt and Depreciations: Much Ado
About Nothing?” The Review of Economics and Statistics, 90(4), 612-626.
31
[14] Caballero,R. and Krishnamurthy,A.A. (2001) “International and Domestic Collateral Con-
straints in a Model of Emerging Market Crises,” Journal of Monetary Economics, 48(3), 513-
548.
[15] Calvo,G.A. and Reinhart,C.M. (2002) “Fear of Floating,” Quarterly Journal of Economics,
107(2), 379-408.
[16] Chang,R. and Velasco,A. (2001) “A Model of Financial Crisis in Emerging Markets,” Quarterly
Journal of Economics, 116(2), 489-517.
[17] Cespedes,L.F., Chang,R. and Velasco,A. (2004) “Balance Sheets and Exchange Rate Policy,”
The American Economic Review, 94(4), 1183-93.
[18] Desai,M., Foley,F. and Forbes,K.J. (2008) “Financial Constraints and Growth: Multinational
and Local Firm Responses to Currency Depreciations,”Review of Financial Studies, 21, 2857-
2888.
[19] Demirguc-Kunt,A. and Levine,R. (2001) “Bank-Based and Market-
Based Financial Systems: Cross-Country Comparisons” in
Financial Structure and Economic Growth: A Cross-Country Comparison Eds. Asli
Demirguc-Kunt and Ross Levine, Cambridge, MA: MIT Press.
[20] Eichengreen,B. and Hausmann,R. (1999) “Exchange Rates and Financial Fragility,” in
New Challenges for Monetary Policy, Kansas City, Missouri: Federal Reserve Bank of Kansas
City, 329-368.
[21] Forbes,K.J. (2002) “How Do Large Depreciations Affect Firm Performance?” International
Monetary Fund Staff Papers, 49,214-238.
[22] Gopinath,G. and Neiman,B. (2011) “Trade Adjustment and Productivity in Large Crises”,
Harvard Economics Department and Chicago Booth School of Business, mimeo.
[23] Helpman,E., Melitz,M. and Yeaple,S. (2004) “Export Versus FDI with Heterogeneous Firms,”
The American Economic Review, 94, 300-316.
[24] Holmstrom,B. and Tirole,J. (1997) “Financial Intermediation, Loanable Funds, and the Real
Sector,” Quarterly Journal of Economics, 112, 663-691.
32
[25] Jimenez,G., Ongena,S., Peydro-Alcalde,J.L. and Saurina,J. (2011) “Credit Supply: Identifying
Balance-Sheet Channels with Loan Applications and Granted Loans,” CEPR working paper
DP7655.
[26] Kamil,H. (2009) “How Do Exchange Rate Regimes Affect Firms’ Incentives to Hedge Currency
Risk in Emerging Markets?” Washington, D.C., International Monetary Fund, mimeo.
[27] Kaminsky,G.L. (2006) “Currency Crises: Are They All the Same?” Journal of International
Money and Finance, 25, 503-527.
[28] Kaminsky,G.L. and Reinhart,C.M. (1999) “The Twin Crises: The Causes of Banking and
Balance-of-Payments Problems,” The American Economic Review, 89(3), 473-500.
[29] Khwaja,A. and Mian,A. (2008) “Tracing the Impact of Bank Liquidity Shocks: Evidence from
an Emerging Market,” The American Economic Review 98(4), 1413-1442.
[30] Krugman,P. (1999) “Balance Sheets, the Transfer Problem, and Financial Crises,” Interna-
tional Tax and Public Finance, 6(4), 459-472.
[31] Laeven,L. and Valencia,F. (2008) “Systemic Banking Crises: A New Database,” IMF Working
Paper No. 08/224, International Monetary Fund: Washington, DC.
[32] Paravisini,D. (2008) “Local Bank Financial Constraints and Firm Access to External Finance,”
The Journal of Finance 63(5), 2160-2193.
[33] Paravisini,D., Rappoport,V., Schnabl,P. and Wolfenzon,D. (2010) “Dissecting the Effect of
Credit Supply on Trade: Evidence from Matched Credit-Export Data,” Coumbia Business
School and NYU Stern School of Business, mimeo.
[34] Peek,J. and Rosengren,E.S. (2000) “Collateral damage: Effects of the Japanese Bank Crisis
on Real Activity in the United States,” The American Economic Review, 90(1), 30-45.
[35] Reinhart,C.M. and Reinhart,V.R. (2010) “Capital Flow Bonanzas,” NBER ISOM, forthcom-
ing.
[36] Reinhart,C.M. and Rogoff,K. (2008) “Banking Crises: An Equal Opportunity Menace,” NBER
Working Paper No. 14587.
[37] Schnabl,P. (2010) “Financial Globalization and the Transmission of Bank Liquidity Shocks:
Evidence from an Emerging Market,” The Journal of Finance, forthcoming.
33
[38] Setser,B., Nystedt,J., House,B.E., Halikias,I., Keller,C., Pitt,A. and Rosenberg,C.B. (2005)
“Debt-Related Vulnerabilities and Financial Crises,” IMF Occasional Papers 240, International
Monetary Fund.
34
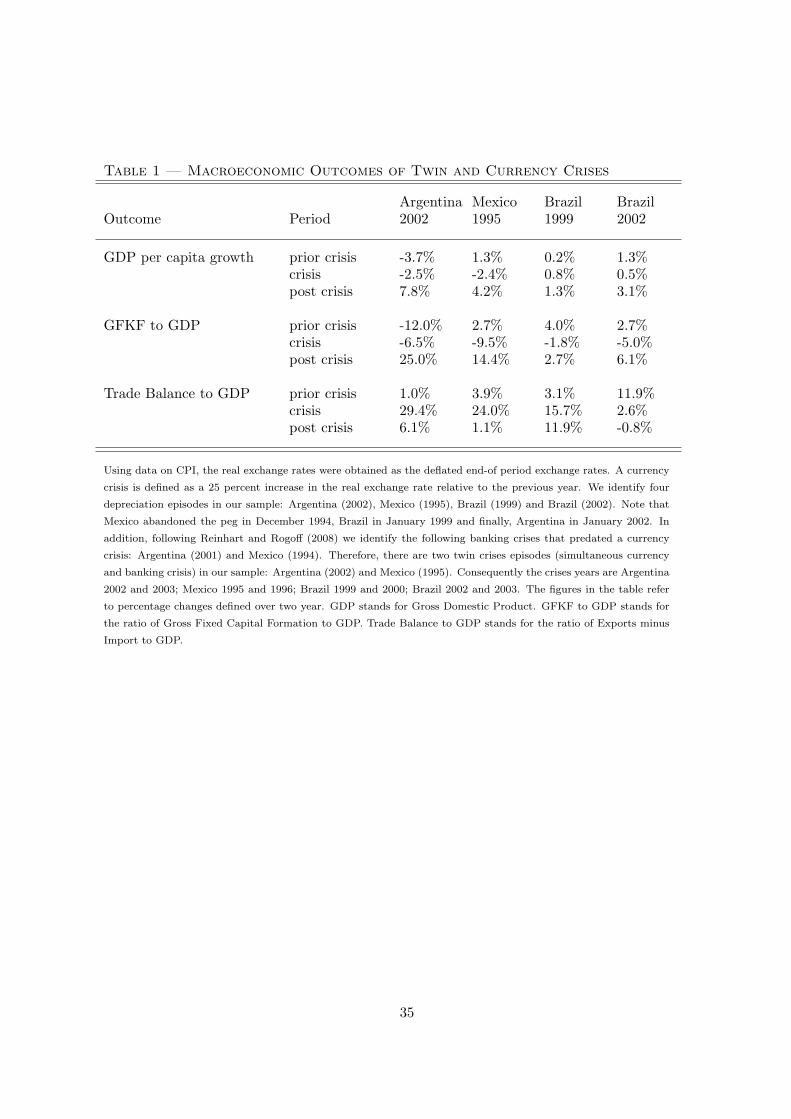
Table 1 — Macroeconomic Outcomes of Twin and Currency Crises
Argentina Mexico Brazil BrazilOutcome Period 2002 1995 1999 2002
GDP per capita growth prior crisis -3.7% 1.3% 0.2% 1.3%crisis -2.5% -2.4% 0.8% 0.5%post crisis 7.8% 4.2% 1.3% 3.1%
GFKF to GDP prior crisis -12.0% 2.7% 4.0% 2.7%crisis -6.5% -9.5% -1.8% -5.0%post crisis 25.0% 14.4% 2.7% 6.1%
Trade Balance to GDP prior crisis 1.0% 3.9% 3.1% 11.9%crisis 29.4% 24.0% 15.7% 2.6%post crisis 6.1% 1.1% 11.9% -0.8%
Using data on CPI, the real exchange rates were obtained as the deflated end-of period exchange rates. A currency
crisis is defined as a 25 percent increase in the real exchange rate relative to the previous year. We identify four
depreciation episodes in our sample: Argentina (2002), Mexico (1995), Brazil (1999) and Brazil (2002). Note that
Mexico abandoned the peg in December 1994, Brazil in January 1999 and finally, Argentina in January 2002. In
addition, following Reinhart and Rogoff (2008) we identify the following banking crises that predated a currency
crisis: Argentina (2001) and Mexico (1994). Therefore, there are two twin crises episodes (simultaneous currency
and banking crisis) in our sample: Argentina (2002) and Mexico (1995). Consequently the crises years are Argentina
2002 and 2003; Mexico 1995 and 1996; Brazil 1999 and 2000; Brazil 2002 and 2003. The figures in the table refer
to percentage changes defined over two year. GDP stands for Gross Domestic Product. GFKF to GDP stands for
the ratio of Gross Fixed Capital Formation to GDP. Trade Balance to GDP stands for the ratio of Exports minus
Import to GDP.
35
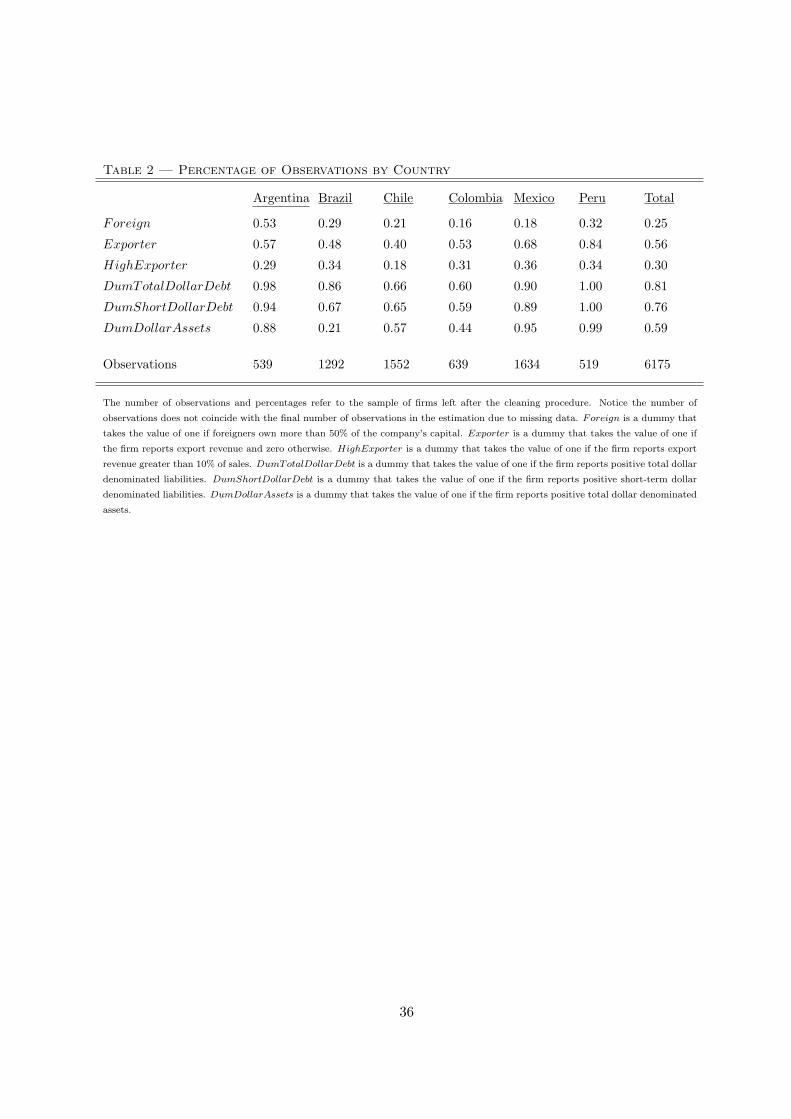
Table 2 — Percentage of Observations by Country
Argentina Brazil Chile Colombia Mexico Peru Total
Foreign 0.53 0.29 0.21 0.16 0.18 0.32 0.25
Exporter 0.57 0.48 0.40 0.53 0.68 0.84 0.56
HighExporter 0.29 0.34 0.18 0.31 0.36 0.34 0.30
DumTotalDollarDebt 0.98 0.86 0.66 0.60 0.90 1.00 0.81
DumShortDollarDebt 0.94 0.67 0.65 0.59 0.89 1.00 0.76
DumDollarAssets 0.88 0.21 0.57 0.44 0.95 0.99 0.59
Observations 539 1292 1552 639 1634 519 6175
The number of observations and percentages refer to the sample of firms left after the cleaning procedure. Notice the number of
observations does not coincide with the final number of observations in the estimation due to missing data. Foreign is a dummy that
takes the value of one if foreigners own more than 50% of the company’s capital. Exporter is a dummy that takes the value of one if
the firm reports export revenue and zero otherwise. HighExporter is a dummy that takes the value of one if the firm reports export
revenue greater than 10% of sales. DumTotalDollarDebt is a dummy that takes the value of one if the firm reports positive total dollar
denominated liabilities. DumShortDollarDebt is a dummy that takes the value of one if the firm reports positive short-term dollar
denominated liabilities. DumDollarAssets is a dummy that takes the value of one if the firm reports positive total dollar denominated
assets.
36
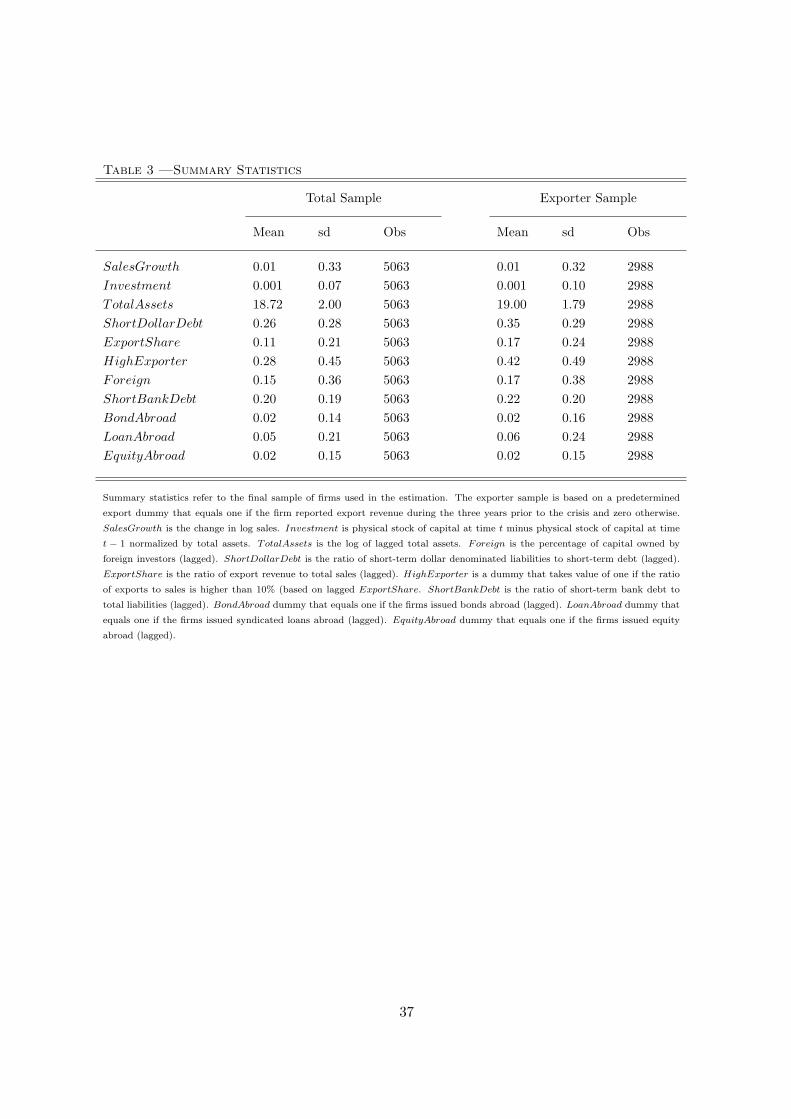
Table 3 —Summary Statistics
Total Sample Exporter Sample
Mean sd Obs Mean sd Obs
SalesGrowth 0.01 0.33 5063 0.01 0.32 2988Investment 0.001 0.07 5063 0.001 0.10 2988TotalAssets 18.72 2.00 5063 19.00 1.79 2988ShortDollarDebt 0.26 0.28 5063 0.35 0.29 2988ExportShare 0.11 0.21 5063 0.17 0.24 2988HighExporter 0.28 0.45 5063 0.42 0.49 2988Foreign 0.15 0.36 5063 0.17 0.38 2988ShortBankDebt 0.20 0.19 5063 0.22 0.20 2988BondAbroad 0.02 0.14 5063 0.02 0.16 2988LoanAbroad 0.05 0.21 5063 0.06 0.24 2988EquityAbroad 0.02 0.15 5063 0.02 0.15 2988
Summary statistics refer to the final sample of firms used in the estimation. The exporter sample is based on a predetermined
export dummy that equals one if the firm reported export revenue during the three years prior to the crisis and zero otherwise.
SalesGrowth is the change in log sales. Investment is physical stock of capital at time t minus physical stock of capital at time
t − 1 normalized by total assets. TotalAssets is the log of lagged total assets. Foreign is the percentage of capital owned by
foreign investors (lagged). ShortDollarDebt is the ratio of short-term dollar denominated liabilities to short-term debt (lagged).
ExportShare is the ratio of export revenue to total sales (lagged). HighExporter is a dummy that takes value of one if the ratio
of exports to sales is higher than 10% (based on lagged ExportShare. ShortBankDebt is the ratio of short-term bank debt to
total liabilities (lagged). BondAbroad dummy that equals one if the firms issued bonds abroad (lagged). LoanAbroad dummy that
equals one if the firms issued syndicated loans abroad (lagged). EquityAbroad dummy that equals one if the firms issued equity
abroad (lagged).
37
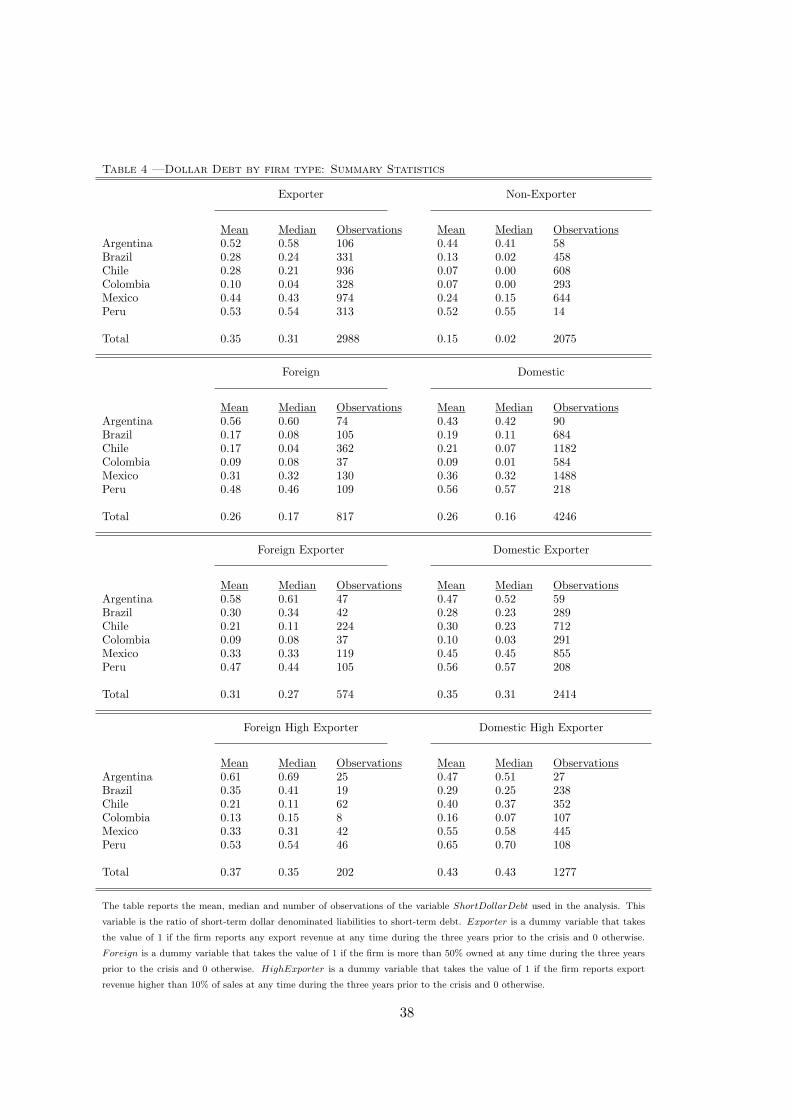
Table 4 —Dollar Debt by firm type: Summary Statistics
Exporter Non-Exporter
Mean Median Observations Mean Median ObservationsArgentina 0.52 0.58 106 0.44 0.41 58Brazil 0.28 0.24 331 0.13 0.02 458Chile 0.28 0.21 936 0.07 0.00 608Colombia 0.10 0.04 328 0.07 0.00 293Mexico 0.44 0.43 974 0.24 0.15 644Peru 0.53 0.54 313 0.52 0.55 14
Total 0.35 0.31 2988 0.15 0.02 2075
Foreign Domestic
Mean Median Observations Mean Median ObservationsArgentina 0.56 0.60 74 0.43 0.42 90Brazil 0.17 0.08 105 0.19 0.11 684Chile 0.17 0.04 362 0.21 0.07 1182Colombia 0.09 0.08 37 0.09 0.01 584Mexico 0.31 0.32 130 0.36 0.32 1488Peru 0.48 0.46 109 0.56 0.57 218
Total 0.26 0.17 817 0.26 0.16 4246
Foreign Exporter Domestic Exporter
Mean Median Observations Mean Median ObservationsArgentina 0.58 0.61 47 0.47 0.52 59Brazil 0.30 0.34 42 0.28 0.23 289Chile 0.21 0.11 224 0.30 0.23 712Colombia 0.09 0.08 37 0.10 0.03 291Mexico 0.33 0.33 119 0.45 0.45 855Peru 0.47 0.44 105 0.56 0.57 208
Total 0.31 0.27 574 0.35 0.31 2414
Foreign High Exporter Domestic High Exporter
Mean Median Observations Mean Median ObservationsArgentina 0.61 0.69 25 0.47 0.51 27Brazil 0.35 0.41 19 0.29 0.25 238Chile 0.21 0.11 62 0.40 0.37 352Colombia 0.13 0.15 8 0.16 0.07 107Mexico 0.33 0.31 42 0.55 0.58 445Peru 0.53 0.54 46 0.65 0.70 108
Total 0.37 0.35 202 0.43 0.43 1277
The table reports the mean, median and number of observations of the variable ShortDollarDebt used in the analysis. This
variable is the ratio of short-term dollar denominated liabilities to short-term debt. Exporter is a dummy variable that takes
the value of 1 if the firm reports any export revenue at any time during the three years prior to the crisis and 0 otherwise.
Foreign is a dummy variable that takes the value of 1 if the firm is more than 50% owned at any time during the three years
prior to the crisis and 0 otherwise. HighExporter is a dummy variable that takes the value of 1 if the firm reports export
revenue higher than 10% of sales at any time during the three years prior to the crisis and 0 otherwise.
38
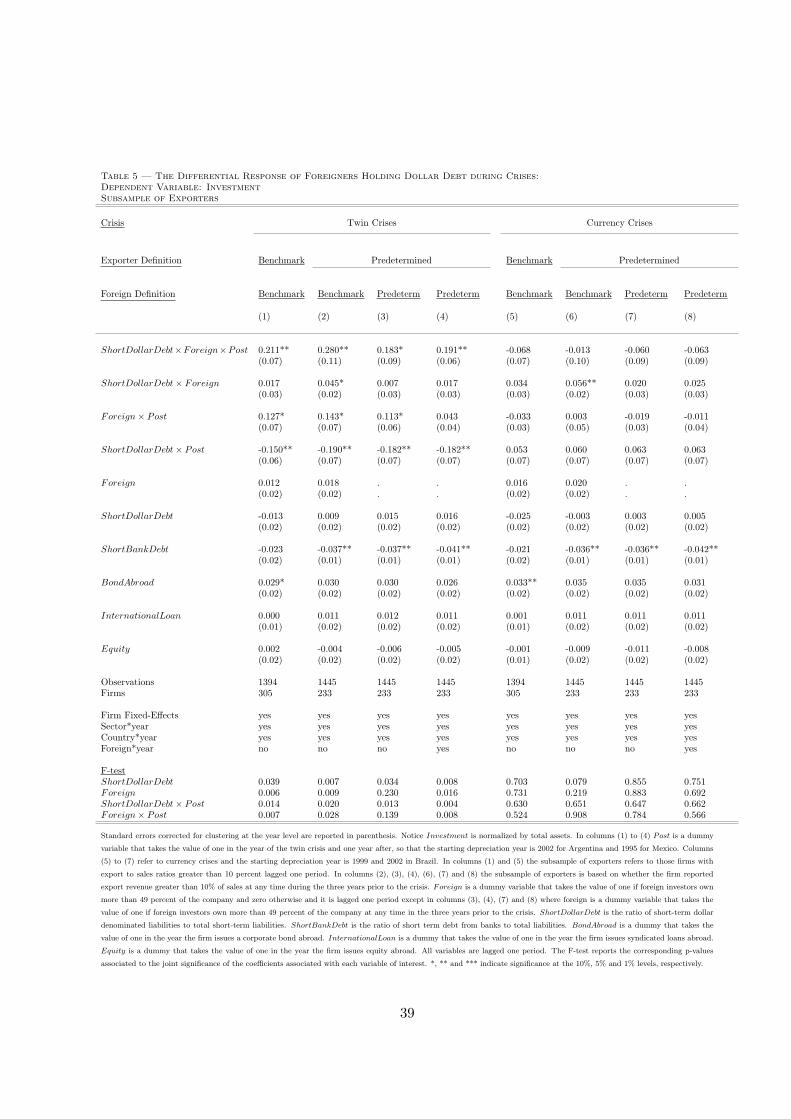
Table 5 — The Differential Response of Foreigners Holding Dollar Debt during Crises:Dependent Variable: InvestmentSubsample of Exporters
Crisis Twin Crises Currency Crises
Exporter Definition Benchmark Predetermined Benchmark Predetermined
Foreign Definition Benchmark Benchmark Predeterm Predeterm Benchmark Benchmark Predeterm Predeterm
(1) (2) (3) (4) (5) (6) (7) (8)
ShortDollarDebt×Foreign×Post 0.211** 0.280** 0.183* 0.191** -0.068 -0.013 -0.060 -0.063(0.07) (0.11) (0.09) (0.06) (0.07) (0.10) (0.09) (0.09)
ShortDollarDebt× Foreign 0.017 0.045* 0.007 0.017 0.034 0.056** 0.020 0.025(0.03) (0.02) (0.03) (0.03) (0.03) (0.02) (0.03) (0.03)
Foreign× Post 0.127* 0.143* 0.113* 0.043 -0.033 0.003 -0.019 -0.011(0.07) (0.07) (0.06) (0.04) (0.03) (0.05) (0.03) (0.04)
ShortDollarDebt× Post -0.150** -0.190** -0.182** -0.182** 0.053 0.060 0.063 0.063(0.06) (0.07) (0.07) (0.07) (0.07) (0.07) (0.07) (0.07)
Foreign 0.012 0.018 . . 0.016 0.020 . .(0.02) (0.02) . . (0.02) (0.02) . .
ShortDollarDebt -0.013 0.009 0.015 0.016 -0.025 -0.003 0.003 0.005(0.02) (0.02) (0.02) (0.02) (0.02) (0.02) (0.02) (0.02)
ShortBankDebt -0.023 -0.037** -0.037** -0.041** -0.021 -0.036** -0.036** -0.042**(0.02) (0.01) (0.01) (0.01) (0.02) (0.01) (0.01) (0.01)
BondAbroad 0.029* 0.030 0.030 0.026 0.033** 0.035 0.035 0.031(0.02) (0.02) (0.02) (0.02) (0.02) (0.02) (0.02) (0.02)
InternationalLoan 0.000 0.011 0.012 0.011 0.001 0.011 0.011 0.011(0.01) (0.02) (0.02) (0.02) (0.01) (0.02) (0.02) (0.02)
Equity 0.002 -0.004 -0.006 -0.005 -0.001 -0.009 -0.011 -0.008(0.02) (0.02) (0.02) (0.02) (0.01) (0.02) (0.02) (0.02)
Observations 1394 1445 1445 1445 1394 1445 1445 1445Firms 305 233 233 233 305 233 233 233
Firm Fixed-Effects yes yes yes yes yes yes yes yesSector*year yes yes yes yes yes yes yes yesCountry*year yes yes yes yes yes yes yes yesForeign*year no no no yes no no no yes
F-testShortDollarDebt 0.039 0.007 0.034 0.008 0.703 0.079 0.855 0.751Foreign 0.006 0.009 0.230 0.016 0.731 0.219 0.883 0.692ShortDollarDebt× Post 0.014 0.020 0.013 0.004 0.630 0.651 0.647 0.662Foreign× Post 0.007 0.028 0.139 0.008 0.524 0.908 0.784 0.566
Standard errors corrected for clustering at the year level are reported in parenthesis. Notice Investment is normalized by total assets. In columns (1) to (4) Post is a dummy
variable that takes the value of one in the year of the twin crisis and one year after, so that the starting depreciation year is 2002 for Argentina and 1995 for Mexico. Columns
(5) to (7) refer to currency crises and the starting depreciation year is 1999 and 2002 in Brazil. In columns (1) and (5) the subsample of exporters refers to those firms with
export to sales ratios greater than 10 percent lagged one period. In columns (2), (3), (4), (6), (7) and (8) the subsample of exporters is based on whether the firm reported
export revenue greater than 10% of sales at any time during the three years prior to the crisis. Foreign is a dummy variable that takes the value of one if foreign investors own
more than 49 percent of the company and zero otherwise and it is lagged one period except in columns (3), (4), (7) and (8) where foreign is a dummy variable that takes the
value of one if foreign investors own more than 49 percent of the company at any time in the three years prior to the crisis. ShortDollarDebt is the ratio of short-term dollar
denominated liabilities to total short-term liabilities. ShortBankDebt is the ratio of short term debt from banks to total liabilities. BondAbroad is a dummy that takes the
value of one in the year the firm issues a corporate bond abroad. InternationalLoan is a dummy that takes the value of one in the year the firm issues syndicated loans abroad.
Equity is a dummy that takes the value of one in the year the firm issues equity abroad. All variables are lagged one period. The F-test reports the corresponding p-values
associated to the joint significance of the coefficients associated with each variable of interest. *, ** and *** indicate significance at the 10%, 5% and 1% levels, respectively.
39
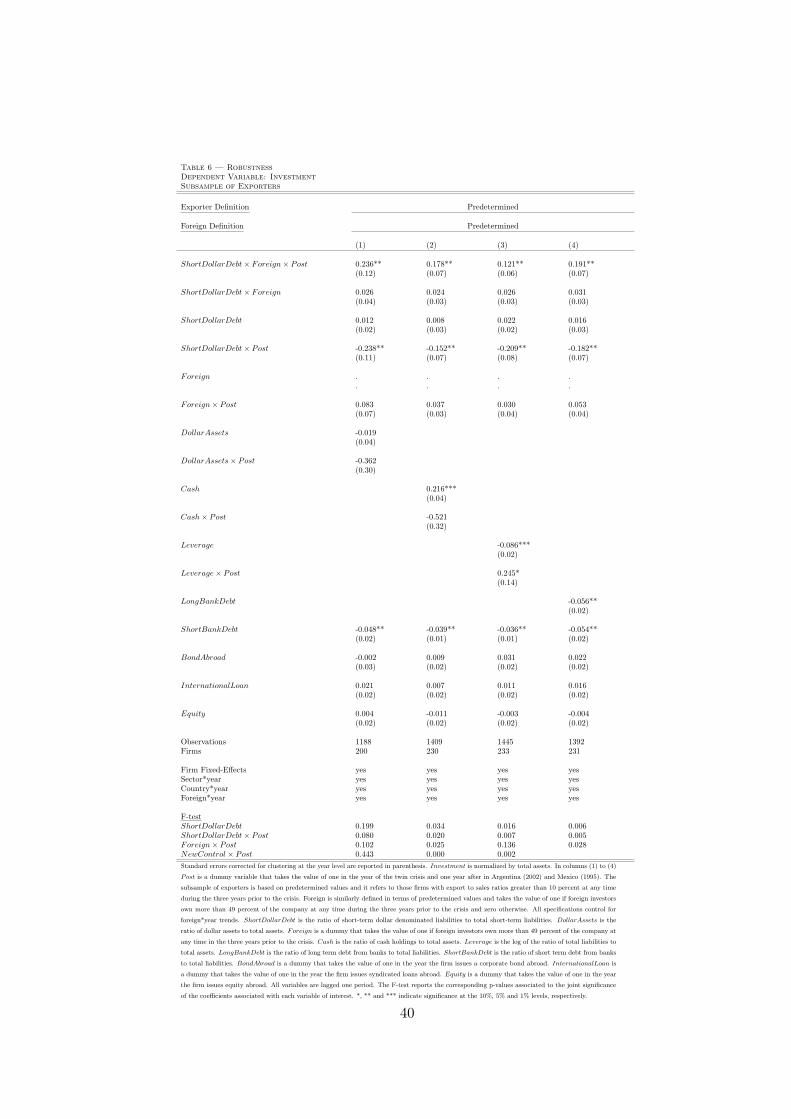
Table 6 — RobustnessDependent Variable: InvestmentSubsample of Exporters
Exporter Definition Predetermined
Foreign Definition Predetermined
(1) (2) (3) (4)
ShortDollarDebt× Foreign× Post 0.236** 0.178** 0.121** 0.191**(0.12) (0.07) (0.06) (0.07)
ShortDollarDebt× Foreign 0.026 0.024 0.026 0.031(0.04) (0.03) (0.03) (0.03)
ShortDollarDebt 0.012 0.008 0.022 0.016(0.02) (0.03) (0.02) (0.03)
ShortDollarDebt× Post -0.238** -0.152** -0.209** -0.182**(0.11) (0.07) (0.08) (0.07)
Foreign . . . .. . . .
Foreign× Post 0.083 0.037 0.030 0.053(0.07) (0.03) (0.04) (0.04)
DollarAssets -0.019(0.04)
DollarAssets× Post -0.362(0.30)
Cash 0.216***(0.04)
Cash× Post -0.521(0.32)
Leverage -0.086***(0.02)
Leverage× Post 0.245*(0.14)
LongBankDebt -0.056**(0.02)
ShortBankDebt -0.048** -0.039** -0.036** -0.054**(0.02) (0.01) (0.01) (0.02)
BondAbroad -0.002 0.009 0.031 0.022(0.03) (0.02) (0.02) (0.02)
InternationalLoan 0.021 0.007 0.011 0.016(0.02) (0.02) (0.02) (0.02)
Equity 0.004 -0.011 -0.003 -0.004(0.02) (0.02) (0.02) (0.02)
Observations 1188 1409 1445 1392Firms 200 230 233 231
Firm Fixed-Effects yes yes yes yesSector*year yes yes yes yesCountry*year yes yes yes yesForeign*year yes yes yes yes
F-testShortDollarDebt 0.199 0.034 0.016 0.006ShortDollarDebt× Post 0.080 0.020 0.007 0.005Foreign× Post 0.102 0.025 0.136 0.028NewControl × Post 0.443 0.000 0.002Standard errors corrected for clustering at the year level are reported in parenthesis. Investment is normalized by total assets. In columns (1) to (4)
Post is a dummy variable that takes the value of one in the year of the twin crisis and one year after in Argentina (2002) and Mexico (1995). The
subsample of exporters is based on predetermined values and it refers to those firms with export to sales ratios greater than 10 percent at any time
during the three years prior to the crisis. Foreign is similarly defined in terms of predetermined values and takes the value of one if foreign investors
own more than 49 percent of the company at any time during the three years prior to the crisis and zero otherwise. All specifications control for
foreign*year trends. ShortDollarDebt is the ratio of short-term dollar denominated liabilities to total short-term liabilities. DollarAssets is the
ratio of dollar assets to total assets. Foreign is a dummy that takes the value of one if foreign investors own more than 49 percent of the company at
any time in the three years prior to the crisis. Cash is the ratio of cash holdings to total assets. Leverage is the log of the ratio of total liabilities to
total assets. LongBankDebt is the ratio of long term debt from banks to total liabilities. ShortBankDebt is the ratio of short term debt from banks
to total liabilities. BondAbroad is a dummy that takes the value of one in the year the firm issues a corporate bond abroad. InternationalLoan is
a dummy that takes the value of one in the year the firm issues syndicated loans abroad. Equity is a dummy that takes the value of one in the year
the firm issues equity abroad. All variables are lagged one period. The F-test reports the corresponding p-values associated to the joint significance
of the coefficients associated with each variable of interest. *, ** and *** indicate significance at the 10%, 5% and 1% levels, respectively.
40
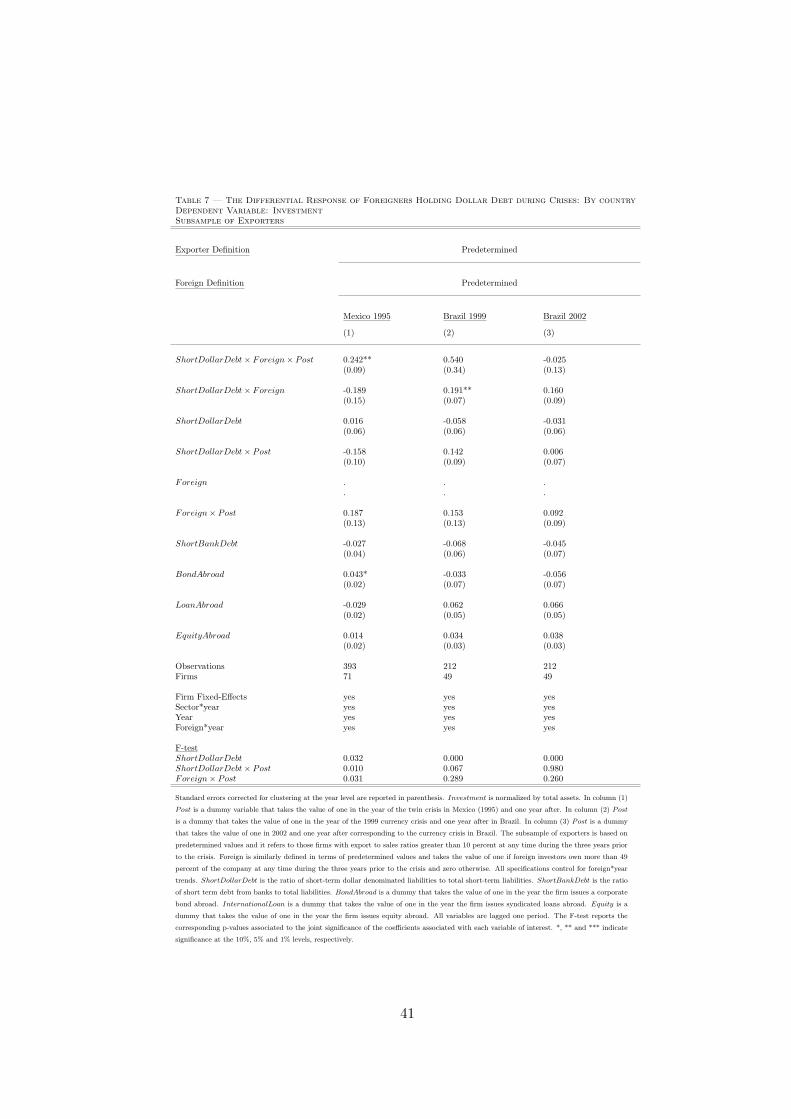
Table 7 — The Differential Response of Foreigners Holding Dollar Debt during Crises: By countryDependent Variable: InvestmentSubsample of Exporters
Exporter Definition Predetermined
Foreign Definition Predetermined
Mexico 1995 Brazil 1999 Brazil 2002
(1) (2) (3)
ShortDollarDebt× Foreign× Post 0.242** 0.540 -0.025(0.09) (0.34) (0.13)
ShortDollarDebt× Foreign -0.189 0.191** 0.160(0.15) (0.07) (0.09)
ShortDollarDebt 0.016 -0.058 -0.031(0.06) (0.06) (0.06)
ShortDollarDebt× Post -0.158 0.142 0.006(0.10) (0.09) (0.07)
Foreign . . .. . .
Foreign× Post 0.187 0.153 0.092(0.13) (0.13) (0.09)
ShortBankDebt -0.027 -0.068 -0.045(0.04) (0.06) (0.07)
BondAbroad 0.043* -0.033 -0.056(0.02) (0.07) (0.07)
LoanAbroad -0.029 0.062 0.066(0.02) (0.05) (0.05)
EquityAbroad 0.014 0.034 0.038(0.02) (0.03) (0.03)
Observations 393 212 212Firms 71 49 49
Firm Fixed-Effects yes yes yesSector*year yes yes yesYear yes yes yesForeign*year yes yes yes
F-testShortDollarDebt 0.032 0.000 0.000ShortDollarDebt× Post 0.010 0.067 0.980Foreign× Post 0.031 0.289 0.260
Standard errors corrected for clustering at the year level are reported in parenthesis. Investment is normalized by total assets. In column (1)
Post is a dummy variable that takes the value of one in the year of the twin crisis in Mexico (1995) and one year after. In column (2) Post
is a dummy that takes the value of one in the year of the 1999 currency crisis and one year after in Brazil. In column (3) Post is a dummy
that takes the value of one in 2002 and one year after corresponding to the currency crisis in Brazil. The subsample of exporters is based on
predetermined values and it refers to those firms with export to sales ratios greater than 10 percent at any time during the three years prior
to the crisis. Foreign is similarly defined in terms of predetermined values and takes the value of one if foreign investors own more than 49
percent of the company at any time during the three years prior to the crisis and zero otherwise. All specifications control for foreign*year
trends. ShortDollarDebt is the ratio of short-term dollar denominated liabilities to total short-term liabilities. ShortBankDebt is the ratio
of short term debt from banks to total liabilities. BondAbroad is a dummy that takes the value of one in the year the firm issues a corporate
bond abroad. InternationalLoan is a dummy that takes the value of one in the year the firm issues syndicated loans abroad. Equity is a
dummy that takes the value of one in the year the firm issues equity abroad. All variables are lagged one period. The F-test reports the
corresponding p-values associated to the joint significance of the coefficients associated with each variable of interest. *, ** and *** indicate
significance at the 10%, 5% and 1% levels, respectively.
41
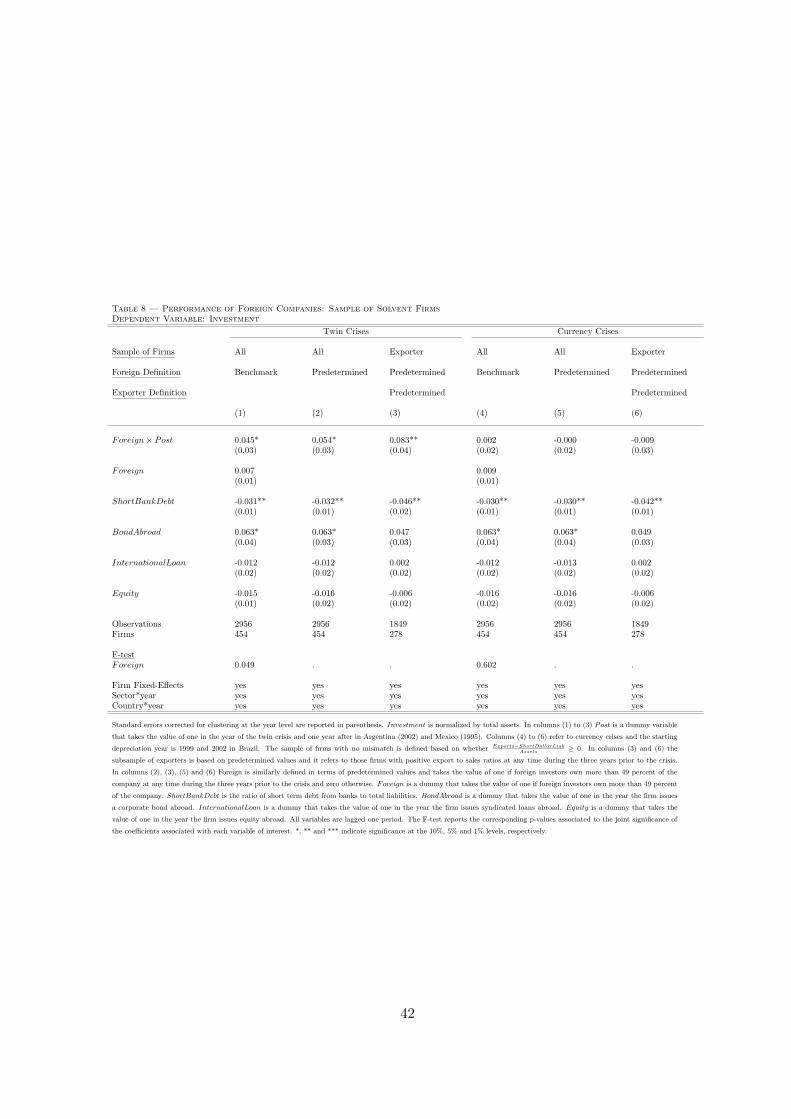
Table 8 — Performance of Foreign Companies: Sample of Solvent FirmsDependent Variable: Investment
Twin Crises Currency Crises
Sample of Firms All All Exporter All All Exporter
Foreign Definition Benchmark Predetermined Predetermined Benchmark Predetermined Predetermined
Exporter Definition Predetermined Predetermined
(1) (2) (3) (4) (5) (6)
Foreign× Post 0.045* 0.054* 0.083** 0.002 -0.000 -0.009(0.03) (0.03) (0.04) (0.02) (0.02) (0.03)
Foreign 0.007 0.009(0.01) (0.01)
ShortBankDebt -0.031** -0.032** -0.046** -0.030** -0.030** -0.042**(0.01) (0.01) (0.02) (0.01) (0.01) (0.01)
BondAbroad 0.063* 0.063* 0.047 0.063* 0.063* 0.049(0.04) (0.03) (0.03) (0.04) (0.04) (0.03)
InternationalLoan -0.012 -0.012 0.002 -0.012 -0.013 0.002(0.02) (0.02) (0.02) (0.02) (0.02) (0.02)
Equity -0.015 -0.016 -0.006 -0.016 -0.016 -0.006(0.01) (0.02) (0.02) (0.02) (0.02) (0.02)
Observations 2956 2956 1849 2956 2956 1849Firms 454 454 278 454 454 278
F-testForeign 0.049 . . 0.602 . .
Firm Fixed-Effects yes yes yes yes yes yesSector*year yes yes yes yes yes yesCountry*year yes yes yes yes yes yes
Standard errors corrected for clustering at the year level are reported in parenthesis. Investment is normalized by total assets. In columns (1) to (3) Post is a dummy variable
that takes the value of one in the year of the twin crisis and one year after in Argentina (2002) and Mexico (1995). Columns (4) to (6) refer to currency crises and the starting
depreciation year is 1999 and 2002 in Brazil. The sample of firms with no mismatch is defined based on whether Exports−ShortDollarLiabAssets
≥ 0. In columns (3) and (6) the
subsample of exporters is based on predetermined values and it refers to those firms with positive export to sales ratios at any time during the three years prior to the crisis.
In columns (2), (3), (5) and (6) Foreign is similarly defined in terms of predetermined values and takes the value of one if foreign investors own more than 49 percent of the
company at any time during the three years prior to the crisis and zero otherwise. Foreign is a dummy that takes the value of one if foreign investors own more than 49 percent
of the company. ShortBankDebt is the ratio of short term debt from banks to total liabilities. BondAbroad is a dummy that takes the value of one in the year the firm issues
a corporate bond abroad. InternationalLoan is a dummy that takes the value of one in the year the firm issues syndicated loans abroad. Equity is a dummy that takes the
value of one in the year the firm issues equity abroad. All variables are lagged one period. The F-test reports the corresponding p-values associated to the joint significance of
the coefficients associated with each variable of interest. *, ** and *** indicate significance at the 10%, 5% and 1% levels, respectively.
42
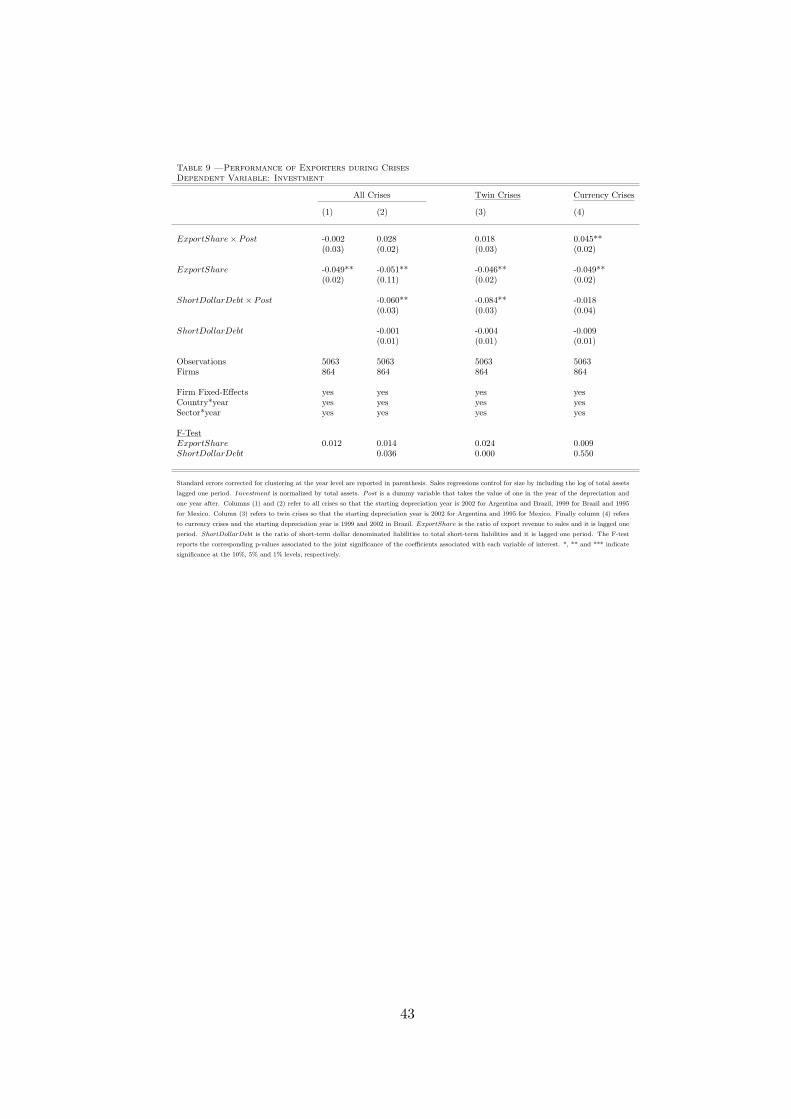
Table 9 —Performance of Exporters during CrisesDependent Variable: Investment
All Crises Twin Crises Currency Crises
(1) (2) (3) (4)
ExportShare× Post -0.002 0.028 0.018 0.045**(0.03) (0.02) (0.03) (0.02)
ExportShare -0.049** -0.051** -0.046** -0.049**(0.02) (0.11) (0.02) (0.02)
ShortDollarDebt× Post -0.060** -0.084** -0.018(0.03) (0.03) (0.04)
ShortDollarDebt -0.001 -0.004 -0.009(0.01) (0.01) (0.01)
Observations 5063 5063 5063 5063Firms 864 864 864 864
Firm Fixed-Effects yes yes yes yesCountry*year yes yes yes yesSector*year yes yes yes yes
F-TestExportShare 0.012 0.014 0.024 0.009ShortDollarDebt 0.036 0.000 0.550
Standard errors corrected for clustering at the year level are reported in parenthesis. Sales regressions control for size by including the log of total assets
lagged one period. Investment is normalized by total assets. Post is a dummy variable that takes the value of one in the year of the depreciation and
one year after. Columns (1) and (2) refer to all crises so that the starting depreciation year is 2002 for Argentina and Brazil, 1999 for Brazil and 1995
for Mexico. Column (3) refers to twin crises so that the starting depreciation year is 2002 for Argentina and 1995 for Mexico. Finally column (4) refers
to currency crises and the starting depreciation year is 1999 and 2002 in Brazil. ExportShare is the ratio of export revenue to sales and it is lagged one
period. ShortDollarDebt is the ratio of short-term dollar denominated liabilities to total short-term liabilities and it is lagged one period. The F-test
reports the corresponding p-values associated to the joint significance of the coefficients associated with each variable of interest. *, ** and *** indicate
significance at the 10%, 5% and 1% levels, respectively.
43
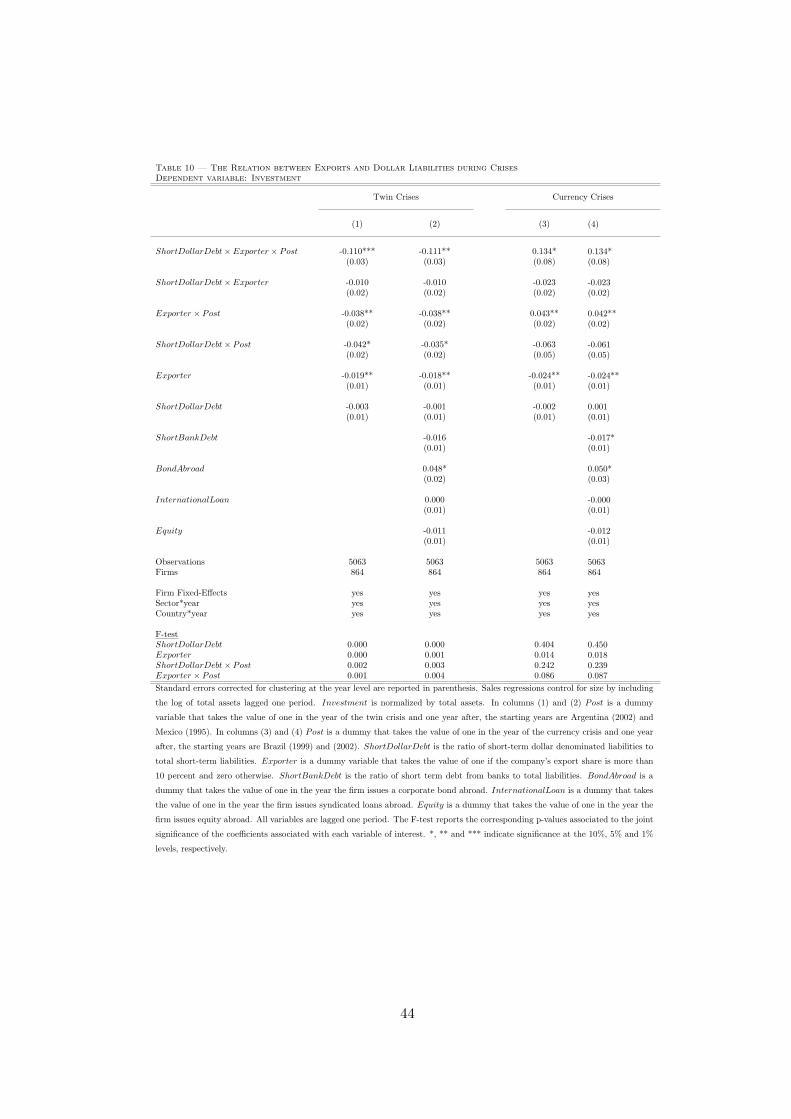
Table 10 — The Relation between Exports and Dollar Liabilities during CrisesDependent variable: Investment
Twin Crises Currency Crises
(1) (2) (3) (4)
ShortDollarDebt×Exporter × Post -0.110*** -0.111** 0.134* 0.134*(0.03) (0.03) (0.08) (0.08)
ShortDollarDebt×Exporter -0.010 -0.010 -0.023 -0.023(0.02) (0.02) (0.02) (0.02)
Exporter × Post -0.038** -0.038** 0.043** 0.042**(0.02) (0.02) (0.02) (0.02)
ShortDollarDebt× Post -0.042* -0.035* -0.063 -0.061(0.02) (0.02) (0.05) (0.05)
Exporter -0.019** -0.018** -0.024** -0.024**(0.01) (0.01) (0.01) (0.01)
ShortDollarDebt -0.003 -0.001 -0.002 0.001(0.01) (0.01) (0.01) (0.01)
ShortBankDebt -0.016 -0.017*(0.01) (0.01)
BondAbroad 0.048* 0.050*(0.02) (0.03)
InternationalLoan 0.000 -0.000(0.01) (0.01)
Equity -0.011 -0.012(0.01) (0.01)
Observations 5063 5063 5063 5063Firms 864 864 864 864
Firm Fixed-Effects yes yes yes yesSector*year yes yes yes yesCountry*year yes yes yes yes
F-testShortDollarDebt 0.000 0.000 0.404 0.450Exporter 0.000 0.001 0.014 0.018ShortDollarDebt× Post 0.002 0.003 0.242 0.239Exporter × Post 0.001 0.004 0.086 0.087Standard errors corrected for clustering at the year level are reported in parenthesis. Sales regressions control for size by including
the log of total assets lagged one period. Investment is normalized by total assets. In columns (1) and (2) Post is a dummy
variable that takes the value of one in the year of the twin crisis and one year after, the starting years are Argentina (2002) and
Mexico (1995). In columns (3) and (4) Post is a dummy that takes the value of one in the year of the currency crisis and one year
after, the starting years are Brazil (1999) and (2002). ShortDollarDebt is the ratio of short-term dollar denominated liabilities to
total short-term liabilities. Exporter is a dummy variable that takes the value of one if the company’s export share is more than
10 percent and zero otherwise. ShortBankDebt is the ratio of short term debt from banks to total liabilities. BondAbroad is a
dummy that takes the value of one in the year the firm issues a corporate bond abroad. InternationalLoan is a dummy that takes
the value of one in the year the firm issues syndicated loans abroad. Equity is a dummy that takes the value of one in the year the
firm issues equity abroad. All variables are lagged one period. The F-test reports the corresponding p-values associated to the joint
significance of the coefficients associated with each variable of interest. *, ** and *** indicate significance at the 10%, 5% and 1%
levels, respectively.
44
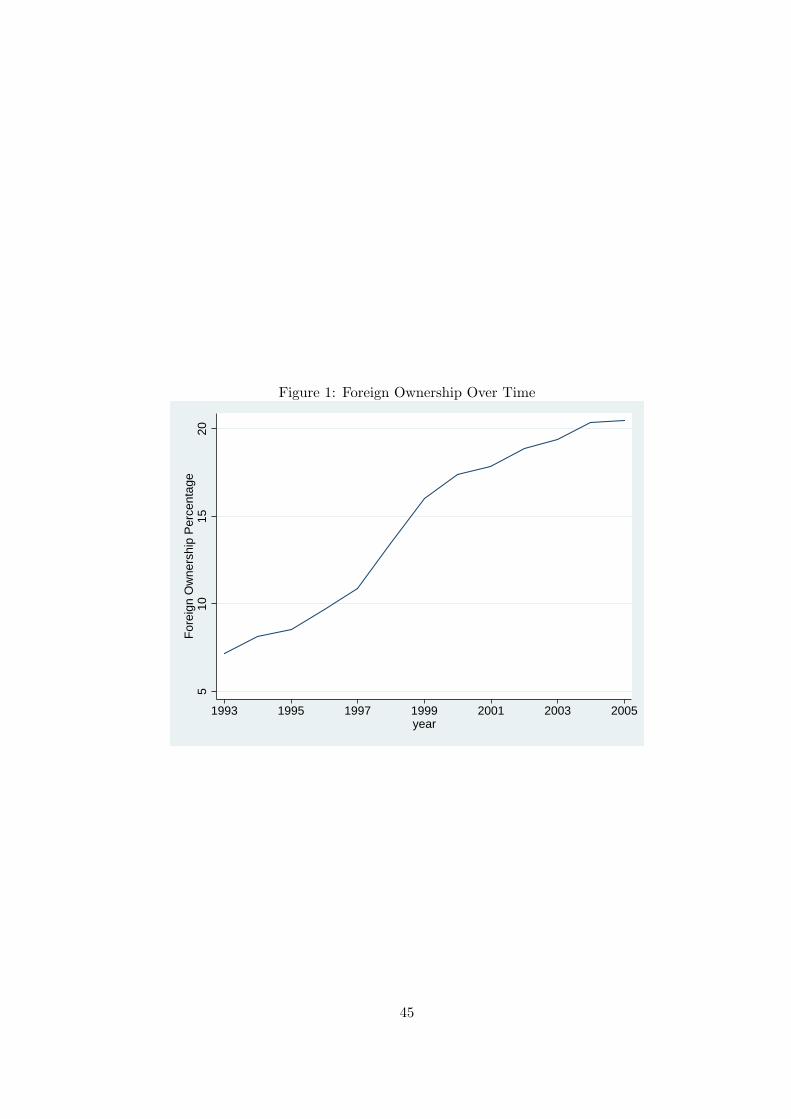
Figure 1: Foreign Ownership Over Time
510
1520
For
eign
Ow
ners
hip
Per
cent
age
1993 1995 1997 1999 2001 2003 2005year
45
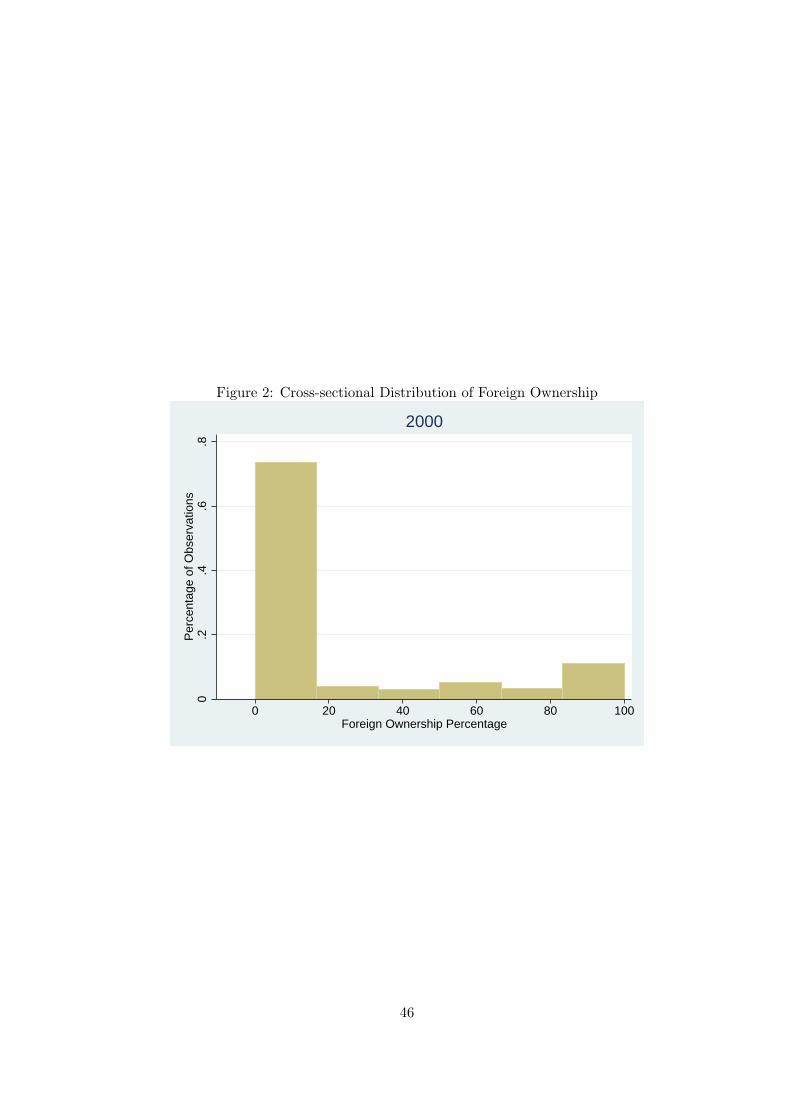
Figure 2: Cross-sectional Distribution of Foreign Ownership
0.2
.4.6
.8P
erce
ntag
e of
Obs
erva
tions
0 20 40 60 80 100Foreign Ownership Percentage
2000
46
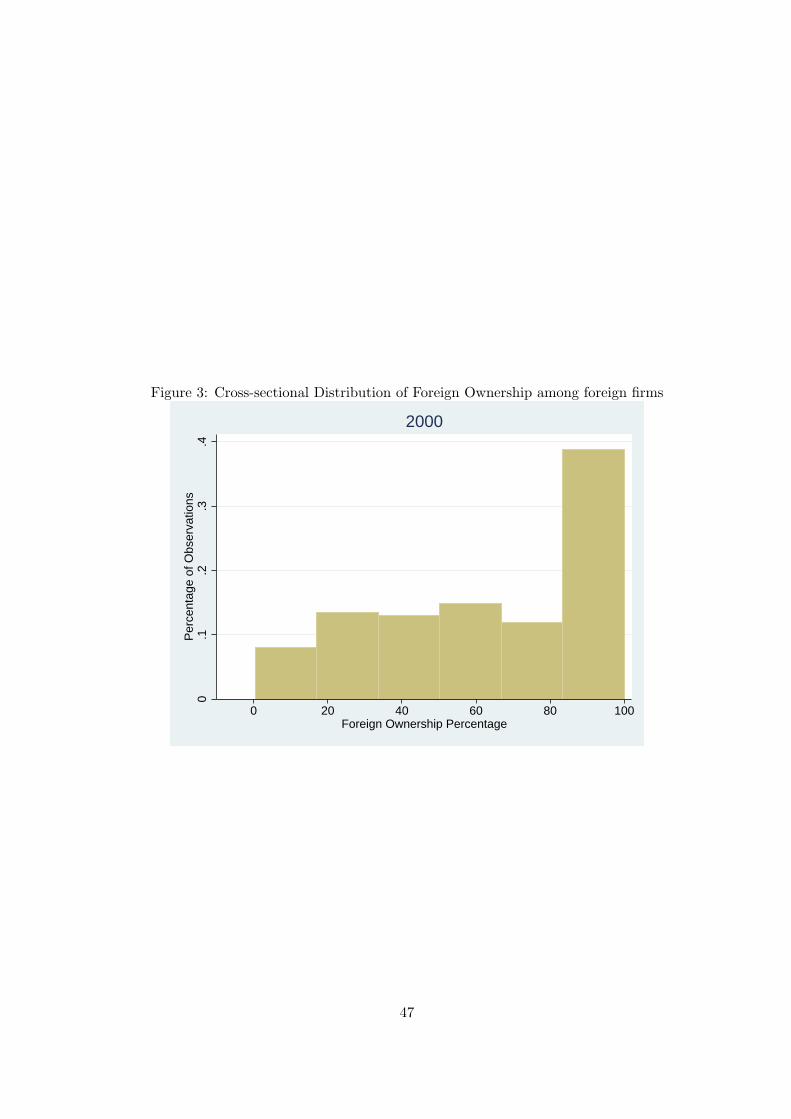
Figure 3: Cross-sectional Distribution of Foreign Ownership among foreign firms
0.1
.2.3
.4P
erce
ntag
e of
Obs
erva
tions
0 20 40 60 80 100Foreign Ownership Percentage
2000
47
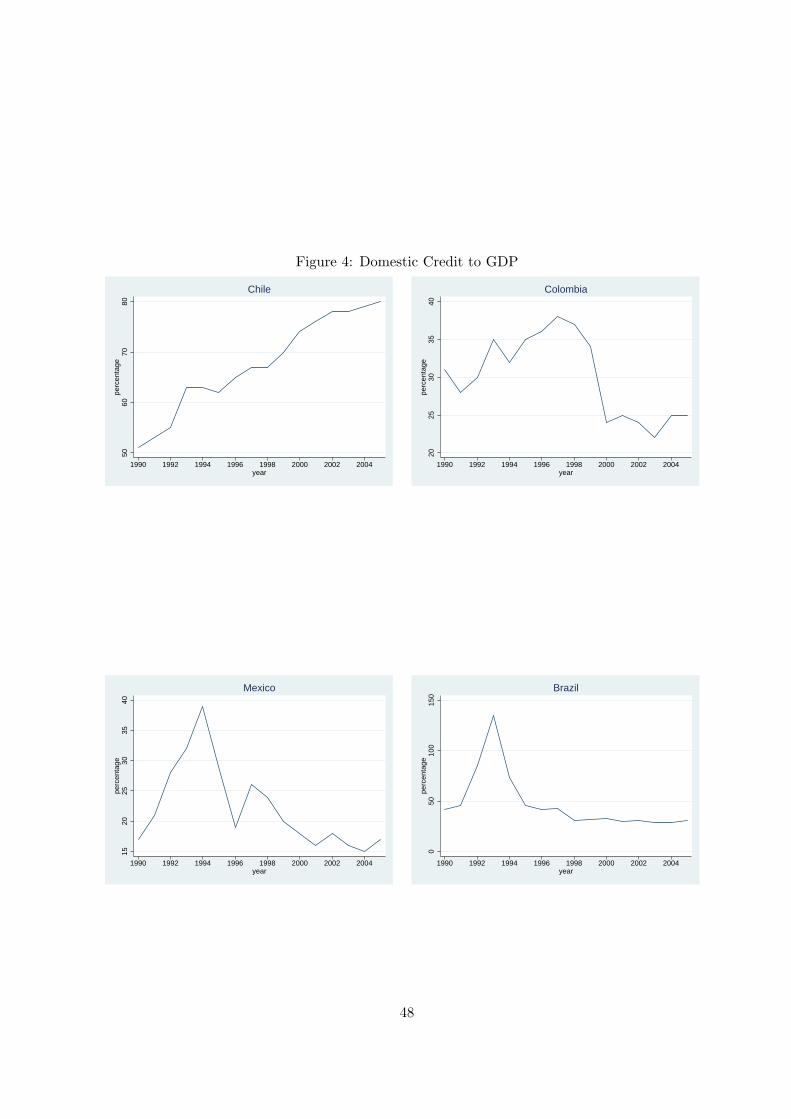
Figure 4: Domestic Credit to GDP
5060
7080
perc
enta
ge
1990 1992 1994 1996 1998 2000 2002 2004year
Chile
2025
3035
40pe
rcen
tage
1990 1992 1994 1996 1998 2000 2002 2004year
Colombia
1520
2530
3540
perc
enta
ge
1990 1992 1994 1996 1998 2000 2002 2004year
Mexico
050
100
150
perc
enta
ge
1990 1992 1994 1996 1998 2000 2002 2004year
Brazil
48
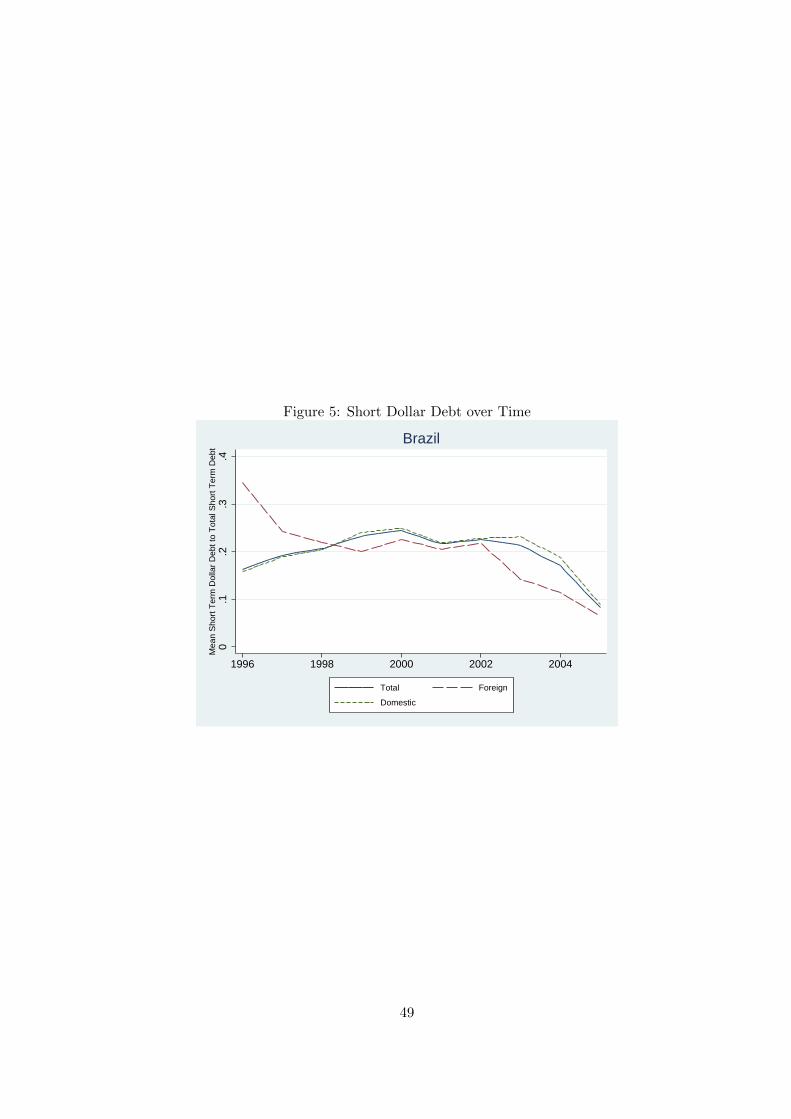
Figure 5: Short Dollar Debt over Time
0.1
.2.3
.4M
ean
Sho
rt T
erm
Dol
lar
Deb
t to
Tot
al S
hort
Ter
m D
ebt
1996 1998 2000 2002 2004
Total Foreign
Domestic
Brazil
49
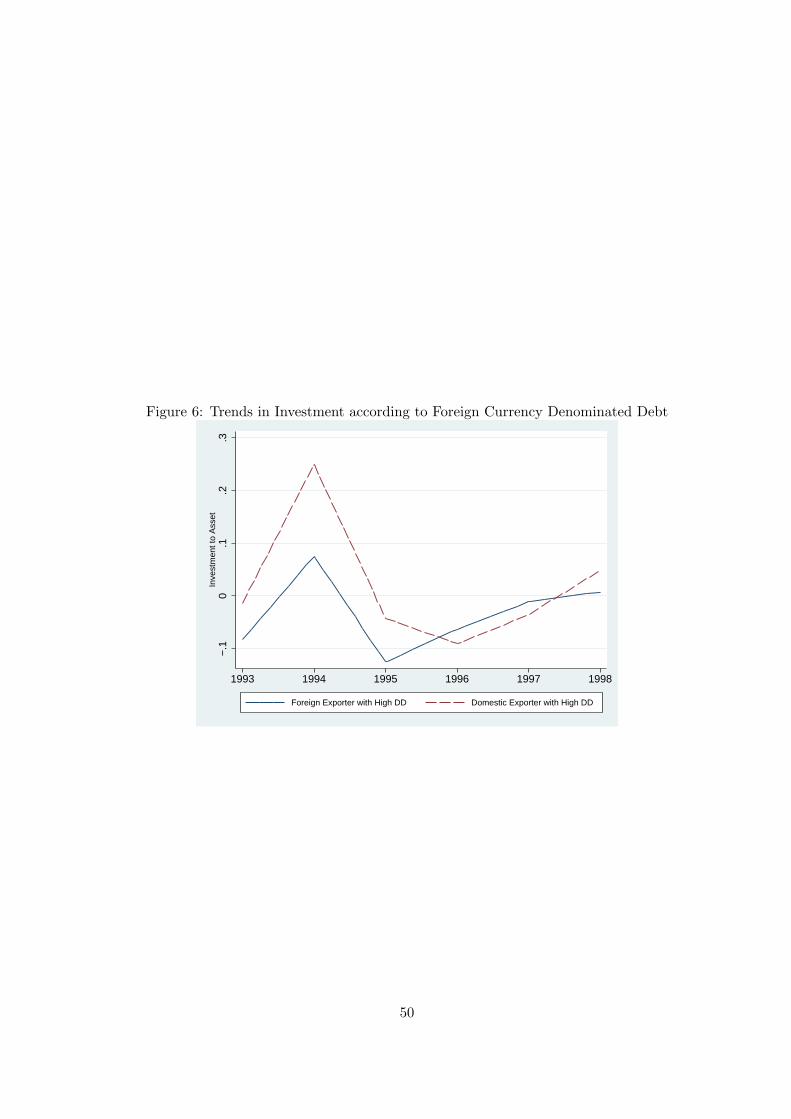
Figure 6: Trends in Investment according to Foreign Currency Denominated Debt
−.1
0.1
.2.3
Inve
stm
ent t
o A
sset
1993 1994 1995 1996 1997 1998
Foreign Exporter with High DD Domestic Exporter with High DD
50
A Cleaning Procedure
We drop all firm/year observations in which the accounting data are not self-consistent. In par-
ticular, we drop observations if dollar liabilities (assets) exceed total liabilities (assets) or if the
ratio of exports to sales is greater than one. We drop firm-year observations with zero or missing
sales. Finally, we drop firm-year observations in the top (low) 1 percent of the distribution of the
ratio of sales to total assets and total liabilities to total assets. These adjustments led to drop-
ping 16 percent of the remaining firm-year observations. To ensure that results are not driven by
outliers, we then dropped all firm/year observations for explanatory variables that exceeded the
sample mean by more than five standard deviations. We compute the change in total assets, sales
and physical capital stock and construct a Z-score using the sample mean and standard deviation
for each country/year. We drop firm/year observations that have absolute value of Z > 5. We
drop firm/year observations for which the ratio of investment over assets is greater than one or
less than minus one. These controls for outliers (either because of inadequate accounting, typing
errors or extreme values). These adjustments led to dropping 19 percent of the remaining firm-year
observations. These exclusions leave us with complete information for an unbalanced panel of 6,175
firm-year observations, which consist of 931 firms with an average of around 7 years each. Notice
through out the analysis we use lagged values of the main variables and therefore, we loose one year.
Finally, data on additional controls included later on in the estimation leaves us with a sample of
5,063 observations or 864 firms.
B Foreign Ownership Variable
We gathered information on all cross-border Mergers and Acquisitions (M&A) in Latin America
between 1981 and 2005 using the SDC Platinum database from Thompson (for the period 1981 to
2001) and Zephyr from Bureau Van Dijk (from 1997 to 2005). Given that there was no common firm-
identifier across databases, we used a search algorithm based on firms’ names and economic sectors
to match M&A transactions to firms in our sample. We took into account possible changes in firms’
names drawing on a list of company name changes from the Economatica database. In addition, we
doubled checked with various internet resources, including the information provided by the company
on its own web page and that of the Funding Universe website (www.fundinguniverse.com/company-
histories/) that provides information on companies’ history.
We construct a continuous, time-varying measure of foreign ownership based on the percentage
51
fraction of shares held by foreign and domestic investors in each year. For example, the M&A
databases would identify an M&A transaction where a foreign company that already owned 50
percent of a company in a target country, buys 10 percent more of that company. Our foreign
ownership variable would be 50 until the time of the transaction and 60 thereafter. In the case where
we had more than one foreign investor in the same year we faced the problem of not knowing if the
foreign companies were buying from each other, from other domestic investors, or rather directly
from the target company. In those cases we checked the company history profile, the Funding
Universe website and other specialized newspaper information. In the rare case that information
was not available, we decided on a conservative measure of foreign ownership and assumed that the
foreign companies bought from each other. We then merged this information with annual balance
sheet data. In the few cases of target firms being renamed after the acquisition, we kept the old id
number rather than creating a new company after the M&A.
Of course there might be ways other than M&As for foreign investors to invest in firms. First,
foreign ownership acquisitions can arise by means of IPOs, venture capital activity, or private equity
deals, which are not covered in M&As hence in our procedure. Second, several foreign-owned firms
could have been established before 1980, and not involved in a M&A since then. To remedy this,
we used the Corporations Affiliations database to identify Latin American firms in our sample that
are affiliates, subsidiaries and/or divisions of global multinational firms. This database contains
international public and private business profiles and corporate linkage (“who owns whom”) for
approximately 184,000 public and private companies worldwide. Notice, in addition to the “formal”
sources of foreign ownership data we checked firm by firm company’s history. After this extensive
search of all these alternative sources, if we find no evidence of foreign ownership we assume the
company is domestic.
C Appendix Tables
52
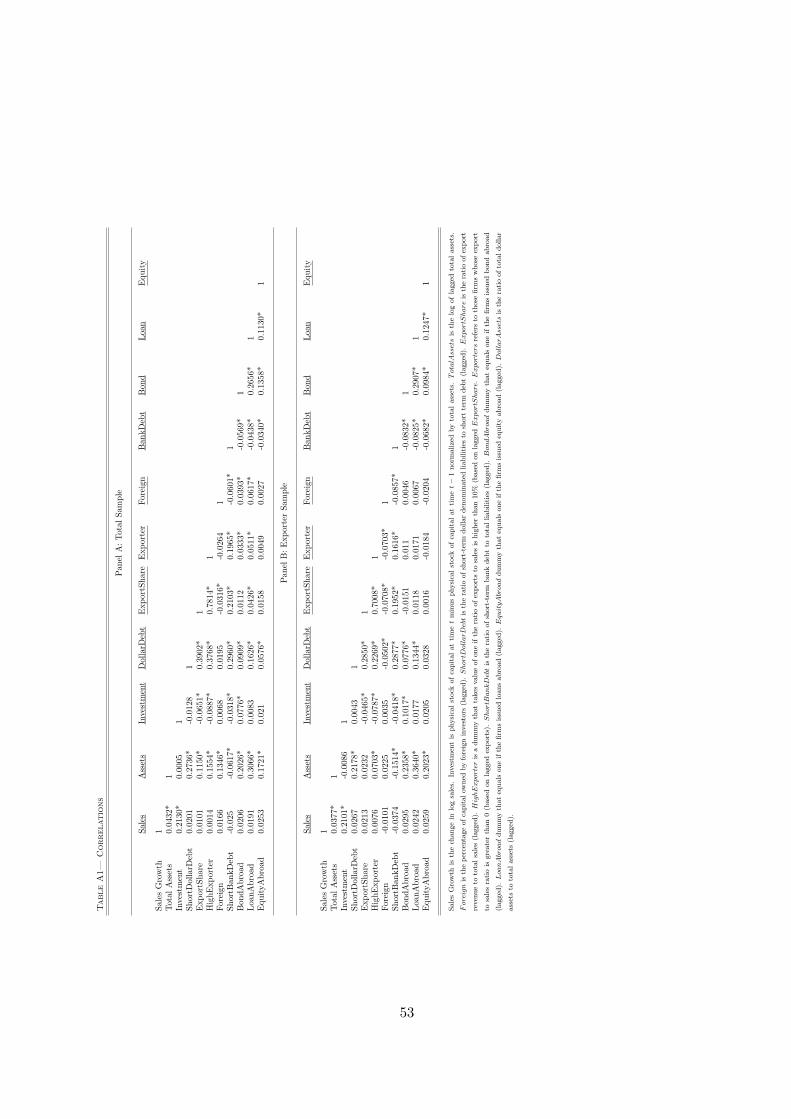
Table
A1—
Correlatio
ns
Pan
elA
:Tot
alSa
mpl
e
Sale
sA
sset
sIn
vest
men
tD
olla
rDeb
tE
xpor
tSha
reE
xpor
ter
Fore
ign
Ban
kDeb
tB
ond
Loa
nE
quity
Sale
sG
row
th1
Tot
alA
sset
s0.
0432
*1
Inve
stm
ent
0.21
30*
0.00
051
Shor
tDol
larD
ebt
0.02
010.
2736
*-0
.012
81
Exp
ortS
hare
0.01
010.
1150
*-0
.065
1*0.
3902
*1
Hig
hExp
orte
r0.
0014
0.15
54*
-0.0
887*
0.37
68*
0.78
14*
1Fo
reig
n0.
0166
0.13
46*
0.00
680.
0195
-0.0
316*
-0.0
264
1Sh
ortB
ankD
ebt
-0.0
25-0
.061
7*-0
.031
8*0.
2960
*0.
2103
*0.
1965
*-0
.060
1*1
Bon
dAbr
oad
0.02
060.
2026
*0.
0776
*0.
0909
*0.
0112
0.03
33*
0.03
93*
-0.0
569*
1Loa
nAbr
oad
0.01
910.
3066
*0.
0083
0.16
26*
0.04
26*
0.05
11*
0.06
17*
-0.0
438*
0.26
56*
1E
quityA
broa
d0.
0253
0.17
21*
0.02
10.
0576
*0.
0158
0.00
490.
0027
-0.0
340*
0.13
58*
0.11
30*
1
Pan
elB
:E
xpor
ter
Sam
ple
Sale
sA
sset
sIn
vest
men
tD
olla
rDeb
tE
xpor
tSha
reE
xpor
ter
Fore
ign
Ban
kDeb
tB
ond
Loa
nE
quity
Sale
sG
row
th1
Tot
alA
sset
s0.
0377
*1
Inve
stm
ent
0.21
01*
-0.0
086
1Sh
ortD
olla
rDeb
t0.
0267
0.21
78*
0.00
431
Exp
ortS
hare
0.02
130.
0232
-0.0
465*
0.28
50*
1H
ighE
xpor
ter
0.00
760.
0703
*-0
.078
7*0.
2269
*0.
7008
*1
Fore
ign
-0.0
101
0.02
250.
0035
-0.0
502*
-0.0
708*
-0.0
703*
1Sh
ortB
ankD
ebt
-0.0
374
-0.1
514*
-0.0
418*
0.28
77*
0.19
52*
0.16
16*
-0.0
857*
1B
ondA
broa
d0.
0295
0.23
58*
0.10
17*
0.07
76*
-0.0
151
0.01
10.
0046
-0.0
832*
1Loa
nAbr
oad
0.02
420.
3640
*0.
0177
0.13
44*
0.01
180.
0171
0.00
67-0
.082
5*0.
2907
*1
Equ
ityA
broa
d0.
0259
0.20
23*
0.02
050.
0328
0.00
16-0
.018
4-0
.020
4-0
.068
2*0.
0984
*0.
1247
*1
Sale
sG
row
this
the
change
inlo
gsa
les.
Inves
tmen
tis
physi
calst
ock
of
capit
alat
tim
et
min
us
physi
calst
ock
of
capit
alat
tim
et−
1norm
alize
dby
tota
lass
ets.
Tot
alA
sset
sis
the
log
of
lagged
tota
lass
ets.
For
eign
isth
eper
centa
ge
ofca
pit
alow
ned
by
fore
ign
inves
tors
(lagged
).S
hor
tDol
larD
ebt
isth
era
tio
ofsh
ort
-ter
mdollar
den
om
inate
dliabilit
ies
tosh
ort
term
deb
t(l
agged
).E
xpor
tShare
isth
era
tio
ofex
port
reven
ue
toto
talsa
les
(lagged
).H
ighE
xpor
ter
isa
dum
my
that
takes
valu
eofone
ifth
era
tio
ofex
port
sto
sale
sis
hig
her
than
10%
(base
don
lagged
Expor
tShare
.E
xpor
ters
refe
rsto
those
firm
sw
hose
export
tosa
les
rati
ois
gre
ate
rth
an
0(b
ase
don
lagged
export
s).
Shor
tBankD
ebt
isth
era
tio
ofsh
ort
-ter
mbank
deb
tto
tota
lliabilit
ies
(lagged
).B
ondA
broa
ddum
my
that
equals
one
ifth
efirm
sis
sued
bond
abro
ad
(lagged
).L
oanA
broa
ddum
my
that
equals
one
ifth
efirm
sis
sued
loans
abro
ad
(lagged
).E
quit
yA
broa
ddum
my
that
equals
one
ifth
efirm
sis
sued
equity
abro
ad
(lagged
).D
olla
rAss
ets
isth
era
tio
ofto
taldollar
ass
ets
toto
talass
ets
(lagged
).
53
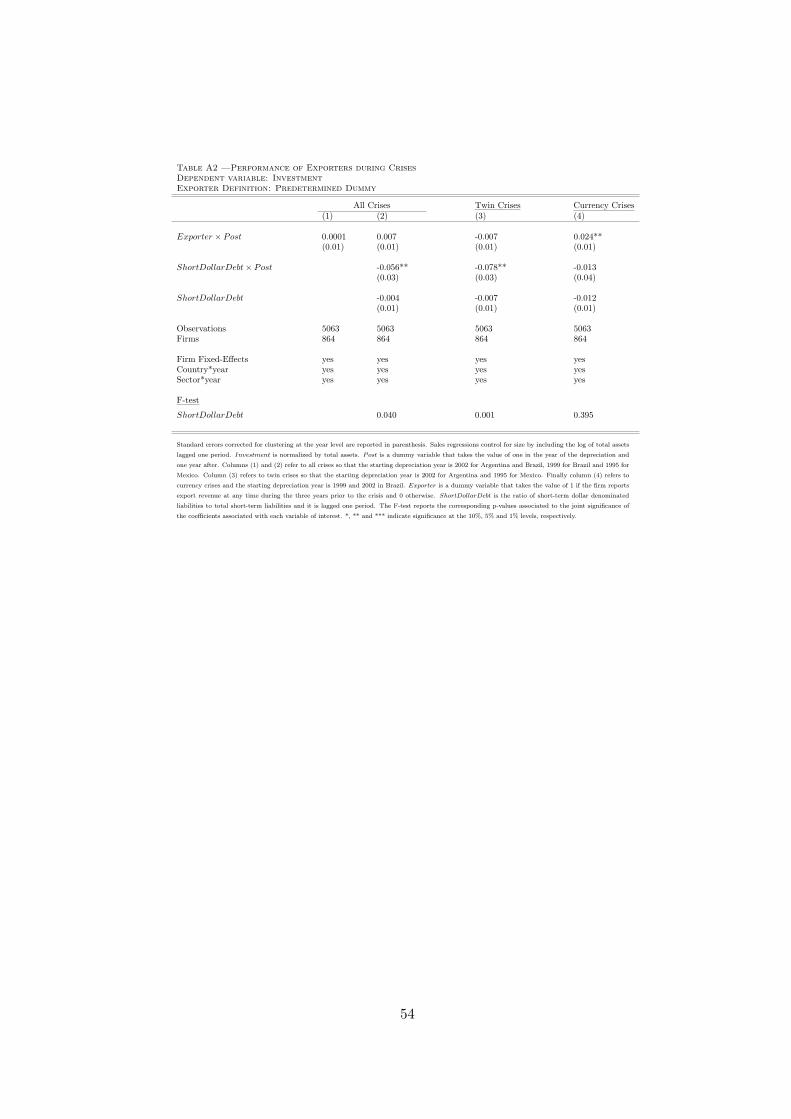
Table A2 —Performance of Exporters during CrisesDependent variable: InvestmentExporter Definition: Predetermined Dummy
All Crises Twin Crises Currency Crises(1) (2) (3) (4)
Exporter × Post 0.0001 0.007 -0.007 0.024**(0.01) (0.01) (0.01) (0.01)
ShortDollarDebt× Post -0.056** -0.078** -0.013(0.03) (0.03) (0.04)
ShortDollarDebt -0.004 -0.007 -0.012(0.01) (0.01) (0.01)
Observations 5063 5063 5063 5063Firms 864 864 864 864
Firm Fixed-Effects yes yes yes yesCountry*year yes yes yes yesSector*year yes yes yes yes
F-test
ShortDollarDebt 0.040 0.001 0.395
Standard errors corrected for clustering at the year level are reported in parenthesis. Sales regressions control for size by including the log of total assets
lagged one period. Investment is normalized by total assets. Post is a dummy variable that takes the value of one in the year of the depreciation and
one year after. Columns (1) and (2) refer to all crises so that the starting depreciation year is 2002 for Argentina and Brazil, 1999 for Brazil and 1995 for
Mexico. Column (3) refers to twin crises so that the starting depreciation year is 2002 for Argentina and 1995 for Mexico. Finally column (4) refers to
currency crises and the starting depreciation year is 1999 and 2002 in Brazil. Exporter is a dummy variable that takes the value of 1 if the firm reports
export revenue at any time during the three years prior to the crisis and 0 otherwise. ShortDollarDebt is the ratio of short-term dollar denominated
liabilities to total short-term liabilities and it is lagged one period. The F-test reports the corresponding p-values associated to the joint significance of
the coefficients associated with each variable of interest. *, ** and *** indicate significance at the 10%, 5% and 1% levels, respectively.
54
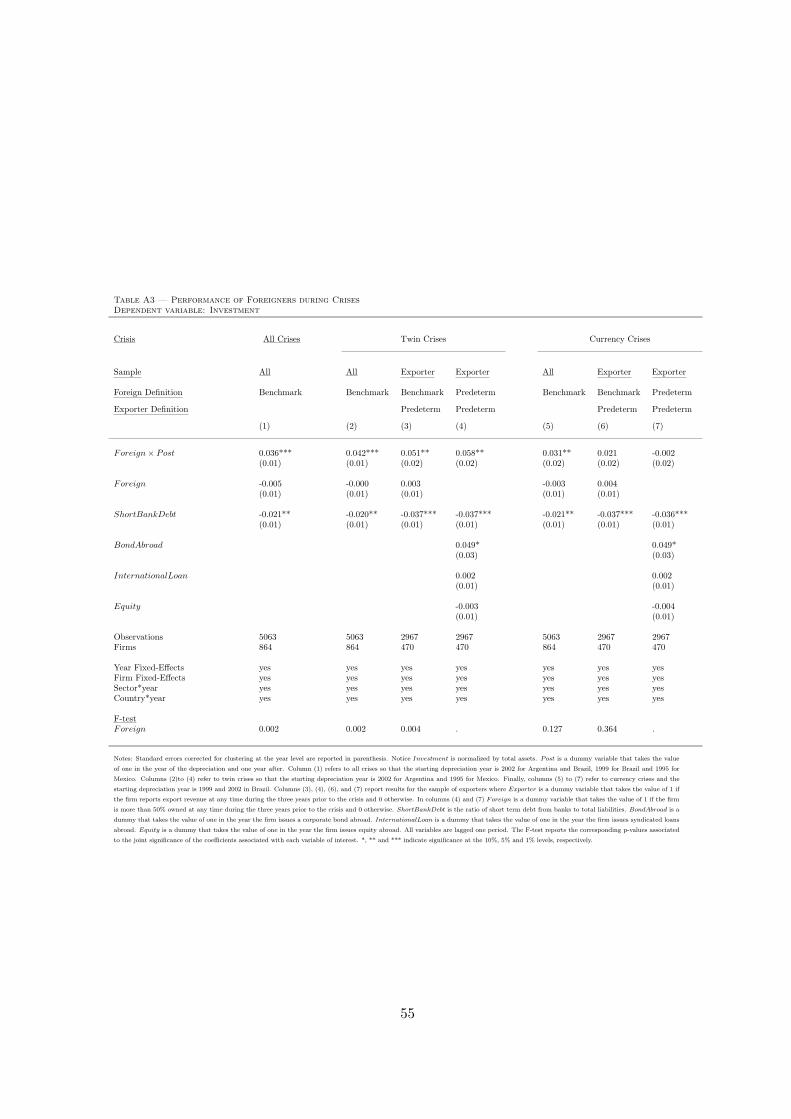
Table A3 — Performance of Foreigners during CrisesDependent variable: Investment
Crisis All Crises Twin Crises Currency Crises
Sample All All Exporter Exporter All Exporter Exporter
Foreign Definition Benchmark Benchmark Benchmark Predeterm Benchmark Benchmark Predeterm
Exporter Definition Predeterm Predeterm Predeterm Predeterm
(1) (2) (3) (4) (5) (6) (7)
Foreign× Post 0.036*** 0.042*** 0.051** 0.058** 0.031** 0.021 -0.002(0.01) (0.01) (0.02) (0.02) (0.02) (0.02) (0.02)
Foreign -0.005 -0.000 0.003 -0.003 0.004(0.01) (0.01) (0.01) (0.01) (0.01)
ShortBankDebt -0.021** -0.020** -0.037*** -0.037*** -0.021** -0.037*** -0.036***(0.01) (0.01) (0.01) (0.01) (0.01) (0.01) (0.01)
BondAbroad 0.049* 0.049*(0.03) (0.03)
InternationalLoan 0.002 0.002(0.01) (0.01)
Equity -0.003 -0.004(0.01) (0.01)
Observations 5063 5063 2967 2967 5063 2967 2967Firms 864 864 470 470 864 470 470
Year Fixed-Effects yes yes yes yes yes yes yesFirm Fixed-Effects yes yes yes yes yes yes yesSector*year yes yes yes yes yes yes yesCountry*year yes yes yes yes yes yes yes
F-testForeign 0.002 0.002 0.004 . 0.127 0.364 .
Notes: Standard errors corrected for clustering at the year level are reported in parenthesis. Notice Investment is normalized by total assets. Post is a dummy variable that takes the value
of one in the year of the depreciation and one year after. Column (1) refers to all crises so that the starting depreciation year is 2002 for Argentina and Brazil, 1999 for Brazil and 1995 for
Mexico. Columns (2)to (4) refer to twin crises so that the starting depreciation year is 2002 for Argentina and 1995 for Mexico. Finally, columns (5) to (7) refer to currency crises and the
starting depreciation year is 1999 and 2002 in Brazil. Columns (3), (4), (6), and (7) report results for the sample of exporters where Exporter is a dummy variable that takes the value of 1 if
the firm reports export revenue at any time during the three years prior to the crisis and 0 otherwise. In columns (4) and (7) Foreign is a dummy variable that takes the value of 1 if the firm
is more than 50% owned at any time during the three years prior to the crisis and 0 otherwise. ShortBankDebt is the ratio of short term debt from banks to total liabilities. BondAbroad is a
dummy that takes the value of one in the year the firm issues a corporate bond abroad. InternationalLoan is a dummy that takes the value of one in the year the firm issues syndicated loans
abroad. Equity is a dummy that takes the value of one in the year the firm issues equity abroad. All variables are lagged one period. The F-test reports the corresponding p-values associated
to the joint significance of the coefficients associated with each variable of interest. *, ** and *** indicate significance at the 10%, 5% and 1% levels, respectively.
55