What Have We Learned about COPD from Epidemiology A. Sonia Buist M.D. Oregon Health & Science...
66
What Have We Learned about COPD from Epidemiology A. Sonia Buist M.D. A. Sonia Buist M.D. Oregon Health & Science Oregon Health & Science University, University, Portland, Oregon, USA Portland, Oregon, USA
-
Upload
winfred-stafford -
Category
Documents
-
view
236 -
download
0
Transcript of What Have We Learned about COPD from Epidemiology A. Sonia Buist M.D. Oregon Health & Science...

What Have We Learned about COPD from Epidemiology
A. Sonia Buist M.D.A. Sonia Buist M.D.
Oregon Health & Science Oregon Health & Science University,University,
Portland, Oregon, USAPortland, Oregon, USA

EpidemiologyEpidemiology is the study of the distribution and determinants of disease

Definition of COPD
COPD is a preventable and treatablepreventable and treatable disease with some significant extrapulmonary effects that my contribute to the severity in individual patients
Its pulmonary component is characterized by airflow limitation that is not fully reversible
The airflow limitation is usually progressive and associated with an abnormal inflammatory response of the lungs to noxious particles or gases
GOLD 2006

What is Epidemiology Telling Us?
COPD is more common that previously estimated, and is becoming as common in women as men as smoking habits equalizeThe social and economic burden will increase worldwide as the demographics of the world’s populations changesCOPD is costly for the patient and healthcare systemWe may need to change our focus from treatment to prevention
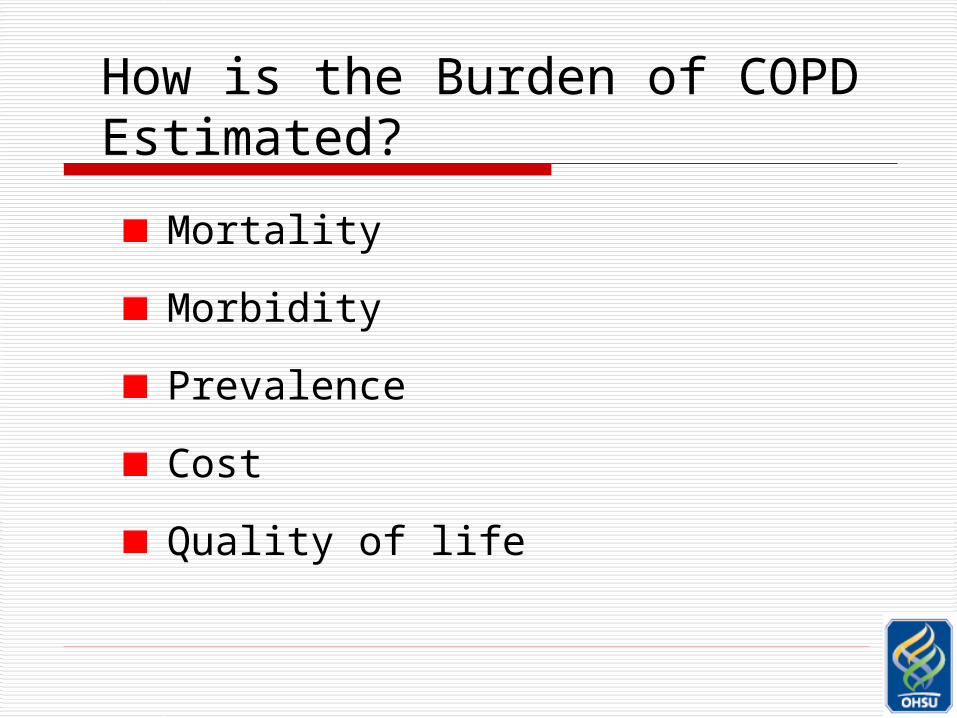
How is the Burden of COPD Estimated?
Mortality
Morbidity
Prevalence
Cost
Quality of life
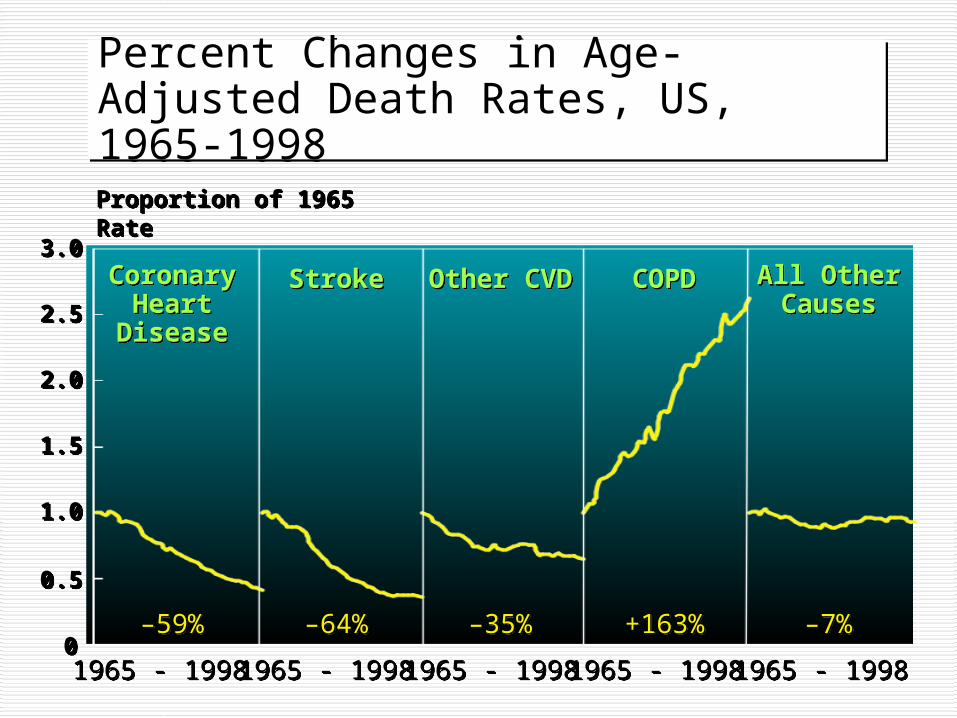
Percent Changes in Age-Adjusted Death Rates, US, 1965-1998Percent Changes in Age-Adjusted Death Rates, US, 1965-1998
00
0.50.5
1.01.0
1.51.5
2.02.0
2.52.5
3.03.0
Proportion of 1965 Rate Proportion of 1965 Rate
1965 - 19981965 - 1998 1965 - 19981965 - 1998 1965 - 19981965 - 1998 1965 - 19981965 - 1998 1965 - 19981965 - 1998
–59%–59% –64%–64% –35%–35% +163%+163% –7%–7%
CoronaryHeart
Disease
CoronaryHeart
Disease
StrokeStroke Other CVDOther CVD COPDCOPD All OtherCauses
All OtherCauses
Ford ES et al, NEJM 2007;356(23):2388-97
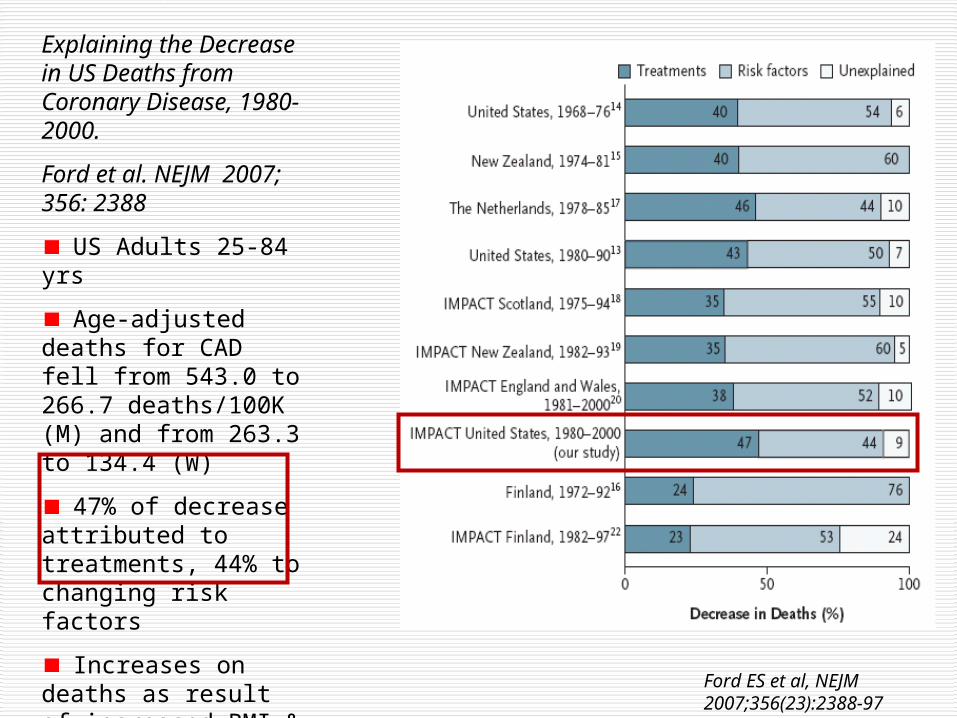
Explaining the Decrease in US Deaths from Coronary Disease, 1980-2000.
Ford et al. NEJM 2007; 356: 2388
US Adults 25-84 yrs
Age-adjusted deaths for CAD fell from 543.0 to 266.7 deaths/100K (M) and from 263.3 to 134.4 (W)
47% of decrease attributed to treatments, 44% to changing risk factors
Increases on deaths as result of increased BMI & diabetes

World Health Statistics 2008, WHO
COPD Mortality in the US
COPD is the only oneonly one of the top 6 leading causes of death in the US that is increasing


COPD Mortality by Gender, U.S., 1980-2000
YearYear
Number Deaths x 1000Number Deaths x 1000

Age-Standardized Death rates from COPD in US, aged ≥18 years, by sex, 2000-2005

How is the Burden of COPD Estimated?
Mortality
Morbidity
Prevalence
Cost
Quality of life
Morbidity in COPD
Traditionally measured by:
Physician visits
Hospitalization
Emergency visits

Morbidity in COPD
May be affected by co-morbid chronic conditions that are not directly related to COPD but may have an impact on health status or may negatively interfere with COPD management
Morbidity data are greatly affected by availability of hospital beds so should be interpreted with caution
Disability-Adjusted Life Years (DALYs)
A metric used by WHO
Combines premature death & disability
A metric used by WHO
Combines premature death & disability

Leading Causes Of Disability-adjusted Life-Years (DALYs) Lost Worldwide: 1990 and 2020 (projected)
RANKRANK RANKRANK % total % total
Disease or injuryDisease or injury 19901990 20202020 DALYs DALYs
Lower respiratory infections 1 6 3.1
Diarrheal diseases 2 9 2.7
Ischemic heart disease 5 1 5.9
Cerebrovascular disease 6 4 4.4
Tuberculosis 7 7 3.1
Road traffic accidents 9 3 5.0
COPDCOPD 12 12 5 5 4.1 4.1
Murray & Lopez, Lancet 1997
What Have We Learned from Epidemiology?
Standardized methods allow comparison across countriesUsing BOLD & PLATINO standardized methods, prevalence of COPD is appreciably higher than previously reportedDifferent criteria & definitions for “COPD” make a big difference to reported prevalances

What Else Have We Learned from Epidemiology?
There is heterogeneity across countries/sites that is not completely explained by known risk factorsSmoking and age are the most powerful risk factorsDifferent criteria & definitions for “COPD” make a big difference to reported prevalances Irreversible airflow obstruction in never-smokers is still poorly understood

What Have We Learned from Epidemiology?
Standardized methods allow comparison across countriesUsing BOLD & PLATINO standardized methods, prevalence of COPD is appreciably higher than previously reportedDifferent criteria & definitions for “COPD” make a big difference to reported prevalances

Two Models of International Collaboration
to Measure COPD Prevalence
Scientific Objectives of PLATINO & BOLD: Primary
Measure the prevalence of COPD & its risk factors by age & sex
Estimate the burden of COPD quality of life & activity limitation
respiratory symptoms
use of health care services

Scientific Objectives: Secondary
Compare different lung function criteria for the diagnosis of COPD
Determine if variations in risk factors contribute to variations in COPD prevalence
Characterize the clinical management of COPD in different countries

BOLD Entry Criteria
40 yearsMen & womenPopulation-based e.g. random sample of population (non-institutionalized people)Recruitment: from well-defined target population that was approved by Operations Center

Methods (1)
Questionnaires: all centers used the BOLD questionnaires but added supplementary local questionnaires if they wantedTranslation: translation & back translation followed by reconciliation of any differences Spirometry: same spirometer, same software, same methods, same data transfer, same quality control measures used
Methods (2)
Data Entry & Transfer: same methods for questionnaires & spirometry. Web-based, secure, auto error detect w/ site notification, online copies of protocol, Manual of Procedures, all data formsParticipant safety: all centers obtained local ethical committee approval & observed confidentialityQuality Control: all methods the same & standardized, edited checks for data entry

What Data Are We Obtaining?
Lung function
Respiratory symptoms
Risk factors (smoking, occupation, biomass)
Respiratory medications
Health status
Health care utilization
Burden of COPD/economic & social

How was COPD Defined?
• Post-bronchodilator FEV1/FVC <70%
• Severity staged using GOLD criteria
• For BOLD, GOLD Stage 2 & higher used to estimate burden of “clinically significant” COPD
Chronic cough, sputum, shortness of breath determined but not part of the definition of COPD

Classification by SeverityClassification by Severity
StageStage Characteristics*Characteristics*I: Mild FEV1/FVC < 70%; FEV1 >80% predicted
II: Moderate FEV1/FVC < 70%; 50%<FEV1< 80% predicted
III: Severe FEV1/FVC < 70%; 30%> FEV1< 50% predicted
IV: Very Severe FEV1/FVC < 70%; FEV1 < 30% predicted or FEV1 < 50% predicted plus chronic respiratory
failure *Post-Bronchodilator GOLD 2006GOLD 2006 GOLD 2006GOLD 2006

Males Females Airflow Obstruction by Sex*
18%
11%
27%
23%
16%
Brazil Mexico Uruguay Chile Venezuela
*Post-BD FEV1/FVC<70% Menezes et al Lancet 2005
Pre
vale
nce
, %
≥ GOLD Stage 1

The BOLD Study:
BB urden of OO bstructive LL ung DD isease Initiative

BOLD SitesBOLD Sites
FINISHED:
Guangzhou (China);Adana (Turkey); Salzburg (Austria); Cape Town (South Africa); Reykjavik (Iceland); Krakow (Poland); Hannover (Germany); Bergen (Norway)l Vancouver (B.C., Canada); Lexington (Kentucky, USA); Manila (Philippines);
Sydney (Australia); London (UK); Uppsala (Sweden); Mumbai (India)
IN PROGRESS
Lisbon (Portugal); Tartu (Estonia); Maastricht (The Netherlands); Pune (India); 4 additional sites in Canada & Australia; 1 additional site in Philippines
PLANNING: Algeria, Tunisia, Morocco, Japan, Cambodia, Vietnam, Mongolia,
32

Prevalence of GOLD Stage II & III+ COPD in 12 Countries by Sex & Descending Prevalence of Smoking, BOLD Study
Lancet,2007; 370: 741-50
11.8% (SE 7.9)8.5% (SE 5.8)
Overall 10.1% (SE 4.8)

Sydney, Australia Estimated Population Prevalence of Gold Stage II+ COPD* by pack years
and sex
4%
10%
8%6%
3%4%
7%9%
8%
22%
28%
25%
9%
12%11%
0%
5%
10%
15%
20%
25%
30%
Men** Women All
Never Smokers0-10 pack years10-20 pack years20+ pack yearsTotal
*Post BD FEV1/FVC <70% and post BD FEV1 <80%
**For the 0-10 and 10-20 pack years cell size is <20
37
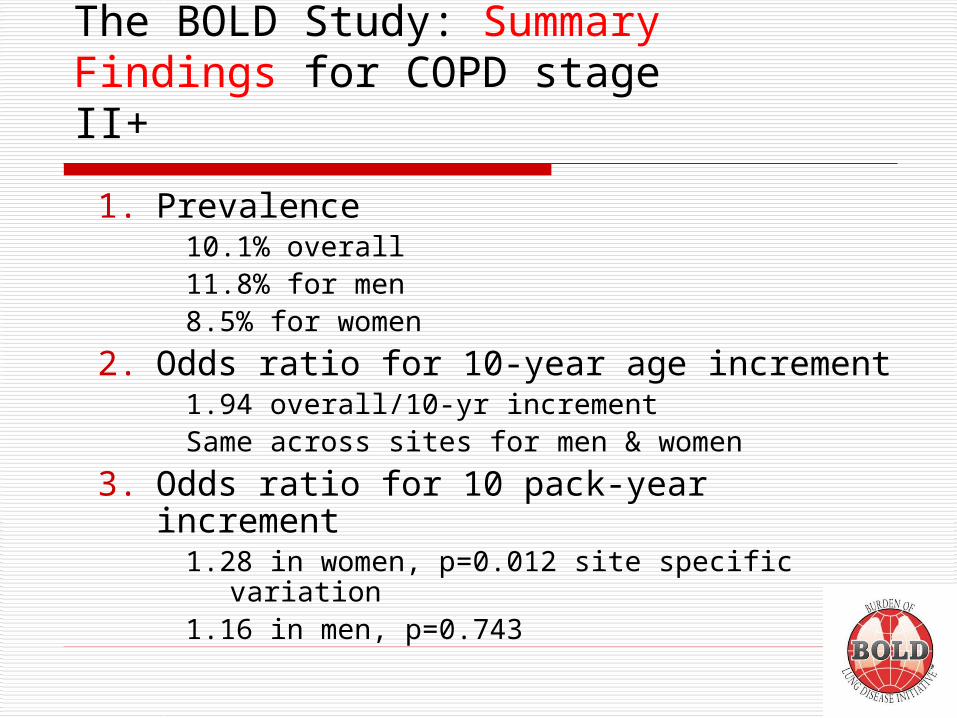
The BOLD Study: Summary Findings for COPD stage II+
1. Prevalence10.1% overall11.8% for men 8.5% for women
2. Odds ratio for 10-year age increment1.94 overall/10-yr incrementSame across sites for men & women
3. Odds ratio for 10 pack-year increment1.28 in women, p=0.012 site specific variation1.16 in men, p=0.743

38
BOLD findings on COPD prevalence
Heterogeneity in prevalence Across sites (12 countries) Between men & women within sites
Partly explained by site & sex differences in prevalence of smoking & other risk factors
Lancet, 2007, 370: 741-50Lancet, 2007, 370: 741-50
39
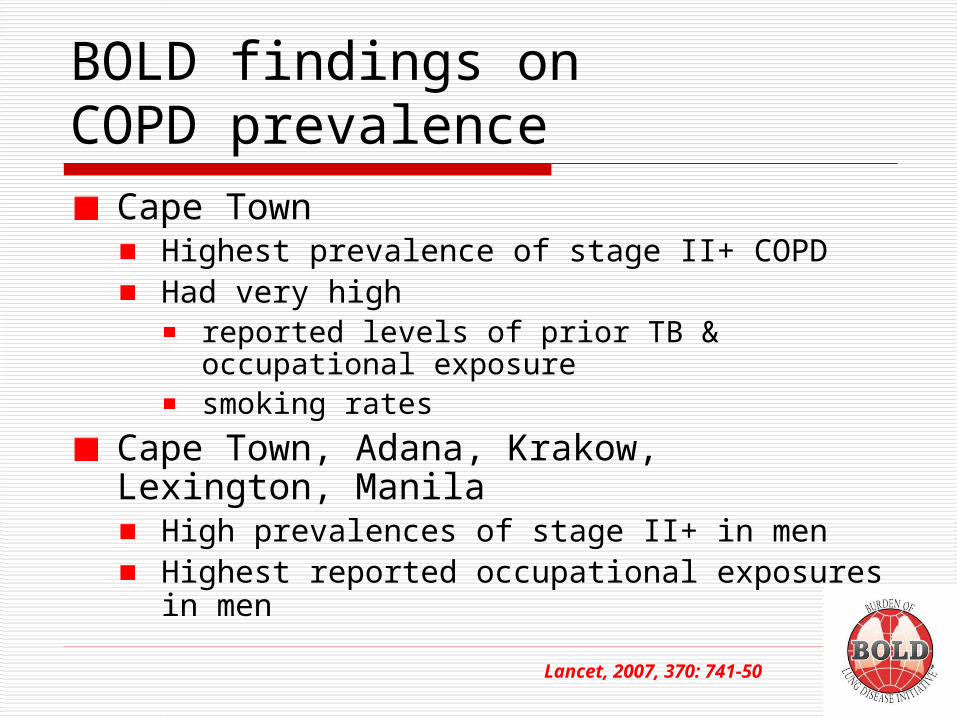
BOLD findings on COPD prevalence
Cape TownHighest prevalence of stage II+ COPDHad very high
reported levels of prior TB & occupational exposuresmoking rates
Cape Town, Adana, Krakow, Lexington, ManilaHigh prevalences of stage II+ in menHighest reported occupational exposures in men
Lancet, 2007, 370: 741-50

How is the Burden of COPD Estimated?
Mortality
Morbidity
Prevalence
Cost
Quality of life
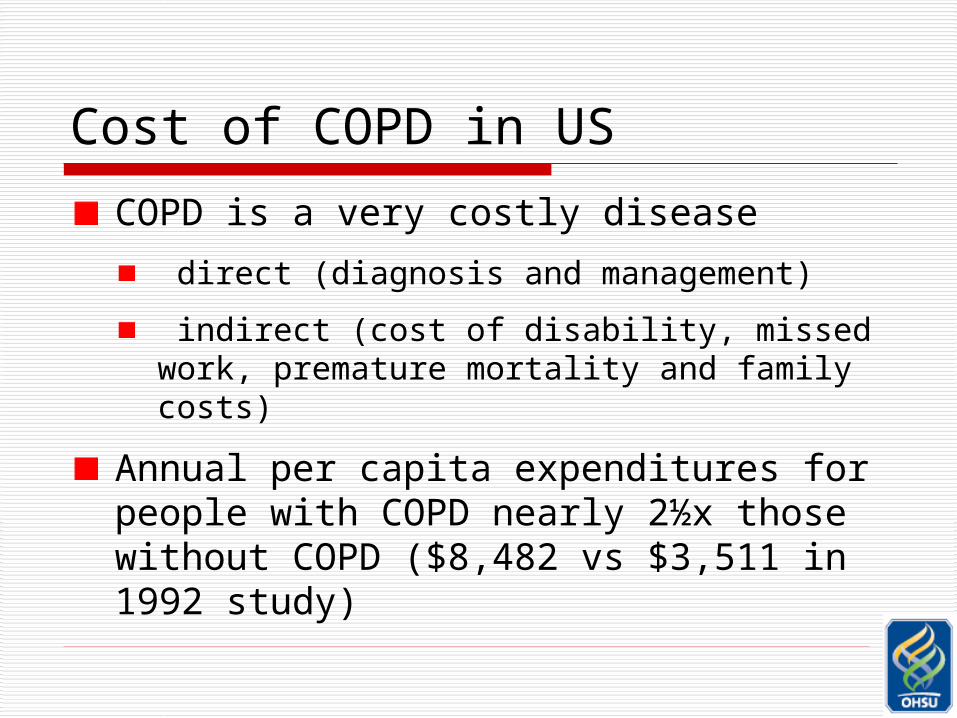
Cost of COPD in US
COPD is a very costly disease
direct (diagnosis and management)
indirect (cost of disability, missed work, premature mortality and family costs)
Annual per capita expenditures for people with COPD nearly 2½x those without COPD ($8,482 vs $3,511 in 1992 study)

Direct Medical Costs of COPD in US
Halpin. Proc Am Thoracic Soc2006;3(3): 227
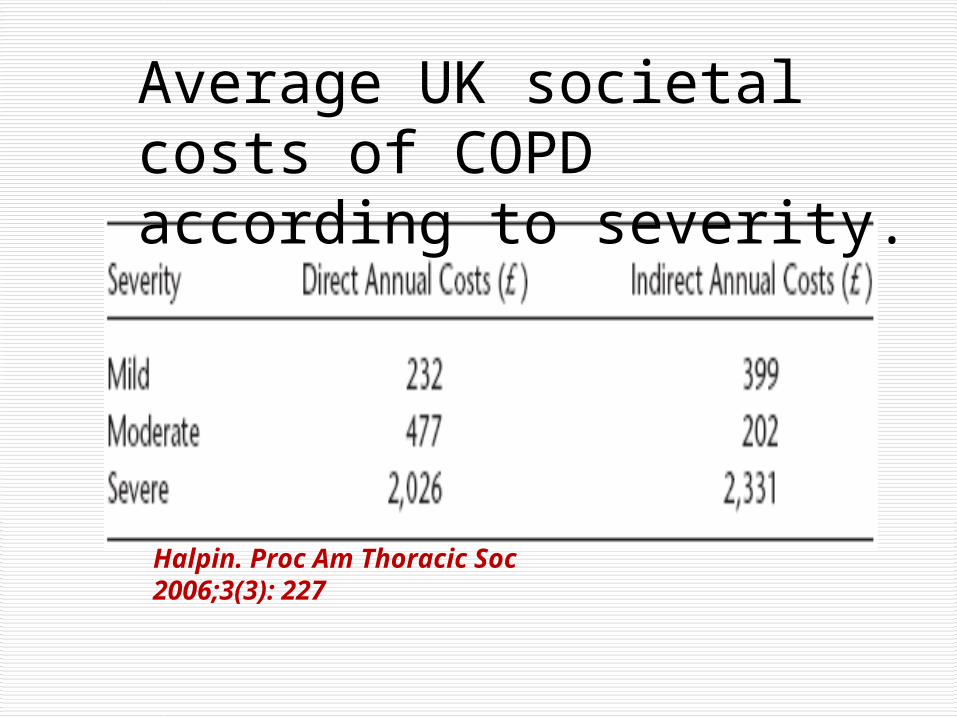
Average UK societal costs of COPD according to severity.

Breakdown of Direct Costs of COPD care in the UK
HalpinProc Am Thoracic Soc2006;3(3): 227

Why is the Burden of COPD Increasing Worldwide?
Increase in exposure to risk factors (especially tobacco) in developing countries & in women

COPD is a classic COPD is a classic gene-environment gene-environment interaction diseaseinteraction disease

Risk Factors for COPD
NutritionNutrition
InfectionsInfections
Socio-economic Socio-economic statusstatus
Aging PopulationsAging PopulationsGENESGENES
SmokingSmoking

Trends in Risk Factors Smoking
Until 1940s, smoking prevalence in women much less than men worldwide
Smoking increased in women in many countries in 1940s and gradually equaled rates in men


Mean Post-BD FEV1 in Placebo Group
2.4
2.5
2.6
2.7
2.8
2.9
Screen 2 AV1 AV2 AV3 AV4 AV5
FEV
1 P
ost B
D
Sustained Quitters
Continuing Smokers
Annual Visit
Lung Health Studies I-III

Trends in Risk Factors Other Exposures
Until World War2, men were much more likely than women to have heavy occupational exposures


Occupation as a Risk Factor
Data from the US NHANES III Survey (1988-’94) used to estimate % of COPD attributable to occupation
Fraction of COPD attributable to work estimated as 19.2% overall and 31.2% among never-smokers

Trends in Risk Factors Other Exposures
Heavy exposures to indoor air pollution as a risk factor (especially in developing countries) were not recognized as important risk for COPD


Worldwide solid fuel use for cooking. Torres et al PATS, 2008; 5: 577-90

Indoor Concentrations of Pollutants from Typical Wood-Burning Stove
Pollutant Pollutant Emission (mg/mEmission (mg/m33) ) Allowable standard Allowable standard (mg/m(mg/m33) )
Carbon Carbon MonoxideMonoxide
150 10
Particles 3.3 0.1
Benzene 0.8 0.002
1,3-Butadiene 0.15 0.0003
Formaldehyde 0.7 0.1
Source: Based on the UNDP/DESA/WEC World Energy Assessment

Regional Burden of Disease due to Indoor Air Pollution

Impact of Aging Populations
Changing age structure of populations in developing countries (more are living into the COPD age range)

GOLD Stage 1+ ≥40 years in Salzburg, Austria, by Age & Sex (BOLD Study, 2006)
Schirnhofer et al, Chest 2007; 131:29036
Male Female

Comparison of COPD Definitions, Austria
COPD Prevalence by Age
0
20
40
60
80
40-49 50-59 60-69 70+
Age Groups
Per
cen
t
Fixed ratio
LLN FEV1/FVC
GOLD IV
GOLD IIIGOLD III

Changing Demographics in China
Total population: ~1.3 BPopulation growth rate: 0.6%≥ age 65 in 2006: 100M
≥ age 65 in 2015: 200M
≥ age 65 in 2050: 430MBy 2050, one quarter of the world’s population will be ≥60 years. 3 in 4 aged 80 years & over will be living in the developing world

Summary COPD is common, costly, and imposes a significant social and economic burden yet is mostly under-diagnosed and under-treated
COPD has become as common in women as men as smoking habits have equalizedCOPD is common in smokers and ex-smokers but can also exist in nonsmokers
The burden of COPD continues to rise steadily in all countries because of increasing life expectancy and decades of tobacco use

What Can We Do About the COPD “Epidemic”?
Encourage tobacco-control legislationAll health care professional should take tobacco control very seriously….for themselves and their patients and familiesThere needs to be more research into risk factors and the natural history of COPD We need to focus on primaryprimary prevention of COPD


Key Messages to Physicians & Public
Think COPD
Do spirometry
Reduce risk factors
Manage actively
““COPD is preventable and COPD is preventable and treatable”treatable”