'Could this comic book really end Islamophobia?': Initial ...
1 www.appa.com.au
our end-user customers really think about promotional products?
What do
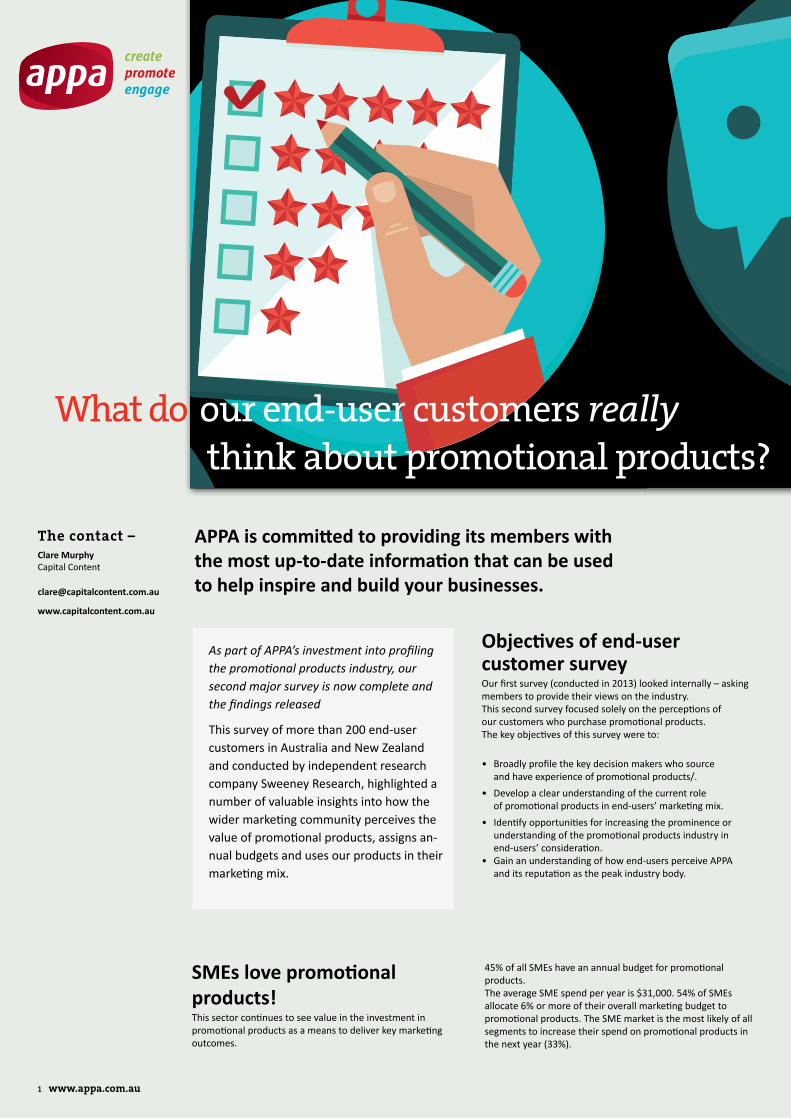
APPA is committed to providing its members with the most up-to-date information that can be used to help inspire and build your businesses.
Objectives of end-user customer surveyOur first survey (conducted in 2013) looked internally – asking members to provide their views on the industry. This second survey focused solely on the perceptions of our customers who purchase promotional products. The key objectives of this survey were to:
• Broadly profile the key decision makers who source and have experience of promotional products/.
• Develop a clear understanding of the current role of promotional products in end-users’ marketing mix.
• Identify opportunities for increasing the prominence or understanding of the promotional products industry in end-users’ consideration. • Gain an understanding of how end-users perceive APPA and its reputation as the peak industry body.
SMEs love promotional products!This sector continues to see value in the investment in promotional products as a means to deliver key marketing outcomes.
45% of all SMEs have an annual budget for promotional products. The average SME spend per year is $31,000. 54% of SMEs allocate 6% or more of their overall marketing budget to promotional products. The SME market is the most likely of all segments to increase their spend on promotional products in the next year (33%).
As part of APPA’s investment into profiling the promotional products industry, our second major survey is now complete and the findings released
This survey of more than 200 end-user customers in Australia and New Zealand and conducted by independent research company Sweeney Research, highlighted a number of valuable insights into how the wider marketing community perceives the value of promotional products, assigns an-nual budgets and uses our products in their marketing mix.
The contact –Clare Murphy Capital Content
[email protected] www.capitalcontent.com.au
www.appa.com.au 2
Summary of key findingSHealth of the industry56% of survey respondents who allocate a budget expect to spend between $10,000 - $1million per year on promotional products. The highest spenders are large corporates followed by SMEs and not-for-profit organisations. For 70% of respondents, promotional products represent up to 10% of their annual marketing spend while 10% of respondents allocate 30% to the use of promotional products.
Looking ahead, 95% of all respondents expected their promotional product spend to either stay the same or increase. Reasons given included: changes to marketing strategy, an increased focus on marketing, general business growth or an increase in their marketing budget.
Positively, 75% or more of respondents believe their promotional product suppler is creative, proactive, understanding of business needs and pro-vides value for money.
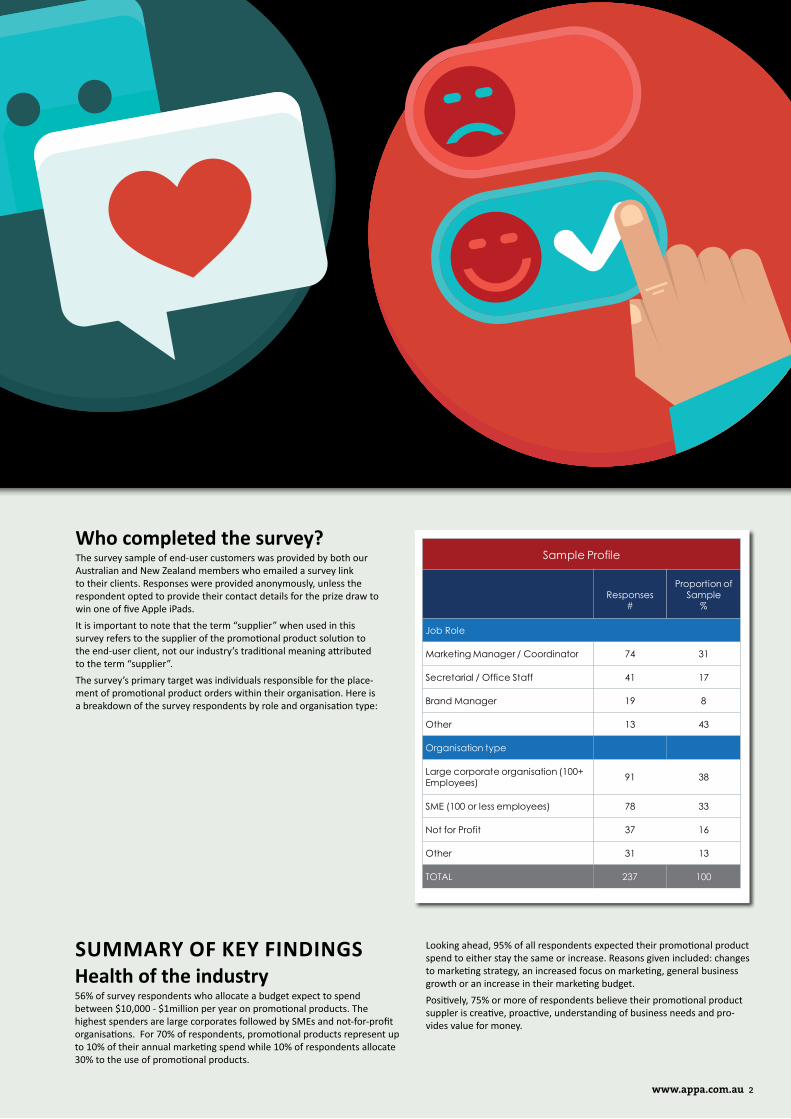
Who completed the survey?The survey sample of end-user customers was provided by both our Australian and New Zealand members who emailed a survey link to their clients. Responses were provided anonymously, unless the respondent opted to provide their contact details for the prize draw to win one of five Apple iPads.
It is important to note that the term “supplier” when used in this survey refers to the supplier of the promotional product solution to the end-user client, not our industry’s traditional meaning attributed to the term “supplier”.
The survey’s primary target was individuals responsible for the place-ment of promotional product orders within their organisation. Here is a breakdown of the survey respondents by role and organisation type:
Sample Profile
Responses #
Proportion of Sample
%
Job Role
Marketing Manager / Coordinator 74 31
Secretarial / Office Staff 41 17
Brand Manager 19 8
Other 13 43
Organisation type
Large corporate organisation (100+ Employees) 91 38
SME (100 or less employees) 78 33
Not for Profit 37 16
Other 31 13
TOTAL 237 100

Corporate Australia and promotional productsMore than 75% of large corporate organisations allocate an annual budget to the use of promotional products in their marketing mix. Their average annual spend is $43,000.
50% of large corporates with a promotional products budget allocate be-tween 6-30% of their marketing budget to promotional products. Over the next year 95% see their annual spend on promotional products either staying the same or increas-ing. Less than 10% anticipated a decrease in annual spend.
90% of large corporates use promotional products to increase brand awareness. The next most popular reasons were: adding value to at-tendees at events or activities, reinforcing brand value, connecting with consumers and creating a way to stand out from competitors.
Most large corporates (79%) prefer to source promotional products from a preferred, or pre-existing supplier, proving that client relationships really matter.
Corporate gifts were the most popular purpose of promotional products followed closely by corporate and event merchandise and offset printed materials.
However, between 20-40% also used promotional products for employee motivation and incentive programs, recognition of employee service, point of sale packaging, direct mail advertising tools and gift with purchase.
Corporate Australia’s perception of the promotional products industry and its suppliers is overwhelmingly positive. 84% agreed promotional products offer value for money and 81% said the suppliers they had worked with understood their business needs. Being proactive, creative and innovative were also highly regarded (70%+ agreed).
Budget allocation and forecasts Most organisations surveyed allocate an annual budget to promotional product purchasing. Encouragingly, one of five anticipates spending more on promotional products in the next year.
3 www.appa.com.au
What percentage of your total marketing budget does your organisation’s spend on promotional products represent?
45%
46%
47%
39%
43%
32%
37%
30%
30%
24%
14%
12%
17%
9%
19%
9%
5%
7%
22%
14%
Less than 5% 6% to 10% 11% to 30% More than 30%
Promotional Product Share of Marketing Budget
Total (169)
Large Corporate (65)
SME (60)
Not-for-profit (23*)
Other (21*)
Why do SMEs use promotional products in their marketing mix? 1. 87% of SME respondents said that promotional products help them con-nect with their consumers.
2. Likewise, 87% said promotional products increase awareness of their brand.
3. Other high ranking reasons for using promotional products among the SME base included encouraging brand loyalty (81%), providing added value to attendees at events and activities (79%) and creating a way to stand out from competitors.
The most popular method of sourcing solutions and products was via a preferred or pre-existing supplier, highlighting the importance placed on strong relationships between distributors and their clients.
Unlike larger corporate organisations, SMEs typically use promotional products as offset printed material (signs, posters, brochures etc) and corporate gifts or event merchandise.
Importantly, SMEs see promotional products as representing value for money (79%), essential to SMEs who have smaller budgets and are looking for strong ROI.
our end-user customers really think about promotional products?
What do
www.appa.com.au 4
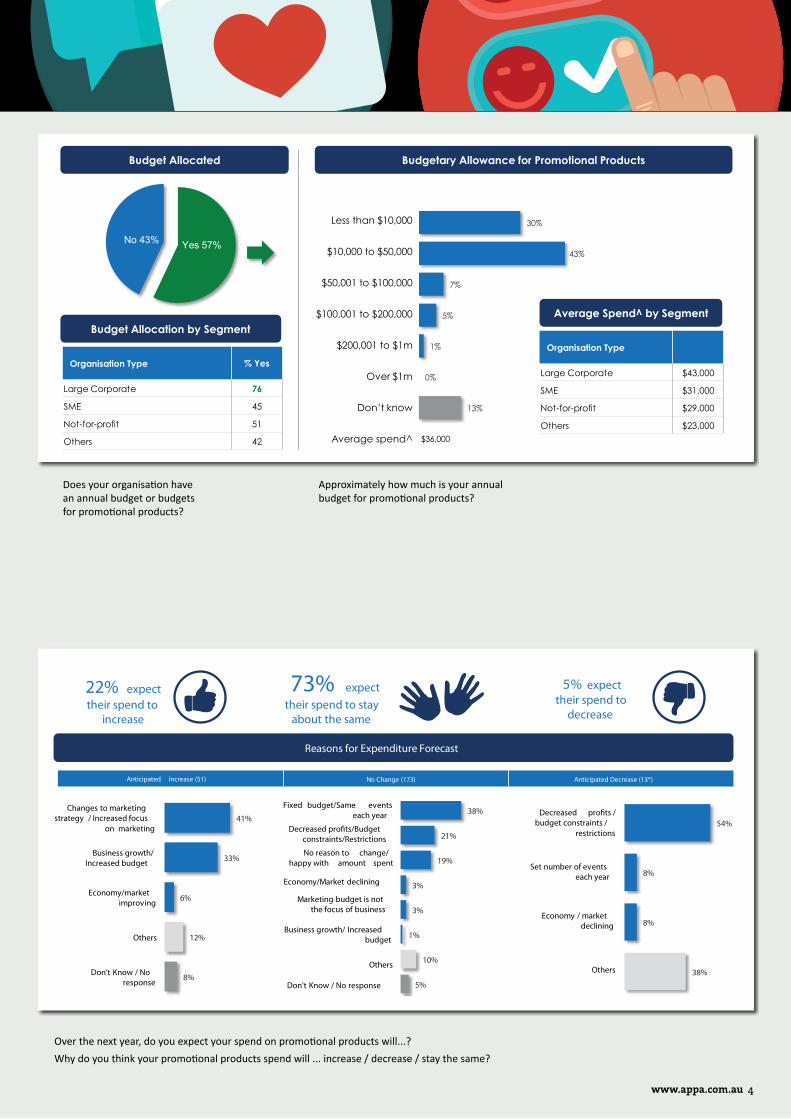
Does your organisation have an annual budget or budgets for promotional products?
Over the next year, do you expect your spend on promotional products will...?
Why do you think your promotional products spend will ... increase / decrease / stay the same?
Approximately how much is your annual budget for promotional products?
Yes 57% No 43%
Less than $10,000
$10,000 to $50,000
$50,001 to $100,000
$100,001 to $200,000
$200,001 to $1m
Over $1m
Don’t know
Average spend^ $36,000
30%
43%
7%
5%
1%
0%
13%
Budget Allocated Budgetary Allowance for Promotional Products
Average Spend^ by Segment
Organisation Type
Large Corporate $43,000
SME $31,000
Not-for-profit $29,000
Others $23,000
Budget Allocation by Segment
Organisation Type % Yes
Large Corporate 76
SME 45
Not-for-profit 51
Others 42
22% expect their spend to
increase
5% expect their spend to
decrease
73% expect their spend to stay
about the same
Reasons for Expenditure Forecast
Anticipated Increase (51) No Change (173) Anticipated Decrease (13*)
Changes to marketing strategy / Increased focus
on marketing
Business growth/ Increased budget
Economy/market improving
Others
Don’t Know / No response
41%
33%
6%
12%
8%
Fixed budget/Same events each year
Decreased pro�ts/Budget constraints/Restrictions
No reason to change/ happy with amount spent
Economy/Market declining
Marketing budget is not the focus of business
Business growth/ Increased budget
Others
Don’t Know / No response
38%
21%
19%
3%
3%
1%
10%
5%
Decreased pro�ts / budget constraints /
restrictions
Set number of events each year
Economy / market declining
Others
54%
8%
8%
38%
5 www.appa.com.au
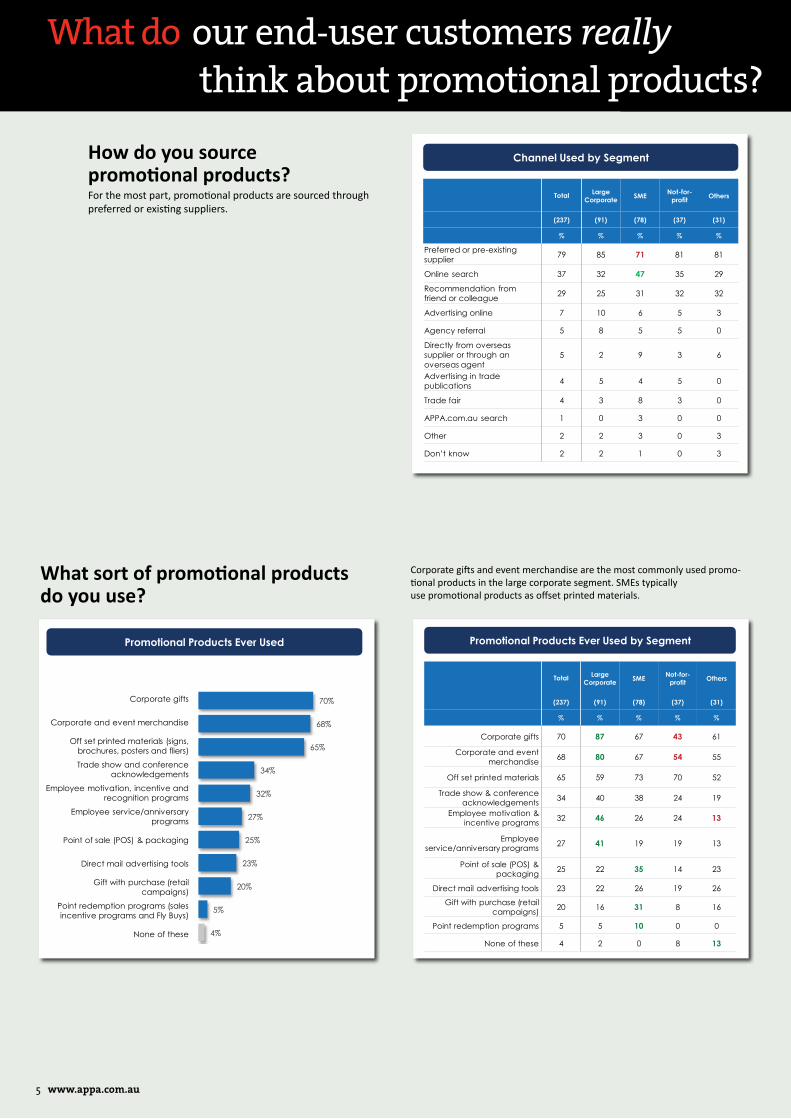
Promotional Products Ever Used
Corporate gifts
Corporate and event merchandise
Off set printed materials (signs, brochures, posters and fliers)
Trade show and conference acknowledgements
Employee motivation, incentive and recognition programs
Employee service/anniversary programs
Point of sale (POS) & packaging
Direct mail advertising tools
Gift with purchase (retail campaigns)
Point redemption programs (sales incentive programs and Fly Buys)
None of these
70%
68%
65%
34%
32%
27%
25%
23%
20%
5%
4%
Promotional Products Ever Used by Segment
Total Large Corporate SME Not-for-
profit Others
(237) (91) (78) (37) (31)
% % % % %
Corporate gifts 70 87 67 43 61
Corporate and event merchandise
68 80 67 54 55
Off set printed materials 65 59 73 70 52
Trade show & conference acknowledgements
34 40 38 24 19
Employee motivation & incentive programs
32 46 26 24 13
Employee service/anniversary programs
27 41 19 19 13
Point of sale (POS) & packaging
25 22 35 14 23
Direct mail advertising tools 23 22 26 19 26
Gift with purchase (retail campaigns)
20 16 31 8 16
Point redemption programs 5 5 10 0 0
None of these 4 2 0 8 13
What sort of promotional products do you use?
Corporate gifts and event merchandise are the most commonly used promo-tional products in the large corporate segment. SMEs typically use promotional products as offset printed materials.
How do you source promotional products?For the most part, promotional products are sourced through preferred or existing suppliers.
Channel Used by Segment
Total Large Corporate SME Not-for-
profit Others
(237) (91) (78) (37) (31)
% % % % %
Preferred or pre-existing supplier 79 85 71 81 81
Online search 37 32 47 35 29
Recommendation from friend or colleague 29 25 31 32 32
Advertising online 7 10 6 5 3
Agency referral 5 8 5 5 0
Directly from overseas supplier or through an overseas agent
5 2 9 3 6
Advertising in trade publications 4 5 4 5 0
Trade fair 4 3 8 3 0
APPA.com.au search 1 0 3 0 0
Other 2 2 3 0 3
Don’t know 2 2 1 0 3
our end-user customers really think about promotional products?
What do
www.appa.com.au 6
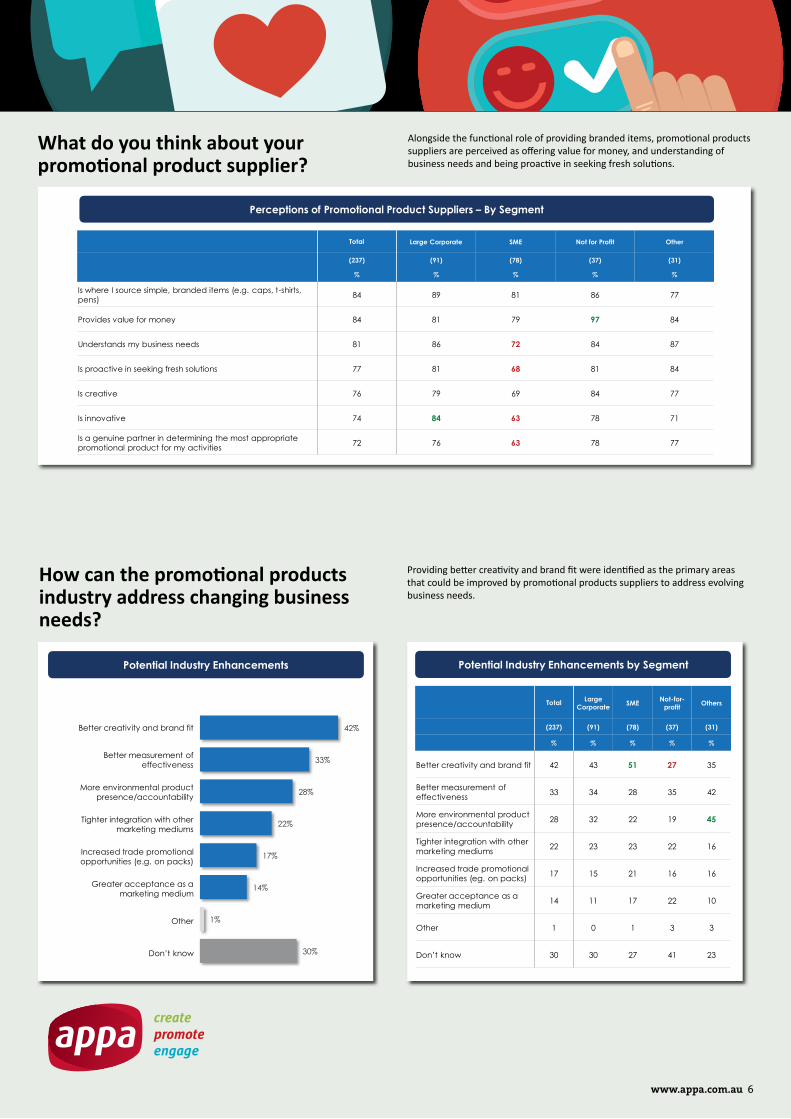
How can the promotional products industry address changing business needs?
Providing better creativity and brand fit were identified as the primary areas that could be improved by promotional products suppliers to address evolving business needs.
Potential Industry Enhancements
Better creativity and brand fit
Better measurement of effectiveness
More environmental product presence/accountability
Tighter integration with other marketing mediums
Increased trade promotional opportunities (e.g. on packs)
Greater acceptance as a marketing medium
Other
Don’t know
42%
33%
28%
22%
17%
14%
1%
30%
Potential Industry Enhancements by Segment
Total Large Corporate SME Not-for-
profit Others
(237) (91) (78) (37) (31)
% % % % %
Better creativity and brand fit 42 43 51 27 35
Better measurement of effectiveness 33 34 28 35 42
More environmental product presence/accountability 28 32 22 19 45
Tighter integration with other marketing mediums 22 23 23 22 16
Increased trade promotional opportunities (eg. on packs) 17 15 21 16 16
Greater acceptance as a marketing medium 14 11 17 22 10
Other 1 0 1 3 3
Don’t know 30 30 27 41 23
What do you think about your promotional product supplier?
Alongside the functional role of providing branded items, promotional products suppliers are perceived as offering value for money, and understanding of business needs and being proactive in seeking fresh solutions.
Perceptions of Promotional Product Suppliers – By Segment
Total Large Corporate SME Not for Profit Other
(237) (91) (78) (37) (31)
% % % % %
Is where I source simple, branded items (e.g. caps, t-shirts, pens) 84 89 81 86 77
Provides value for money 84 81 79 97 84
Understands my business needs 81 86 72 84 87
Is proactive in seeking fresh solutions 77 81 68 81 84
Is creative 76 79 69 84 77
Is innovative 74 84 63 78 71
Is a genuine partner in determining the most appropriate promotional product for my activities 72 76 63 78 77