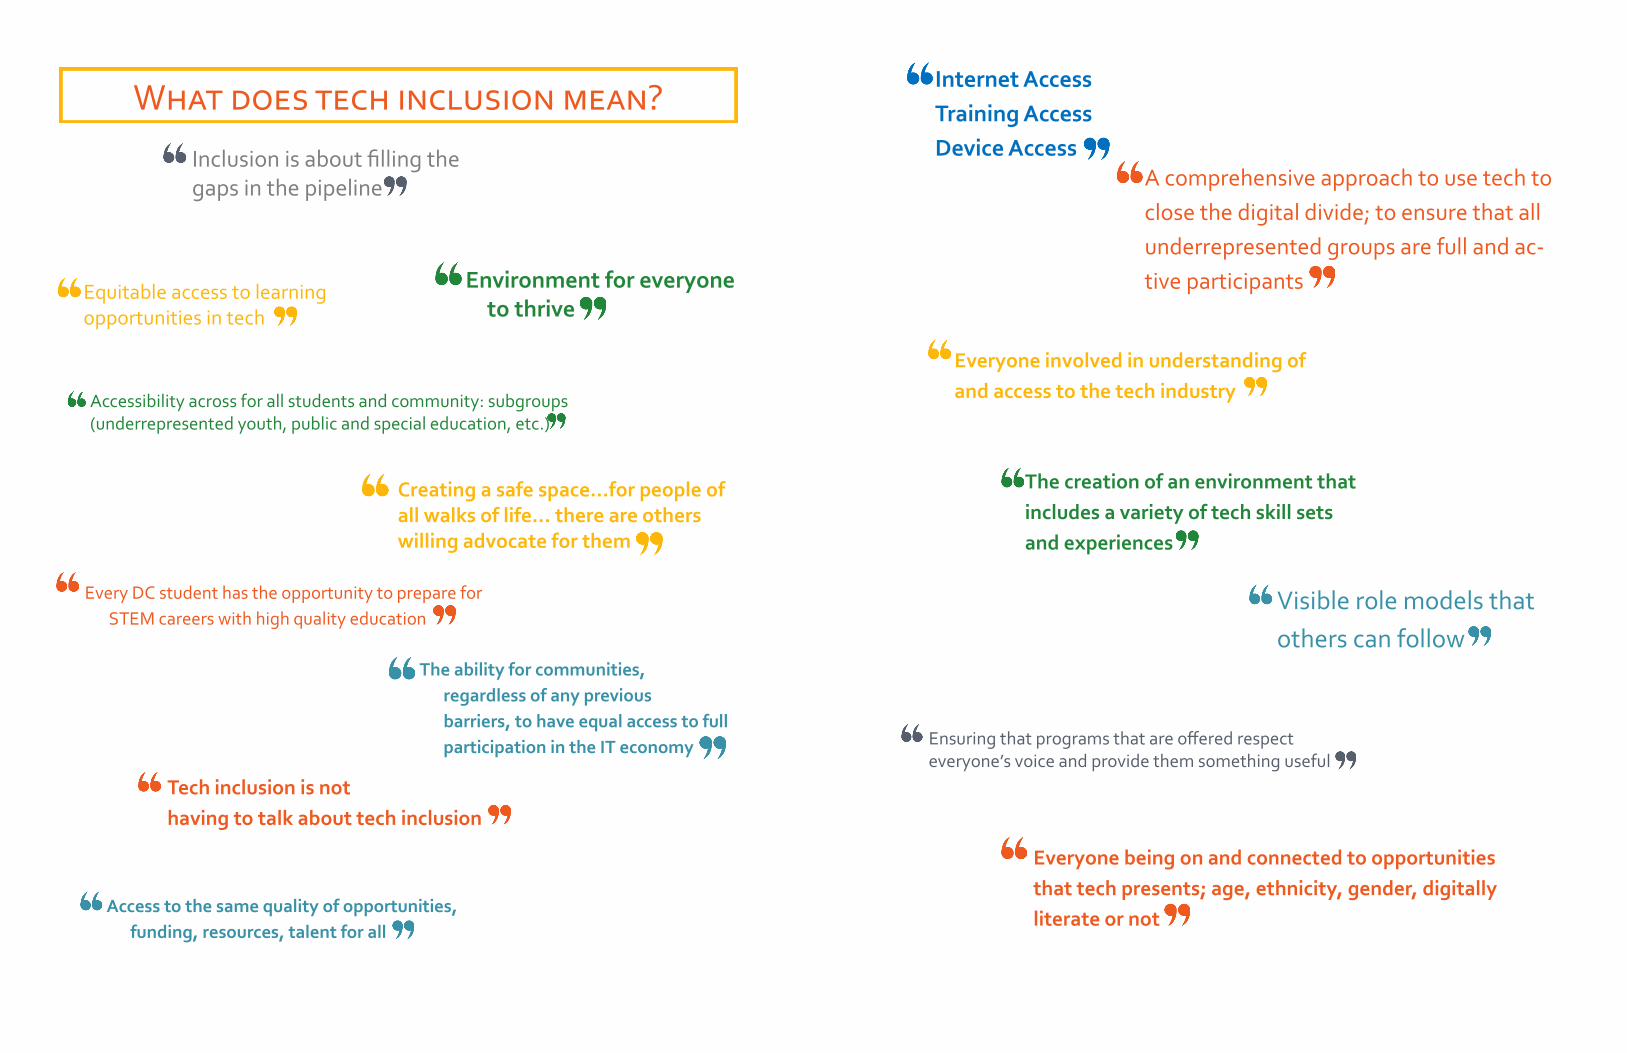
What does tech inclusion mean?
16
Transcript of What does tech inclusion mean?
2 District of Columbia Tech Inclusion Strategy
Access to the same quality of opportunities,
funding, resources, talent for all
Creating a safe space...for people of all walks of life... there are others willing advocate for them
Environment for everyone to thrive
Inclusion is about filling the gaps in the pipeline
Equitable access to learning opportunities in tech
Accessibility across for all students and community: subgroups (underrepresented youth, public and special education, etc.)
Every DC student has the opportunity to prepare for
STEM careers with high quality education
The ability for communities,
regardless of any previous
barriers, to have equal access to full
participation in the IT economy
Tech inclusion is not
having to talk about tech inclusion
What does tech inclusion mean? Internet Access
Training Access
Device Access A comprehensive approach to use tech to
close the digital divide; to ensure that all
underrepresented groups are full and ac-
tive participants
Everyone involved in understanding of
and access to the tech industry
The creation of an environment that
includes a variety of tech skill sets
and experiences
Visible role models that
others can follow
Ensuring that programs that are offered respect everyone’s voice and provide them something useful
Everyone being on and connected to opportunities
that tech presents; age, ethnicity, gender, digitally
literate or not
30 District of Columbia Tech Inclusion Strategy
Executive Committee
Brian Kenner DC Office of the Deputy Mayor for Planning and Economic Development Andrew Trueblood DC Office of the Deputy Mayor for Planning and Economic Development Karima Woods DC Office of the Deputy Mayor for Planning and Economic Development Joycelyn James DC Office of the Deputy Mayor for Planning and Economic Development Erin Horne McKinney DC Office of the Deputy Mayor for Planning and Economic Development (formerly) Consultants Jay Brown Alvarez & Marsal Jenifer Boss Alvarez & Marsal Sooji Im Alvarez & Marsal Special Advisors Barron H. Harvey Howard University School of Business Anthony Wilson Howard University School of Business Diversity Advisors Brandon Ellis Ghost Note Steven Jumper Ghost Note Adeleke Omitowoju Ghost Note Reggie Snowden Ghost Note Student Advisors Victor Adimoraegbu Howard University School of Business Felix Asamoah-Darko Howard University School of Business
Acknowledgements
Monique Hughes Howard University School of Business Uchenna C. Onwuegbusi Howard University School of Business Interview and Focus Group Participants Lauren Allen DC Public Schools Victoria Baatin-Murray DC Commission on Arts and Humanities Joseph Best-James Vanilla Frame Monique Biviere Byte Back Charles Bunton Little Math Genius Deborah Carrol DC Department of Employment Services Alfredo Casta Cascades Tech Kim Cherry DC Public Schools Maurita Coley Multicultural Media, Telecom and Internet Council Anna Consani Spring Board Wayne Curtis University of the District of Columbia Michael Digafe IBM Ron Estrada Univision Communications Inc. Sheree Finley DC Department of Employment Services Aaron Fitzgerald Ncrease Maya Garcia DC Office of the State Superintendent of Education Dean Garfield Information Tech Industry Council Lawrence Greenberg The Motley Fool
Katia Grigoriants Carnegie Academy for Science Education Amanda Guzman Lumia Capital Anthony Hayter Stemboard Mike Healy Nextility Sheila Herrling CASE Foundation Robert Holm On Ramps to Careers; McKinley Tech High School, Washington, DC Erica Jacquez Girls Inc. DC Mark J. Jeach Community Tech Michael Johnson Preneur Hub Marlena Jones Carnegie Academy for Science Education Lisa Jones SafeTComm, Inc Sakina Khan DC Office of Planning Caesar Layton Cultivate Ventures Curvin Leatham Area Prove Mark Levine Core Capital Elizabeth Lindsey Byte Back Yohance Maqubela Courtland Business Group Worku Mengesha DC Office of the Chief Technology Officer Unique Morris-Hughes DC Department of Employment Services Pamela Nieto Greater Washington Hispanic Chamber of Commerce Maxime Paul PitchLove
Gerren Price DC Department of Employment Services Phil Reeves DC Department of Small and Local Business Development (formerly) Angel Rich The Wealth Factory Adam Rubinson Deloitte Ryan Ross Halcyon Incubator Sage Salvo Words Liive Adam Segal Cove Meeta Sharma-Holt Techbridge Julia Spicer Mid-Atlantic Venture Association Delano Squires DC Office of the Chief Technology Officer Sam Swiller Gallaudet University Bock Szymkowicz Byte Back Edith Westfall Community College of the District of Columbia Sue P. White Institute for Education Resources George Williams DC Public Library Marullus Willams Limbic Systems
District of Columbia Tech Inclusion Strategy 3
Dear District Residents,
As we move through the 21st century, cities across the country are looking for inclusive and innovative ways to grow their economies, create jobs, and tackle some of the biggest challenges facing their residents.
The District of Columbia is forging a new path toward an inclusive economy, one that supports our thriving technology and innovation ecosystem - but will do so in a way that creates equitable opportunities for all D.C. residents. Given the strength of our diversity, I firmly believe the District is uniquely positioned to be a national model for technology inclusion and entrepreneurship.
We have made great progress, but there is still much work to be done to ensure our technology ecosystem reaches its full potential. Today I am pleased to present “Pathways to Inclusion,” a study that offers the current state of inclusion in our tech economy, and also highlights the barriers underrepresented communities face upon entering this industry that is vital to innovative growth.
While many cities around the world have thriving tech ecosystems, the District of Columbia is one of the first major cities to study inclusive innovation in depth, with three goals in mind: First, we will expand the capacity of D.C. residents to engage in the tech ecosystem by creating 5000 new tech jobs for underrepresented workers. Second, we will grow our tech economy by creating 500 new tech businesses founded by underrepresented entrepreneurs. Third, building on our city’s notable diversity, we will establish the most inclusive culture among tech ecosystems on the East Coast.
Working in collaboration with the District of Columbia’s Innovation & Technology Inclusion Council, our hope is to become the nation’s premier inclusive tech hub, creating new opportunities that allow DC’s entrepreneurs to flourish and offering actionable steps toward expanding our technology economy in a way that benefits everyone.
I want to thank our local technology industry, non-profits, government leaders, and residents who shared their expertise and creative ideas for this study. Together, we will use “Pathways to Inclusion” as a tool to help transform the District into a more inclusive, innovative, and equitable city.
SIGNATURE
Muriel Bowser
Mayor
4 District of Columbia Tech Inclusion Strategy
Members of the Mayor’s Innovation and Technology Inclusion Council
Rey Ramsey (Chair) Brian Kenner Philippe Chetrit Wayne Curtis Travis Dougherty Ken Eisner
Kate Goodall Corey Griffin Barron Harvey Joycelyn James Lisa Jones Johnson Caesar Layton Yoshi Maisami
Carlos Martin del Campo Hannah E Rho Adam Rubinson Thomas Sanchez Aaron Saunders Delano Squires Ken Tolson
Amber Wason Chad Womack Karima Woods
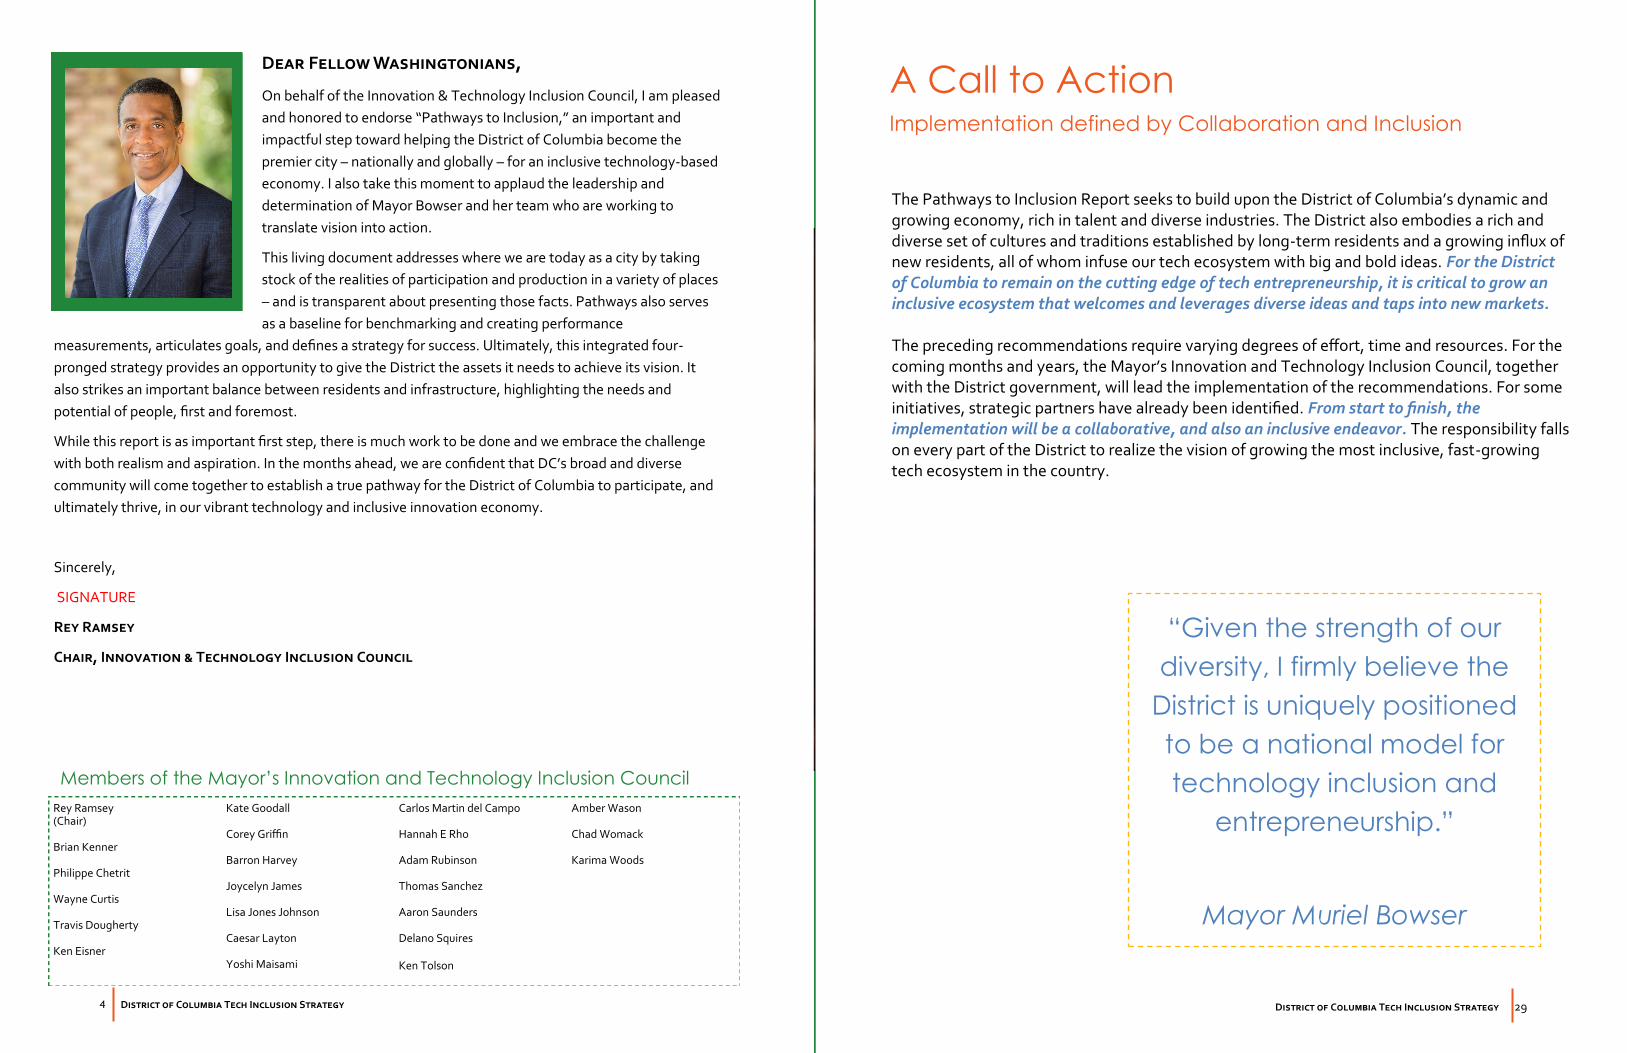
Dear Fellow Washingtonians,
On behalf of the Innovation & Technology Inclusion Council, I am pleased
and honored to endorse “Pathways to Inclusion,” an important and
impactful step toward helping the District of Columbia become the
premier city – nationally and globally – for an inclusive technology-based
economy. I also take this moment to applaud the leadership and
determination of Mayor Bowser and her team who are working to
translate vision into action.
This living document addresses where we are today as a city by taking
stock of the realities of participation and production in a variety of places
– and is transparent about presenting those facts. Pathways also serves
as a baseline for benchmarking and creating performance
measurements, articulates goals, and defines a strategy for success. Ultimately, this integrated four-
pronged strategy provides an opportunity to give the District the assets it needs to achieve its vision. It
also strikes an important balance between residents and infrastructure, highlighting the needs and
potential of people, first and foremost.
While this report is as important first step, there is much work to be done and we embrace the challenge
with both realism and aspiration. In the months ahead, we are confident that DC’s broad and diverse
community will come together to establish a true pathway for the District of Columbia to participate, and
ultimately thrive, in our vibrant technology and inclusive innovation economy.
Sincerely,
SIGNATURE
Rey Ramsey
Chair, Innovation & Technology Inclusion Council
District of Columbia Tech Inclusion Strategy 29
The Pathways to Inclusion Report seeks to build upon the District of Columbia’s dynamic and growing economy, rich in talent and diverse industries. The District also embodies a rich and diverse set of cultures and traditions established by long-term residents and a growing influx of new residents, all of whom infuse our tech ecosystem with big and bold ideas. For the District of Columbia to remain on the cutting edge of tech entrepreneurship, it is critical to grow an inclusive ecosystem that welcomes and leverages diverse ideas and taps into new markets. The preceding recommendations require varying degrees of effort, time and resources. For the coming months and years, the Mayor’s Innovation and Technology Inclusion Council, together with the District government, will lead the implementation of the recommendations. For some initiatives, strategic partners have already been identified. From start to finish, the implementation will be a collaborative, and also an inclusive endeavor. The responsibility falls on every part of the District to realize the vision of growing the most inclusive, fast-growing tech ecosystem in the country.
A Call to Action Implementation defined by Collaboration and Inclusion
“Given the strength of our
diversity, I firmly believe the
District is uniquely positioned
to be a national model for
technology inclusion and
entrepreneurship.”
Mayor Muriel Bowser

28 District of Columbia Tech Inclusion Strategy
District of Columbia Tech Inclusion Strategy 5
TABLE OF CONTENTS
Vision for DC’s Pathways to Inclusion .................................... 7
Technology Inclusion Scorecard ............................................ 8
Inclusive Entrepreneurship Strategy...................................... 9
Recommendations ................................................................... 10
Foundation ....................................................................... 11
Capacity ............................................................................ 12
Capital ............................................................................... 13
Awareness ........................................................................ 14
Data Analysis & Key Findings ................................................... 15
Tech Inclusion Analysis .................................................. 16
Methodology ................................................................... 16
Innovation Infrastructure .............................................. 17
Education ......................................................................... 19
Employment ...................................................................... 22
Entrepreneurship ............................................................ 25
A Call to Action ...................................................................... 29
Acknowledgements ................................................................ 30
6 District of Columbia Tech Inclusion Strategy
District of Columbia Tech Inclusion Strategy 27
Social networks offering critical success factors are not frequented by underrepresented entrepreneurs
Underrepresented entrepreneurs have limited access to capital
Underrepresented entrepreneurs lack visibility
DC Government programs do not promote inclusion
• Limited mentorship for Black entrepreneurs
• No definitive source for resources – people rely on their networks
• DC is not collaborative
• VCs invest in people like themselves; few firms have diversity
• Incentives are not available at the angel/seed level
• Entrepreneurs are unprepared for investor pitches
• Few models of successful entrepreneurs at events or in media
• Few models of success in tech at events or in media
• Limited media coverage of Black entrepreneurs obtaining funding
• Resources are misallocated – should be spread to many companies, not focused on few
• Government does not partner with entrepreneurs in the marketplace
Barriers to Tech Inclusion for Entrepreneurs
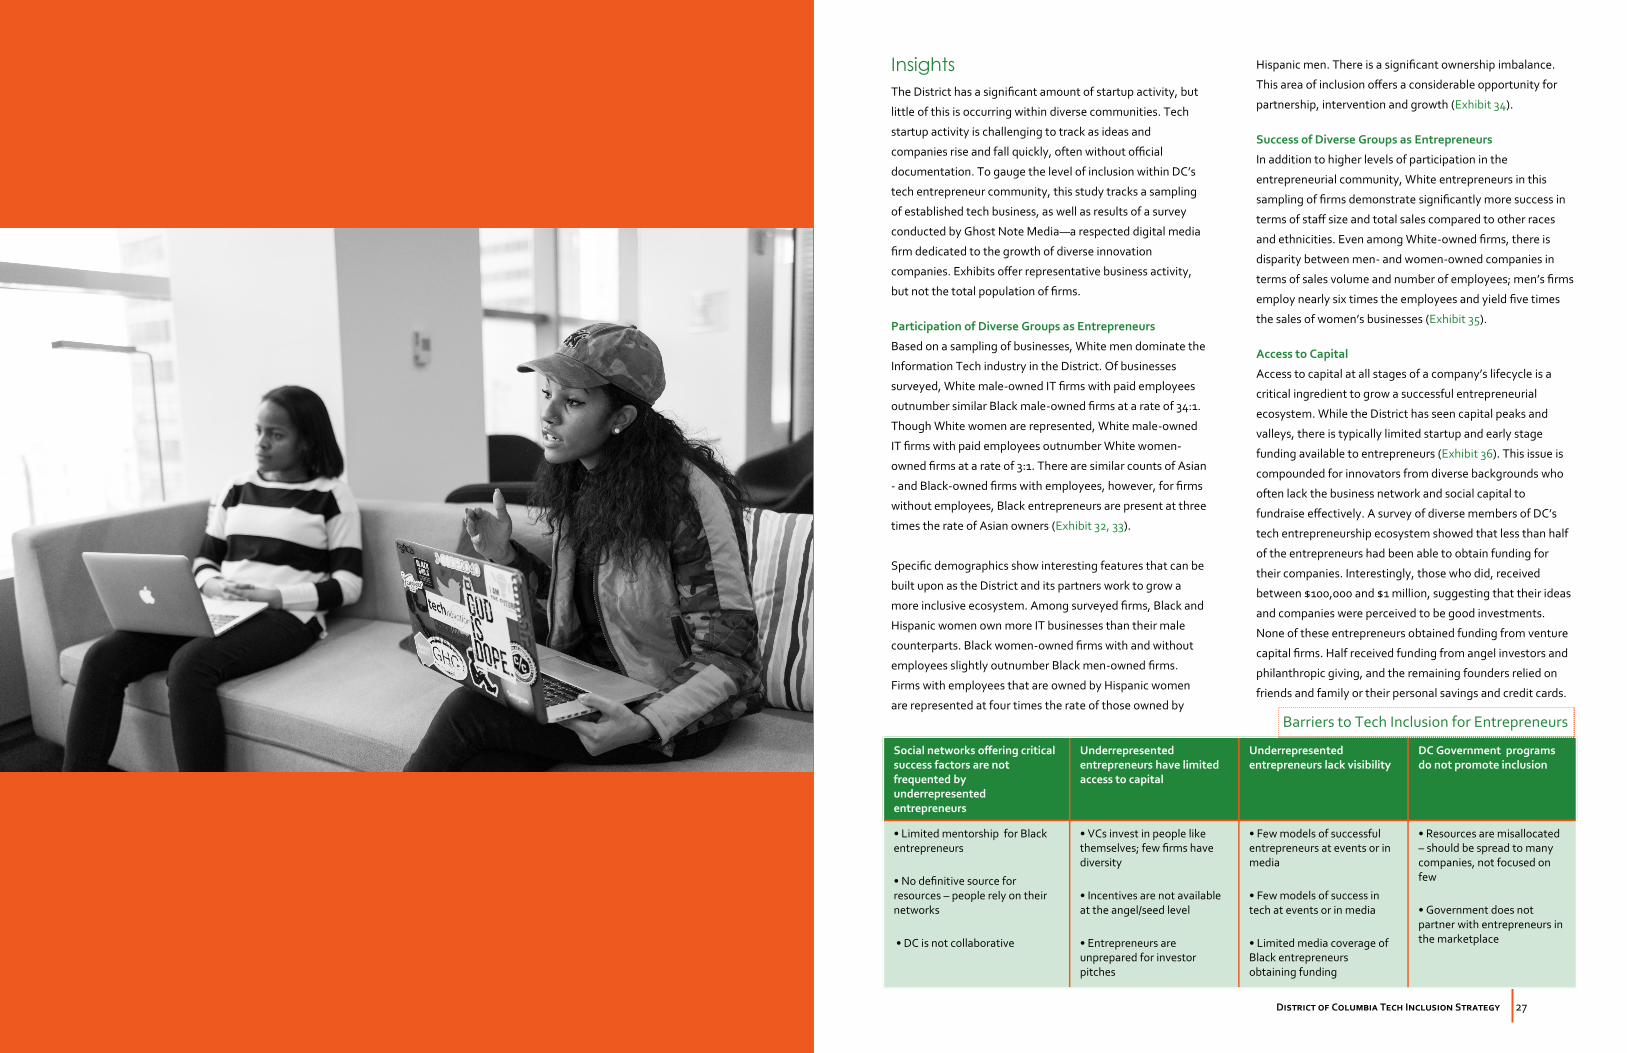
Insights
The District has a significant amount of startup activity, but
little of this is occurring within diverse communities. Tech
startup activity is challenging to track as ideas and
companies rise and fall quickly, often without official
documentation. To gauge the level of inclusion within DC’s
tech entrepreneur community, this study tracks a sampling
of established tech business, as well as results of a survey
conducted by Ghost Note Media—a respected digital media
firm dedicated to the growth of diverse innovation
companies. Exhibits offer representative business activity,
but not the total population of firms.
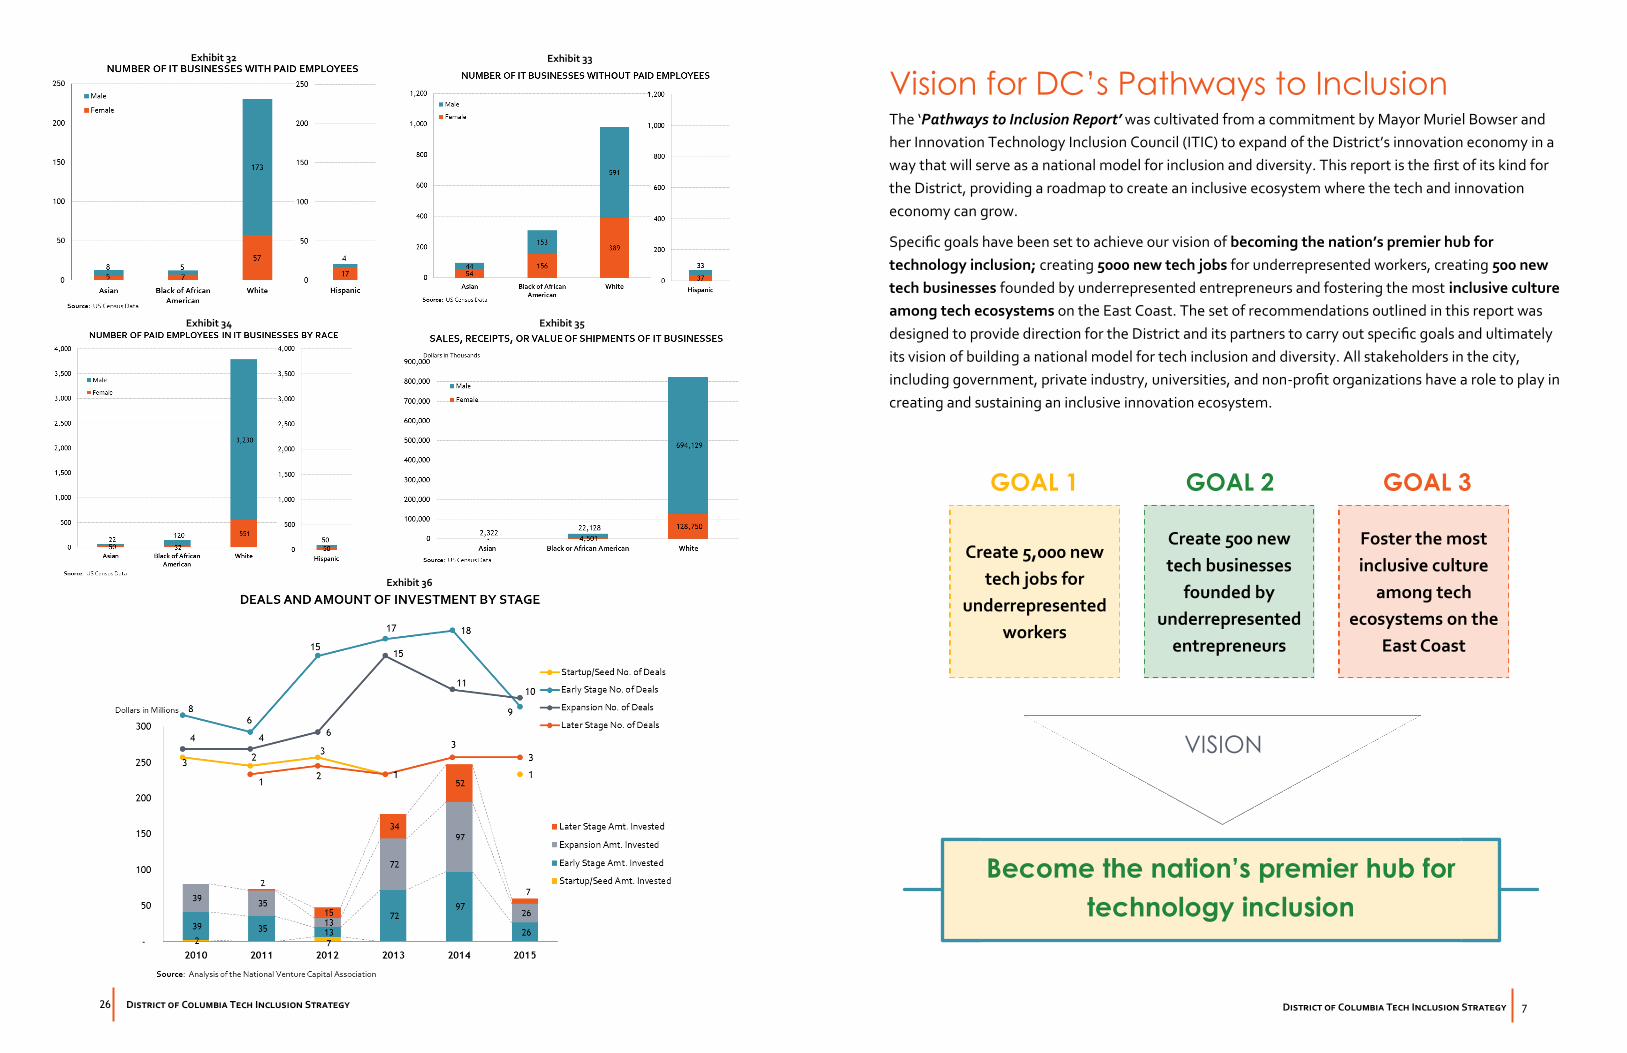
Participation of Diverse Groups as Entrepreneurs
Based on a sampling of businesses, White men dominate the
Information Tech industry in the District. Of businesses
surveyed, White male-owned IT firms with paid employees
outnumber similar Black male-owned firms at a rate of 34:1.
Though White women are represented, White male-owned
IT firms with paid employees outnumber White women-
owned firms at a rate of 3:1. There are similar counts of Asian
- and Black-owned firms with employees, however, for firms
without employees, Black entrepreneurs are present at three
times the rate of Asian owners (Exhibit 32, 33).
Specific demographics show interesting features that can be
built upon as the District and its partners work to grow a
more inclusive ecosystem. Among surveyed firms, Black and
Hispanic women own more IT businesses than their male
counterparts. Black women-owned firms with and without
employees slightly outnumber Black men-owned firms.
Firms with employees that are owned by Hispanic women
are represented at four times the rate of those owned by
Hispanic men. There is a significant ownership imbalance.
This area of inclusion offers a considerable opportunity for
partnership, intervention and growth (Exhibit 34).
Success of Diverse Groups as Entrepreneurs
In addition to higher levels of participation in the
entrepreneurial community, White entrepreneurs in this
sampling of firms demonstrate significantly more success in
terms of staff size and total sales compared to other races
and ethnicities. Even among White-owned firms, there is
disparity between men- and women-owned companies in
terms of sales volume and number of employees; men’s firms
employ nearly six times the employees and yield five times
the sales of women’s businesses (Exhibit 35).
Access to Capital
Access to capital at all stages of a company’s lifecycle is a
critical ingredient to grow a successful entrepreneurial
ecosystem. While the District has seen capital peaks and
valleys, there is typically limited startup and early stage
funding available to entrepreneurs (Exhibit 36). This issue is
compounded for innovators from diverse backgrounds who
often lack the business network and social capital to
fundraise effectively. A survey of diverse members of DC’s
tech entrepreneurship ecosystem showed that less than half
of the entrepreneurs had been able to obtain funding for
their companies. Interestingly, those who did, received
between $100,000 and $1 million, suggesting that their ideas
and companies were perceived to be good investments.
None of these entrepreneurs obtained funding from venture
capital firms. Half received funding from angel investors and
philanthropic giving, and the remaining founders relied on
friends and family or their personal savings and credit cards.
26 District of Columbia Tech Inclusion Strategy
Exhibit 35 Exhibit 34
Exhibit 32 Exhibit 33
Exhibit 36
District of Columbia Tech Inclusion Strategy 7
Vision for DC’s Pathways to Inclusion The ‘Pathways to Inclusion Report’ was cultivated from a commitment by Mayor Muriel Bowser and
her Innovation Technology Inclusion Council (ITIC) to expand of the District’s innovation economy in a
way that will serve as a national model for inclusion and diversity. This report is the first of its kind for
the District, providing a roadmap to create an inclusive ecosystem where the tech and innovation
economy can grow.
Specific goals have been set to achieve our vision of becoming the nation’s premier hub for
technology inclusion; creating 5000 new tech jobs for underrepresented workers, creating 500 new
tech businesses founded by underrepresented entrepreneurs and fostering the most inclusive culture
among tech ecosystems on the East Coast. The set of recommendations outlined in this report was
designed to provide direction for the District and its partners to carry out specific goals and ultimately
its vision of building a national model for tech inclusion and diversity. All stakeholders in the city,
including government, private industry, universities, and non-profit organizations have a role to play in
creating and sustaining an inclusive innovation ecosystem.
Become the nation’s premier hub for
technology inclusion
Create 5,000 new
tech jobs for
underrepresented
workers
Create 500 new
tech businesses
founded by
underrepresented
entrepreneurs
Foster the most
inclusive culture
among tech
ecosystems on the
East Coast
VISION
GOAL 1 GOAL 2 GOAL 3

8 District of Columbia Tech Inclusion Strategy
Technology Inclusion Scorecard In its effort to assess the level of tech inclusion in DC, and thus inform strategies and recommendations, the District
devised a Technology Inclusion Scorecard. The Scorecard summarizes the current state of inclusion within the District
using 32 sets of data that show participation and success rates in the four key functional areas used in this report:
innovation infrastructure, education, employment, and entrepreneurship. Each score is rated out of 5.
Among the four areas, entrepreneurship requires the most immediate attention and improvement. The average of the
scores within this area is 1.1. Not only are diverse groups falling behind in the ownership of tech businesses, the success
level of businesses owned by them is also below average.
Within innovation infrastructure, with an average 3.3, investment in tech businesses when compared with other major
US cities, yields a low score. This calls for action in building a critical mass of tech activity to attract investment.
Education scores 3.5, with room for improvement in building a strong pipeline and ensuring that the gaps in test scores
and achievement levels among diverse groups narrow.
From the datasets, it is evident that the level of one’s education plays an important role in entering the tech economy.
Making STEM (science, technology, engineering and math) degree attainment more viable and catalyzing the growth
of non-bachelor tech occupations will be vital to increasing inclusion at the employment level.
DC TECHNOLOGY INCLUSION SCORECARD
INNOVATION INFRASTRUCTURE EMPLOYMENT
EDUCATION
Access to a computer at home
Adoption of broadband at home
Adoption of broadband at home for low
income households
Access to a public computer
Investment in tech industry
Total amount of SBIR & STTR awards
Tech occupation participation by race
Tech occupation participation by gender
Tech occupation participation by disability
Tech occupation participation by same sex marriage
Income in tech occupation by race
Income in tech occupation by gender
Income in tech occupation by disability
Income in tech occupation by same sex marriage
4th grade math scores by race
8th grade math scores by race
4th grade math scores by gender
8th grade math scores by gender
% with 3+ score on AP calculus by race
% with 3+ score on AP calculus by gender
% with 3+ score on AP computer science by race
% with 3+ score on AP computer science by gender
% of degrees in STEM by race
% of degrees in STEM by gender
IT business ownership by race
IT business ownership by gender
IT business employee counts by race
IT business employee counts by gender
IT business sales by race
IT business sales by gender
4.0 3.2
2.1 1.3
3.0
2.4
4.7
1.8
3.7
2.1
4.9
4.9
2.4
4.1
3.3
3.1
3.3
4.9
3.6
4.9
4.1
5.0
4.3
4.9
4.9
1.3
1.9
1.1
0.4
0.8
1.2
Average: 3.3
Average: 4.0
Average: 3.5
Average: 1.1
ENTREPRENEURSHIP
District of Columbia Tech Inclusion Strategy 25
Interview and
Focus Group Findings Access to social, human, and financial capital comprise the
most significant barriers to entry and success for
underrepresented entrepreneurs. The District was described
by participants as less collaborative than major west coast
centers of innovation. Though many resources are available
for entrepreneurs, they are diffuse and difficult to locate
without access to a myriad of social networks.
Survey participants, most of whom are diverse
entrepreneurs, policy advocates and professionals in the
District, rated DC’s inclusiveness at an average 5.2 out of 10
(Exhibit 30). DC is a more inclusive city in the eyes of
newcomers. Those with over 7 years of residence in DC rated
the city’s inclusiveness at an average 4.8, whereas those with
shorter tenures gave a higher rating on average (Exhibit 31).
As the majority of the participants in the survey were long
term residents, this lowered the overall rating. Moreover, out
of those that expressed an opinion, 69% said that DC is on
par with, or marginally better than other cities.
Access to capital was identified most frequently by surveyed
entrepreneurs (58%) as a barrier to inclusiveness in DC,
followed by implicit bias (48%), access to networks (48%),
and access to talent enablement programs (23%). Venture
capitalists tend to invest in companies founded by people
Entrepreneurship
like themselves or those who match the profile of previously
successful founders, thus perpetuating a lack of diversity
among funded companies. Those entrepreneurs who
arrange meetings with investors are often unequipped to
pitch their ideas effectively.
Though the District offers an impressive suite of tax
incentives to mature tech firms, they offer limited incentives
for early stage startups, that are most in need. The District
has found success with many of its investments in the tech
industry and there is an opportunity to expand upon this by
dispersing resources to businesses at various stages of
growth.
A significant barrier to entry in the District’s ecosystem by
diverse founders is the lack of role models. There are few
examples of successful technologists or entrepreneurs from
underrepresented communities. This lack of visibility
discourages would-be entrepreneurs from pursuing their
ideas entirely, or persevering through inevitable challenges.
The District needs to improve its culture of inclusion. Many
entrepreneurs feel uncomfortable or unwelcome at the city’s
largest hubs of innovation, major tech entrepreneurship
events, and even in programs designed to improve their
success.
Growing an ecosystem where diverse entrepreneurs can thrive will help the District attract talent, enable
entrepreneurial residents, and establish itself as a premier hub for tech inclusion.
Exhibit 30 Exhibit 31

24 District of Columbia Tech Inclusion Strategy
their firms in the future (Exhibit 21).
Same-sex married couples are well represented in comparison.
Approximately 2% of DC tech workers are in same-sex
marriages, whereas only 1% of the workers in the city overall
self reported to be in a same-sex marriage (Exhibit 22).
Conversely, 9% of the working population under age 60 in the
city reported having one or more disabilities, but only 1% of
the tech workers have the same attribute (Exhibit 23).
Education is a major hurdle for individuals hoping to enter the
tech industry in DC, as tech jobs that do not require a
bachelor’s degree are scarce. Eighty eight percent of tech jobs
in DC require a bachelor’s degree, though nearly half of DC’s
population do not have one (Exhibit 24).
Success of Diverse Groups in Tech Industry
The level of tech worker success, as measured by income in
this report, does not show great disparity. The percentage of
Black tech workers earning over $80,000 is 29%, while that of
White workers is 33%. For Asians and Non-white Hispanics,
the ratio is slightly higher than that of the White population, at
37% and 34%, respectively (Exhibit 25).
There is a larger ratio of tech workers with one or more
disabilities (51%) that earn more than $80,000, than those
without disability (45%) (Exhibit 26). Similarly, income levels
of same-sex married tech workers in DC are higher than non
same-sex married workers. Fifty seven percent of same-sex
married tech workers make over $80,000, while the figure is
45% for non same-sex married workers (Exhibit 28).
Income disparity between gender groups is noticeably higher
than it is for other demographics. Only 35% of female workers
earn more than $80,000 compared to 51% of males (Exhibit
27). As might be expected, income levels correlate with age;
older tech workers earn higher salaries (Exhibit 29).
The data reveals that once one has entered the tech industry,
success is not distinctly affected by individual characteristics.
Barriers to entry, however, are high, especially the barrier of
education.
Exhibit 26
Exhibit 27
Exhibit 28
Exhibit 29
Exhibit 25
District of Columbia Tech Inclusion Strategy 9
To transform into an inclusive tech hub, the District and key partners must embark on a strategy that addresses
common barriers faced by underrepresented entrepreneurs. Scorecard data and stakeholder feedback reveal four
significant barriers that will be combated during implementation of this strategy. Beginning with foundational tools
that sow the seeds of future tech success and build educational and workforce capacity, the District and its partners
must ensure that residents are prepared to embrace growing tech jobs and offer valuable skills.
Beyond foundational capacity, potential entrepreneurs should be inspired by seeing examples of successful
entrepreneurs from diverse backgrounds. This awareness of their own potential can support underrepresented
entrepreneurs during difficult times and shed light on a network of mentors, colleagues, and customers. Perhaps
most critical to growing an inclusive entrepreneurial tech ecosystem is access to capital in various forms, including
human, social, and financial. Companies nationwide and in the District struggle to find talent and financial capital
necessary to grow. Often they lack inclusion in social networks that could connect them to these vital resources.
The District of Columbia will pursue a strategy that addresses these four barriers. Successfully tackling these
challenges will enable the District to reach the ambitious tech inclusion goals shown below.
Inclusive Entrepreneurship Strategy
FOUNDATION
PROVIDE THE
GROUNDWORK TO
PARTICIPATE IN THE
INNOVATION ECONOMY
CAPACITY
DEVELOP OPPORTUNITIES
FOR EDUCATION AND
WORKFORCE
DEVELOPMENT
AWARENESS
DEVELOP INITIATIVES THAT
HIGHLIGHT THE
ECOSYSTEM’S
DIVERSITY
CAPITAL
EXPAND ACCESS TO
HUMAN, SOCIAL, &
FINANCIAL CAPITAL
Recommendations

10 District of Columbia Tech Inclusion Strategy
Recommendations
District of Columbia Tech Inclusion Strategy 23
Networking is lacking and unconscious bias is common
Many job training programs are inadequate
Training programs need to consider other basic needs of job seekers
DC Government programs do not promote inclusion
There are not enough diverse leaders in tech
• Networking and referrals in tech jobs play a big role
• Tech industry tends to refrain from hiring outside the box
• Training opportunities are not shared through relevant networks
• Too many programs are focused on entry level positions
• Quality of community college workforce development training is inconsistent and poor
• Employer training in SYEP programs is not provided
• Soft skills training is not offered
• Housing problems and legal challenges discourage students from learning
• Programs need to be supported with provision of broadband and device access
• DC Government IT contract background checks limit inclusion
• There is a lack of skills training for SYEP youth
• There are few options for youth skills training
•Employer training in SYEP programs is not provided
• Lack of diverse leaders discourages job seekers from joining tech industry
Barriers to Tech Inclusion in Employment
Exhibit 21
Exhibit 22
Exhibit 23
Exhibit 24
22 District of Columbia Tech Inclusion Strategy
Interview and
Focus Group Findings To become the nation’s premier hub of tech inclusion, the
District must increase opportunities for diverse workers and
reduce barriers to entry and success. During interviews and
focus groups, participants expressed concerns over basic
needs, such as soft skills training, housing and childcare. Most
agreed that the lack of basic needs plays a leading role in
jobseekers choosing to quit training programs.
Additionally, networking plays an important role in tech
employment. Stakeholders suggested that firms should be
incentivized to provide networking opportunities to diverse
populations. They also advocated for the important role of
diverse leaders to inspire diverse people to join the industry.
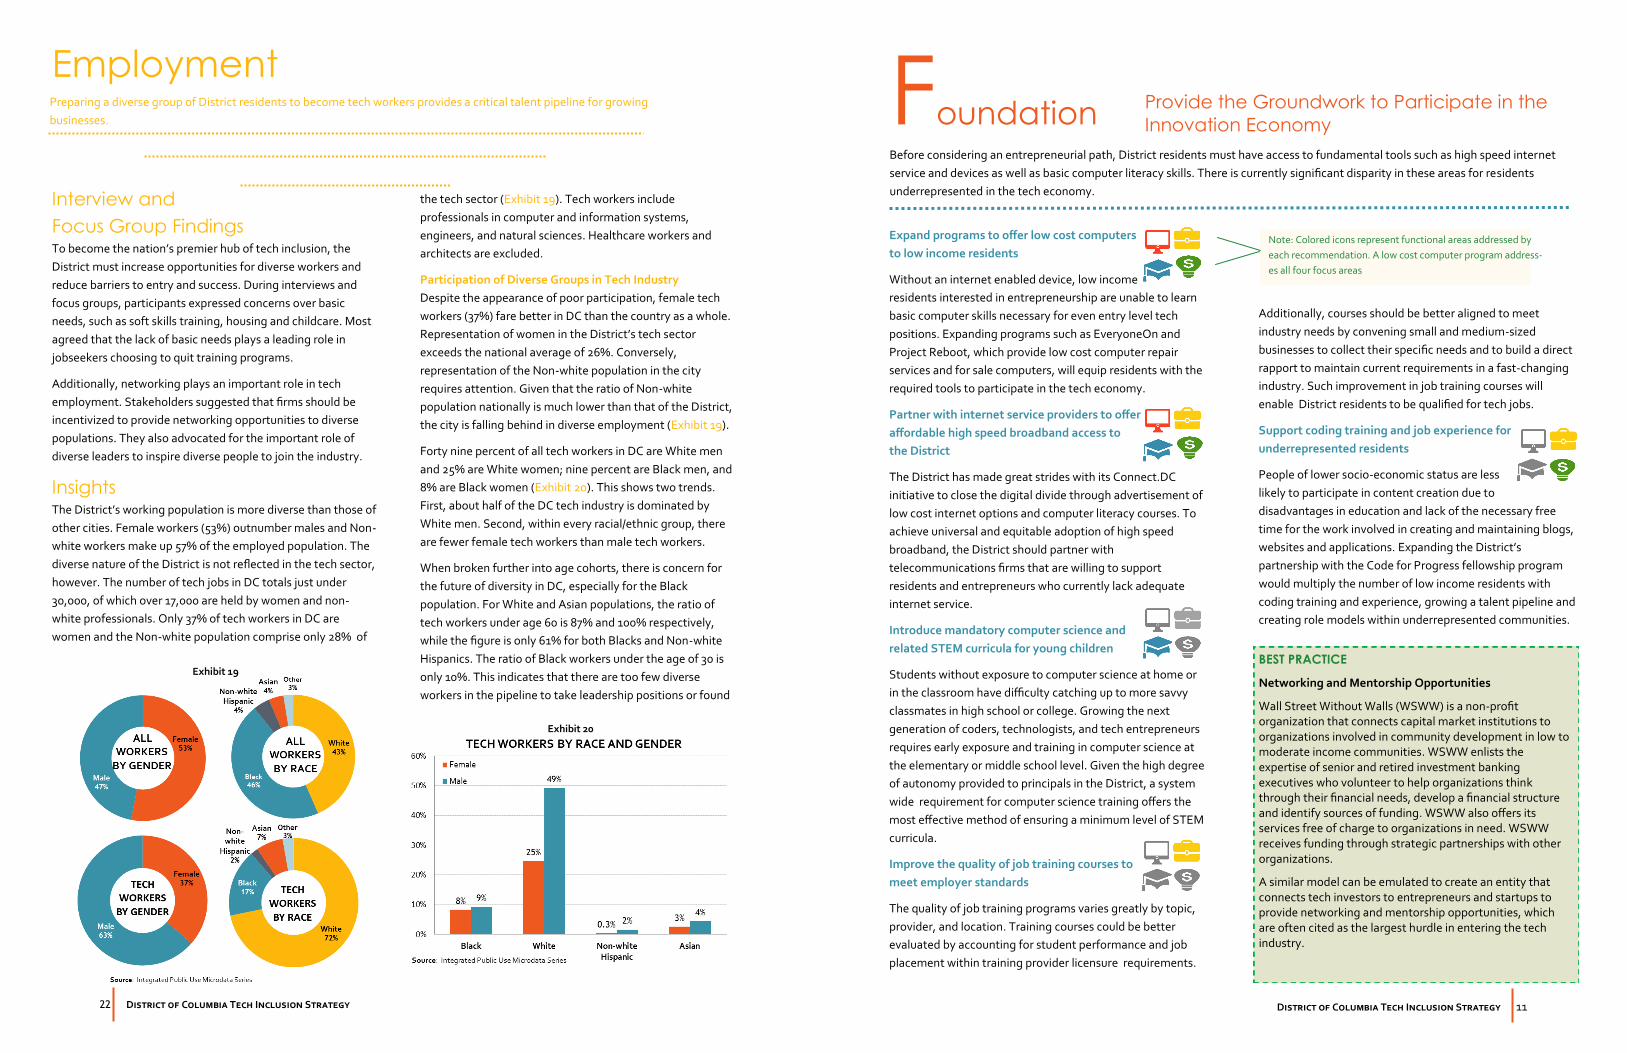
Insights The District’s working population is more diverse than those of
other cities. Female workers (53%) outnumber males and Non-
white workers make up 57% of the employed population. The
diverse nature of the District is not reflected in the tech sector,
however. The number of tech jobs in DC totals just under
30,000, of which over 17,000 are held by women and non-
white professionals. Only 37% of tech workers in DC are
women and the Non-white population comprise only 28% of
Employment
the tech sector (Exhibit 19). Tech workers include
professionals in computer and information systems,
engineers, and natural sciences. Healthcare workers and
architects are excluded.
Participation of Diverse Groups in Tech Industry
Despite the appearance of poor participation, female tech
workers (37%) fare better in DC than the country as a whole.
Representation of women in the District’s tech sector
exceeds the national average of 26%. Conversely,
representation of the Non-white population in the city
requires attention. Given that the ratio of Non-white
population nationally is much lower than that of the District,
the city is falling behind in diverse employment (Exhibit 19).
Forty nine percent of all tech workers in DC are White men
and 25% are White women; nine percent are Black men, and
8% are Black women (Exhibit 20). This shows two trends.
First, about half of the DC tech industry is dominated by
White men. Second, within every racial/ethnic group, there
are fewer female tech workers than male tech workers.
When broken further into age cohorts, there is concern for
the future of diversity in DC, especially for the Black
population. For White and Asian populations, the ratio of
tech workers under age 60 is 87% and 100% respectively,
while the figure is only 61% for both Blacks and Non-white
Hispanics. The ratio of Black workers under the age of 30 is
only 10%. This indicates that there are too few diverse
workers in the pipeline to take leadership positions or found
Exhibit 19
Exhibit 20
Preparing a diverse group of District residents to become tech workers provides a critical talent pipeline for growing
businesses.
District of Columbia Tech Inclusion Strategy 11
Expand programs to offer low cost computers
to low income residents
Without an internet enabled device, low income
residents interested in entrepreneurship are unable to learn
basic computer skills necessary for even entry level tech
positions. Expanding programs such as EveryoneOn and
Project Reboot, which provide low cost computer repair
services and for sale computers, will equip residents with the
required tools to participate in the tech economy.
Partner with internet service providers to offer
affordable high speed broadband access to
the District
The District has made great strides with its Connect.DC
initiative to close the digital divide through advertisement of
low cost internet options and computer literacy courses. To
achieve universal and equitable adoption of high speed
broadband, the District should partner with
telecommunications firms that are willing to support
residents and entrepreneurs who currently lack adequate
internet service.
Introduce mandatory computer science and
related STEM curricula for young children
Students without exposure to computer science at home or
in the classroom have difficulty catching up to more savvy
classmates in high school or college. Growing the next
generation of coders, technologists, and tech entrepreneurs
requires early exposure and training in computer science at
the elementary or middle school level. Given the high degree
of autonomy provided to principals in the District, a system
wide requirement for computer science training offers the
most effective method of ensuring a minimum level of STEM
curricula.
Improve the quality of job training courses to
meet employer standards
The quality of job training programs varies greatly by topic,
provider, and location. Training courses could be better
evaluated by accounting for student performance and job
placement within training provider licensure requirements.
Additionally, courses should be better aligned to meet
industry needs by convening small and medium-sized
businesses to collect their specific needs and to build a direct
rapport to maintain current requirements in a fast-changing
industry. Such improvement in job training courses will
enable District residents to be qualified for tech jobs.
Support coding training and job experience for
underrepresented residents
People of lower socio-economic status are less
likely to participate in content creation due to
disadvantages in education and lack of the necessary free
time for the work involved in creating and maintaining blogs,
websites and applications. Expanding the District’s
partnership with the Code for Progress fellowship program
would multiply the number of low income residents with
coding training and experience, growing a talent pipeline and
creating role models within underrepresented communities.
Foundation Provide the Groundwork to Participate in the
Innovation Economy
Before considering an entrepreneurial path, District residents must have access to fundamental tools such as high speed internet
service and devices as well as basic computer literacy skills. There is currently significant disparity in these areas for residents
underrepresented in the tech economy.
BEST PRACTICE
Networking and Mentorship Opportunities
Wall Street Without Walls (WSWW) is a non-profit organization that connects capital market institutions to organizations involved in community development in low to moderate income communities. WSWW enlists the expertise of senior and retired investment banking executives who volunteer to help organizations think through their financial needs, develop a financial structure and identify sources of funding. WSWW also offers its services free of charge to organizations in need. WSWW receives funding through strategic partnerships with other organizations.
A similar model can be emulated to create an entity that connects tech investors to entrepreneurs and startups to provide networking and mentorship opportunities, which are often cited as the largest hurdle in entering the tech industry.
Note: Colored icons represent functional areas addressed by
each recommendation. A low cost computer program address-
es all four focus areas
12 District of Columbia Tech Inclusion Strategy
Support entrepreneurship and job training
organizations seeking to work with persons
with disabilities
Though persons with disabilities are well represented as STEM
workers, there remain barriers to succeeding as entrepreneurs.
Organizations that offer job training and entrepreneurship
programming would benefit from targeted and relevant
interventions to support persons with disabilities. Examples
include sign language interpreters at events, hardware in job
training classrooms to accommodate physical disabilities, and
training on accessible web design.
Offer unique and impactful professional
development opportunities to STEM teachers
Professional development is vital to maintaining
cutting edge, engaged STEM educators. Whether from limited
funds, uninteresting courses, or the rapid changes in the tech
sector, STEM educators could be better equipped with up-to-
date industry or curriculum knowledge. Offering meaningful
experiential learning opportunities, such as NASA SpaceCamp
or Spring Break at Sea, which provide a ‘learning by doing’
approach to education, can preserve teacher curiosity and
improve classroom curricula and student results.
Launch an ‘Adopt a School’ program
Private firms and individuals often want to
support local schools but can’t easily gain entry.
An adopt a school program would create a volunteerism and
donation marketplace to connect schools with specific, clearly
defined, needs to companies and individuals. Examples
include a company funding the launch of an afterschool STEM
program, tech professionals co-teaching a computer science
course, or people volunteering at a STEM summer camp. A
third party, such as the Carnegie Academy for Science
Education, could act as an intermediary.
Launch a Tech Hire program for returning
citizens
The growth of tech jobs presents a ripe
opportunity for returning citizens. A Tech Hire program can
close the skills gap between employer needs and residents’
education by targeting training in occupational sectors
projected to grow significantly. Because the District has an
extremely limited pool of tech jobs requiring less than a four
year degree, specialized training and structured work
experience is required to prepare returning citizens for
competitive tech positions.
Expand tech firm participation in the Summer
Youth Employment Program
The Mayor’s Summer Youth Employment
Program (SYEP) has long been a prized initiative offering
students work experience, wages, and an alternative to
unproductive summer activities. Expanding the number of
students placed in tech companies will increase exposure and
demonstrate skills required to pursue careers in tech.
Additionally, employers participating in SYEP could be more
successful youth hosts if provided resources to support young,
first time, employees such as a curriculum, goals, and student
training options for the six week program term as well as
cultural sensitivity training.
Launch a Program to Partner Local Tech
Employers with Universities
Local students are not always aware of nearby
employment opportunities that exist, resulting in
a “brain drain” when they leave the city for opportunities
elsewhere. To combat this, universities and employers could
partner to build relationships that result in an employment
pipeline for graduates. Local employers also could expand
efforts to recruit interns from DC universities. Employers
could have a greater on-campus presence through industry
days and speaker series to introduce students in STEM-degree
programs to local employment opportunities.
BEST PRACTICE
Experiential Educator Learning
iPadpalooza is changing the dynamics of teacher professional development. It is a three day “learning-festival” held annual-ly where attendees are encouraged to create teams and take part in a 36 hour challenge known as the APPmazing Race. Without any direct learning on tech or apps, teams have to complete the challenge that requires an understanding and use of tech. The experience not only gives teachers tech training, but it also teaches them a ‘learning by doing’ way of education for their own students.
Growing the District’s tech economy to generate more jobs is an essential component of creating a more inclusive tech entrepreneur
ecosystem. Merely expanding available positions, however, will not support more diverse hiring if underrepresented workers are
not prepared with the education and skills necessary to meet employers needs. Building DC residents’ technical capacity is critical to
realizing more diversity in tech firms.
Capacity Develop Opportunities for Education and
Workforce Development
District of Columbia Tech Inclusion Strategy 21
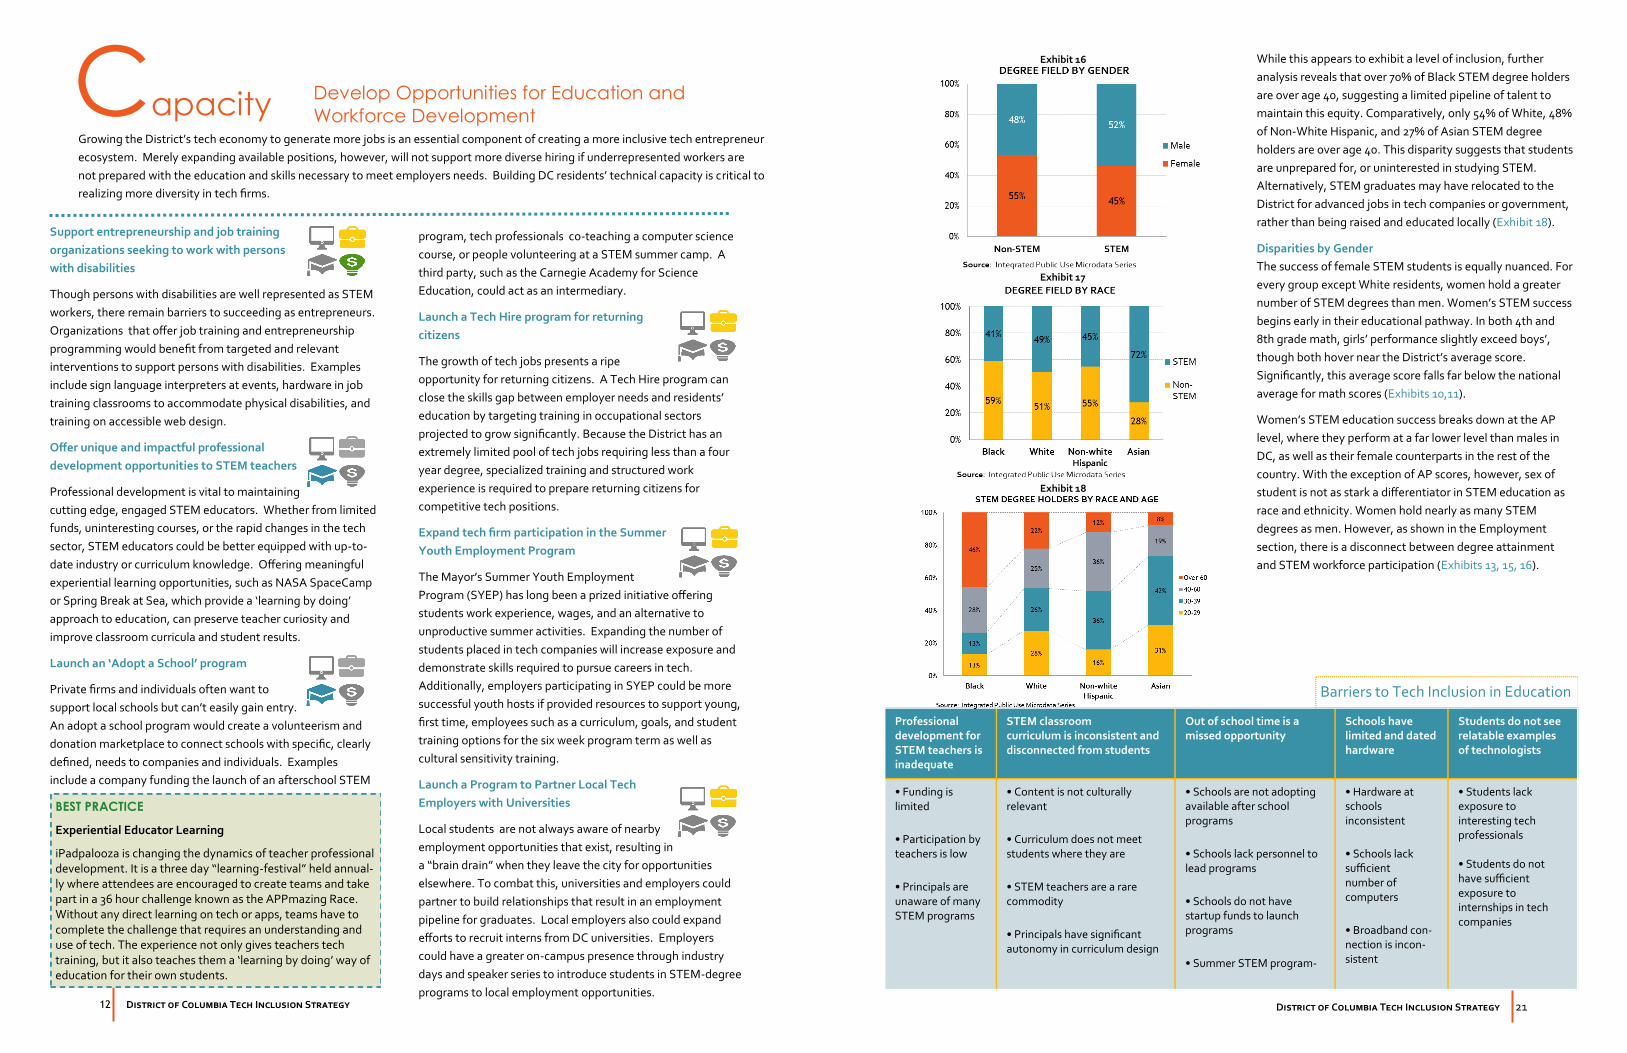
While this appears to exhibit a level of inclusion, further
analysis reveals that over 70% of Black STEM degree holders
are over age 40, suggesting a limited pipeline of talent to
maintain this equity. Comparatively, only 54% of White, 48%
of Non-White Hispanic, and 27% of Asian STEM degree
holders are over age 40. This disparity suggests that students
are unprepared for, or uninterested in studying STEM.
Alternatively, STEM graduates may have relocated to the
District for advanced jobs in tech companies or government,
rather than being raised and educated locally (Exhibit 18).
Disparities by Gender
The success of female STEM students is equally nuanced. For
every group except White residents, women hold a greater
number of STEM degrees than men. Women’s STEM success
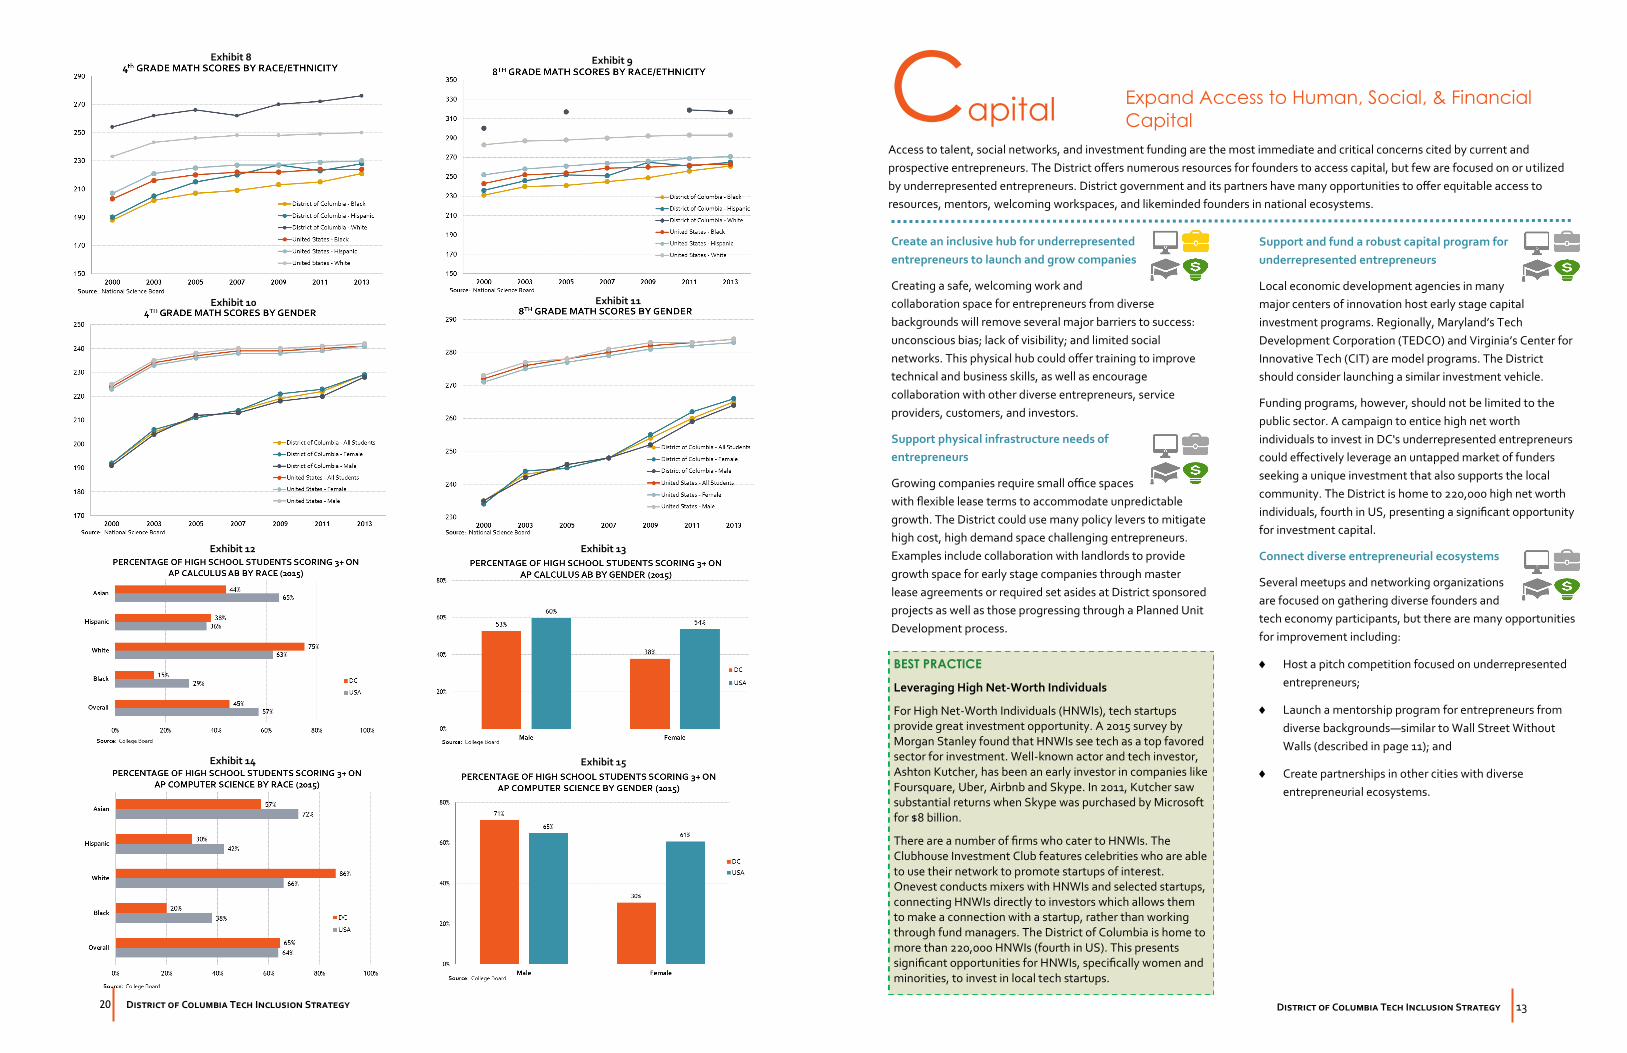
begins early in their educational pathway. In both 4th and
8th grade math, girls’ performance slightly exceed boys’,
though both hover near the District’s average score.
Significantly, this average score falls far below the national
average for math scores (Exhibits 10,11).
Women’s STEM education success breaks down at the AP
level, where they perform at a far lower level than males in
DC, as well as their female counterparts in the rest of the
country. With the exception of AP scores, however, sex of
student is not as stark a differentiator in STEM education as
race and ethnicity. Women hold nearly as many STEM
degrees as men. However, as shown in the Employment
section, there is a disconnect between degree attainment
and STEM workforce participation (Exhibits 13, 15, 16).
Professional development for STEM teachers is inadequate
STEM classroom curriculum is inconsistent and disconnected from students
Out of school time is a missed opportunity
Schools have limited and dated hardware
Students do not see relatable examples of technologists
• Funding is limited
• Participation by teachers is low
• Principals are unaware of many STEM programs
• Content is not culturally relevant
• Curriculum does not meet students where they are
• STEM teachers are a rare commodity
• Principals have significant autonomy in curriculum design
• Schools are not adopting available after school programs
• Schools lack personnel to lead programs
• Schools do not have startup funds to launch programs
• Summer STEM program-
• Hardware at schools inconsistent
• Schools lack sufficient number of computers
• Broadband con-nection is incon-sistent
• Students lack exposure to interesting tech professionals • Students do not have sufficient exposure to internships in tech companies
Barriers to Tech Inclusion in Education
Exhibit 16
Exhibit 18
Exhibit 17
20 District of Columbia Tech Inclusion Strategy
Exhibit 12 Exhibit 13
Exhibit 14 Exhibit 15
Exhibit 9
Exhibit 11 Exhibit 10
Exhibit 8
District of Columbia Tech Inclusion Strategy 13
Support and fund a robust capital program for
underrepresented entrepreneurs
Local economic development agencies in many
major centers of innovation host early stage capital
investment programs. Regionally, Maryland’s Tech
Development Corporation (TEDCO) and Virginia’s Center for
Innovative Tech (CIT) are model programs. The District
should consider launching a similar investment vehicle.
Funding programs, however, should not be limited to the
public sector. A campaign to entice high net worth
individuals to invest in DC's underrepresented entrepreneurs
could effectively leverage an untapped market of funders
seeking a unique investment that also supports the local
community. The District is home to 220,000 high net worth
individuals, fourth in US, presenting a significant opportunity
for investment capital.
Connect diverse entrepreneurial ecosystems
Several meetups and networking organizations
are focused on gathering diverse founders and
tech economy participants, but there are many opportunities
for improvement including:
Host a pitch competition focused on underrepresented
entrepreneurs;
Launch a mentorship program for entrepreneurs from
diverse backgrounds—similar to Wall Street Without
Walls (described in page 11); and
Create partnerships in other cities with diverse
entrepreneurial ecosystems.
Create an inclusive hub for underrepresented
entrepreneurs to launch and grow companies
Creating a safe, welcoming work and
collaboration space for entrepreneurs from diverse
backgrounds will remove several major barriers to success:
unconscious bias; lack of visibility; and limited social
networks. This physical hub could offer training to improve
technical and business skills, as well as encourage
collaboration with other diverse entrepreneurs, service
providers, customers, and investors.
Support physical infrastructure needs of
entrepreneurs
Growing companies require small office spaces
with flexible lease terms to accommodate unpredictable
growth. The District could use many policy levers to mitigate
high cost, high demand space challenging entrepreneurs.
Examples include collaboration with landlords to provide
growth space for early stage companies through master
lease agreements or required set asides at District sponsored
projects as well as those progressing through a Planned Unit
Development process.
Capital Access to talent, social networks, and investment funding are the most immediate and critical concerns cited by current and
prospective entrepreneurs. The District offers numerous resources for founders to access capital, but few are focused on or utilized
by underrepresented entrepreneurs. District government and its partners have many opportunities to offer equitable access to
resources, mentors, welcoming workspaces, and likeminded founders in national ecosystems.
Expand Access to Human, Social, & Financial
Capital
BEST PRACTICE
Leveraging High Net-Worth Individuals
For High Net-Worth Individuals (HNWIs), tech startups provide great investment opportunity. A 2015 survey by Morgan Stanley found that HNWIs see tech as a top favored sector for investment. Well-known actor and tech investor, Ashton Kutcher, has been an early investor in companies like Foursquare, Uber, Airbnb and Skype. In 2011, Kutcher saw substantial returns when Skype was purchased by Microsoft for $8 billion.
There are a number of firms who cater to HNWIs. The Clubhouse Investment Club features celebrities who are able to use their network to promote startups of interest. Onevest conducts mixers with HNWIs and selected startups, connecting HNWIs directly to investors which allows them to make a connection with a startup, rather than working through fund managers. The District of Columbia is home to more than 220,000 HNWIs (fourth in US). This presents significant opportunities for HNWIs, specifically women and minorities, to invest in local tech startups.
14 District of Columbia Tech Inclusion Strategy
Create marketing strategy that spotlights
diverse successful entrepreneurs and STEM
professionals
A campaign centered around the stories of successful
underrepresented technologists and entrepreneurs in DC will
offer critical role models to youth and adult innovators alike.
Spotlighting successful participants in DC’s tech and
innovation ecosystem offers the impact of encouraging more
underrepresented innovators to pursue an idea; to continue
to persevere despite challenges; as well as attracting
likeminded entrepreneurs, investors, and corporations, who
desire to be a part of an inclusive community. This can be
done by showcasing successful underrepresented
entrepreneurs and companies with inclusive hiring practices
in place. Media outlets dedicated to diversity outreach could
be potential partners.
Build a suite of resources for companies at all
stages of development
Government agencies, universities, non-profit
organizations, and industry associations offer a
myriad of resources to DC tech entrepreneurs, including
training, mentorship, networking events, pitch competitions,
and pro bono professional services. These resources would
be more helpful if they were centrally located and kept up to
date. A central online repository of key resources updated
regularly would provide a point of entry and tools necessary
for success to underrepresented entrepreneurs without deep
social networks in DC’s tech ecosystem. The Detroit
Bizgrid—an online directory that helps entrepreneurs
navigate available resources in the city of Detroit, provides a
model roadmap of resources.
Foster opportunity for diverse STEM
professionals through blind, merit-based hiring,
to reduce implicit bias
Tech employers can create more diverse workplaces by
addressing unconscious hiring bias. Using a blind hiring
mechanism such as a skills assessment, coding challenge or
nameless resume, employers can open the door to
unexpected hires. This can diversify employee composition,
helping to ensure that women, minorities and those
individuals with unique backgrounds have the opportunity to
contribute to a team. Several companies, such as Blendoor,
offer online platforms for employers seeking to anonymize
job applicants and hire based on skills and experience.
Encourage inclusive hiring among DC
contractors, including subcontractors/CBEs
that participate in inclusive job training
programs
Governments have significant purchasing power to promote
values-driven initiatives with vendors. DC currently has a
robust small and local business program. This model can be
extended to incentivize diverse hiring or funded training for
underrepresented STEM workers.
Additionally, current employment barriers for returning
citizens, such as stringent background investigations for
District IT contractors, should be evaluated to consider their
costs to ex-offenders compared to the benefits to the
District.
Awareness
Awareness manifests in many forms. To enable or expedite their success, entrepreneurs should be aware of available resources and models or mentors. Tech employers should be aware of both the level of diversity in their firms and sources of diverse talent from which they can hire. Government should be aware of how it leverages its contracting relationships to meet tech inclusion goals. Some forms of visibility can be achieved through marketing, while others require policy. However, all are critical to transforming the District’s tech ecosystem.
Develop Initiatives that Highlight the
Ecosystem’s Diversity
BEST PRACTICE
Blind Hiring
Unconscious bias is often said to influence the hiring process of many organizations in the tech industry, leading to a dis-proportionate representation of diverse groups. As an effort to eliminate such bias, companies such as Blendoor and Gapjumpers have introduced a ‘blind hiring’ process where employers screen or employ job seekers based only on their skills and abilities.
Blendoor matches employers with potential employees that meet their qualifications without the disclosure of name, race or picture. The employer only meets the potential em-ployee at the interview stage. Gapjumpers is another online service that allows employers to create tasks and choose potential employees based on the completion of these tasks, equivalent to a blind audition. By using such services and thus eliminating unconscious bias, firms are said to hire more diverse individuals they would not otherwise.
District of Columbia Tech Inclusion Strategy 19
Interview and
Focus Group Findings Participants overwhelmingly agreed on the importance of
early education and exposure to tech tools as a strategy to
improving inclusion. Many felt that students do not connect
well with curriculum that is not culturally relevant to them
nor with role models within tech who are not relatable.
Principals who are dedicated to improving STEM education
often have limited resources in terms of computer science
teachers, funding and personnel for out of school
programming, and insufficient hardware to run impactful
programs.
The high degree of school principals autonomy in curriculum
development and after school programming also makes it
difficult to offer students a consistent experience. This alone
is not an adverse factor, given that programming must meet
students at their current level or aptitude, however, it can be
problematic if a school’s leadership does not prioritize STEM
exposure and education.
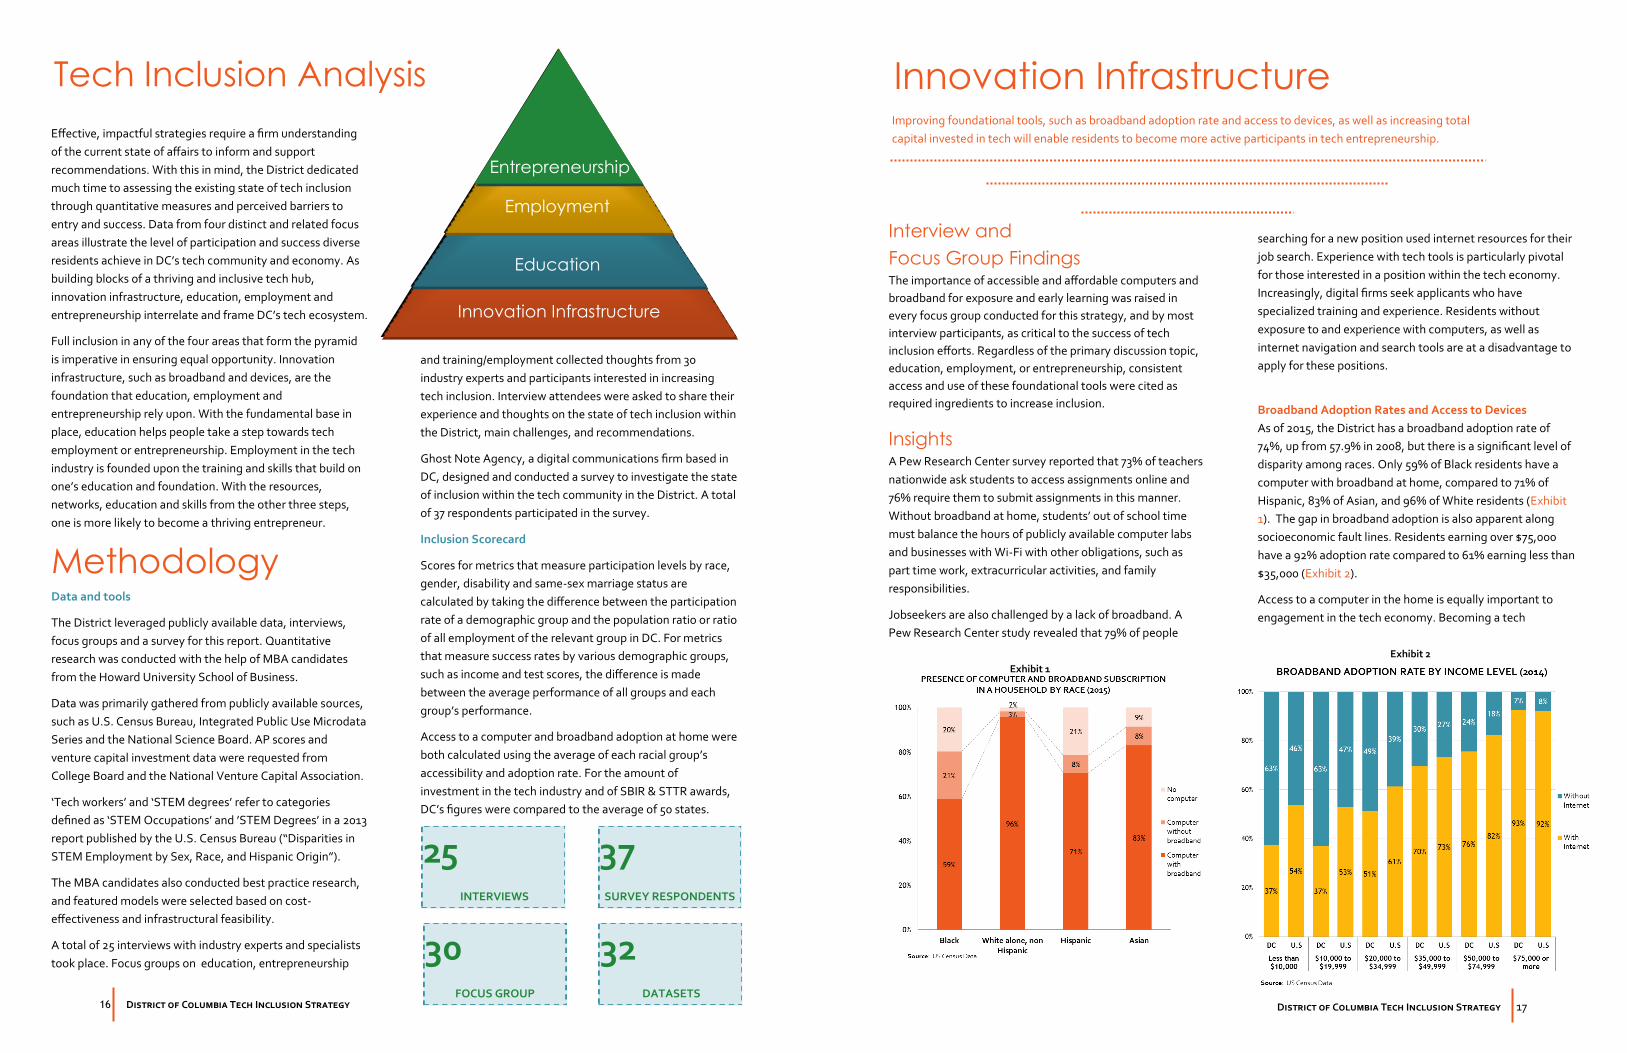
Insights Education in STEM fields is at the core of future economic
success in the tech industry. The majority (71%) of STEM
occupations are held by employees with a STEM degree
compared with 49% for non-STEM jobs. Additionally, STEM
education offers higher salaries. Seventy-one percent and
38% of STEM degree holders earn over $60,000 and
$100,000 respectively, compared to 63% and 29% of non-
STEM degree holders (Exhibits 6,7). To track tech inclusion
through education, and thus opportunities to become a tech
entrepreneur or join a growing tech firm, this report analyzes
key groups’ participation and success across the elementary,
middle, high school, and higher education levels.
Disparities by Race
Black and Hispanic populations underperform in math
compared to their White peers in 4th grade, and continue to
fall behind throughout middle and high school. These
students’ academic achievement falls slightly behind the
national averages for their peers at the elementary and
middle school levels. White students’ math scores in DC,
conversely, far exceed the national average for their White
peers. Additionally, White students in DC are the only group
with an average score designated as “Proficient” by testing
Education
standards. It is worth noting that these figures include both
public and private school students (Exhibits 8,9,10,11).
Having started on a similar footing, Hispanic students exceed
Black student achievement in terms of AP Computer Science
and Calculus testing success, but both fall behind their peers
nationally. Just 30% of Hispanic students and 20% Black
students in DC pass AP Computer Science with a score of 3 or
higher compared to national rates of 42% and 38%
respectively. The only group to exceed the national average
of students scoring higher than a 3 on either the AP
Computer Science (86%) or Calculus (75%) exams were
White students in DC (Exhibits 12, 14).
The disparity in STEM higher education degrees is less
apparent. Forty one percent of Black degree holders have an
undergraduate degree in a STEM field, compared with 45%
of Non-white Hispanic and 49% of White neighbors. An
impressive portion of Asian residents, 72%, have a STEM
degree (Exhibit 17).
Exhibit 6
Exhibit 7
Early education and exposure to technology is critical in preparing residents to enter, advance and thrive in the tech industry.

18 District of Columbia Tech Inclusion Strategy
entrepreneur is challenging without a personal computer or
broadband to work on long term coding projects, download
unconventional software, store work in the cloud, or
participate in social forums with likeminded technologists.
Many of the greatest tech entrepreneurs learned to code and
design applications as a hobby, outside structured classroom
environments. This early and flexible exposure offered a
head start for their formal training.
In the District, 98% of White households have a computer,
compared to 91% of Asian, 79% of Hispanic, and 80% of
Black households. Black homes have the greatest
concentration of available computers without broadband
access. In some cases these households continue to use dial-
up service, while others maintain a siloed machine with
limited functionality (Exhibit 1).
Households without computers often rely on public libraries
and community development organizations with labs for
homework, job hunting, and communication. There are
currently 90 such locations in the District, but they do not
provide complete coverage of the areas most in need.
Exhibit 3 overlays census tracts by income level and publicly
available computer labs with a 0.5 mile buffer. Median
household income of between $24,250 and $40,000 is shown
in yellow, and income of less than $24,250, which is the
federal poverty level threshold for a household of four, is red.
Within the red and yellow areas, a total of 4.5 square miles of
neighborhoods do not have access to a public computer
within a half mile trip.
Investment in Small Tech Businesses
Investment in small tech businesses is foundational to
building innovation infrastructure. The amount of
investment in DC’s small businesses, as shown by the total
amount invested in the Small Business Innovation Research
(SBIR) and Small Business Tech Transfer (STTR) programs, is
more than a dollar per capita behind the average of 50 states
(Exhibit 4). This is notable because DC is overrepresented by
tech businesses, but is not leveraging a basic federal
innovation tool. DC’s unlocked capital ratio, calculated by the
total tech investment divided by GDP in the last five years, is
a mere 0.7%, compared to 2.0% of other major cities in the
country (Exhibit 5).
ACCESS TO PUBLIC COMPUTERS BY INCOME
Exhibit 3
Exhibit 4
Exhibit 5
District of Columbia Tech Inclusion Strategy 15
Data Analysis & Key Findings
16 District of Columbia Tech Inclusion Strategy
Methodology Data and tools
The District leveraged publicly available data, interviews,
focus groups and a survey for this report. Quantitative
research was conducted with the help of MBA candidates
from the Howard University School of Business.
Data was primarily gathered from publicly available sources,
such as U.S. Census Bureau, Integrated Public Use Microdata
Series and the National Science Board. AP scores and
venture capital investment data were requested from
College Board and the National Venture Capital Association.
‘Tech workers’ and ‘STEM degrees’ refer to categories
defined as ‘STEM Occupations’ and ’STEM Degrees’ in a 2013
report published by the U.S. Census Bureau (“Disparities in
STEM Employment by Sex, Race, and Hispanic Origin”).
The MBA candidates also conducted best practice research,
and featured models were selected based on cost-
effectiveness and infrastructural feasibility.
A total of 25 interviews with industry experts and specialists
took place. Focus groups on education, entrepreneurship
and training/employment collected thoughts from 30
industry experts and participants interested in increasing
tech inclusion. Interview attendees were asked to share their
experience and thoughts on the state of tech inclusion within
the District, main challenges, and recommendations.
Ghost Note Agency, a digital communications firm based in
DC, designed and conducted a survey to investigate the state
of inclusion within the tech community in the District. A total
of 37 respondents participated in the survey.
Inclusion Scorecard
Scores for metrics that measure participation levels by race,
gender, disability and same-sex marriage status are
calculated by taking the difference between the participation
rate of a demographic group and the population ratio or ratio
of all employment of the relevant group in DC. For metrics
that measure success rates by various demographic groups,
such as income and test scores, the difference is made
between the average performance of all groups and each
group’s performance.
Access to a computer and broadband adoption at home were
both calculated using the average of each racial group’s
accessibility and adoption rate. For the amount of
investment in the tech industry and of SBIR & STTR awards,
DC’s figures were compared to the average of 50 states.
25 INTERVIEWS
37 SURVEY RESPONDENTS
32 DATASETS
30 FOCUS GROUP
Effective, impactful strategies require a firm understanding
of the current state of affairs to inform and support
recommendations. With this in mind, the District dedicated
much time to assessing the existing state of tech inclusion
through quantitative measures and perceived barriers to
entry and success. Data from four distinct and related focus
areas illustrate the level of participation and success diverse
residents achieve in DC’s tech community and economy. As
building blocks of a thriving and inclusive tech hub,
innovation infrastructure, education, employment and
entrepreneurship interrelate and frame DC’s tech ecosystem.
Full inclusion in any of the four areas that form the pyramid
is imperative in ensuring equal opportunity. Innovation
infrastructure, such as broadband and devices, are the
foundation that education, employment and
entrepreneurship rely upon. With the fundamental base in
place, education helps people take a step towards tech
employment or entrepreneurship. Employment in the tech
industry is founded upon the training and skills that build on
one’s education and foundation. With the resources,
networks, education and skills from the other three steps,
one is more likely to become a thriving entrepreneur.
Foundational To
Innovation Infrastructure
Education
Employment
Entrepreneurship
Tech Inclusion Analysis
District of Columbia Tech Inclusion Strategy 17
Interview and
Focus Group Findings The importance of accessible and affordable computers and
broadband for exposure and early learning was raised in
every focus group conducted for this strategy, and by most
interview participants, as critical to the success of tech
inclusion efforts. Regardless of the primary discussion topic,
education, employment, or entrepreneurship, consistent
access and use of these foundational tools were cited as
required ingredients to increase inclusion.
Insights A Pew Research Center survey reported that 73% of teachers
nationwide ask students to access assignments online and
76% require them to submit assignments in this manner.
Without broadband at home, students’ out of school time
must balance the hours of publicly available computer labs
and businesses with Wi-Fi with other obligations, such as
part time work, extracurricular activities, and family
responsibilities.
Jobseekers are also challenged by a lack of broadband. A
Pew Research Center study revealed that 79% of people
searching for a new position used internet resources for their
job search. Experience with tech tools is particularly pivotal
for those interested in a position within the tech economy.
Increasingly, digital firms seek applicants who have
specialized training and experience. Residents without
exposure to and experience with computers, as well as
internet navigation and search tools are at a disadvantage to
apply for these positions.
Broadband Adoption Rates and Access to Devices
As of 2015, the District has a broadband adoption rate of
74%, up from 57.9% in 2008, but there is a significant level of
disparity among races. Only 59% of Black residents have a
computer with broadband at home, compared to 71% of
Hispanic, 83% of Asian, and 96% of White residents (Exhibit
1). The gap in broadband adoption is also apparent along
socioeconomic fault lines. Residents earning over $75,000
have a 92% adoption rate compared to 61% earning less than
$35,000 (Exhibit 2).
Access to a computer in the home is equally important to
engagement in the tech economy. Becoming a tech
Innovation Infrastructure
Exhibit 1
Exhibit 2
Improving foundational tools, such as broadband adoption rate and access to devices, as well as increasing total
capital invested in tech will enable residents to become more active participants in tech entrepreneurship.