What do Migrant Workers Pay for Foreign Jobs? … Data on International Migration Towards Agenda...
22
Improving Data on International Migration Towards Agenda 2030 and the Global Compact on Migration Berlin, 2-3 December 2016 What do Migrant Workers Pay for Foreign Jobs? KNOMAD Data and SDG Indicator 10.7.1 Philip Martin, Prof. Emeritus, University of California, Davis ([email protected]) 5 November 2016 Conference Background Paper Abstract Most foreign workers who fill low-skilled jobs abroad pay something to get contracts and complete exit formalities before they work abroad. Surveys of workers in 2015 and 2016 who were employed abroad or returning from jobs overseas found that migrants paid from one to seven months of foreign earnings in pre-departure recruitment, travel, and documentation costs. Measuring worker-paid migration costs is likely to be most efficient in receiving countries and could be accomplished via modules attached to labor force surveys, supplemented by other surveys of migrant workers not included in labor force surveys such as domestic workers. Disclaimer: the views expressed in this conference background paper are those of the author and do not necessarily reflect the policies or views of the conference organizers, the International Organization for Migration (IOM) or the United Nations.
Transcript of What do Migrant Workers Pay for Foreign Jobs? … Data on International Migration Towards Agenda...

Improving Data on International Migration
Towards Agenda 2030 and the Global Compact on Migration
Berlin, 2-3 December 2016
What do Migrant Workers Pay for Foreign Jobs?
KNOMAD Data and SDG Indicator 10.7.1 Philip Martin, Prof. Emeritus, University of California, Davis ([email protected])
5 November 2016
Conference Background Paper
Abstract
Most foreign workers who fill low-skilled jobs abroad pay something to get contracts and complete exit formalities before they work abroad. Surveys of workers in 2015 and 2016 who were employed abroad or returning from jobs overseas found that migrants paid from one to seven months of foreign earnings in pre-departure recruitment, travel, and documentation costs. Measuring worker-paid migration costs is likely to be most efficient in receiving countries and could be accomplished via modules attached to labor force surveys, supplemented by other surveys of migrant workers not included in labor force surveys such as domestic workers.
Disclaimer: the views expressed in this conference background paper are those of the author and do not necessarily reflect the policies or views of the conference organizers, the International Organization for Migration
(IOM) or the United Nations.

1
TABLE OF CONTENTS
INTRODUCTION ............................................................................................................. 2
MIGRATION COSTS IN DESTINATIONS ................................................................... 3 Table 1. Worker-paid costs in Korea, Kuwait, and Spain, 2014 .................................................................................. 3
Figure 1. Per Capita Income and Median Earnings Ratios (PPP), 2013-14 ............................................................... 5
MIGRATION COSTS OF RETURNING WORKERS .................................................... 7 ETHIOPIANS FROM SAUDI ARABIA ................................................................................................................................ 7
Table 2. Migration Costs of Ethiopians Returning from Saudi Arabia, 2014$ .......................................................... 8
Table 3. Earnings and Remittances: Ethiopians Returning from Saudi Arabia, 2014$ .......................................... 8
FILIPINOS FROM QATAR ................................................................................................................................................. 9
Table 4. Migration Costs of Filipinos Returning from Qatar, 2014$ ........................................................................ 10
Table 5. Earnings, Remittances, and Hours: Filipinos Returning from Qatar, 2014$ .......................................... 10
INDIANS FROM QATAR ................................................................................................................................................ 11
Table 6. Migration Costs of Indians Returning from Qatar, 2014$ .......................................................................... 11
Table 7. Earnings, Remittances, and Hours: Indians Returning from Qatar, 2014$ ........................................... 11
NEPALESE FROM QATAR .............................................................................................................................................. 12
Table 8. Migration Costs of Nepalese Returning from Qatar, 2014$ ...................................................................... 12
Table 9. Earnings, Remittances, and Hours: Nepalese Returning from Qatar, 2014$ ....................................... 13
PAKISTANIS FROM THE UAE ........................................................................................................................................ 14
Table 10. Migration Costs: Pakistanis Returning from UAE, 2014$ ...................................................................... 144
Table 11. Earnings, Remittances, and Hours: Pakistanis Returning from UAE, 2014$ ...................................... 15
MEASURING WORKER-PAID MIGRATION COSTS ................................................ 15 DEFINITIONS .................................................................................................................................................................. 16
INTERVIEWING WORKERS ........................................................................................................................................... 17
COSTS, LOANS, AND EARNINGS ............................................................................................................................. 188
NEXT STEPS ................................................................................................................................................................... 19
CONCLUSIONS ............................................................................................................ 200
BIBLIOGRAPHY .............................................................................................................. 21

2
Introduction
Some 150 million workers were employed outside their country of birth in 2013 (ILO, 2015a). Some have settled in the countries where they live and work, but many are migrant workers expected to leave after several months or years of employment in countries of destination (CODs). ILO conventions and laws in many countries of origin (COO) and destination require employers to pay all of the costs associated with recruiting foreign workers. Employers usually pay recruitment costs for highly skilled workers, since the demand for mobile professionals such as accountants and nurses typically exceeds the supply. But the supply of workers earning less than $500 a month outside their countries of citizenship often exceeds the number of jobs, allowing employers, recruiters, and others to charge workers some of the wage wedge, or gap between wages in poorer and richer countries, that motivates workers to seek foreign jobs. High worker-paid costs are regressive in the sense that lower-wage workers pay more for foreign jobs than higher-wage workers. Furthermore, many workers do not know upfront how much they will have to pay for foreign jobs. This combination of high costs, regressivity, and non-transparency prompted the UN Secretary General to emphasize the “enormous gains to be made by lowering costs related to migration… especially by low-skilled migrants.” (UN Secretary General, 2013, para 113) The Global Knowledge Partnership on Migration and Development (KNOMAD) and the ILO surveyed migrant workers using a six-part questionnaire in 2014-15 to determine what they paid for foreign jobs. Workers were interviewed where they worked in Korea, Kuwait, and Spain, and as they returned to Ethiopia, India, Nepal, Pakistan, and the Philippines from jobs in Qatar, Saudi Arabia and the UAE. This paper summarizes what workers reported paying for foreign jobs. Part 1 of the questionnaire collected demographic and education data on the migrant, including how many family members he or she supports at home. Part 2 asked about the recruitment process. How did the migrant learn about the job, who was paid to get the contract, and what did migrants pay for items ranging from passports and visas to medical and police checks. Some migrants paid a lump sum to recruiters and did not know the cost of the individual items involved in going abroad. Part 3 asked about the cost of borrowing money to pay migration costs. From whom was money borrowed, at what interest rate, and with what collateral? Part 4 asked about job search costs. How long did it take the worker to find the foreign job and what were the opportunity costs in time not worked because of preparing to go abroad? The questions in Part 5 shifted to work abroad. What do or did migrants earn abroad, what work-related benefits do or did they receive, and do or did the migrant get paid the wage that was promised before departure? Part 6 turns to work-related issues, including the cost of housing and food while abroad, hours of work and work-related injuries, and the availability of work-related rights ranging from being able to form or join a union to changing employers.
3
Migration Costs in Destinations
The first surveys asked legal and low-skilled migrant workers employed in Korea, Kuwait, and Spain in 2014 about their costs of migration. Worker-paid migration costs averaged $1,525 in Korea, or one to 1.5 months of typical earnings. Most migrant workers had 36-month contracts, so they could expect to earn $36,000 at $1,000 a month or $54,000 at $1,500 a month, depending on how much overtime they worked.1 Migrant worker contracts can be extended for an additional 22 months at the request of migrants and their Korean employers, so average migration costs of $1,525 could be less than three per cent of expected earnings in Korea if migrants stay in Korea for the maximum of almost five years. Worker-paid migration costs to get jobs in Kuwait averaged $1,900, and average monthly earnings were $465, so migration costs were equivalent to four months Kuwaiti earnings. With two-year contracts, migrant workers earn $11,160 and worker-paid migration costs are a sixth of earnings. For Egyptians, many of whom were employed at home at an average wage of $165 a month, earning over $600 a month in Kuwait was four times more than they would have earned at home. Worker-paid costs to fill seasonal farm jobs in Spain averaged $530 or half a month’s average Spanish earnings of $1,000. Most seasonal farm workers were employed in Spain from four to nine months, making worker-paid migration costs six to 12 per cent of Spanish earnings. Migration costs were relatively low despite only seasonal earnings because all of the workers interviewed had previous Spanish work experience and Spanish regulations require employers to pay half of the transportation costs of the migrant workers they employ. When workers arrived in Spain from afar, such as from Ecuador, employers usually paid the full cost of inbound transportation and deducted transport costs from worker earnings at the rate of E90 ($100) a month.
Table 1. Worker-paid costs in Korea, Kuwait, and Spain, 2014
Destination Average worker-paid costs
Worker earnings Costs: share of earnings
Korea $1,525 $36,000 at $1,000 a month or $54,000 at $1,500 a month for 36 months
1 to 1.5 months of Korean earnings; could be less than 3% of Korean earnings if migrants stay max period
Kuwait $1,900 $465/momth 4 months of Kuwaiti earnings of $11,160 over 24 months Bangladeshis & Egyptians paid more than Indians & Sri Lankans
1 A 2014 ILO survey found that most E-9 or EPS workers were men with nine years of schooling and under the age of 30. Most EPS migrants earned between one million ($965) and 1.7 million ($1,600) won a month. The Korean minimum wage was 5,210 won ($5) an hour in 2014, but most migrants earned more because they worked overtime. Migrants seeking jobs under the EPS must pass a test of the Korean language and undergo health and other checks before being placed on lists from which Korean employers select migrant workers.

4
Spain $530 $1,000/month Workers employed in seasonal ag jobs for 4-9 months; all had worked in Spain previously
Source: text
Korea
Worker-paid costs as a share of earnings were lowest for migrants in Korea. Almost 90 per cent of the migrant workers interviewed were in Korea less than three months. Almost 80 per cent were employed in manufacturing, 86 per cent were men, and 61 per cent were in Korea for the first time. Many of the migrants had been employed in other countries and welcomed the opportunity to work in Korea, where wages are much higher than other Asian destinations such as Malaysia or Gulf oil exporters. Over 95 per cent of the migrants in Korea were in their 20s and 30s, 55 per cent were married, and 85 per cent completed secondary school or more. Migrants supported an average three dependents at home. Average earnings at home were $225 a month, versus $765 in Korea, for a wage gap of 3.4, although many migrants expected to earn more in Korea as they gained experience and worked overtime. Average worker-paid costs were $1,525, but median costs were $1,300; average costs were increased by the relatively few workers who had very high costs. The average cost of the seven migration-related expenses reported by 60 per cent or more of the workers in Korea was $830, including $365 for international transportation and $250 to learn Korean. The four other major expenses, for passports, medical exams, security checks, welfare funds, and visas, cost $15 to $70 each. The migrants interviewed in Korea were from Thailand, Indonesia, and Vietnam. Thais reported migration costs of $1,525, including two-thirds who reported paying recruitment fees that averaged $980. Half of the Thais borrowed money to work in Korea, and these borrowers had repaid 90 per cent of what they borrowed when interviewed but still owed significantly more, suggesting high interest rates. Median earnings in Korea were 3.3 times median earnings in Thailand, suggesting a smaller wage gain for Thais than for Indonesians and Vietnamese. Over 60 per cent of the Thais completed secondary school, and an eighth of the Thais had some post-secondary education, so that Thais in Korea had much higher levels of education than all Thais. Indonesians had average total migration costs similar to Thais, about $1,500. Over half reported internal transport costs that averaged $420, more than the average $308 for international travel to Korea. Indonesians earned an average $174 a month at home, a seventh of their median earnings of $1,050 a month in Korea. Over 80 per cent of the Indonesian migrants completed secondary school. Vietnamese workers reported the lowest migration costs of $1,200. The median and mode costs were $630, so the average cost of $1,200 indicates very high costs for some workers. Most costs were similar to those of Thais and Indonesians, although the Vietnamese reported paying more to learn Korean and more for international travel. The Vietnamese workers earned a median $190 at home and $1,120 or six times more in Korea. Over 70 per cent of the Vietnamese migrants completed secondary school, and 20 per cent had post-secondary education. The income gap between home and Korean wages is largest for Vietnamese workers, slightly more than six to one, and the ratio of median Korean to home earnings was also about six to one for the Vietnamese. Indonesian workers had an almost six to one median earnings gain, reflecting that fact that many were

5
not from urban areas of Indonesia where incomes and earnings are higher. Thais also gained more than the ratio of national incomes. The final columns show that Vietnamese could repay their migration costs with fewer months of Korean work than Indonesians and Thais, less than half a month versus over a month.
Figure 1. Per Capita Income and Median Earnings Ratios (PPP), 2013-14
The Korean Employment Permit System (www.eps.go.kr/ph/index.html), introduced in 2003 and since 2007 the only way for most Korean small- and medium-sized enterprises to hire non-ethnic Koreans from outside the country, functions reasonably well for most migrants, allowing them to repay their migration costs with less than two months of Korean earnings. Most of the high costs were incurred by relatively few workers, and these high costs were usually recruitment fees, other payments, and job searches. In the case of southeast Asians going to Korea, reducing very high costs for the relatively few workers who incur them would reduce overall worker-paid migration costs. The competition to get jobs in Korea is often intense. In 2015, over 60,000 Nepalis sought 3,000 Korean jobs, making the odds of a Nepali getting a job in Korea about the same as an applicant getting into Harvard.2
2 Harvard selected about 2,000 of the 40,000 applicants in 2015, five per cent.

6
Kuwait
Foreigners are 70 per cent of the 3.8 million residents of Kuwait, and foreign migrants are over 90 per cent of the 1.3 million workers employed in Kuwait’s private sector. The leading countries of origin of the foreigners in Kuwait are Egypt, Sri Lanka, India, the Philippines, and Bangladesh. Over 100 migrant workers were interviewed in Kuwait in 2014, including 20 Bangladeshis, 30 Egyptians, 30 Indians, and 20 Sri Lankans. Most were men except for the Sri Lankans, three-fourths of whom were women. Their median age was 35, and most arrived in Kuwait within the previous five years. Most had little education, including half who did not complete secondary school; three-fourths were married. By country, 70 per cent of Bangladeshis did not complete secondary school, compared with 50 per cent of Indians and Sri Lankans who did not complete secondary school. Egyptians were the best educated, with 60 per cent completing secondary school and a sixth having university degrees. There was a wide range in costs reported by workers with similar earnings in Kuwait. Bangladeshis paid an average of over $3,100, followed by Egyptians who paid $2,900, Indians who paid $1,250, and Sri Lankans whose average migration costs were $320. Most of the Sri Lankans were female domestic workers who paid less and earned less in Kuwait. Many of the migrants paid a lump sum to recruiters and did not know the cost of individual items needed to work in Kuwait. For those who reported costs, Bangladeshis paid an average $2,300 for visas and $500 for airfare, while Egyptians paid an average $2,500 for visas and $200 for airfare. Some of the cost differences are puzzling. For example, Egyptians reported paying an average $335 for medical tests while Bangladeshis paid $45. Average monthly earnings in Kuwait were $465, suggesting that migrant workers who paid an average $1,900 in migration costs worked for four months in Kuwait to repay these costs. Average Kuwait wages varied by nationality, with Egyptians reporting $610 a month, Indians $500, Bangladeshis $350, and Sri Lankans $340. Egyptians earned four times more in Kuwait than at home and Indians earned 2.5 times more. Few of the Bangladeshis or Sri Lankans had wage-earning jobs at home. Spain
Some 171 migrant workers employed in Spanish agriculture were interviewed in January-February 2014, including 42 from Bulgaria, 33 from Ecuador, 44 from Morocco, 19 from Poland, and 30 from Romania. Most had low migration costs, primarily because many had zero costs for items that are common in other migration corridors, from visas to medical exams. All of the migrant workers had previous Spanish work experience, and they reported that regulations requiring employers to pay at least half of worker transportation costs were enforced. Worker-paid migration costs were generally less than half of a migrant’s monthly earnings of $1,000 a month.3 Focusing on worker-paid costs incurred by at least 40 migrants finds that transportation costs were two-thirds of average migration costs of $530, with a wide variance reflecting the cost of getting to Spain. Three fourths of the migrants interviewed in Spain did not take out loans to cover migration costs. The quarter that took out loans reported relatively small loans averaging $350, but debts of over $500, suggesting high interest rates.
3 Earnings data were not collected from workers, but most earned the minimum wage of E39.5 or $54 for a 6.5 hour day, so they earned $270 for a 5-day week or $324 for a six-day week and $1,080 to $1,300 a month.

7
Most of the migrants filling seasonal jobs in Spanish agriculture are from rural areas of Morocco, Eastern Europe, and Ecuador. Migrating to Spain to do farm work is an alternative to rural-urban migration within their countries of origin. Most of the migrants had less than secondary-school educations.4 For example, the Moroccan women often had less than nine years schooling, suggesting that migrating to Spain to do farm work was one way to remain within agriculture while working in a higher-wage country. Many of the Moroccans wanted to settle in Spain, while most of the Eastern Europeans wanted to return to their countries of origin. Migrants harvesting fruits and vegetables in Spain were mostly unemployed or self-employed in agriculture at home, making it hard to calculate the average gain from working in Spain. Less than a seventh of all migrants had wage-paying jobs before migrating to Spain. Of those who reported any income before migrating to Spain, from wage work or self-employment, earnings at home were $160 a month, suggesting that work in Spain increased earnings by six times. Migration Costs of Returning Workers
Ethiopians from Saudi Arabia
Some 497 Ethiopians returning from Saudi Arabia were interviewed in spring 2015. Two thirds were women, and the median age of all workers was 27, although workers ranged from 17 to 52. Almost half of the returning workers were married, and almost half were single. Returning Ethiopians had relatively little education. Over 70 per cent did not complete secondary school, including 30 per cent who did not complete primary school. About 30 per cent completed secondary school, including five per cent who had some post-secondary schooling. Almost 90 per cent of returning Ethiopians were working outside Ethiopia for the first time. The returned workers had spent a median 24 months in Saudi Arabia, but there was a wide range from one to 56 months. Almost 60 per cent of returning Ethiopians found jobs in Saudi Arabia with the help of recruiters or manpower agencies and 40 per cent via friends or relatives; five found Saudi jobs with the help of government employment services. However, almost 90 per cent of returning Ethiopians used recruiters or manpower agencies to get the jobs from which they were returning; another seven per cent used government employment services to get their contracts. It took a median two months from the initial job application until departure from Ethiopia. Returning Ethiopian workers reported paying an average $1,000 and a median $825 in total migration costs, with a range of $55 to $6,135 (all in 2014 dollars). The major worker-paid cost was for recruitment agents. Almost 90 per cent of Ethiopians reported payments to agents, a median $440 and a range from $25 to $3,780. Agent costs were over half of total costs.
4 The Eastern Europeans were best educated, but most did not complete secondary school. Many of the Moroccans had less than five years schooling, and the Ecuadorians averaged less than seven years schooling.

8
Table 2. Migration Costs of Ethiopians Returning from Saudi Arabia, 2014$ Total Cost Share Mean Median Number Agent 244,318 49% 553 441 442 Inland trans 51,494 10% 128 110 403 Int’l trans 57,138 12% 281 233 203 Medical test 12,154 2% 37 31 328 Passport 6,559 1% 19 17 341 Clearance 314 0% 1 1 284 Other 83,356 17% 604 354 138 Total 496,144 100% 998 826 497 Source: Survey of Ethiopians returning from Saudi Arabia, 2015
About 80 per cent of returning Ethiopian workers incurred internal transport costs that were a median $110, but only 40 per cent reported costs for international travel, a median $235. Some 40 per cent reported that agents paid for international travel, and 13 per cent reported that employers paid for international travel. Medical check costs were reported by two-thirds of workers, a median $30, and passport costs were a median $17. Almost 30 per cent of returning Ethiopian workers reported significant “other costs.” When asked what these other payments were for, workers said they were payments to brokers in Yemen who helped migrants to get into Saudi Arabia. At least 20 workers reported payments to police outside Ethiopia. A third of returning Ethiopians reported earnings in Ethiopia before departure for Saudi Arabia, a median $40 a month, but with a wide range from $4 to $375. Total earnings in Ethiopia of those with earnings were $9,900 a month. Over half of the Ethiopians who reported earnings before departure had elementary occupations such as daily laborer, domestic worker, or farmer; another 10 per cent reported sales or service jobs.
Table 3. Earnings and Remittances: Ethiopians Returning from Saudi Arabia, 2014$ Total Ratio/share Mean Median Number Earnings at home 9,891 63 39 157 Earnings abroad 169,082 17 343 264 493 Remittances 64,820 38% 148 122 439 Hours/week(1) 40,836 83 90 493 Source: Survey of Ethiopians returning from Saudi Arabia, 2015; Adjusted hours per week
Ethiopians earned a median $265 a month in Saudi Arabia, well below the mean of $345 a month, reflecting the fact that 80 workers earned over $500 a month in Saudi Arabia. Mode earnings were $185 a month, which is what the 40 per cent of the Ethiopians who were domestic workers were paid, including those who said they provided child care and were servants. Over 120, or 25 per cent, reported that they were cleaners in Saudi Arabia, 100 or 20 per cent worked in construction or as laborers; 15 were shepherds. Most Ethiopians in Saudi Arabia received housing and food from their employers at no cost. Total Saudi earnings were $169,100 a month, 17 times more than the $9,900 a month earned by those with jobs before departure; only a third of the Ethiopians had earnings at home. For many Ethiopians, going abroad resulted in a wage-paying job. For the third of Ethiopians with wage-earning jobs at home,

9
median monthly earnings were $40 at home and $265 in Saudi Arabia, 6.6 times higher. Median migration costs of $825 were equivalent to 3.1 months of Saudi earnings and 13 per cent of earnings over the median 24 months that Ethiopians were in Saudi Arabia. Almost 90 per cent of Ethiopians sent money home, a median $125 a month or three-fourths of median Saudi earnings. However, since not all Ethiopians remitted, total remittances of $65,000 a month were less than 40 per cent of monthly Saudi earnings. One explanation is that Ethiopians were interviewed after they returned, and their monthly remittances just before returning may have been less because they brought money home with them. Workers were asked if they held a skill certificate issued by a vocational testing center, and 20 or about four per cent said they held certificates certifying them as auto mechanics, cooks, or electricians. Most did not use this skill in their Saudi job. When asked if they believe that they could have found a job in Saudi Arabia that used their skills, a third said yes. Another 150 workers, who did not answer the question about finding a job that used their skills, estimated that if their Saudi jobs used their qualification, they would have earned a median $530 a month, double their actual median earnings of $265 a month. About 40 per cent of Ethiopians returning from Saudi Arabia worked for employers who arranged their visas and provided contracts that were signed in Ethiopia before departure, but only two-thirds of those who signed contracts before departure worked under these contracts abroad. Over half of the returning Ethiopians reported being deprived of rights while in Saudi Arabia, with the lack of free speech, lack of job security, and no social security the most commonly cited deprivations. Others were unable to change employers while in Saudi Arabia and unable to practice own religion; 10 per cent said their travel documents were withheld by their employer. Hours of work were a mean 82 and a median 90 a week, with many workers citing 108 hour work weeks, that is, 18 hour workdays six days a week. About half of the workers did not receive a rest day each week. About 20 per cent reported workplace injuries, and half of those who were injured were paid when they could not work. About 60 per cent of the Ethiopians entered Saudi Arabia without a work visa, and many of those who reported their last status said it was other, which usually meant that they were illegally in Saudi Arabia. Filipinos from Qatar Some 340 Filipino migrants returning from Qatar were interviewed in the Philippines in spring 2015. About 55 per cent were men, their average age was 39, and two-thirds were married. The Filipinos were older and better educated than migrants returning to other countries in this study. Almost 40 per cent of workers completed secondary school, a sixth had some postsecondary education, and a quarter were college graduates. Over 60 per cent of Filipinos reported finding their Qatari jobs via friends and relatives, followed by 30 per cent who learned of the job via a manpower agency. Returning Filipinos were in Qatar a median 24 months. Total migration costs were $177,600, with an average $520 and a range from $4 to $3,300. Almost half of these total costs were for manpower agencies, although only half of the Filipinos reported paying manpower agencies for Qatari jobs.
10
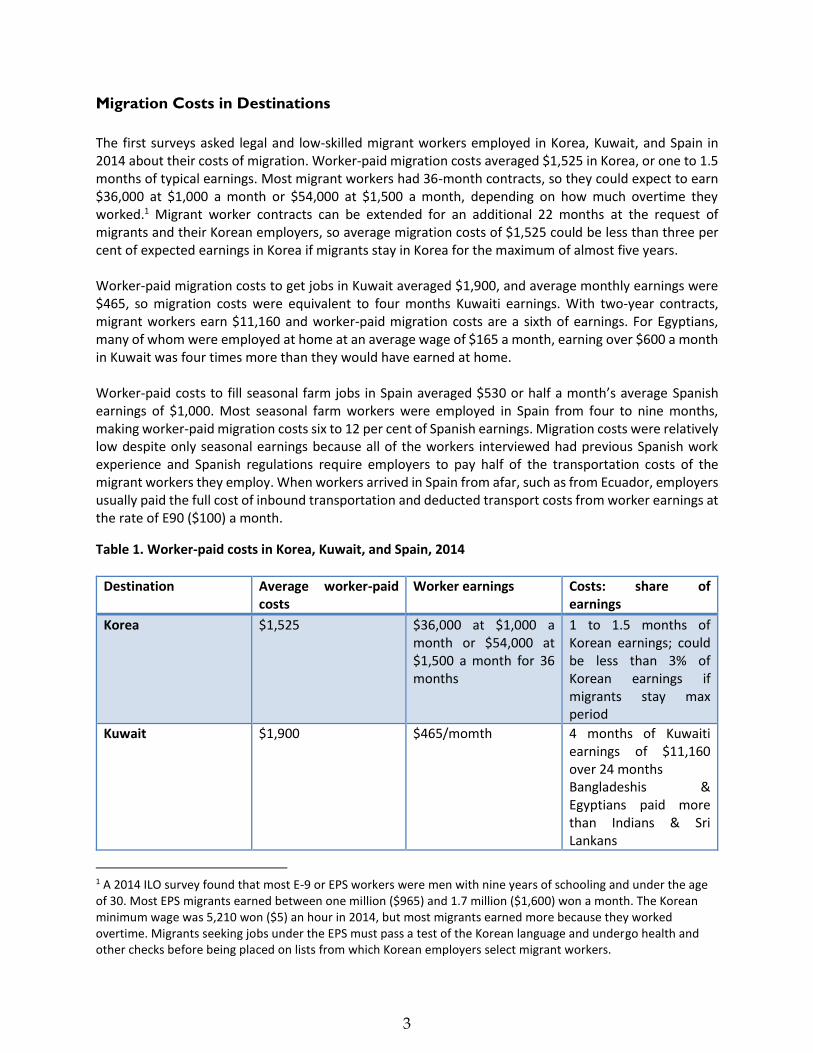
Table 4. Migration Costs of Filipinos Returning from Qatar, 2014$ Total Cost Share Mean Median Number Agent 83,663 47% 492 443 170 Inland trans 27,794 16% 106 69 263 Medical test 14,148 8% 67 66 211 Passport 6,797 4% 29 24 232 Briefing 402 0% 4 2 111 Clearance 1,465 1% 5 4 271 Insurance 36,889 21% 40 34 93 Total 177,601 100% 522 414 340 Source: Survey of Filipinos returning from Qatar, 2015
The main components of worker-paid migration costs included agent costs, which were an average $490, inland travel, an average $105, medical exams, an average $67, and passports, an average $29. Workers reported that international travel, an average $915, was almost always paid by employers and agents. Two thirds of the Filipinos reported being employed before departure, with domestic and farm work, service and sales work, and craft and related trades the most common occupations at home. Total earnings before departure workers were $55,285, an average $230 a month.
Table 5. Earnings, Remittances, and Hours: Filipinos Returning from Qatar, 2014$ Total Ratio/share Mean Median Number Earnings at home 55,286 229 195 241 Earnings abroad 177,364 3.2 500 435 355 Remittances 115,594 65% 337 272 343 Hours/week(1) 22,197 62 56 357 Source: Survey of Filipinos returning from Qatar, 2015; Adjusted hours per week
Qatari earnings were a total $177,365 a month or an average $500. Over 98 per cent of workers reported being paid regularly in Qatar as they worked in construction or in private households. Filipinos reported remitting $115,600 a month, two-thirds of their Qatari earnings, an average $335 a month. Almost all Filipinos reported that housing and food was provided by their employers at no charge. A sixth or 58 workers reported being deprived of rights in Qatar, with 17 citing the lack of free speech rights, 15 unequal treatment compared to natives, and 15 having their travel documents withheld. Workweeks averaged 62 hours, with a median 56 hours and a standard deviation of 20; almost all workers reported receiving a rest day each week. Almost a quarter of Filipino workers reported a workplace injury, often fevers, cuts, and fatigue; three fourths said they were paid for time not worked. Almost 92 per cent entered Qatar with work visas, and only one was illegal before departure. There were three major differences between Ethiopians returning from Saudi Arabia and Filipinos returning from Qatar. First, the Filipinos were older, better educated, and had lower migration costs than the Ethiopians, paying about half as much and almost always having employers pay for their international travel. Second, Filipinos had higher earnings abroad, a median $435 a month versus $265 for Ethiopians. Two-thirds of Filipinos, versus one-third of Ethiopians, were employed before departure. Third, Filipinos

11
worked fewer hours a week than Ethiopians, a median 56 versus 90, in part because a higher share of Ethiopians were domestic workers. Indians from Qatar The 400 Indian migrants returning from Qatar in spring 2015 had a median age of 31. Almost 60 per cent completed 10 years of schooling, 30 per cent completed primary (six years) but not secondary school, and 12 per cent had post-secondary schooling, such as technical training. Returning migrants reported total expenses for jobs in Qatar of $456,000 in 2014 dollars, an average of $1,140 and a range of $350 to $1,690. The main components of migration costs were agent costs, an average $550, international travel, an average $295, and other costs, an average $97. Most migrants reported similar costs, explaining why the mean and median costs were similar for most items.
Table 6. Migration Costs of Indians Returning from Qatar, 2014$ Total Cost Share Mean Median Number Agent 219,420 48% 551 559 398 Int'l trans(1) 118,399 26% 296 297 399 Other 35,452 8% 97 93 364 Inland trans 28,105 6% 70 71 400 Medical test 20,757 5% 52 52 399 Passport 17,649 4% 46 45 387 Briefing 8,918 2% 24 25 365 Skills test 2,920 1% 11 11 264 Insurance 2,606 1% 7 6 397 Total 455,873 100% 1,140 1,156 400 Source: Survey of Indians returning from Qatar, 2015 1. 17 workers had their international transportation costs reimbursed
Before departing for jobs in Qatar, almost all of the Indians were employed in India, usually as craft or trade workers or plant and machinery operators and assemblers. They earned an average and median of $145 a month and had total earnings before departure of $59,000 a month. Almost all of the returning Indians were employed in construction in Qatar, the same sector that employed most of them in India. Qatari employers arranged for work visas, almost all workers signed contracts before departure, and this was the same contract under which they were employed in Qatar. The most common occupations in Qatar were carpenter, driver, electrician, fitter, mason, and plumber, and none of the Indians changed jobs while in Qatar.
Table 7. Earnings, Remittances, and Hours: Indians Returning from Qatar, 2014$ Total Ratio/share Mean Median Number
Earnings at home 58,634 147 146 398
Earnings abroad 236,376 4.0 591 599 400
Remittances 163,930 69% 411 408 300
Hours/week(1) 23,683 59 60 400 Source: Survey of Indians returning from Qatar, 2015; Adjusted hours per week

12
Qatari earnings were an average $590 a month with relatively little variation because Qatari contractors paid the reference wage for each occupation set by the Indian embassy. Workers earned a total of $236,000 a month in Qatar, which was four times more than the $59,000 they earned in India before departure. Migrants reported remitting (saving) $164,000 or almost 70 per cent of their Qatari earnings, an average and median $410 a month. The high savings rate is explained by the fact that food and lodging was paid by employers in Qatar; all workers were provided with housing at no cost, and most were provided with food at no cost. Thirteen workers reported a union in their workplace, including eight that joined the union, and 17 reported being deprived of rights while in Qatar. Hours per week were a mean and median 60, and all reported one rest day a week. Some 24 workers reported injuries at work, the most common injury reported was fever, and 22 workers reported being paid while they could not work. All of the Indians entered Qatar with work visas, and thus were legal in Qatar before they returned. Nepalese from Qatar The 350 Nepalese migrants returning from Qatar had a median age of 30. Most had little education: 78, or 22 per cent, reported no schooling, 123, or 35 per cent, reported incomplete primary schooling, 58, or 16 per cent, reported complete primary schooling, 65, or 18 per cent, reported some secondary schooling, and 26, or seven per cent, reported complete secondary schooling, that is, two-thirds had primary schooling or less. The Nepali migrants who reported total expenses for jobs in Qatar paid $369,000 in 2014 dollars, an average $1,055 and a range of $70 to $2,835. The main components were agent costs, an average $875, inland travel, an average $110, and passports, an average $75. For the 31 workers who reported international travel expenses, the average cost was $400.5
Table 8. Migration Costs of Nepalese Returning from Qatar, 2014$ Total Cost Share Mean Median Number Agent 278,869 76% 874 877 319 Int'l trans 12,447 3% 402 302 31 Inland trans 31,610 9% 108 66 293 Medical test 10,190 3% 34 29 299 Passport 25,905 7% 75 60 344 Briefing 1,115 0% 9 8 135 Visa 11,160 3% 319 170 35 Insurance 5,442 1% 37 35 149 Total 368,910 100% 1,054 1,088 350 Source: Survey of Nepalese returning from Qatar, 2015
5 Nepal’s government announced in July 2015 that it would no longer approve the contracts of departing workers unless employers paid for Nepalese workers' air travel and visas. Nepal allows recruiters to charge migrants 70,000 to 80,000 rupees ($690 to $790).

13
The noteworthy feature of Nepalese migration costs is high costs overall, a median of almost $1,100, and the fact that agents accounted for three-fourths of these costs. Nepalese reported fewer itemized costs than did migrants in other corridors, suggesting that they paid agents a flat fee to cover almost all of their migration costs. Before departure, almost 40 per cent of workers had earnings in Nepal; farmer and laborer were the most common pre-departure occupations. Average monthly earnings for the 139 Nepalese with pre-departure earnings were $110 a month. The total earnings of Nepalese with jobs before departure were $15,100 a month. Almost all of the returning Nepalese were employed in construction in Qatar; laborer was the most common occupation abroad. Qatari employers arranged for work visas for 95 per cent of the Nepalese, and 90 per cent reported that they signed contracts before departure and that the contract they signed in Nepal was the same contract under which they worked in Qatar.
Table 9. Earnings, Remittances, and Hours: Nepalese Returning from Qatar, 2014$ Total Ratio/share Mean Median Number
Earnings at home 15,573 112 109 139
Earnings abroad 118,957 7.6 339 326 351
Remittances 72,466 61% 207 197 350
Hours/week(1) 23,752 68 70 351 Source: Survey of Nepalese returning from Qatar, 2015; Adjusted hours per week
Total earnings in Qatar were $119,000 a month, 7.6 times the $15,600 of Nepalese with earnings in Nepal. Median monthly earnings in Nepal were $325 or 2.2 times the median $110 a month of Nepalese with earnings in Nepal. Migrants reported remitting (saving) $72,500 or 61 per cent of their Qatari earnings, an average $205 a month. The high savings rate is explained by the fact that food and lodging was paid by employers in Qatar. All Nepalese were provided with housing at no cost, and most were provided with food at no cost; 12 workers reported deductions for food. Almost 60 per cent of Nepalese reported being deprived of rights while in Qatar. The most cited deprivations were withheld travel documents, reported by half of those who answered this question, lack of free speech reported by 40 per cent, the right to join a union reported by 35 per cent, and not having the same rights as other workers and not having the right to change employers by 25 per cent. Hours per week were a mean 68 and a median 70, and all workers reported one rest day a week. Some 34 workers reported injuries at work, including fevers, heat stress, and cuts, and 18 reported being paid while they could not work. Like the Indians, almost all Nepalese were employed in construction in Qatar. However, unlike the Indians, most Nepalese were not employed before leaving Nepal or, if employed in Nepal, were not employed in construction. The Nepalese had low levels of education and were mostly helpers and laborers in Qatar, earning a median $325 a month in Qatar versus $600 a month for Indians. Like the Indians, all of the Nepalese entered Qatar with visas and were legal when they returned home.

14
Indians and Nepalese paid about the same amount to get construction jobs in Qatar, but Indians earned almost twice as much as Nepalese, helping to explain why the Indians remitted almost twice as much as the Nepalese. Nepalese reported working a median 70 hours a week, versus 60 hours a week for Indians, and a much larger share of Nepalese complained of withheld documents and other deprivations of rights while in Qatar. It should be noted that almost all of the Indians held construction jobs in India before departure, while the 40 per cent of Nepalese who had earnings before departure were generally not employed in construction. Going from Nepal to Qatar was, for many Nepalese, a way to get a wage-earning job and, with housing and food paid by employers, a means to achieve a savings target. Pakistanis from the UAE Some 259 Pakistanis returning from the UAE were a median 27, half were married, and they supported a median seven people in Pakistan. About 40 per cent of the Pakistanis had a primary school education or less, and 40 per cent had a secondary school education or more. Over 82 per cent of Pakistanis returning from the UAE were abroad for the first time, although the fifth who had been abroad had worked a median twice abroad before. Among returnees from UAE, the average stay abroad was 18 months and the median stay was 16 months. Over 60 per cent of the returnees found UAE jobs via relatives and friends and 35 per cent found foreign jobs via recruiters or manpower agencies. However, over 70 per cent of the returning workers got contracts for jobs in the UAE from recruiters and manpower agents, followed by 25 per cent who got contracts from relatives. They had a total of $618,370 in migration costs, including $450,700 or 73 per cent for visa costs, $44,475 or seven per cent for agent costs, and $66,875 or 11 per cent for international transportation; these three items were 91 per cent of total costs. Almost 93 per cent of returning Pakistanis had visa costs that averaged $1,878, 54 per cent had agent costs that averaged $323, and 70 per cent had international travel costs that averaged $367. Total costs were an average $2,390, and median costs were $2,095.6
Table 10. Migration Costs: Pakistanis Returning from UAE, 2014$ Total Cost Share Mean Median Number Visa 450,673 73% 1,878 1,606 240 Agent 44,474 7% 323 197 141 Int'l trans 66,874 11% 367 331 182 Inland trans 11,091 2% 59 49 189 Medical test 6,423 1% 55 59 117 Passport 11,166 2% 46 45 243 Contract 9,193 1% 77 80 119 Insurance 2,947 0% 33 30 90 Other 7,246 1% 41 35 175 Total 618,371 100% 2388 2095 259 Source: Survey of Pakistanis returning from UAE, 2015
6 Some 36 Pakistanis who had been abroad before reported mean and median $2,400 costs for to get previous foreign jobs.
15
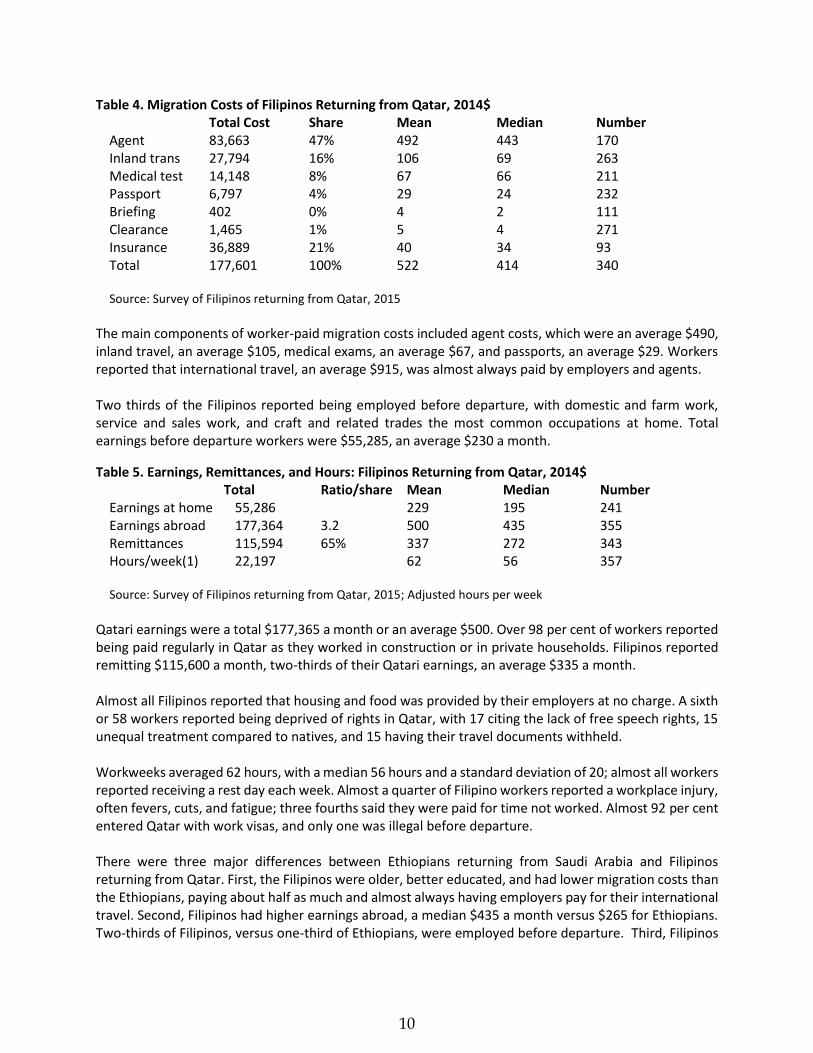
Before departure to the UAE, 79 per cent of workers had earnings in Pakistan, with 60 per cent in elementary occupations including domestic and farm work; about seven per cent held certificates from vocational schools in Pakistan. Average monthly earnings before departure were $144 a month, and median pre-departure earnings were $125 a month. The total earnings of Pakistanis returning from jobs in SA before departure were $29,015 a month. A quarter of returning Pakistanis said that their UAE employer arranged for their work visa, 44 per cent reported signing a contract before departure from Pakistan, but only two-thirds said that they worked under this contract in the UAE. The most common job in the UAE was laborer, the occupation of 44 per cent of the returning Pakistanis, followed by 20 per cent with construction crafts such as mason, welder, and electrician. UAE earnings totaled $103,465 a month, or 3.6 times earnings in Pakistan, and were an average $400 a month and a median $325 a month. Some 64 per cent of Pakistanis in UAE reported being paid regularly.
Table 11. Earnings, Remittances, and Hours: Pakistanis Returning from UAE, 2014$ Total Ratio/share Mean Median Number
Earnings at home 29,015 144 126 202
Earnings abroad 103,464 3.6 399 323 259
Remittances 50,869 49% 217 176 234
Hours/week(1) 17,747 69 72 259 Source: Survey of Pakistanis returning from UAE, 2015; Adjusted hours per week
Migrants reported remitting (saving) $50,869 or half of their UAE earnings, an average $217 a month. Almost 12 per cent of workers, 30, reported changing employers while abroad, and 70 or 27 per cent reported that their employer supplied labor to other firms. Over 99 per cent of the Pakistanis returning from the UAE reported being deprived of rights while abroad. The most cited deprivations were withheld travel documents, reported by 84 per cent of those who answered this question, not having the same rights as other workers, 81 per cent, no job security cited by 72 per cent, lack of free speech reported by 62 per cent, inability to join a union reported by 67 per cent, not having the right to change employers by 56 per cent, and not having rights to social security by 54 per cent. Except for religion and remittances, a majority of workers who responded to deprivation questions reported deprivations in UAE. Hours per week were a mean 69 and a median 72, and 85 per cent reported one rest day a week. Some 108 workers, 42 per cent, reported injuries at work, with most citing fever, heat, or temperature as the cause of their injury; 27, or a quarter, reported being paid while they could not work. All of the Pakistanis returning from the UAE were abroad with work visas, and thus were legal abroad before they returned. Measuring Worker-Paid Migration Costs
The UN in September 2015 endorsed 17 Sustainable Development Goals to be met by 2030 (Agenda 2030), including to end poverty and hunger, ensure healthy lives and education, achieve gender equality and inclusive economic growth, ensure safe water and cities, and make the global economy and biosphere

16
sustainable. There are 169 target indicators to allow citizens to measure their country's progress toward just, peaceful, and inclusive societies. Goal 10 is to reduce inequalities within and among countries. Target 10.7 calls on governments to "facilitate orderly, safe, regular and responsible migration and mobility of people, including through the implementation of planned and well-managed migration policies." Indicator 10.7.1 measures the recruitment costs borne by employees as a proportion of yearly income earned in country of destination.7 Definitions
How should the worker-paid recruitment costs be defined and measured to track progress under Indicator 10.7.1? There are four major worker-paid costs to consider:
1. General and specific training (including language) costs to prepare for jobs overseas 2. The financial costs of obtaining contracts for jobs abroad, completing exit procedures, and
traveling to the foreign job (should the cost of previous failed efforts to go abroad be included with the costs of successfully getting a foreign job?)
3. The opportunity costs of wages not earned while training and preparing to go abroad 4. The social costs associated with separation from family and friends, and restrictions on rights
while employed abroad
Most surveys of workers focus on the second type of costs, the financial costs of workers who obtained foreign jobs; some include costs of previous failed efforts to obtain foreign jobs. Measuring worker-paid financial costs raises several issues. First, since highly trained workers generally pay less or no costs to obtain contracts for jobs abroad, should the cost of training undertaken by doctors and nurses that leads to foreign employers paying their recruitment costs be included? Should the opportunity costs that arise in the form of wages not earned while studying be included? Most surveys ignore the cost of basic K-12 education and advanced schooling that could lead to a job at home or abroad, both out of pocket costs and opportunity costs. Some types of training are aimed specifically at work abroad, such as seafarer or cruise ship worker training: should the costs of training-that-will-pay-off-only-abroad be included? Second, financial costs for the current foreign job include costs to learn about the job, obtain a contract to fill the job, complete pre-departure procedures and obtain passports and visas as well as health and police clearances, and the cost of internal and international travel. The costs of any government-required training and orientation for departing workers are also included, as when Indonesia and the Philippines require domestic workers undergo training before departure. What about the cost of past failed efforts to find foreign jobs? On the one hand, past efforts that did not result in a foreign job could logically be included in the cost of the current successful effort to get a contract, although there may be recall bias and the need to calculate the present value of these past costs. However, if past failed efforts to go to one country are attributed to the current job in another country, migration costs in a particular corridor could be raised artificially. From a worker’s perspective, failed
7 A related target is to reduce "to less than three per cent the transaction costs of migrant remittances and eliminate remittance corridors with costs higher than five per cent" by 2030. Indicator 10.c.1 is “remittance costs as a proportion of the amount remitted.”

17
investments to get foreign jobs are relevant to the payoff from migration in the current job, but in a bilateral migration cost matrix, including the costs of failed efforts to move in other corridors, would bias cost estimates for specific corridors. Third, should opportunity and social costs be included? Most worker surveys ignore opportunity and social costs because they are hard to measure accurately and are likely to vary widely from worker to worker. It is also hard to determine exactly how policy changes could affect opportunity and social costs. Similarly, it is very hard to determine the effects of the emigration of particular types of workers on sending countries, such as the effects of the out-migration of health-care workers. There is no good way to measure social costs of a “brain drain” on those left behind. Interviewing Workers
Measuring worker-paid financial costs for the current job as a share of foreign earnings is hard. Unlike remittances, where remitters can be surveyed to determine what they charge to send $200 or $300 via various corridors, it is widely believed that recruitment cost data must be obtained from workers because recruiters will not report accurately the amounts they receive from workers. However, it would be useful to conduct surveys of recruiters to compare the cost and earnings data they provide with what workers report, and to compare the results of recruiter surveys in COOs and CODs for the same corridor. If the cost data provided by recruiters prove reliable, it is far cheaper to survey recruiters than workers. Most migration cost data are obtained from workers who can be asked about the financial costs they incurred to get foreign jobs upon departure, while employed abroad, or on return. There are advantages and disadvantages of each time and place to interview workers. Asking departing workers what they paid to get jobs provides a sampling frame if, for example, each 100th worker is interviewed; however, departing workers may not know their net foreign earnings and may be reluctant to report that they paid excessive fees for fear that acknowledging the payment of excess fees may slow or stop their departure. Interviewing workers while they are employed abroad has the advantage of providing accurate net foreign earnings data, but there may be recall bias in reporting financial costs before departure. There are two major sampling issues: where to interview workers while they are abroad, and who should conduct the interviews. There are three major options to collect worker-paid cost data in the country of employment. First, countries such as Canada, Korea, and Singapore conduct orientation sessions for some or all newly arrived workers, and a sample of new arrivals could be asked what they paid to get their jobs. The cost data are likely to be accurate, but newly arrived workers may not yet know their earnings. Second, COO labor attachés in countries of employment could ask a sample of workers employed abroad about their migration costs. Using labor attachés should reduce language issues and may have the added benefit of educating migrant-sending governments about worker costs and earnings, but additional resources would likely be required. Labor attachés would need a reliable sampling frame, since interviewing only workers who come to them with problems may generate a biased sample. Third, receiving government statistical agencies could interview migrant workers at home or work. Many labor force surveys are household based, meaning that workers are interviewed where they live rather than where they work. Household surveys can obtain data on more than employment and earnings,

18
including income, reasons for not-working, and other socio-demographic data. However, it may be hard to obtain an accurate sampling frame for a household survey that includes migrant workers, especially those who live in nonstandard housing such as barracks and domestic workers who live with their employers. Interviewing workers at work raises other issues. Employer or establishment surveys often rely on reports from employers of how many workers they employ and the wages they pay, and these data are often reported separately for production workers and supervisors and men and women. Employer surveys could distinguish foreign-born and local workers, and within the foreign born separate workers by visa status, but the result is likely to provide only employment and earnings data. One workplace-centered survey, the US National Agricultural Workers Survey (www.doleta.gov/agworker/naws.cfm), focuses on largely immigrant workers employed in agriculture. The NAWS was begun in 1989 because the household-based CPS was believed to miss many immigrant farm workers. The NAWS stratifies employers by size, and samples workers within these strata by asking employers for permission to interview workers at work or at home, and pays workers $20 to participate in a survey that takes 45 minutes to complete. The NAWS costs the federal government about $5 million a year, with a private contractor interviewing 3,000 farm workers around the US. Fourth, workers could be interviewed as they returned from jobs abroad, especially to countries that have special desks for returning migrants, including Indonesia, Mexico, and the Philippines. Interviewing returning workers has the advantage of being relatively low cost and providing a sampling frame, but could miss workers who return via means other than airports with migrant reception centers. Overall, the most promising way to collect data on worker-paid migration costs as a share of foreign earnings is to collect data from workers in the CODs where they work. The lowest-cost method in countries with orientation for newly arrived workers is to conduct interviews with workers during their orientation. The second-lowest cost option is to use consular officials to interview their fellow citizens, but the cost of training and ensuring uniform survey methods may be high. Interviewing migrant workers via household or workplace surveys is likely to provide the most reliable data, but could take time and resources to implement. In a household survey, being foreign-born can be the first screen, followed by type of visa; but statistical agencies would have to be sensitive to groups that may not be well-represented in household surveys such as domestic workers. COD-government or contractor staff who conduct household surveys could interview a sample of migrant workers, with appropriate help to deal with various languages and cultural sensitivities, including assuring those interviewed that their answers are confidential. Costs, Loans, and Earnings
At a minimum, workers should be asked what they paid for their current job and the various components of the total charge, beginning with payments made to get the contract to go abroad such as visa and agent fees, the costs of required documents and checks, including passports, visas, health, criminal, language, skills and other tests, internal and international travel costs, and any required payments to worker welfare funds or for insurance.

19
In a labor force survey, there is likely space only for major migration-cost categories, and some workers may report the lump sum that they paid. Workers can be asked if employers or anyone else reimbursed them any of these migration costs. Many workers borrow money to go abroad. Workers could be asked if they borrowed money to obtain the contract, from whom and at what interest rate, and the current status of the loan. These questions deal with worker-paid costs in the sense that borrowing money to go abroad can increase migration costs. The third set of questions can deal with jobs and earnings at home and abroad. Workers can be asked about employment and earnings in their current job, usual hours of work, and work-related benefits and rights, as well as employment and earnings in their COO in order to estimate the wage wedge between COOs and CODs. These questions generate answers to the question of whether migration is economically worthwhile for workers, and the data can help to determine relationships between worker-paid costs and recruitment costs. Note that many cost, loan, and job-related questions can be answered only by workers. Some of the questions may be sensitive to certain workers, especially those dealing with worker perceptions of their rights while employed abroad. Next Steps
KNOMAD interviewed only workers. An alternative approach would be to interview recruiters and employers about worker-paid migration costs and compare the results of recruiter and worker surveys. There may be reasons why recruiters and employers report different recruitment costs than workers, including their unwillingness to acknowledge (over)charging workers and not knowing of worker payments to subagents and others in the migration chain. However, surveying employers and intermediaries would have the advantage of being far less costly than surveying workers, and would provide an immediate basis to ask why costs for a particular type of worker vary within a corridor. These considerations suggest that the best way forward is to continue to collect data from workers on what they paid to get jobs abroad, interview recruiters and employers in some of the corridors for which worker-reported cost data are available to compare worker-reported versus recruiter- and employer-reported cost data, and hold focus groups with workers, recruiters, employers, and others to reconcile worker-reported data with other data on migration costs. There should also be meetings with government agencies that conduct household and labor force surveys to determine their capacity and willingness to add migration cost modules to ongoing surveys, and meetings with labor attachés posted in CODs to determine the feasibility of them undertaking migration-cost surveys. Three concrete steps could help to implement SDG 10.7.1. First, the KNOMAD data collected from the 3,000 workers who were interviewed while they were abroad and as they returned between 2014 and 2016 could be used to construct a migration cost matrix that can lead to a better understanding what costs are and why they vary between corridors for workers with similar earnings abroad. Focus groups at both ends of particular migration corridors could improve understanding of why migration costs vary and what could be done to reduce them. Second, there have been many migration cost studies over the past two decades, but their findings have not been assessed systematically. A meta-analysis of these studies, grouped by corridor, date, and method

20
of collecting migration cost data, could be very useful to understand migration costs and guide efforts to collect more data. Third, more migration cost data could be collected, with efforts to interview workers via the three major mechanisms of pre-departure, while abroad, and upon return in order to determine which method is most efficient to collect reliable data. Some of the data should be collected in corridors where migration cost data already exist to permit comparisons, while other data collection efforts could be made in areas with limited data, including Africa and the Americas. Conclusions
Low-skilled migrant workers often pay to get foreign jobs offering higher wages. Pilot surveys in Korea, Kuwait, and Spain in 2014 found that the amount paid by workers ranged from less than a month’s foreign earnings in Spain to four months’ earnings in Kuwait. Over 2,000 workers returning from jobs in Gulf Cooperation Countries were interviewed in 2015, and they reported migration costs that ranged from one to nine month’s foreign earnings. Older and experienced Filipinos returning from Qatar reported the lowest migration costs of about a month’s foreign earnings, followed by Indian construction workers who reported that their migration costs were equivalent to two months Qatari earnings. Ethiopian women returning from being domestic workers in Saudi Arabia reported paying over three months Saudi earnings in pre-departure migration costs. Nepalis and Pakistanis had the highest migration costs, over three months foreign earnings for returning Nepalis and over seven months for returning Pakistanis. The migration cost surveys suggest three major conclusions. First, the major determinant of migration costs for low-skill migrant workers is corridor, as when Pakistanis pay more than Nepalis, and Indians pay more than Filipinos. Reducing worker-paid migration costs is likely to require corridor-specific steps. The gap in migration costs is seven to one between corridors, while the gap in average earnings is about two to one. Second, workers who used recruiters or agents to get foreign jobs had higher costs but not necessarily higher earnings abroad. In several corridors, workers learned about foreign jobs via friends and relatives, but used a recruiter or agent to get their contract. In these cases, it appears that recruiters are collecting fees from workers because they control contracts for foreign jobs. Third, workers with more education or ties to transnational social networks, previous experience working abroad, and women pay less than first-time male migrants who are not linked to migration networks. However, the women who pay less in migration costs were often domestic workers who were employed for long hours and earned less abroad than men employed in construction and services. Within particular migration corridors, some workers reported much higher costs than others for foreign jobs that paid similar wages. Interviewers did not probe why some workers had very high costs; in many corridors, the 10 per cent of workers with the highest migration costs accounted for 20 to 30 per cent of total costs. Future research could help to determine why these individuals had such high migration costs,

21
and whether the optimal strategy is to prioritize reducing migration costs for those who pay such high costs or for all workers. Bibliography
Abella, Manolo and Philip Martin. 2014. Measuring recruitment or migration costs: A technical report for KNOMAD’s Thematic Working Group on Low-Skilled Migrants – co-chaired with the ILO. Agenda 2030. 2015. The Sustainable Development Agenda. UN. http://www.un.org/sustainabledevelopment/development-agenda/ International Labor Organization. 2015. ILO Global Estimates of Migrant Workers. December 15. www.ilo.org/global/topics/labour-migration/publications/WCMS_436343/lang--en/index.htm ILO, OECD, World Bank. 2015. The Contribution of Labour Mobility to Economic Growth. September. Joint paper prepared for the G20 Labour and Employment Ministers' Meeting. www.ilo.org/global/about-the-ilo/how-the-ilo-works/multilateral-system/g20/reports/WCMS_398078/lang--en/index.htm Martin, Philip, 2014. Lower Migration Costs to Raise Migration’s Benefits. New Diversities. Vol 16. No 2. Pp 9-19. http://newdiversities.mmg.mpg.de/?page_id=1715&print=print September 19 UN Summit. 2016. Summit for Refugees and Migrants - 19 September 2016. http://refugeesmigrants.un.org/summit SDG 10 Indicators. https://medium.com/sdgs-resources/sdg-10-indicators-c52f0eae5d4e#.ccwdbpaoa and http://sdg.data.gov/10-7-1/ UN Secretary General. 2013. International Migration and Development. www.un.org/en/development/desa/population/theme/international-migration/