Do CEOs Matter? Corporate Performance and the CEO Life Cycle

What Do CEOs Do?�
Oriana BandieraLondon School of Economics
Luigi GuisoEuropean University Institute and EIEF
Andrea PratLondon School of Economics
Ra¤aella SadunHarvard Business School
October 7, 2009
Abstract
We develop a methodology to collect and analyze time diaries of top executives. Our
idea �sketched out in a simple theoretical set-up �is that CEO time is a scarce resource
and that its allocation can help us identify the �rm�s priorities as well as the presence
of governance issues. We record the work-related activities of 103 CEOs of top-600
Italian �rms over a pre-speci�ed week. We �nd that CEOs di¤er a lot in how much
time they spend at work and how much time they devote to outsiders (e.g. consultants,
investors, banks, etc) vs insiders (employees of the �rm). We relate these di¤erences to
�rm performance and �rm characteristics: we interpret the empirical �ndings within two
versions of our model, one with e¤ective corporate governance and one with imperfect
governance.
EXTREMELY PRELIMINARY AND INCOMPLETE: PLEASE DO NOT QUOTE
AND DO NOT CIRCULATE
1 Introduction
Time management has been at the core of the research on management for almost �fty years.
Peter Drucker (1966) makes it the centerpiece of his celebrated book on e¤ective management:
�E¤ective executives know that time is the limiting factor. The output of any process are set
by the scarcest resource. In the process we call �accomplishment�, this is time.�
More recently, the importance of time constraints for people at the top of organizational
hierarchies has been recognized by a number of economic models, like Radner and Van Zandt�s
�We thank seminar participants at Imperial College and LSE for useful comments. We are grateful to
Tito Boeri, Daniel Ferreira, Luis Garicano, Steve Pischke, and Fabiano Schivardi for useful suggestions. This
research was made possible by generous funding from Fondazione Rodolfo Debenedetti.
1

work on hierarchies,1 Bolton and Dewatripont (1994), and Garicano (2000). Intellectual
tasks �information processing in Radner-Van Zandt, communication in Bolton-Dewatripont,
problem solving in Garicano �require managerial time, which is particularly scarce at the top
of the organization. A key question in organization economics is then how managers should
allocate their time optimally.
A CEO performs two roles: she manages the �rm and she manages the �rm�s relationship
with the outside world. According to Peter Drucker (2004), �The CEO is the link between
the Inside that is the organization, and the Outside of society, economy, technology, markets,
and customers. Inside there are only costs. Results are only on the outside.�Here, we try to
measure how much time CEOs devote to internal activities as opposed to external activities,
and we try to relate it to �rm and CEO characteristics.
There is no agreement on how outward-looking or inward-looking the CEO should be.
On one side of the spectrum, Procter & Gamble�s CEO A. G. La�ey views the link with the
outside as the raison d�être of the top executive: �The CEO alone experiences the meaningful
outside at an enterprise level and is responsible for understanding it, interpreting it, advocat-
ing for it, and presenting it so that the company can respond in a way that enables sustainable
sales, pro�t, and total shareholder return (TSR) growth.�According to this widely held view,
an important �if not the most important �role of the CEO is to be the public face of the
company and to network on its behalf.
However, in an in�uential book, Khurana (2002) articulates the view that the market for
CEOs is deeply �awed. The search for external, charismatic �corporate saviors�leads boards
�and the executive search companies they employ �to give their preference to highly visible
personalities. In turn, this creates an incentive for CEOs to seek visibility, by cultivating
personal connections with in�uential business leaders. Also, recent work by Malmendier
and Tate (2009) study what happens when CEOs receive prestigious business awards, both
interms of �rm performance and CEO behavior. One of their �ndings is that award recipients
appear to devote more time to writing books, playing golf, and sitting on boards of other
companies.
The present paper contributes to this debate by attempting to study the outsider/insider
focus in a direct way. We observe how a sample the time allocation of 103 CEOs. We record
their activities over a pre-selected work week. In particular, we know how much time they
spend with �rm employees as opposed to other business contacts.
As hinted above, the idea behind this methodology is that CEO time is a scarce resource
and its allocation can tell us about the priorities of CEOs and how they relate to the priorities
of the �rm. To structure our thinking, we develop a minimalistic model of managerial time
1See Van Zandt (1998) for a survey.
2
allocation. The CEO chooses how much time to devote to a number of possible work-related
activities, or to leisure. Each of these activities yield a bene�t to the �rm (ie monitoring
R&D increases the chance that the �rm will develop new successful products, or networking
with customers may increase sales). The activity can also yield a private bene�t to the CEO,
maybe because it may help her �nd a new job in the future as in Khurana, or because it
provides direct ego rents or direct enjoyment, as in Malmendier and Tate.
We consider two scenarios. In an e¤ective governance world, the CEO�s incentives are
perfectly aligned with the �rm�s incentives. Of course in this ideal world, the CEO still enjoys
some leisure. However, the time she spends at work is allocated in a way that maximizes her
�rm�s expected pro�t.
Instead, in an imperfect governance world, the CEO�s incentives are only partly aligned
with the �rm�s goals. The CEO allocates time to maximize a combination of �rm goals and
personal utility.
This set-up yields three simple implications:
1. In an e¤ective governance world, �rms�priorities determine time allocation. Di¤erences
in the CEOs pattern of time use are due to di¤erences in �rms�priorities.
2. In an imperfect governance world, time allocation does not identify �rms�priorities.
However: Suppose activities can be roughly divided into the ones that bene�t mostly
the �rm (productive time) and those that bene�t mostly the CEO (networking time).
In an imperfect governance world, the observed correlation of �rm productivity with
productive time is greater than the observed correlation with networking time. This
allows to use productivity regressions to identify time productivity.
3. In a world with imperfect governance, if we have a measure of �rm governance we
use CEO time allocation to identify productive time and networking time. Better
governance reduces the ability of CEOs to devote time to unproductive activities.
We develop a new methodology to collect time use information from CEOs. To do so, we
ask her personal assistant (PA) to keep a diary of the CEO�s activity during a pre-speci�ed
week (from Monday to Friday). As Sadowski (2004) makes abundantly clear, a CEO cannot
operate without the help of an e¤ective PA. The PA has full control of his boss�s schedule
and he has a good understanding of the functions of the people that his boss interacts with.2
2Roxanne Sadowski was Jack Welch�s long-term PA: �For more than fourteen years, I�ve been human
answering machine, auto dialer, word processor, �ltering system, and fact checker; been a sounding board,
schlepper, buddy, and bearer of good and bad tidings; served as a scold, diplomat, repairperson, cheerleader
and naysayer; and performed dozens of other roles under the title of �assistant�.�
3
The PA records all the activities of the CEO that last longer that 15 minutes as well
as their characteristics. In particular, if the activity includes other people (meeting, event,
phone conference, etc), the assistant lists the functions of the other people who were present.
Insiders are listed by functional area: e.g. �nance, marketing, human resources, etc. Out-
siders belong to standard categories: e.g. suppliers, investors, consultants, etc.
Our main �ndings are:
� Our CEOs work on average 47.5 hours per week. As one would expect CEOs spend themajority of their time with other people (85%). On average, CEOs spend 42% of their
time with insiders only, 25% with both insiders and outsiders and 16% with outsiders
alone.
� These averages hide a great deal of heterogeneity, both in terms of number of hoursworked and time allocation. In particular, a majority of CEOs spend very little time
(less than 5 hours per week) alone with outsiders, while over 10% of them spend over
10 hours a week. A binomial test veri�es that these di¤erences are extremely unlikely
to be due to noise.
� This heterogeneity in insider/outsider allocation is associated with CEO worktime.
CEOs who work longer hours spend more time with insiders and working alone and less
time (even in absolute terms) with outsiders. The �nding is even stronger when one
focuses on one-on-one meetinsg with outsiders. This result is robust to controlling for
travel time and time spent on activities shorter than 15 minutes.
� Time spent with insiders is positively correlated with �rm performance, while time
spend with outsiders exhibits no signi�cant correlation. This �nding is di¢ cult to
interpret in a world with e¤ective governance, while it accords well with prediction 2.
� Controlling for other �rm characteristics, CEOs who work for multinationals spend
more time with insiders but less with outsiders. CEOs who work for family-owned
�rms spend more time with insiders (unless they themselves are part of the owning
family). These �ndings are not inconsistent with prediction 3
Our dataset is subject to a number of serious limitations, which deserve to be mentioned
upfront. Besides the small size and its cross-sectional nature, there may be a serious selection
bias due to the low response rate (18%). We do not observe work-related activities that the
CEO may perform in the evenings or on weekends, as well as those that take less than 15
minutes. Plus, even within regular business hours, the PA may not be aware of all work-
related activities or may not be willingg to report them. The majority of the �rms in the
4

sample are not listed. We could only retrieve a reliable cv for about 80% of the CEOs in the
sample. We try to tackle these problems at various points of the paper.
The paper is structured as follows. After a brief literature review, Section 2 explains our
empirical methodology and provides descriptive statisticts. Section 3 presents a simple time
allocation model. Section 4 reports further empirical �ndings based on our theoretical set-up.
1.1 Related Literature
To the best of our knowledge, this is the �rst paper that measures how CEOs spend their time.
Time management is a common theme in the management literature on CEOs. Besides the
above cited work by Drucker (1961), La�ey and Khurana, a number of other authors have
discussed how managers allocate or should allocate their time. The closest exercise was
performed by Luthans (1988), who records in detail the activities of 44 managers. Besides
the obvious di¤erence that our subjects are CEOs, the focus is quite di¤erent as Luthans�
goal is to determine the determinants of a manager�s success within his or her organization.
Other celebrated management authors, such as Kotter or Mintzberg, also base their works
on in-depth observation of managerial behavior, however they do not make use of systematic
time use surveys.
The second part of our analysis, when we discuss the role of gorvernance, is related to the
the vast literature on agency problems for CEOs (see the survey by Stein (2003)). Our paper
studies one particular form of moral hazard, which relates to time allocation, and hence it
is quite far from other types of misbehavior, such as resource Malmendier and Tate (2008),
who study what happens when CEOs receive prestigious business awards, both interms of
�rm performance and CEO behavior. One of their �ndings is that award recipients appear
to devote more time to writing books, playing golf, and sitting on boards of other companies.
Our paper is complementary to Bertrand and Schoar�s (2003) analysis of management
style through a panel data of matched CEO-�rm observations. While their objective is to
identify the �xed e¤ect of individual managers, our goal is to use a direct behavior variable
(time allocation) to make inferences on the implicit incentive structure that managers face.
2 The CEOs�Diaries: Descriptive Evidence on Di¤erent Timeuses
2.1 Sources and Sample Description
Our main data source is a time use survey, which we designed to identify the activities CEOs
engage in on a day-to-day basis. The survey e¤ectively shadows the CEO through his PA
5

for every day over a one week period. The PA is asked to record real-time information on all
the CEO�s activities that last 15 minutes or longer in a time use diary. The diary records
information on the type of activity (e.g. meetings, phone calls etc), its duration, its location,
whether it was scheduled in advance and when, whether it is held regularly and how often.
The diary also collects information on the number of participants, whether these belong to the
�rms or not, and their occupational areas for insiders (e.g. �nance, marketing) and relation
to the �rm for outsiders (e.g. investors, suppliers). The PA is also asked to record the total
time the CEO spends in activities that last 15 minutes or less and in transit. Each PA is
randomly assigned one of �ve weeks between February 10 and March 14, 2007.
The master sample contains the top 800 Italian �rms from the Dun&Bradstreet data
base (2007) and the top 50 Italian banks from the list of all major Italian �nancial groups
compiled yearly by the Research Division of Mediobanca, a leading Italian investment bank.
Size is measured as yearly revenue for �rms and as the average of (i) employment, (ii) Stock
market capitalization; (iii) Total value of loan portfolio for banks. All 850 institutions were
contacted to ascertain the identity and contact details of the CEO; this procedure yielded 720
complete records. Of these, 50 were randomly selected for a pilot survey and the remaining
670 formed the �nal sample. The response rate was 18%, yielding complete information on
the time use of 119 CEOs.3 To maintain comparability across individuals, we drop ten CEOs
who also cover the role of "president". As part of the analysis relies on performance measures
that cannot be compared between �rms and banks (e.g. productivity), we drop banks from
the sample. The �nal sample contains 103 CEOs.
We match the time use data with two further sources. The �rst is the Amadeus data base,
which contains balance sheet data, �rm size and demographics, and which can be matched
to 99 �rms in our sample. The second is a data-set that we created collating information
from the �rms�websites and from telephone interviews with the CEOs�personal assistant
and that contains information on �rm ownership and on the CEOs�curriculum vitae.
Table 1 describes our sample �rms and CEOs. Panel 1A shows that manufacturing is the
most common sector (40%) followed by Finance, Insurance and Real Estate (15%), Services
(15%), Transportation, Communication and Utilities (13%), Wholesale and Retail (11%),
Mining (3%) and Construction (3%). The median �rm in our sample has 1,297 employees
and its productivity (measured as value of sales over employees) is USD 620,000 per year.
3The implementation of the survey was outsourced to a professional survey �rm, Carlo Erminero and co.,
headquartered in Milan. Sample CEOs received an o¢ cial invitation letter from the Fondazione Rodolfo
Debenedetti that sponsorsed this project, followed by a personal phone call explaining the purpose of the
survey and the relevant con�dentiality clauses. Upon acceptance, the survey was mailed to the PA identi�ed
by the CEO, who was asked to record the information and send back the completed forms via either fax or
mail.
6
The sample covers di¤erent ownership structures: 40% of the sample �rms are widely held,
20% belong to families, and the remainder is split between government, private individuals,
private equity and cooperatives. Finally, the sample is evenly split between domestic �rms,
Italian multinationals and Italian subsidiaries of foreign multinationals.
Panel 1b provides information on the CEOs. Ninety-eight percent of the sample CEOs
are male, and the average age is 53. One quarter of the sample CEOs have an MBA or other
graduate degree, and half of them have had some international exposure either through work
or education. Just under two thirds of the sample CEOs have been promoted internally,
namely held a di¤erent position within the �rm before becoming CEOs. On average, they
have been CEOs for 3.54 years while the average tenure at the �rm is 7.7 years.
2.2 CEOs�Time Use: Insiders vs Outsiders
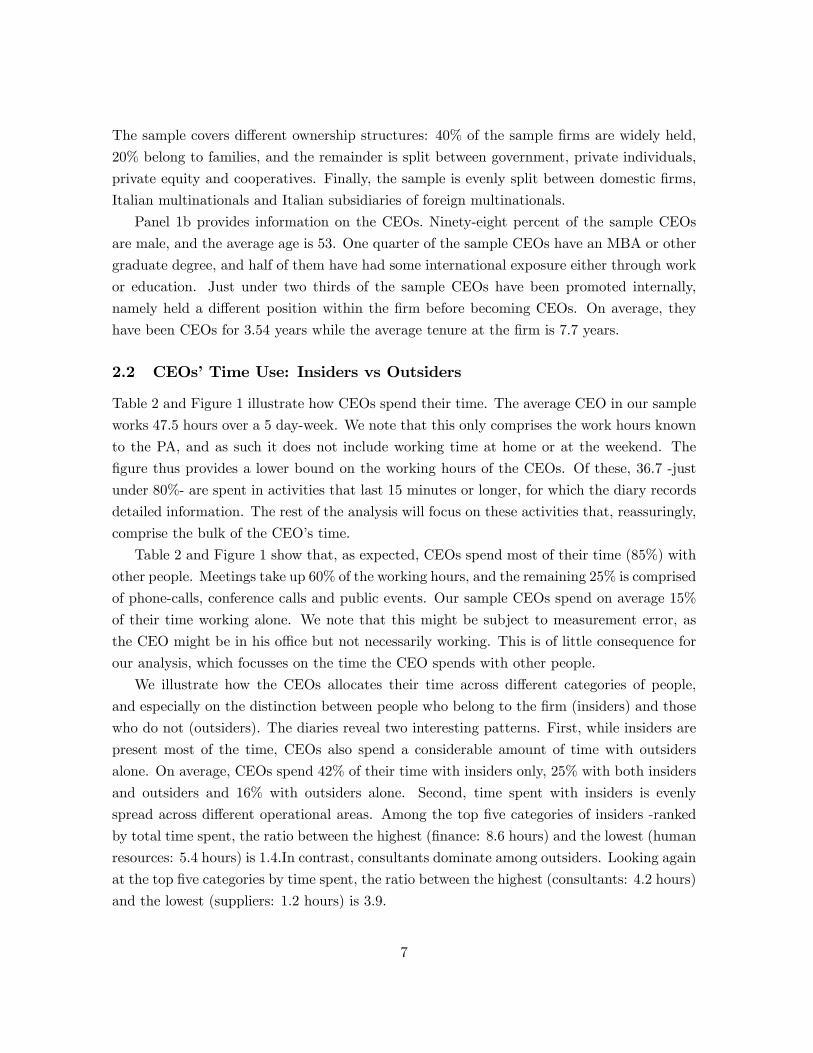
Table 2 and Figure 1 illustrate how CEOs spend their time. The average CEO in our sample
works 47.5 hours over a 5 day-week. We note that this only comprises the work hours known
to the PA, and as such it does not include working time at home or at the weekend. The
�gure thus provides a lower bound on the working hours of the CEOs. Of these, 36.7 -just
under 80%- are spent in activities that last 15 minutes or longer, for which the diary records
detailed information. The rest of the analysis will focus on these activities that, reassuringly,
comprise the bulk of the CEO�s time.
Table 2 and Figure 1 show that, as expected, CEOs spend most of their time (85%) with
other people. Meetings take up 60% of the working hours, and the remaining 25% is comprised
of phone-calls, conference calls and public events. Our sample CEOs spend on average 15%
of their time working alone. We note that this might be subject to measurement error, as
the CEO might be in his o¢ ce but not necessarily working. This is of little consequence for
our analysis, which focusses on the time the CEO spends with other people.
We illustrate how the CEOs allocates their time across di¤erent categories of people,
and especially on the distinction between people who belong to the �rm (insiders) and those
who do not (outsiders). The diaries reveal two interesting patterns. First, while insiders are
present most of the time, CEOs also spend a considerable amount of time with outsiders
alone. On average, CEOs spend 42% of their time with insiders only, 25% with both insiders
and outsiders and 16% with outsiders alone. Second, time spent with insiders is evenly
spread across di¤erent operational areas. Among the top �ve categories of insiders -ranked
by total time spent, the ratio between the highest (�nance: 8.6 hours) and the lowest (human
resources: 5.4 hours) is 1.4.In contrast, consultants dominate among outsiders. Looking again
at the top �ve categories by time spent, the ratio between the highest (consultants: 4.2 hours)
and the lowest (suppliers: 1.2 hours) is 3.9.
7
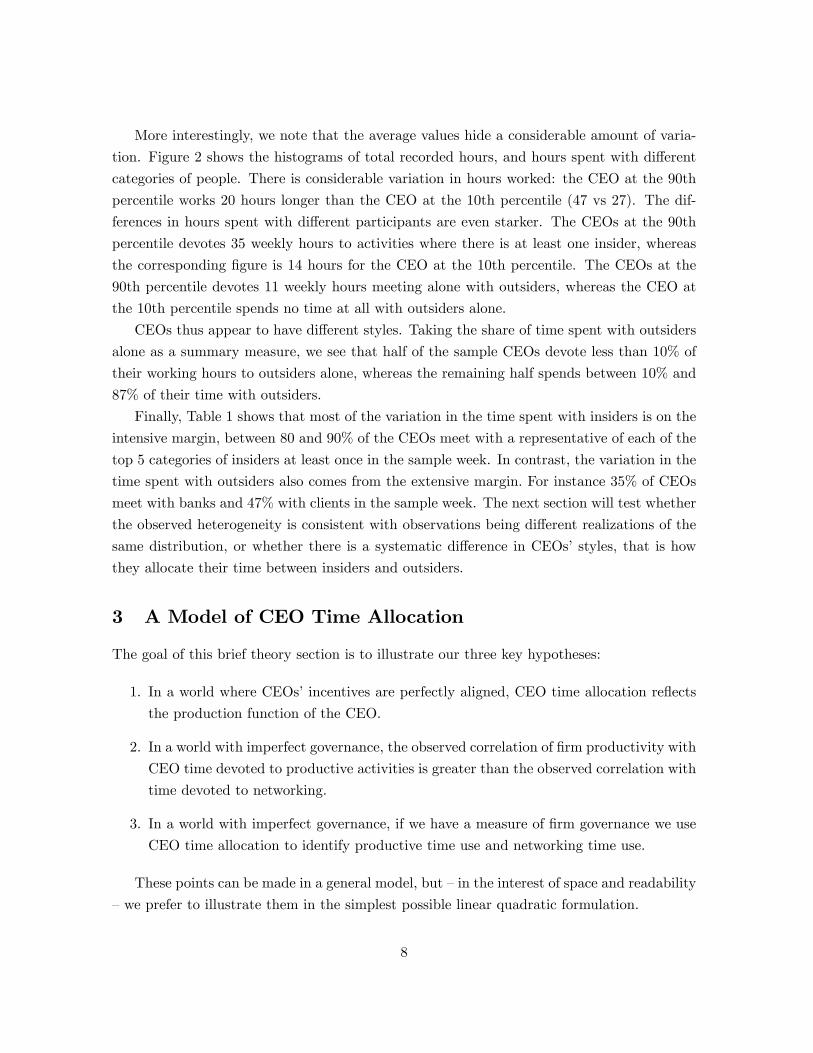
More interestingly, we note that the average values hide a considerable amount of varia-
tion. Figure 2 shows the histograms of total recorded hours, and hours spent with di¤erent
categories of people. There is considerable variation in hours worked: the CEO at the 90th
percentile works 20 hours longer than the CEO at the 10th percentile (47 vs 27). The dif-
ferences in hours spent with di¤erent participants are even starker. The CEOs at the 90th
percentile devotes 35 weekly hours to activities where there is at least one insider, whereas
the corresponding �gure is 14 hours for the CEO at the 10th percentile. The CEOs at the
90th percentile devotes 11 weekly hours meeting alone with outsiders, whereas the CEO at
the 10th percentile spends no time at all with outsiders alone.
CEOs thus appear to have di¤erent styles. Taking the share of time spent with outsiders
alone as a summary measure, we see that half of the sample CEOs devote less than 10% of
their working hours to outsiders alone, whereas the remaining half spends between 10% and
87% of their time with outsiders.
Finally, Table 1 shows that most of the variation in the time spent with insiders is on the
intensive margin, between 80 and 90% of the CEOs meet with a representative of each of the
top 5 categories of insiders at least once in the sample week. In contrast, the variation in the
time spent with outsiders also comes from the extensive margin. For instance 35% of CEOs
meet with banks and 47% with clients in the sample week. The next section will test whether
the observed heterogeneity is consistent with observations being di¤erent realizations of the
same distribution, or whether there is a systematic di¤erence in CEOs�styles, that is how
they allocate their time between insiders and outsiders.
3 A Model of CEO Time Allocation
The goal of this brief theory section is to illustrate our three key hypotheses:
1. In a world where CEOs�incentives are perfectly aligned, CEO time allocation re�ects
the production function of the CEO.
2. In a world with imperfect governance, the observed correlation of �rm productivity with
CEO time devoted to productive activities is greater than the observed correlation with
time devoted to networking.
3. In a world with imperfect governance, if we have a measure of �rm governance we use
CEO time allocation to identify productive time use and networking time use.
These points can be made in a general model, but �in the interest of space and readability
�we prefer to illustrate them in the simplest possible linear quadratic formulation.
8

The section ends by dealing with the connection between desired time allocation, which
is the activity time distribution predicted by the model, and observed time allocation, which
is the particular realization of the theoretical time distribution that we observe in our CEO
diaries.
3.1 De�nitions
The CEO faces n activities and allocates non-negative time vector (x1; :::; xI) to the activities.
The �rm�s production function is
Y =
nXi=1
�ixi
The vector � describes the value of the top manager�s time in all possible activities and it is
determined by the �rm technology and environment.
The CEO can also produce some personal rent (e.g. networking), with production function
R =
nXi=1
�ixi
The vector � depends on characteristics of the the CEO and the institutional and economic
environment he operates in.
The total cost of time for the CEO is
C =1
2
nXi=1
x2i :
There is an increasing marginal cost in devoting time to one particular activity, due either
to the onset of boredom or to a lower time-e¢ ciency (for instance, take the time devoted to
having lunch with clients; the time spent to meet one client equals one hour for the meal plus
transportation time; the CEO �rst meets the clients who are willing to come to the �rm or
those who work nearby; then he has to spend more time traveling if he wants to meet the
ones in more distant locations).
The CEO�s payo¤ is
u = bY + (1� b)R� C:
The parameter b plays an important role. It denotes the alignment between the �rm�s interests
and the CEO�s �implicit or explicit �incentive structure. If b = 1, the �rm and the CEO
have perfectly aligned interests. If b = 0, the CEO only pursues personal interest.
9
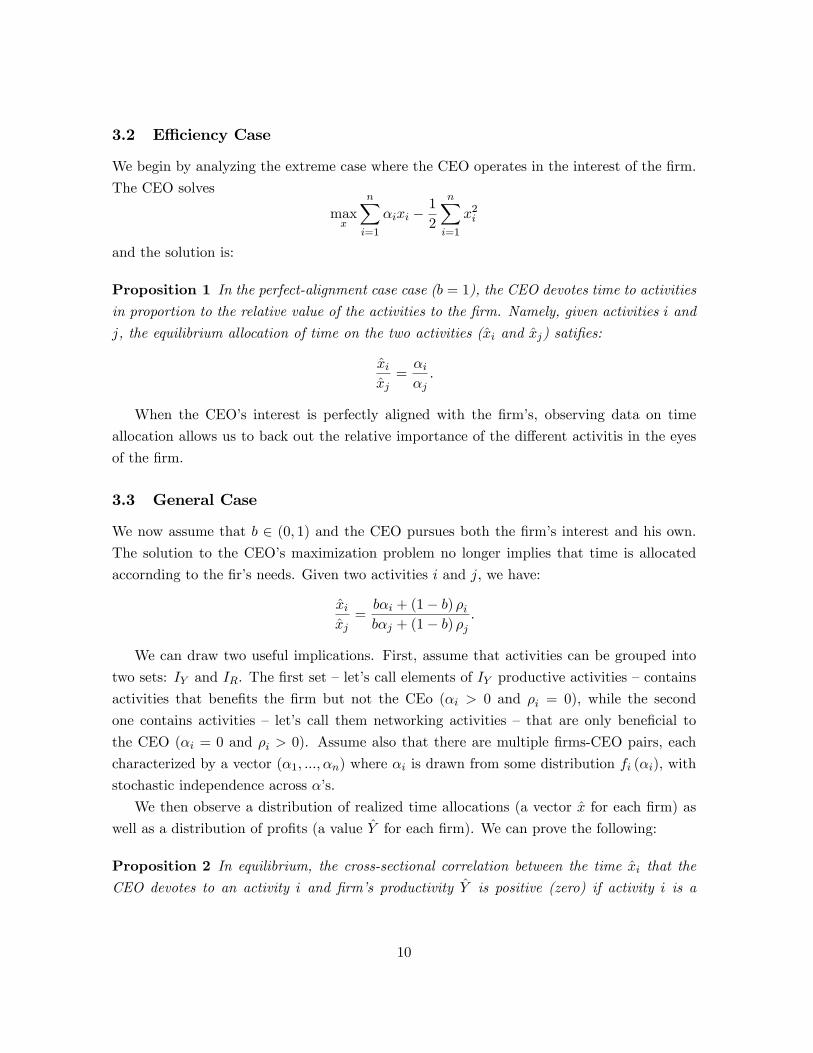
3.2 E¢ ciency Case
We begin by analyzing the extreme case where the CEO operates in the interest of the �rm.
The CEO solves
maxx
nXi=1
�ixi �1
2
nXi=1
x2i
and the solution is:
Proposition 1 In the perfect-alignment case case (b = 1), the CEO devotes time to activitiesin proportion to the relative value of the activities to the �rm. Namely, given activities i and
j, the equilibrium allocation of time on the two activities (xi and xj) sati�es:
xixj=�i�j:
When the CEO�s interest is perfectly aligned with the �rm�s, observing data on time
allocation allows us to back out the relative importance of the di¤erent activitis in the eyes
of the �rm.
3.3 General Case
We now assume that b 2 (0; 1) and the CEO pursues both the �rm�s interest and his own.
The solution to the CEO�s maximization problem no longer implies that time is allocated
accornding to the �r�s needs. Given two activities i and j, we have:
xixj=b�i + (1� b) �ib�j + (1� b) �j
:
We can draw two useful implications. First, assume that activities can be grouped into
two sets: IY and IR. The �rst set �let�s call elements of IY productive activities �contains
activities that bene�ts the �rm but not the CEo (�i > 0 and �i = 0), while the second
one contains activities � let�s call them networking activities � that are only bene�cial to
the CEO (�i = 0 and �i > 0). Assume also that there are multiple �rms-CEO pairs, each
characterized by a vector (�1; :::; �n) where �i is drawn from some distribution fi (�i), with
stochastic independence across ��s.
We then observe a distribution of realized time allocations (a vector x for each �rm) as
well as a distribution of pro�ts (a value Y for each �rm). We can prove the following:
Proposition 2 In equilibrium, the cross-sectional correlation between the time xi that theCEO devotes to an activity i and �rm�s productivity Y is positive (zero) if activity i is a
10

productive (networking) activity. Namely
Corr�Y ; xi
�> 0 if i 2 IY ;
Corr�Y ; xi
�= 0 if i 2 IR:
Proof. We have
Corr�Y ; xi
�= Corr
nXi=1
�ixi; xi
!= �i;
which is strictly greater than zero if and only if �i > 0.
Second, consider two �rms with di¤erent governanc standards. The �rst �rm somehow
manages to make sure that the CEO�s incentive structure is better aligned: b > b0. Then we
can show:
Proposition 3 A decrease in the quality of corporate governance induces the CEO to spendmore time on networking activities and less time of productive activities. Namely, if b0 > b,
xi�b0�< xi (b) if i 2 IY ;
xi�b0�> xi (b) if i 2 IR:
Proof. Immediate from the fact that the optimal time allocation satis�es
xi = b�i + (1� b) �i:
4 Evidence on CEOs�Time Use
Guided by the theoretical framework we now explore the correlation between the time use
of the CEO and three sets of variables: (i) CEOs� e¤ort, (ii) �rms performance and (iii)
proxies of �rm governance. It is key to stress that our analysis only uncovers equilibrium
correlations, that is the nature of the data does not allow us to establish causal links. The
analysis will however shed light on the set of assumptions under which the evidence can be
made consistent with the two views of the world -perfect vs imperfect governance- formalized
by the theoretical framework. We will discuss these in details at the end of this section.
4.1 CEOs�Time Use and E¤ort
The descriptive evidence in Figure 2 indicates that CEOs di¤er considerably both in the
amount of time they work and in how they allocate this across di¤erent categories of people.
11

Our �rst test aims to assess whether e¤ort -measured by hours worked- and time use are
correlated. Namely do CEOs who work longer hours devote proportionately more time to
insiders and outsiders? Or do CEOs who work longer hours have a di¤erent pattern of time
use?
We proxy e¤ort by the number of hours the diary records in detail- namely the total
number of hours spent in activities longer than 15 minutes excluding travel. The results are
qualitatively similar if we include the PA�s estimate of the time devoted to activities shorter
than 15 minutes and the time devoted to travel.
Under the reasonable assumption that if the CEO devotes some of his time to networking
activities he is more likely to do so when no other �rm employee is present, we focus on
the distinction between time spent with at least one insider- with or without outsiders- and
time spent with outsiders alone. Table 3 estimates the correlations between hours worked and
time allocated to insiders and outsidersalone , conditional on �rm size and industry dummies.
Columns 1 and 2 show that there is a signi�cant correlation between the total time the CEO
spends at work and how he allocates this between di¤erent categories of people. In particular,
the hours devoted to insiders increase in proportion to hours worked, whereas the hours spent
with outsiders alone do not. The table reports the p-value of the test of the null hypothesis
that the coe¢ cient is equal to one- namely that hours with insiders (outsiders) increase in
direct proportion to the hours worked. We �nd that the coe¢ cient in the regression of the
logarithm of hours spent with insiders on the logarithm of total hours is not statistically
di¤erent from one, whereas the coe¢ cient in the corresponding regression for hours spent
with outsiders only is negative, and signi�cantly di¤erent from one.
The next four columns show that the negative correlation between hours worked and
hours spent with outsiders alone is driven exclusively by the fact that CEOs who work longer
hours devote fewer hours to one-to-one meetings with outsiders alone. Columns 4 to 7 divide
the time spent with insiders and outsiders into time spent with one or more categories of
each. For instance, a meeting with investors would fall under the "one category of outsiders"
heading, whereas a meeting with investors and consultants would fall under the "more than
one category of outsiders" heading. Columns 4 and 5 show that the correlation between
hours worked and time spent with insiders does not depend on whether these belong to one
or more categories. In contrast, Columns 6 and 7 show that CEOs who work longer hours
spend fewer hours in meetings alone with one type of outsiders only. The correlation with
hours spent with more than one category of outsiders is positive but signi�cantly less than
one.
Columns 8 to 11 divide the time spent with insiders and outsiders according to the number
of people participating in the activity. In line with the �ndings above, Columns 8 and 9 show
12
that the correlation between hours worked and time spent with insiders does not depend on
the number of insiders present. In contrast, Column 10 shows that CEOs who work longer
hours spend fewer hours in meetings with one or two outsiders and nobody else.
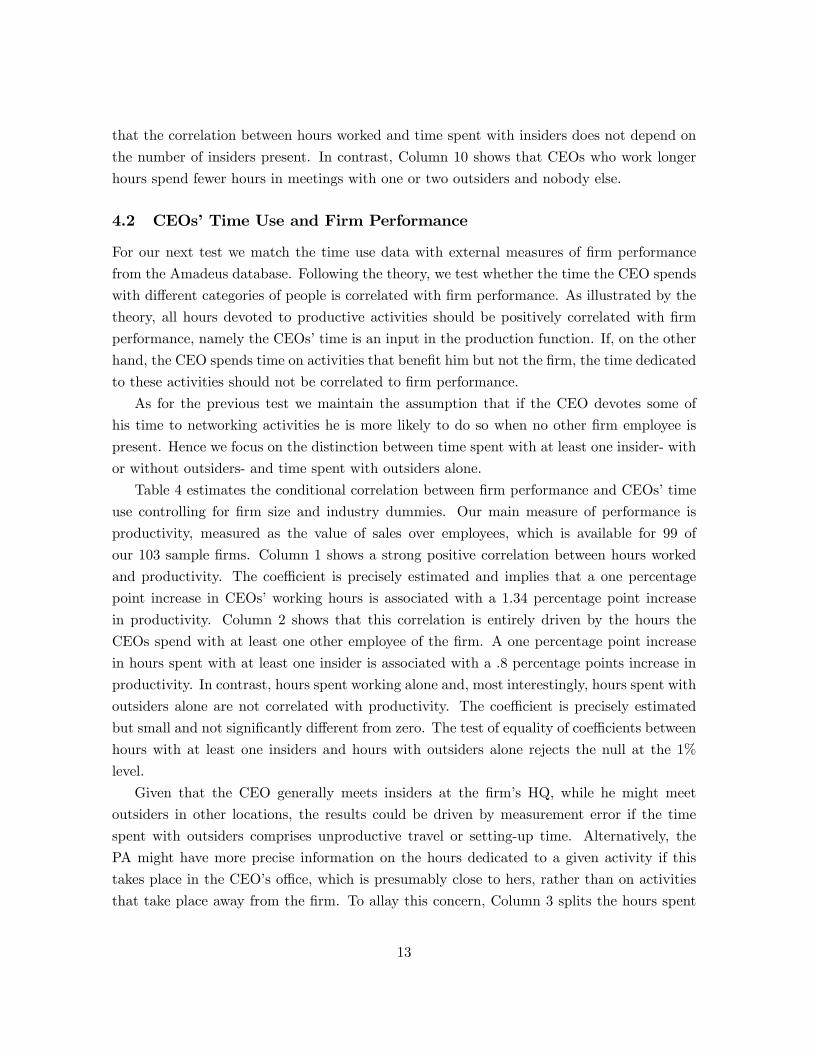
4.2 CEOs�Time Use and Firm Performance
For our next test we match the time use data with external measures of �rm performance
from the Amadeus database. Following the theory, we test whether the time the CEO spends
with di¤erent categories of people is correlated with �rm performance. As illustrated by the
theory, all hours devoted to productive activities should be positively correlated with �rm
performance, namely the CEOs�time is an input in the production function. If, on the other
hand, the CEO spends time on activities that bene�t him but not the �rm, the time dedicated
to these activities should not be correlated to �rm performance.
As for the previous test we maintain the assumption that if the CEO devotes some of
his time to networking activities he is more likely to do so when no other �rm employee is
present. Hence we focus on the distinction between time spent with at least one insider- with
or without outsiders- and time spent with outsiders alone.
Table 4 estimates the conditional correlation between �rm performance and CEOs�time
use controlling for �rm size and industry dummies. Our main measure of performance is
productivity, measured as the value of sales over employees, which is available for 99 of
our 103 sample �rms. Column 1 shows a strong positive correlation between hours worked
and productivity. The coe¢ cient is precisely estimated and implies that a one percentage
point increase in CEOs�working hours is associated with a 1.34 percentage point increase
in productivity. Column 2 shows that this correlation is entirely driven by the hours the
CEOs spend with at least one other employee of the �rm. A one percentage point increase
in hours spent with at least one insider is associated with a .8 percentage points increase in
productivity. In contrast, hours spent working alone and, most interestingly, hours spent with
outsiders alone are not correlated with productivity. The coe¢ cient is precisely estimated
but small and not signi�cantly di¤erent from zero. The test of equality of coe¢ cients between
hours with at least one insiders and hours with outsiders alone rejects the null at the 1%
level.
Given that the CEO generally meets insiders at the �rm�s HQ, while he might meet
outsiders in other locations, the results could be driven by measurement error if the time
spent with outsiders comprises unproductive travel or setting-up time. Alternatively, the
PA might have more precise information on the hours dedicated to a given activity if this
takes place in the CEO�s o¢ ce, which is presumably close to hers, rather than on activities
that take place away from the �rm. To allay this concern, Column 3 splits the hours spent
13
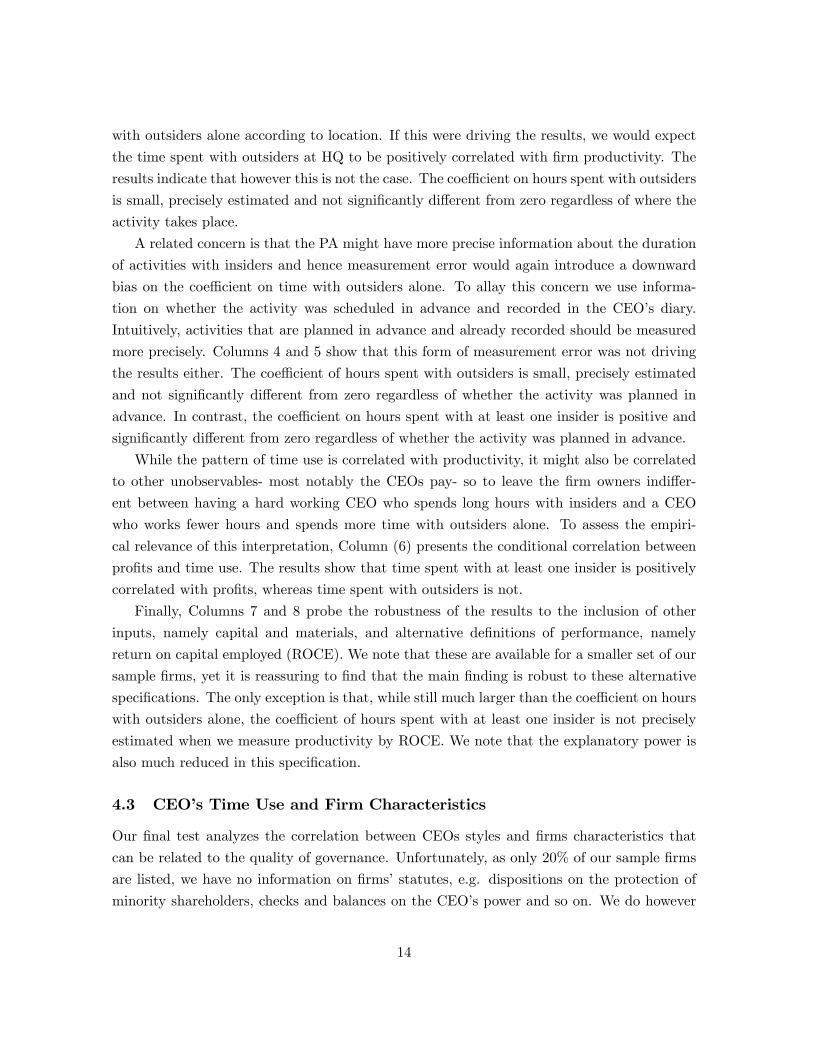
with outsiders alone according to location. If this were driving the results, we would expect
the time spent with outsiders at HQ to be positively correlated with �rm productivity. The
results indicate that however this is not the case. The coe¢ cient on hours spent with outsiders
is small, precisely estimated and not signi�cantly di¤erent from zero regardless of where the
activity takes place.
A related concern is that the PA might have more precise information about the duration
of activities with insiders and hence measurement error would again introduce a downward
bias on the coe¢ cient on time with outsiders alone. To allay this concern we use informa-
tion on whether the activity was scheduled in advance and recorded in the CEO�s diary.
Intuitively, activities that are planned in advance and already recorded should be measured
more precisely. Columns 4 and 5 show that this form of measurement error was not driving
the results either. The coe¢ cient of hours spent with outsiders is small, precisely estimated
and not signi�cantly di¤erent from zero regardless of whether the activity was planned in
advance. In contrast, the coe¢ cient on hours spent with at least one insider is positive and
signi�cantly di¤erent from zero regardless of whether the activity was planned in advance.
While the pattern of time use is correlated with productivity, it might also be correlated
to other unobservables- most notably the CEOs pay- so to leave the �rm owners indi¤er-
ent between having a hard working CEO who spends long hours with insiders and a CEO
who works fewer hours and spends more time with outsiders alone. To assess the empiri-
cal relevance of this interpretation, Column (6) presents the conditional correlation between
pro�ts and time use. The results show that time spent with at least one insider is positively
correlated with pro�ts, whereas time spent with outsiders is not.
Finally, Columns 7 and 8 probe the robustness of the results to the inclusion of other
inputs, namely capital and materials, and alternative de�nitions of performance, namely
return on capital employed (ROCE). We note that these are available for a smaller set of our
sample �rms, yet it is reassuring to �nd that the main �nding is robust to these alternative
speci�cations. The only exception is that, while still much larger than the coe¢ cient on hours
with outsiders alone, the coe¢ cient of hours spent with at least one insider is not precisely
estimated when we measure productivity by ROCE. We note that the explanatory power is
also much reduced in this speci�cation.
4.3 CEO�s Time Use and Firm Characteristics
Our �nal test analyzes the correlation between CEOs styles and �rms characteristics that
can be related to the quality of governance. Unfortunately, as only 20% of our sample �rms
are listed, we have no information on �rms�statutes, e.g. dispositions on the protection of
minority shareholders, checks and balances on the CEO�s power and so on. We do however
14
have information on ownership and nationality, all of which can be related to the quality
of governance. For instance, multinational �rms are likely to face stronger competition as
they act on many markets and are likely to have survived stronger competition to expand
globally, hence might have an advantage at aligning the interests of their CEOs with the
�rms�. Second, compared to widely held �rms, family �rms might have a better monitoring
technology because having only one owner they do not face coordination costs, or, if the CEO
belongs to the family, his incentives might be perfectly aligned with the �rm�s. At the same
time, however, a family�s CEO objective might include non-monetary bene�ts that are in
contrast with the �rms�pro�t maximization objective and family CEOs are less accountable
than CEOs in widely held corporations because they face a lower (often negligible) probability
of dismissal.
Table 5 shows that all three characteristics are correlated with the CEOs� time use.
Columns 1 and 2 show that CEOs of multinational �rms, regardless of whether foreign or
domestic, spend 39% more hours with at least one insider. CEOs of foreign (domestic)
multinational �rms spend 50% (26%) fewer hours with outsiders alone, but the coe¢ cient is
precisely estimated for foreign multinationals only.
Columns 3 to 6 show that CEOs of family �rms also have di¤erent pattern of time use,
but the di¤erence depends on whether the CEO belongs to the family or not. Family CEOs
in family �rms spend 12% fewer hours with insiders,77% more with outsiders. In contrast
non-family CEOs in family �rms spend 35% more hours with insiders and 30% fewer with
outsiders. This is in line with the literature (Perez-Gonzales, and others) that suggests that
family CEOs might underperform because selected from a more restricted pool.
We note that part of the correlation between �rms characteristics and CEOs�time use
might be explained by the fact that �rms with characteristics that are correlated with gov-
ernance might select CEOs with di¤erent characteristics- e.g. �rms that o¤er high powered
performance pay might attract more talented CEOs. It is then interesting to assess whether
and to what extent CEOs�time use is correlated to CEOs characteristics and whether these
drive the correlation between �rms�characteristics and CEOs�time use.
To this purpose we match our time use data with hand collected information on the cur-
riculum vitae of the CEOs. This information is available for a subset of our sample CEOs (see
Table 1). Table A1 in the Appendix shows that a large set of CEO characteristics or expe-
riences (education, tenure) are not correlated with time use but there is a robust correlation
between the CEO�s experience abroad and his time use. In particular, CEOs who have either
worked or studied abroad spend 33% more hours with inside and 62% fewer hours with out-
siders. Like education, foreign experience can increase a CEOs�set of skills or be a signal of
his underlying talent. Panel B in Table 5 reports the conditional correlations between CEOs�
15
time use and �rms�characteristics controlling for the CEOs�experience abroad. All results
are qualitatively similar but the coe¢ cients of foreign multinationals are about 50% smaller,
suggesting that part of the correlation between multinational status and CEO�s time use is
explained by the fact that foreign multinationals hire CEOs with di¤erent characteristics.
4.4 Interpretation: Perfect vs Imperfect Governance
The analysis above has illustrated a rich set of correlations between the CEOs�pattern of
time use, his e¤ort, and the performance and characteristics of the �rm he leads. In particular
we �nd that CEOs who work longer hours spend more time in activities that involve at least
one insider and less time in activities where the CEO meets outsiders alone. Time spent
with insiders is positively correlated with productivity and pro�ts, whereas time spent with
outsiders alone is not. Finally, time use is correlated with �rm characteristics that might be
seen as proxies for governance.
As illustrated in the theoretical framework, variations in time use can either be seen
as optimal responses to di¤erent circumstances faced by di¤erent �rms if the CEO�s ad the
�rm�s incentives are perfectly aligned (b = 1) or as consequences of di¤erences in the quality of
governance. We now make precise the conditions under which the �ndings can be reconciled
with either the perfect and the imperfect governance view. It is important to stress that
our data does not allow us to implement a formal test of the two models, but the rich set
of correlations we uncover allows us to be precise about the set of assumptions needed to
reconcile the �ndings with either view. We leave it to the reader to assess which is more
plausible.
In the perfect governance view, where the CEO�s ad the �rm�s incentives are perfectly
aligned, the observed correlations must be due to shocks that a¤ect the pattern of time
use, hours worked, �rm performance and �rm characteristics as follows. First, shocks that
increase the marginal return to CEO�s e¤ort- so that CEOs work longer hours, also increase
the marginal product of time with at least one insider and at the same time decrease the
marginal product of time alone with outsiders, especially so for time alone in one-to-one
meetings. Second, shocks that increase the �rm�s productivity, also increase the marginal
product of time with at least one insider and leave the marginal product of time alone with
outsiders constant. Third, this type of shocks are more likely to hit multinationals (especially
if foreign) and family �rms but only when the CEO does not belong to the family, whereas
symmetrically opposite shocks are more likely to hit family �rms headed by family CEOs.
In the imperfect governance view, the observed variation in time use can derives from
di¤erences in governance that determine the extent to which the CEOs�interests are aligned
with the �rm. If we take this view, then the observed correlations have the following impli-
16

cations for the relationship between time use and governance. First, that time spent with
insiders contributes to the �rm�s output while time spent alone with outsiders only bene�ts
the CEO. Second, that �rms with better governance hire CEOs who work longer hours and
devote more time to productive activities and less time to activities that bene�t them but not
the �rm. Third, that external CEOs hired by family �rms devote more time to productive
activities and less time to activities that bene�t them, while the opposite holds for CEOs who
belong to the family. This suggests that the incentives of external CEOs in family �rms are
better aligned than the incentives of CEOs in �rms that are widely held, which is consistent
with the view that family owners might have a comparative advantage in monitoring. The
�ndings however also suggest that incentive alignment is worst for family CEOs- the category
that spends most time with outsiders and least time with insiders. While these should have
a sizeable claim on the �rm�s pro�ts, the literature has suggested several reasons for why
family CEOs might want to pursue objectives -such as petty projects, or the amenity value
of control- that are at odds with pro�t maximization. The �nal implication is that CEOs
of multinational �rms- especially if foreign- adopt a more productive pattern of time use,
which is consistent with the fact that these �rms face global competition and therefore need
to provide steeper incentives to maintain their productivity advantage.
5 Conclusions
[To Do]
6 Appendix 1: Desired Time Allocation and Observed TimeAllocation
The points discussed in this section can be made in a much more general setting, but to �x
ideas suppose that there are two �rms (1 and 2) and two activities (a productive activity y
and a networking activity r). Assume that in both �rms the CEO spends the same time at
work (not a key assumption �but it allows us to use a binomial distribution rather than a
multinomial one). Hence, time allocation is fully described by the proportion of time spent
on the productive activity. Let�s de�ne
p =xy
xy + xr
and p1 represents the time allocation in �rm 1 while p2 represents the allocation in �rm 2.
However, we do not observe p1 and p2 directly, but just the diary of the CEO�s of the
two �rms for a certain amount of time. Suppose that each diary contains T time slots. For
17
each CEO j, we observe the number of slots, Kj , devoted to activity y (the other slots are
by de�nition used for activity r)
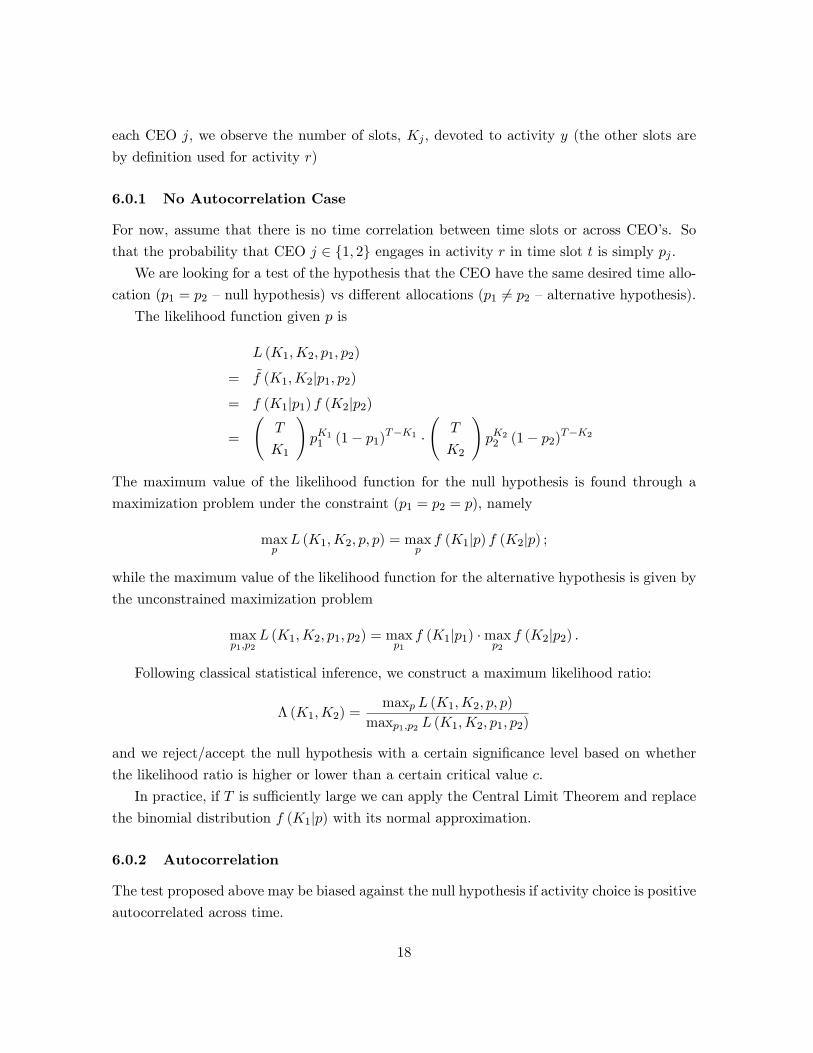
6.0.1 No Autocorrelation Case
For now, assume that there is no time correlation between time slots or across CEO�s. So
that the probability that CEO j 2 f1; 2g engages in activity r in time slot t is simply pj .We are looking for a test of the hypothesis that the CEO have the same desired time allo-
cation (p1 = p2 �null hypothesis) vs di¤erent allocations (p1 6= p2 �alternative hypothesis).The likelihood function given p is
L (K1;K2; p1; p2)
= ~f (K1;K2jp1; p2)= f (K1jp1) f (K2jp2)
=
T
K1
!pK11 (1� p1)T�K1 �
T
K2
!pK22 (1� p2)T�K2
The maximum value of the likelihood function for the null hypothesis is found through a
maximization problem under the constraint (p1 = p2 = p), namely
maxpL (K1;K2; p; p) = max
pf (K1jp) f (K2jp) ;
while the maximum value of the likelihood function for the alternative hypothesis is given by
the unconstrained maximization problem
maxp1;p2
L (K1;K2; p1; p2) = maxp1f (K1jp1) �max
p2f (K2jp2) :
Following classical statistical inference, we construct a maximum likelihood ratio:
� (K1;K2) =maxp L (K1;K2; p; p)
maxp1;p2 L (K1;K2; p1; p2)
and we reject/accept the null hypothesis with a certain signi�cance level based on whether
the likelihood ratio is higher or lower than a certain critical value c.
In practice, if T is su¢ ciently large we can apply the Central Limit Theorem and replace
the binomial distribution f (K1jp) with its normal approximation.
6.0.2 Autocorrelation
The test proposed above may be biased against the null hypothesis if activity choice is positive
autocorrelated across time.
18
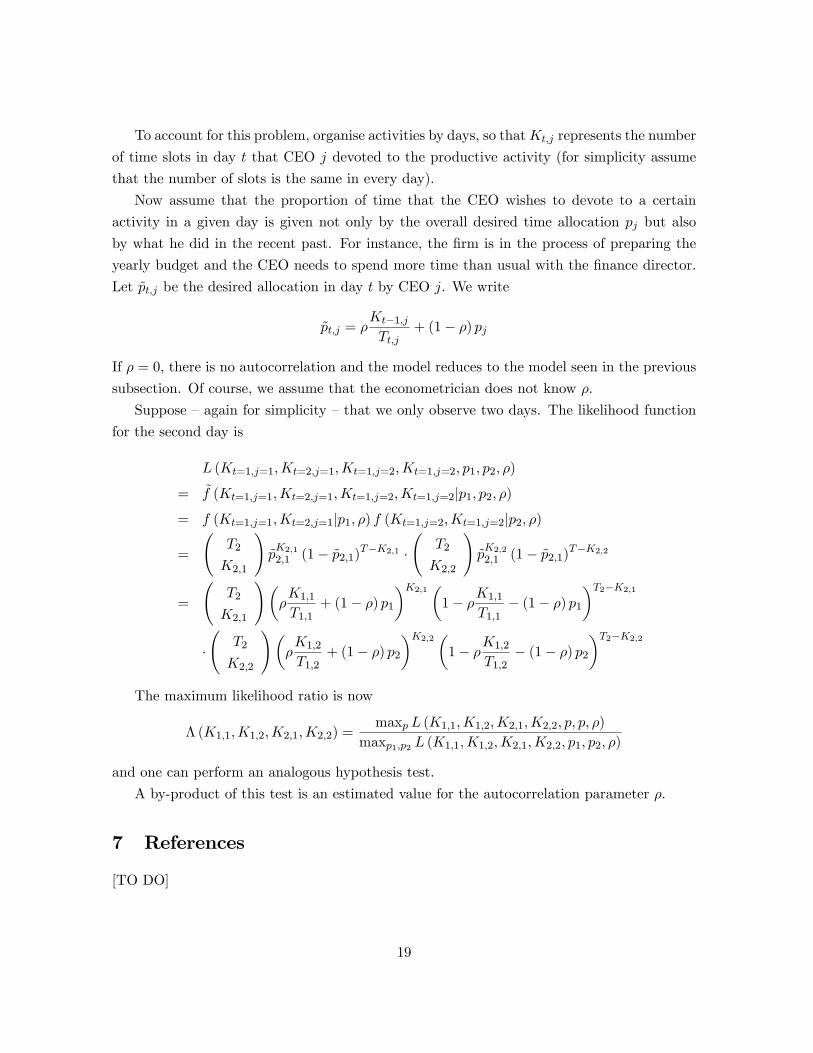
To account for this problem, organise activities by days, so thatKt;j represents the number
of time slots in day t that CEO j devoted to the productive activity (for simplicity assume
that the number of slots is the same in every day).
Now assume that the proportion of time that the CEO wishes to devote to a certain
activity in a given day is given not only by the overall desired time allocation pj but also
by what he did in the recent past. For instance, the �rm is in the process of preparing the
yearly budget and the CEO needs to spend more time than usual with the �nance director.
Let ~pt;j be the desired allocation in day t by CEO j. We write
~pt;j = �Kt�1;jTt;j
+ (1� �) pj
If � = 0, there is no autocorrelation and the model reduces to the model seen in the previous
subsection. Of course, we assume that the econometrician does not know �.
Suppose �again for simplicity �that we only observe two days. The likelihood function
for the second day is
L (Kt=1;j=1;Kt=2;j=1;Kt=1;j=2;Kt=1;j=2; p1; p2; �)
= ~f (Kt=1;j=1;Kt=2;j=1;Kt=1;j=2;Kt=1;j=2jp1; p2; �)= f (Kt=1;j=1;Kt=2;j=1jp1; �) f (Kt=1;j=2;Kt=1;j=2jp2; �)
=
T2
K2;1
!~pK2;1
2;1 (1� ~p2;1)T�K2;1 �
T2
K2;2
!~pK2;2
2;1 (1� ~p2;1)T�K2;2
=
T2
K2;1
!��K1;1T1;1
+ (1� �) p1�K2;1
�1� �K1;1
T1;1� (1� �) p1
�T2�K2;1
�
T2
K2;2
!��K1;2T1;2
+ (1� �) p2�K2;2
�1� �K1;2
T1;2� (1� �) p2
�T2�K2;2
The maximum likelihood ratio is now
� (K1;1;K1;2;K2;1;K2;2) =maxp L (K1;1;K1;2;K2;1;K2;2; p; p; �)
maxp1;p2 L (K1;1;K1;2;K2;1;K2;2; p1; p2; �)
and one can perform an analogous hypothesis test.
A by-product of this test is an estimated value for the autocorrelation parameter �.
7 References
[TO DO]
19
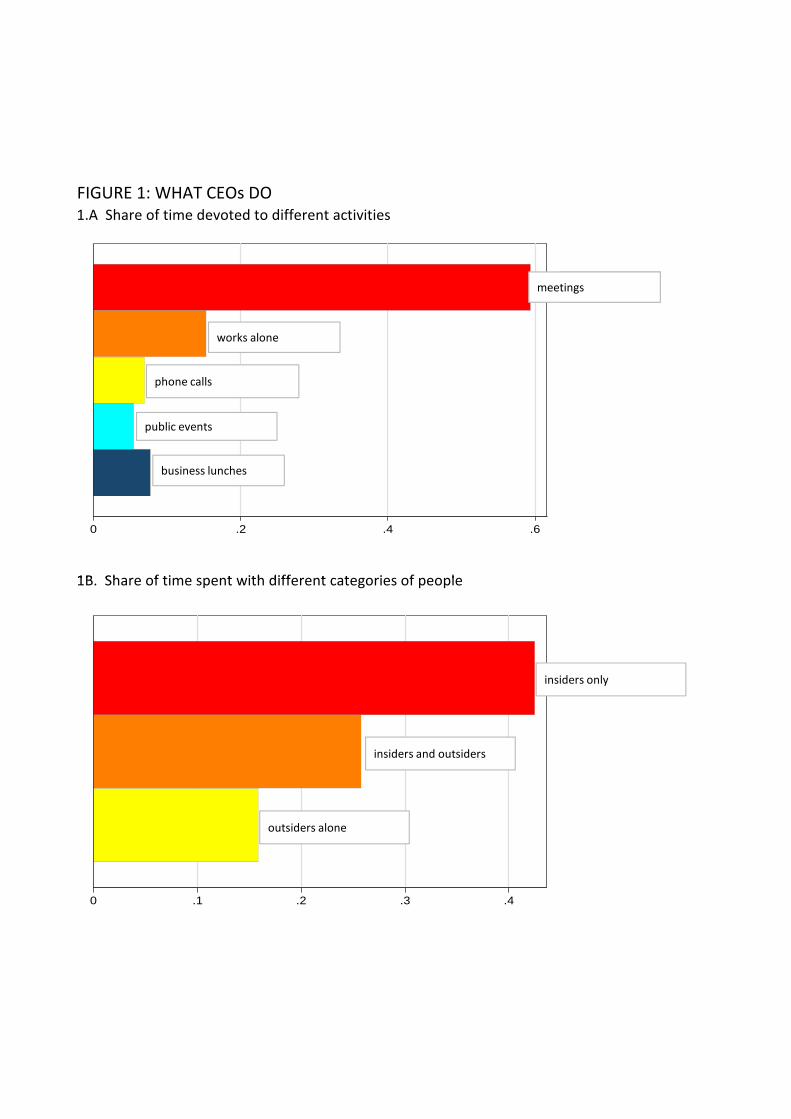
FIGURE 1: WHAT CEOs DO1.A Share of time devoted to different activities
1B Share of time spent with different categories of people
mean of sharetime_lunch
mean of sharetime_publicevent
mean of sharetime_phonecalls
mean of sharetime_workalone
mean of sharetime_meetings
0 .2 .4 .6
meetings
works alone
phone calls
public events
business lunches
1B. Share of time spent with different categories of people
mean of sharetime_lunch
mean of sharetime_publicevent
mean of sharetime_phonecalls
mean of sharetime_workalone
mean of sharetime_meetings
0 .2 .4 .6
meetings
works alone
phone calls
public events
business lunches
insiders and outsiders
insiders and outsidersmean of so
mean of sharetime_mix
mean of si
0 .1 .2 .3 .4
outsiders alone
insiders only
insiders and outsiders
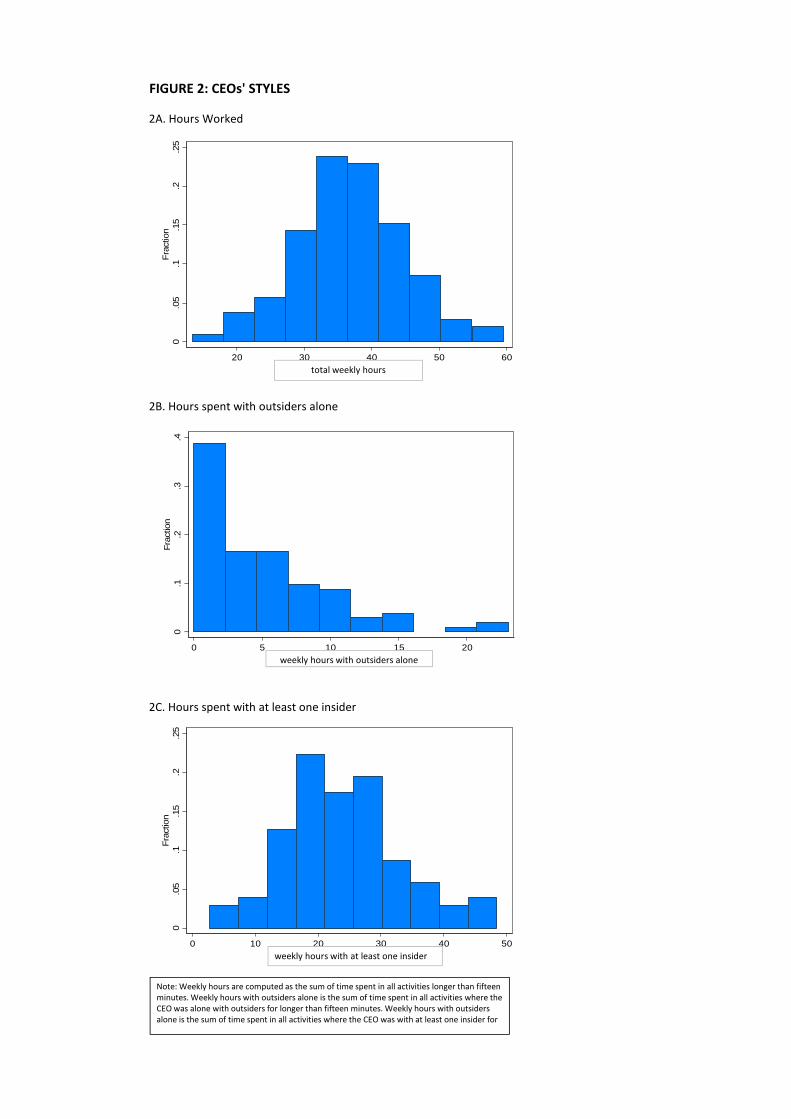
FIGURE 2: CEOs' STYLES
2A. Hours Worked
2B. Hours spent with outsiders alone
0.0
5.1
.15
.2.2
5Fr
actio
n
20 30 40 50 60weekly hrs all activities
1.2
.3.4
Frac
tion
total weekly hours
2C. Hours spent with at least one insider
0.0
5.1
.15
.2.2
5Fr
actio
n
20 30 40 50 60weekly hrs all activities
0.1
.2.3
.4Fr
actio
n
0 5 10 15 20weekly hrs spent in this activity
0.0
5.1
.15
.2.2
5Fr
actio
n
0 10 20 30 40 50weekly hrs spent in this activity
total weekly hours
weekly hours with outsiders alone
weekly hours with at least one insider
Note: Weekly hours are computed as the sum of time spent in all activities longer than fifteen minutes. Weekly hours with outsiders alone is the sum of time spent in all activities where the CEO was alone with outsiders for longer than fifteen minutes. Weekly hours with outsiders alone is the sum of time spent in all activities where the CEO was with at least one insider for
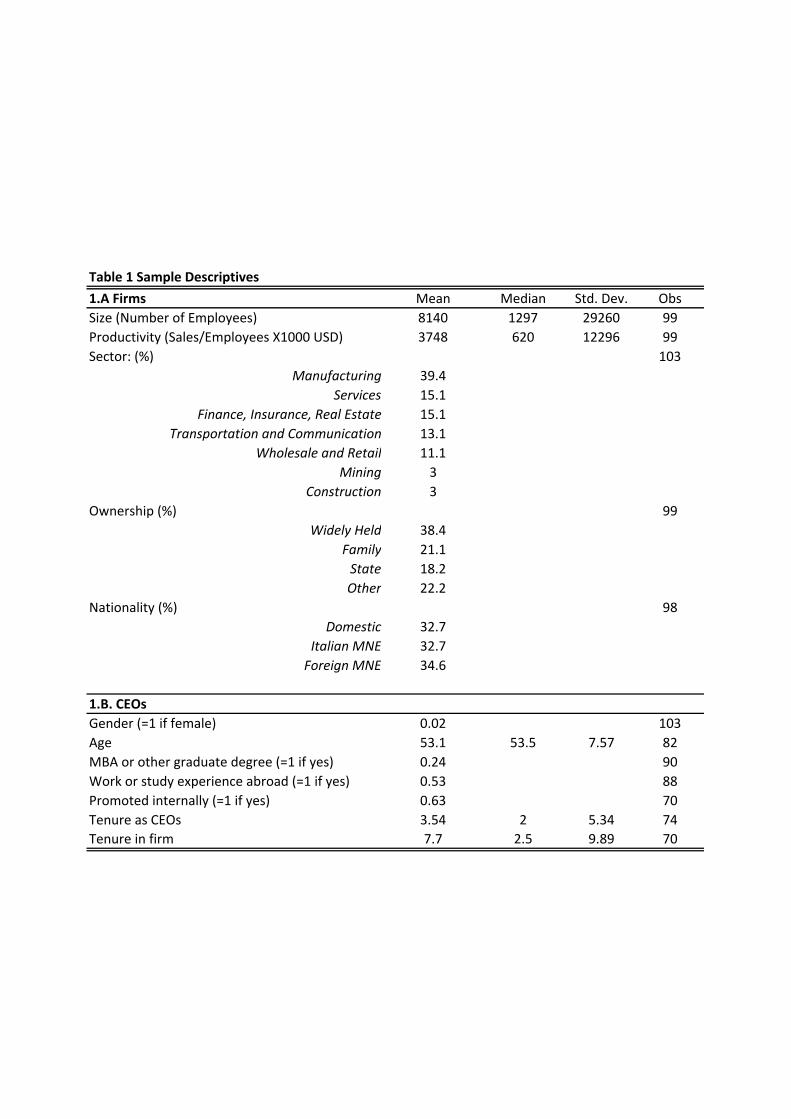
Table 1 Sample Descriptives
1.A Firms Mean Median Std. Dev. ObsSize (Number of Employees) 8140 1297 29260 99Productivity (Sales/Employees X1000 USD) 3748 620 12296 99Sector: (%) 103
Manufacturing 39.4Services 15.1
Finance, Insurance, Real Estate 15.1Transportation and Communication 13.1
Wholesale and Retail 11.1Mining 3
Construction 3Ownership (%) 99
Widely Held 38.4Family 21.1State 18.2Other 22.2
Nationality (%) 98Domestic 32.7
Italian MNE 32.7Foreign MNE 34.6
1.B. CEOsGender (=1 if female) 0.02 103Age 53.1 53.5 7.57 82MBA or other graduate degree (=1 if yes) 0.24 90Work or study experience abroad (=1 if yes) 0.53 88Promoted internally (=1 if yes) 0.63 70Tenure as CEOs 3.54 2 5.34 74Tenure in firm 7.7 2.5 9.89 70
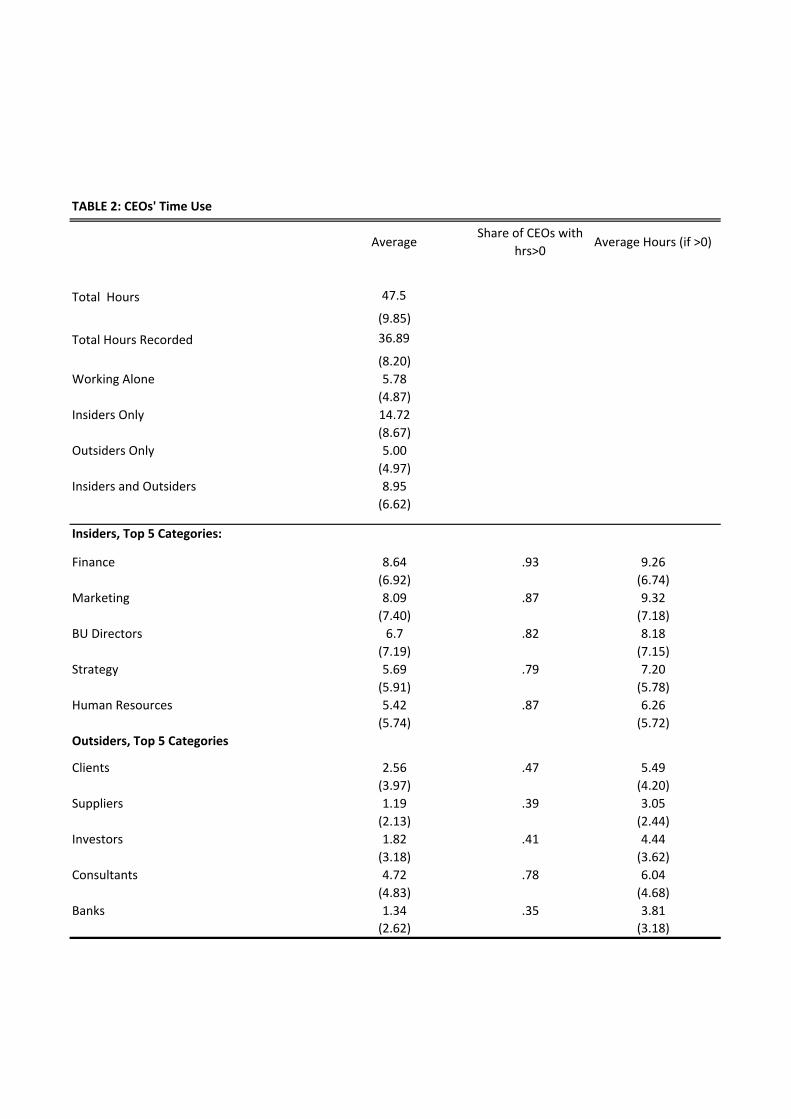
TABLE 2: CEOs' Time Use
AverageShare of CEOs with
hrs>0Average Hours (if >0)
Total Hours 47.5
(9.85)
Total Hours Recorded 36.89
(8.20)Working Alone 5.78
(4.87)Insiders Only 14.72
(8.67)Outsiders Only 5.00
(4.97)Insiders and Outsiders 8.95
(6.62)
Insiders, Top 5 Categories:
Finance 8.64 .93 9.26(6.92) (6.74)
Marketing 8.09 .87 9.32(7.40) (7.18)
BU Directors 6.7 .82 8.18(7.19) (7.15)
Strategy 5.69 .79 7.20(5.91) (5.78)
Human Resources 5.42 .87 6.26(5.74) (5.72)
Outsiders, Top 5 Categories
Clients 2.56 .47 5.49(3.97) (4.20)
Suppliers 1.19 .39 3.05(2.13) (2.44)
Investors 1.82 .41 4.44(3.18) (3.62)
Consultants 4.72 .78 6.04(4.83) (4.68)
Banks 1.34 .35 3.81(2.62) (3.18)
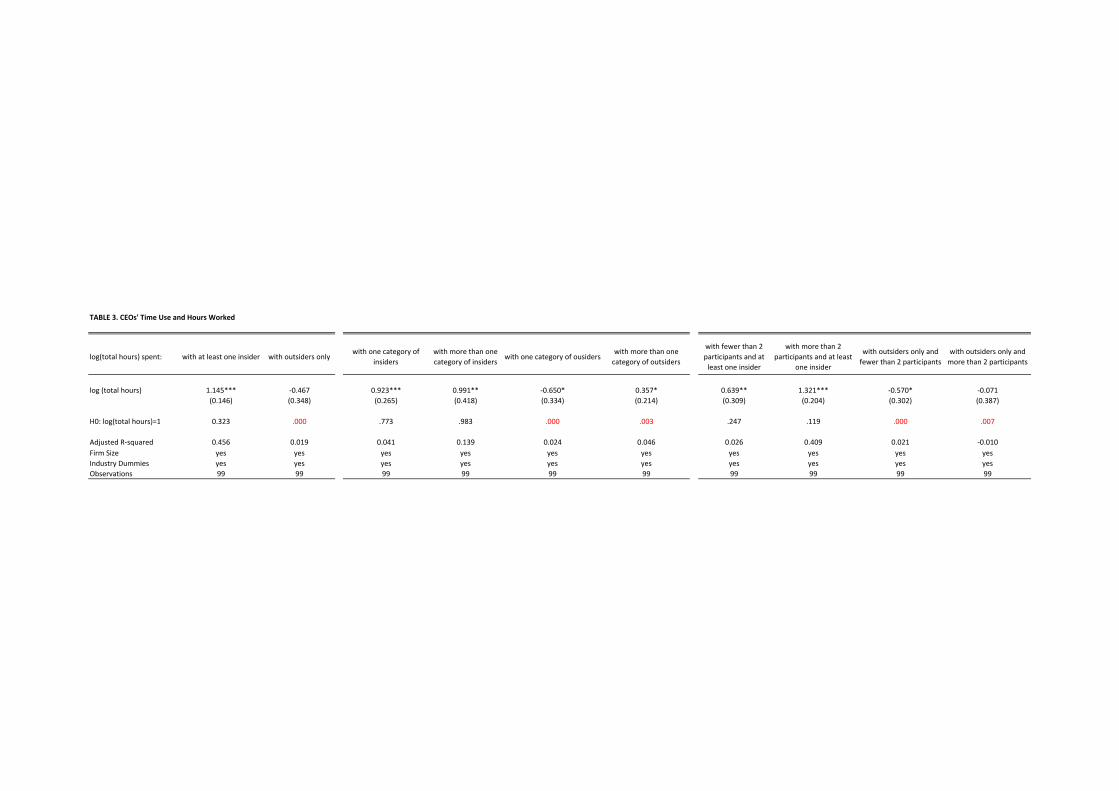
TABLE 3. CEOs' Time Use and Hours Worked
log(total hours) spent: with at least one insider with outsiders onlywith one category of
insiderswith more than one category of insiders
with one category of ousiderswith more than one category of outsiders
with fewer than 2 participants and at least one insider
with more than 2 participants and at least
one insider
with outsiders only and fewer than 2 participants
with outsiders only and more than 2 participants
log (total hours) 1.145*** ‐0.467 0.923*** 0.991** ‐0.650* 0.357* 0.639** 1.321*** ‐0.570* ‐0.071(0.146) (0.348) (0.265) (0.418) (0.334) (0.214) (0.309) (0.204) (0.302) (0.387)
H0: log(total hours)=1 0.323 .000 .773 .983 .000 .003 .247 .119 .000 .007
Adjusted R‐squared 0.456 0.019 0.041 0.139 0.024 0.046 0.026 0.409 0.021 ‐0.010Firm Size yes yes yes yes yes yes yes yes yes yesIndustry Dummies yes yes yes yes yes yes yes yes yes yesObservations 99 99 99 99 99 99 99 99 99 99

Table 4: CEOs' Time Use and Firm Performance
(1) (2) (3) (4) (5) (6) (7) (8)
dependent variable: Log(productivity) Log(productivity) Log(productivity) Log(productivity) Log(productivity) Profits/Employees Log(productivity) ROCE
Total hours 1.430**(0.577)
Total hours working alone 0.120 0.149 0.154 0.099 24.155 0.106 2.528(0.162) (0.160) (0.160) (0.182) (14.716) (0.144) (2.374)
Total hours with at least one insider 0.832** 0.879** 0.881** 78.384** 0.614** 9.770(0.368) (0.363) (0.356) (37.770) (0.269) (8.569)
Total hours with outsiders only 0.185 23.399 0.112 ‐0.306(0.221) (14.905) (0.119) (2.755)
Total hours with outsiders at HQ 0.153(0.238)
Total hours with outsiders outside 0.176(0.154)
Total hours with outsiders planned in advance 0.224 0.260(0.189) (0.196)
Total hours with outsiders unplanned ‐0.157 ‐0.251(0.286) (0.272)
Total hours with insiders planned in advance 0.578**(0.280)
Total hours with insiders unplanned 0.439*(0.240)
H0: hours with insiders=hours with outsiders .010 .008 .012 .078 .052 .262H0: hours with outsiders at HQ=hours with outsiders outside .919 .227H0: hours with insiders planned=hours with insiders unplanned .675H0: hours with outsiders planned=hours with outsiders unplanned .100Industry Dummies yes yes yes yes yes yes yes yesControls size size size size size size size, logk, log materials size Adjusted R‐squared 0.290 0.267 0.262 0.264 0.268 0.245 0.643 0.066Observations 99 99 99 99 99 98 81 88
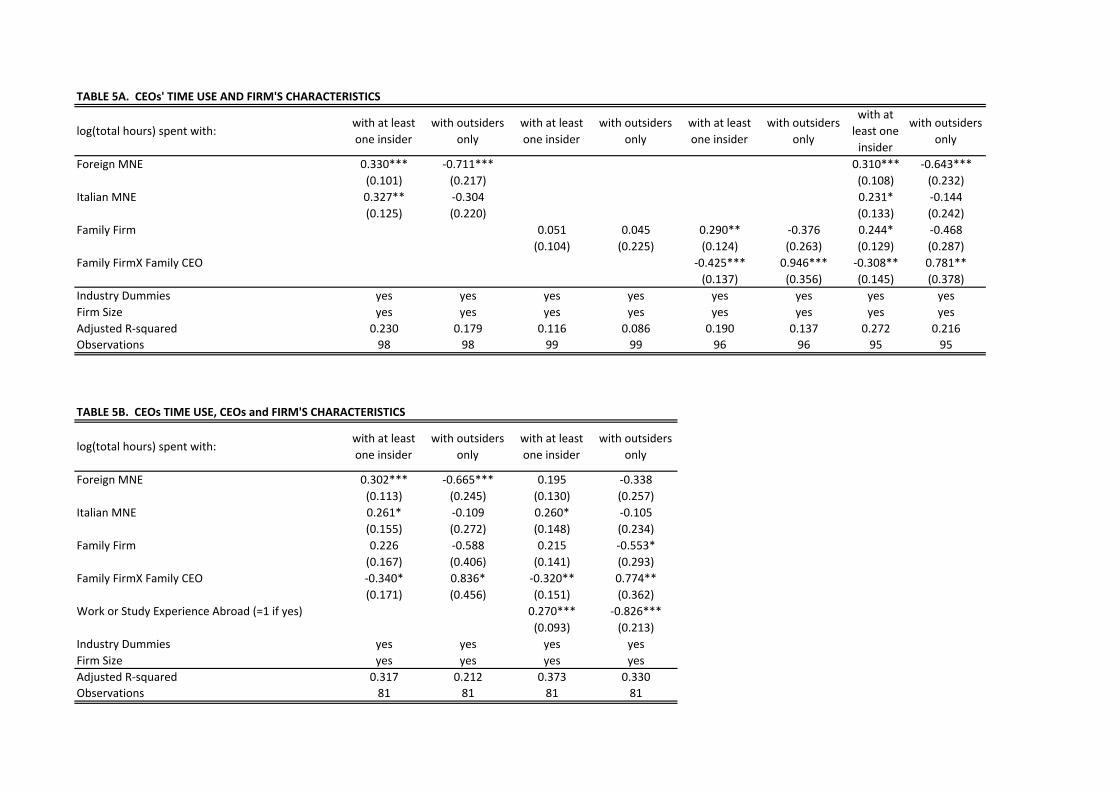
TABLE 5A. CEOs' TIME USE AND FIRM'S CHARACTERISTICS
log(total hours) spent with:with at least one insider
with outsiders only
with at least one insider
with outsiders only
with at least one insider
with outsiders only
with at least one insider
with outsiders only
Foreign MNE 0.330*** ‐0.711*** 0.310*** ‐0.643***(0.101) (0.217) (0.108) (0.232)
Italian MNE 0.327** ‐0.304 0.231* ‐0.144(0.125) (0.220) (0.133) (0.242)
Family Firm 0.051 0.045 0.290** ‐0.376 0.244* ‐0.468(0.104) (0.225) (0.124) (0.263) (0.129) (0.287)
Family FirmX Family CEO ‐0.425*** 0.946*** ‐0.308** 0.781**(0.137) (0.356) (0.145) (0.378)
Industry Dummies yes yes yes yes yes yes yes yesFirm Size yes yes yes yes yes yes yes yesAdjusted R‐squared 0.230 0.179 0.116 0.086 0.190 0.137 0.272 0.216Observations 98 98 99 99 96 96 95 95
TABLE 5B. CEOs TIME USE, CEOs and FIRM'S CHARACTERISTICS
log(total hours) spent with:with at least one insider
with outsiders only
with at least one insider
with outsiders only
Foreign MNE 0.302*** ‐0.665*** 0.195 ‐0.338(0.113) (0.245) (0.130) (0.257)
Italian MNE 0.261* ‐0.109 0.260* ‐0.105(0.155) (0.272) (0.148) (0.234)
Family Firm 0.226 ‐0.588 0.215 ‐0.553*(0.167) (0.406) (0.141) (0.293)
Family FirmX Family CEO ‐0.340* 0.836* ‐0.320** 0.774**(0.171) (0.456) (0.151) (0.362)
Work or Study Experience Abroad (=1 if yes) 0.270*** ‐0.826***(0.093) (0.213)
Industry Dummies yes yes yes yesFirm Size yes yes yes yesAdjusted R‐squared 0.317 0.212 0.373 0.330Observations 81 81 81 81

TABLE A1. CEOs' Time Use and CEOs' Characteristics
log(total hours) spent with:with at least one insider
with outsiders
only
with at least one insider
with outsiders
only
with at least one insider
with outsiders
only
with at least one insider
with outsiders
only
with at least one insider
with outsiders
only
with at least one insider
with outsiders
only
with at least one insider
with outsiders
only
MBA or other graduate education (=1 if yes) 0.175* ‐0.197 0.117 0.058(0.095) (0.246) (0.105) (0.320)
Work or Study Experience Abroad (=1 if yes) 0.332*** ‐0.950*** 0.258** ‐0.773***(0.074) (0.188) (0.108) (0.268)
Internally promoted (=1 if yes) 0.028 ‐0.385 ‐0.092 0.252(0.101) (0.236) (0.218) (0.501)
Tenure as CEO ‐0.002 0.050 0.050 0.071(0.051) (0.145) (0.044) (0.140)
Tenure in other jobs, same firm 0.014 ‐0.173* 0.034 ‐0.176(0.035) (0.094) (0.079) (0.185)
Age ‐0.654* 0.384 ‐0.599 0.595(0.380) (0.803) (0.395) (0.950)
Industry Dummies yes yes yes yes yes yes yes yes yes yes yes yes yes yesFirm Size yes yes yes yes yes yes yes yes yes yes yes yes yes yesR‐squared 0.194 0.087 0.283 0.277 0.255 0.127 0.170 0.073 0.255 0.145 0.183 0.066 0.415 0.255Observations 86 86 84 84 68 68 71 71 68 68 79 79 62 62