WHAT DETERMINES U.S. RETAIL MARGINS? David GAUTSCHI...
51
"WHAT DETERMINES U.S. RETAIL MARGINS?" by David GAUTSCHI* and Roger BETANCOURT** N° 90/31/MKT/EP Associate Professor of Marketing, INSEAD, Boulevard de Constance, Fontainebleau 77305 Cedex, France Department of Economics, University of Maryland, College Park, MD 20742 U.S.A. Printed at INSEAD, Fontainebleau, France
-
Upload
truongcong -
Category
Documents
-
view
219 -
download
0
Transcript of WHAT DETERMINES U.S. RETAIL MARGINS? David GAUTSCHI...

"WHAT DETERMINES U.S. RETAILMARGINS?"
by
David GAUTSCHI*and
Roger BETANCOURT**
N° 90/31/MKT/EP
Associate Professor of Marketing, INSEAD, Boulevard deConstance, Fontainebleau 77305 Cedex, France
Department of Economics, University of Maryland, College Park,MD 20742 U.S.A.
Printed at INSEAD,Fontainebleau, France

WHAT DETERMINES U.S. RETAIL MARGINS?
by
Roger R. BetancourtDepartment of EconomicsUniversity of MarylandCollege Park, MD 20742U.S.A.
David A. GautschiDepartment of MarketingINSEAD77305 Fontainebleau, CedexFrance
February 1990
*We would like to thank Haiying Zhao and Pamela McNeill for excellentresearch assistance in the construction of the data set and in thestatistical analysis of the results, respectively. This paper was writtenwhile the first mentioned author was visiting INSEAD on sabbatical from theUniversity of Maryland. A grant from PRISM s.a.r.l. was instrumental inallowing the development of the project and is gratefully acknowledged. Anearly version of the paper was presented at the Maryland I0 Workshop and wethank the participants for their comments.

Abstract
Title: What Determines U.S. Retail Margins?
Authors: Roger Betancourt and David Gautschi
Affiliations: Department of Economics
Department of MarketingUniversity of Maryland
INSEADCollege Park, MD 20742
77305 Fontainebleau, CedexU.S.A. France
In this paper we develop an economic framework for the empirical
analysis of retail margins. This framework departs from the definition of
profits and incorporates recent theoretical developments formalizing the role
of distribution services in retail activities. Alternative approaches, based
on a mark-up model and on a hedonic equation, are also considered. The data
base is information on 49 retail sectors from the 1982 U.S. Census of Retail
Trades. The results reject the hedonic approach and part of the previous
specification of the mark-up model. They provide some support for the
hypothesis of monopolistic competition as the relevant market structure in
the retail sector and substantial evidence for the hypothesis that
distribution services are the main determinants of retail margins.
JEL 610, 633

What Determines U.S. Retail Margins?
Surprisingly enough, there is a paucity of studies seeking to explain
retail margins. What makes this scarcity remarkable is the abundance of
studies seeking to explain profit margins, e.g., Schmalensee (1988), as well
as the existence of publicly available data on retail margins, e.g., Census
data in the U.S. One reason for this situation is the lack of interest by
economists in the analysis of general retail issues, as noted by Bliss (1988)
for example. Another reason is that models analyzing specific retail issues
are, of course, narrowly focused. This is true of those contributions that
stress the role of uncertainty, for example Pashigian (1988) and the
references cited therein, as well as those of contributions that adopt a full
information approach, e.g., Hess and Gerstner (1987) and the references cited
therein. Consequently, there is no generally accepted economic framework in
which to embed the empirical analysis of retail margins. One contribution of
this paper is the provision of such a framework.
Our approach to the analysis of retail margins starts with the
definition of profits, which allows one to obtain an identity equating the
retail margin to the sum of the ratio of profits to sales and the ratio of
the costs of retailing to sales. The first term in the sum provides a link
to the previously mentioned literature on profit margins; the second term in
the sum provides a link to recently developed literature formalizing the role
of distribution services in retail activities, which is discussed below. The
specification of the effect of distribution services on the second term,
i.e., on cost and demand, is a novel component of our approach at the
conceptual level. More generally, we have a framework that can be grounded
on economic theory and is suitable for the empirical analysis of retail
margins.
1

Retail firms provide consumers with a variety of distribution services,
such as accessibility of location, product assortment, assurance of product
delivery at the desired time and in the desired form, information and
ambiance, Betancourt and Gautschi (1988). Higher levels of these services
cost the firms more but reduce costs for their customers; these distribution
services are not priced separately from the products purchased.
Incorporation of these two characteristics into the analysis of retail
markets generates new results on the nature of pricing policies and
competitive behavior, Betancourt and Gautschi (1989). Broadly speaking,
these distribution services are an important source of product
differentiation in retail markets. Indeed, their analysis is very much in
the spirit of Chamberlin's seminal work (1962) on monopolistic competition.
In this context one of the main contributions of this paper lies in its being
the first systematic effort at measurement, specification and analysis of the
empirical role that these distribution services play in retail activities;
hence, the paper operationalizes a major aspect of product differentiation in
what are traditionally regarded as monopolistically, competitive markets.
Five broad categories of distribution services were mentioned above.
Each of these categories can have several dimensions. Some of these
services, or aspects of them, are provided for all items in an assortment
(thus we label them "common"); some of these services are provided for
selected items in an assortment (thus we label them "specific").
Undoubtedly, it is difficult if not impossible to capture all the dimensions
of these concepts in our empirical measurements; nevertheless, we have
developed a data base containing empirical counterparts to these concepts
that is comparable to what exists for other purposes at a similar level of
2

aggregation (the three digit level of the SIC code). Our data source is the
Industry Series Reports from the 1982 U.S. Census of Retail Trade.
The small body of literature on the empirical explanation of variations
in retail margins across various sectors is based on a mark-up model put
forth by Nooteboom (1985) together with several collaborators, Nooteboom,
Kleijweg and Thurik (1988). Nooteboom (1985) has an illuminating discussion
of several distribution services, in our terminology, but goes on to offer
the criticism that "economic theory does not yield much that can be readily
used for empirical analysis." The analysis of the role of distribution
services on the demand for retail products, Betancourt and Gautschi (1990a,
1990b), together with the previously cited work on distribution services cast
doubts on the validity of this statement at the theoretical level. One aim
of this paper is to show in an empirical setting that this criticism is no
longer warranted.
Assuming that there is only a single product, one can derive a direct
relationship between the retail margin and the retail price. Hence, it is
tempting to adopt a hedonic specification for the retail margin by analogy to
the hedonic approach to price, which has become well established in economics
since Rosen's classic paper (1974). Based on this logic, one could also
appeal to recent explanations of price dispersion in retail markets, e.g.,
Borenstein (1989) and Shepard (1989), as explanations of variations in retail
margins in a hedonic framework. We shall present some empirical evidence on
the hedonic approach, but we should add in anticipation of our results that
this approach is rejected by the data.
Among the main substantive findings of our empirical analysis are the
following: the mark-up model generates results in the U.S. data that are
substantially different from those in earlier work; monopolistic competition
3

is a more suitable market structure for the analysis of retail markets than
any alternatives which entail differing degrees of monopoly power across
retail sectors; distribution services are critical determinants of variations
in retail margins across U.S. retail sectors. More specifically, higher
levels of assortment, assurance of product delivery and specific distribution
services depress margins whereas higher levels of information increase
margins. The former results imply that demand effects dominate supply
effects and the latter result implies the opposite.
Prior to delving into our analysis, brief mention should be made of its
relation to Pashigian's (1988) work explaining markdowns. Besides extending
Lazear's theory of clearance sales (1986), he shows that an increase in the
demand for fashion or variety increases uncertainty which in turn generates
increased markons, markdowns and percentage of goods sold on sale. An
increase in the demand for fashion is characterized in our framework as an
increase in one of the distribution services elasticities of demand, namely
the one for assurance of product delivery in the desired form. This change
leads to an increase in the percentage markons or retail margins as well as
to an increase in the level of fashion provided to customers (this follows
from Proposition 2 in Betancourt and Gautschi (1989)). Since other
distribution services are also included in this analysis, these services and
any exogenous factors which affect them on either the demand or the cost side
have a natural vehicle to affect retail margins. This property is desirable
if not indispensable to explain variations in retail margins across broad
categories of retail sectors such as we find in our data. Thus, our approach
is consistent with Pashigian's results and it accommodates explanatory
factors other than changes in uncertainty.
4

The plan of the paper is as follows: the next section discusses the
conceptual framework underlying the empirical analysis; issues related to
empirical implementation are discussed in Section II, although the details of
the data construction are relegated to an appendix; the two alternative
frameworks discussed above, i.e., the mark-up model and the hedonic approach,
and the corresponding estimates are presented in Section III; the results of
our approach are presented in Section IV; finally, a conclusion provides some
perspectives on our findings.
I. Conceptual Framework
Consider the following definition of the retail margin (R), which
follows from manipulating the definition of profits (101
w/p*X/ + C(X ;V)/p*X ,1
–X.j 1
where p* can be interpreted as a vector of retail prices or as a single
retail price. Similarly, X1 can be interpreted as a vector of quantities of
items sold at retail or as the quantity of a single (presumably composite)
item. X. is a vector of the levels of distribution services, V is a vector–J
of input prices, and C is a standard neoclassical cost function.
The ratio of profits to sales in (1) provides a simple straightforward
link to the voluminous literature on the empirical analysis of profit
margins. An excellent guide through the main issues is Waterson (1984, ch.
10) who argues that the essence of the literature is captured by the first
term in the following specification:
x/p*X1 – g(c,b,O) + e , (2)
1That is, x p*X1 - pX
1 - C(X ,X ;v), where p represents suppliers prices.
1 –j
(1)
5

where c stands for concentration, b stands for barriers to entry, 8 is the
elasticity of demand, and e is a disturbance term. Subsequently, Mueller
(1986, ch. 4) reconciles the inconsistency between the traditional practice
of defining the ratio of profits to sales as including the ratio of fixed
costs to sales and introducing barriers to entry in (2) by redefining the
left hand side as a long-run profit margin and arguing that barriers affect
it through 8; hence, (2) becomes
ajp*X1k(c,0(b)) + C . (2)'
We shall simply borrow the approach to the profit margin embedded in
(2)'. Furthermore, since this approach is consistent with a variety of
market structures, by placing (2)' in the context provided by the
conceptualization in (1) we find a convenient means for testing the often
made assertion that retailing is the typical example of a monopolistically
competitive market structure. For, in this case the profit margin would be
expected to be zero in long-run equilibrium and (2)' becomes w/p *X1 – e
Thus, if the variables expected to affect the profit margin are not
'statistically significant' determinants of retail margins the evidence is
consistent with the assertion; 2 otherwise, this assertion is inconsistent
with the evidence.
Specification of the second ratio in (1) provides a straightforward link
to the role of distribution services in the determination of retail margins.
In our research (1988, 1989) we have shown how the shifting of costs between
consumers and retailers is captured on the supply side by specifying a cost
function such that distribution services play the same role as the outputs of
2This evidence would also be consistent with the assertion that theprofit margin, and consequently the degree of monopoly power, is the same inevery retail sector.
6

a retail firm. A relevant implication for the empirical analyses is that the
cost function will be increasing in xv gi . Similarly, we have shown how on
the demand side this shifting is captured when the distribution services of
the retailer play the role of a fixed input in a household production model
of the consumer (1990a, 1990b). This model has the property that the inverse
demand function for retail items can be written as p* p* (X X.;r), where r
l'j
is a vector of other variables that affect the household's demand function;
and, similarly, the standard demand function for retail items can be written
as X – X.(p* X.;r). Important implications of these specification are:1 –j
2p*/3X.>0 and 3X /ax. > 0 as well as the usual ap*/ax1 < 0 and ax
1/4* < 0.
1
Whether one assumes quantity setting behavior (the inverse demand
specification) or price setting behavior (the standard demand specification),
the second term in (1) can be specified as follows
C(X1,X.;V)/p*X1 f(X1 ,Zi ;V,r) + p , (3)
where p is a disturbance term. If one is interested in interpretation of the
effects of these variables on the retail margin from a theoretical point of
view, one finds that under price setting behavior, for example, distribution
services have the following effect
aR/axj — [(cj + C1 (3)(1/3Xj ))p*X1 - Cp* (3X1/3Xj )]/(p*X1 ) 2 fj(4a)
SinceMigyispositive,f.is of ambiguous sign. Similarly, we have
for the quantity of retail items under price setting behavior
aR/axi (C IF*Xi - Cp*)/(p*X1)2 – fl
' (4b)
which is also ambiguous. Quantity setting behavior generates different
expressions but the same conclusions: namely, the ambiguous sign for the
7

effect of quantity of retail items and distribution-services on the retail
margin as well as the highly nonlinear nature of the function f.
To conclude this discussion, the incorporation of (2)' and (3) into
equation (1) leads to
R – klc,8(b)] + f(X X.;r,V) + e* ,l'j
where e* – e + p and it will be assumed to have the usual properties. We
shall refer to this specification as the hybrid specification for reasons
that will become clear below.
In drawing the implications of (1) and of our theoretical modelling of
the role of distribution services for the analysis of retail margins, one
could abandon the additive specification of profit margins and cost and
demand interactions under either quantity setting or price setting behavior
in favor of the following alternative. To illustrate assume quantity setting
behavior, then (1) can be redefined as
R [r(b,c) + C(X1 ,Xj ;V)Vp* (X1 ,Xj ;r) X1 , (5)
which can be specified for empirical purposes as
R F(b,c,X X.;V,r) + p* ,l'–j
where p* is a disturbance term with the usual properties. That is, our
analysis of distribution services can be interpreted as implying that the
effects of concentration and barriers to entry on retail margins depend on
the levels of distribution services. A similar result holds under price
setting behavior. We shall refer to this specification as the full
specification.
(1)'
(5) '
8

II. Empirical Implementation
While economic theory does not normally provide much guidance in the
specification of functional form, in this instance some features of the
conceptual framework suggest characteristics of the functional form. In
particular, equations (4a) and (4b) suggest that the functional form should
be general enough to allow the response of the retail margin to retail output
and distribution services to be a function of these same variables. Thus, an
additive specification of the second term in (1)' is unacceptable on a priori
grounds. A similar argument holds for all of the variables in (5)'.
Among the several nonlinear functional forms that allow one to
incorporate this feature of the theory into the empirical analysis, we
selected a logistic functional form for two reasons: parsimony and
tractability. With respect to parsimony, consider one of the most frequently
used alternative nonlinear forms--a quadratic in the variables or in the
logarithms of the variables. This alternative would require the estimation
of at least 35 (29 for the logarithmic version) parameters in order to
capture the behavior implied by (4a) and (4b). 3 With respect to
tractability, consider another of the frequently used nonlinear forms--a CES
type of power function. This alternative requires that the values of the
element being raised to a power be positive. Since the slopes in (4a) and
(4b) can be either positive or negative, the positivity restriction on the
argument of the power function must be imposed by constraining some
parameters for different range of values of the variables. No general
estimation techniques with this property are available.
3These numbers are based on our identification in the data of one outputvariable, five variables representing common distribution services and onevariable representing specific distribution services as well as one variablerepresenting concentration and another barriers to entry.
9

Consider now the logistic specification of the systematic component on
the right hand side of (4), i.e.,
f(X ,X ;r,V) – efl X/(1 + eO'X
) ,1 –j
where X – [X1 . X ] and A is a 1x7 vector of parameters that determines the
sign of the response of the retail margin to output (01 ), common distribution
services (#2 - 06 ), and specific distribution services (S 7). This form
allows us to capture the intrinsic nonlinearity implied by (4a) and (4b) with
a minimum of 7 parameters. Furthermore, it can be estimated by relatively
straightforward nonlinear techniques. Finally, the range of values generated
by the right hand side of (6) lies in the zero to one interval, thus
coinciding with the feasible range of values of the retail margin.4
Regarding the specification of the determinants of the profit margin, we
follow the literature by adopting a polynomial specification. More
precisely, the following quadratic specification of the systematic component
on the right hand side of (2)' will be employed, i.e.,
/V N 2n tv N2k(c,0(b)) #8X8 + fi_X_ B
9 9 '10X8X9 19 1.1 \ 8 /P12‘-91 '
where X8 is concentration (c) and X
9 is barriers to entry (b).
Insertion of (6) and (7) into (1)' leads to one of the two principal
estimating equations underlying our empirical work. Due to its additive
nature, the results corresponding to it are the ones reported under the
rubric of hybrid specification; this equation ties up most neatly our
4lncidentally, the specification in (6) brings out two of theassumptions being made in the empirical work. These assumptions are oftenmade in implicit fashion. It is being assumed that the other variablesaffecting the demand function (r) take on the same value across observationsor are uncorrelated with the included ones; it is also being assumed that theinput prices facing the retail sectors (V) have a similar property.
(6)
(7)
10

emphasis on distribution services with the existing literature on profit
margins. We present the results corresponding to the other principal
estimating equation under the rubric of the full (logistic) specification.
It is obtained by allowing F in (5)' to take on the logistic form as follows
R – eP'X /(1 + X) + p* , (8)
where X – [X1 ,Xj ,X8 ,X9 ] and # is a conformable 1x12 vector of parameters.5
Our data source is the 1982 U.S. Census of Retail Trades: more
specifically, the three Industry Series Reports (RC82 I-1, 1-2, I-3). 6 These
reports provide a wide variety of information for 49 retail sectors
classified at the three digit level of the SIC code and in some instances (14
out of 49) at the four digit level. To preserve continuity in the
exposition, the exact definition of the variables is presented in the Data
Appendix. Here, we discuss controversial measurement issues and the
procedures followed to resolve the controversies.
One issue that arises immediately is whether retail markets are local or
national. If these markets were national then the Census figures for all
variables measured in value terms, concentration ratios and accessibility of
location measured in terms of the number of establishments are accurately
defined or as close as one can get in empirical work. If, as it is likely to
be the case, retail markets are local, value figures deflated by the number
of establishments provide a more accurate measure of the relevant value
variables, concentration ratios are inaccurate measures of concentration,
5The variables determining profits in the full specification wereintroduced as in (7) prior to the logistic transformation.
6We are especially grateful to Mr. Howard Hamilton who provided aspecial tabulation with the information on the second of these three reportsat a lower level of aggregation than what existed in the published series.
11

Metcalf (1968), and the number of establishments measures accessibility of
location as well as the number of markets in a retail sector. Our procedure
was to estimate two versions of the model: one with the variables measured
in value terms specified on a per establishment basis (version I); the other
with these variables specified in absolute terms (version II). With respect
to the concentration ratio, the inaccuracy problem means that the indexes
underestimate the real degree of concentration in each sector. In those
sectors where there are many local markets the degree of underestimation is
greater than in those sectors where there are few local markets. Since this
increases the range of variation of the independent variable, it should
increase its statistical significance which should be kept in mind when
interpreting the results. With respect to accessibility of location, we
simply note the ambiguity of interpretation associated with the measured
variable, number of establishments, in version I.
Since we were able to develop two alternative measures of product
assortment, a quantity based one identified as X 3i (A) and a value based one
identified as X3i
(B) (see the Data Appendix), these two measures provide
variant 1 and 2 of the model, respectively. The next measurement issue is
more troublesome, namely the choice of an appropriate measure of output (X1)
for a retail sector. Sales or sales per establishment X1 (A) is an obvious
candidate, but the definition of the retail margin is also in terms of sales
and, thus, the existence of either a simultaneity bias or an error in the
variables problem or both becomes almost unavoidable with sales on both sides
of the equation. Our procedure was to use the value of building rentals or
the value of building rentals per establishment X 1 (B) as a proxy for output.
We also estimated all models both ways. The measurement of the remaining
12

variables raises no controversial issues and its description is, thus, left
to the Data Appendix.
The estimation method employed is nonlinear least squares. This choice
was based on several considerations. First, the method was well documented
and supported in the SAS package available at INSEAD where all the
calculations were performed. Secondly, the asymptotic properties of the
estimator are well established, as demonstrated by Amemiya's (1985, ch. 4)
discussion of the estimator in the context of extremum estimators. Finally,
the Monte Carlo experiments undertaken by Gallant (1975a,b) relied on a model
specification similar to one of our two main ones. It consisted of a first
degree polynomial added to an exponential. The experiments allow one to
ascertain the accuracy of employing testing procedures in the nonlinear case
that were similar to those valid for the linear one. Therefore, Gallant's
results can be used confidently to guide our choice of testing procedures.
For example, our joint tests of hypotheses will be carried out by using
ratios of differences in residual sums of squares to residual sums of squares
instead of ratios of explained sum of squares to residual sums of squares,
i.e., by applying equation 4.3 in Amemiya (1985). The rationale is that
tests based on the former statistic were found by Gallant (1975b) to have
higher power than those based on the latter statistic in the context of a
model similar to ours.
III. Alternative Frameworks
Before presenting the results based on the definition of profits, it is
convenient to discuss the results for the two alternative frameworks
mentioned in the introduction. It is fitting to begin our discussion with
the mark-up model, for it has provided the basic framework for empirical
analysis of retail margins with aggregate data. Since we are merely
13

duplicating Nooteboom, et al. (1988), it is useful to be explicit and
precise. The following estimating equation is put forth by them:
pit – alkit + a2/qit + a3eit + a4 Nit+ a
5Cit + uit • (9)
pit
is defined as the gross margin or R in our notation. kit
is defined as
operating costs (excluding a reward for the shopkeeper's labor) as a
percentage of sales. It will be defined as operating expenses divided by
sales in our data and its coefficient will correspond to a1 in terms of Table
1. qit is defined as average sales size per shop; hence, this variable
becomes number of establishments divided by sales in our data and its
coefficient corresponds to a 2 in terms of Table 1. e it is defined as the
income elasticity of demand for the product-service package but the average
value of inventory as a percentage of sales is used instead by the authors,
because of measurement difficulties. We will use the average value of
inventory divided by sales as well and its coefficient corresponds to a4 in
terms of Table 1. The last two variables in (9) are changes in market share
and in volume of demand over time and they are identically zero in our data,
because of its cross-section nature.?
In contrast to the results reported by Nooteboom, et al. (1988), neither
average sales size per shop nor the product-service package as defined in
their model play any role as determinants of retail margins. Two aspects of
the mark-up model are consistent with our data. First, the coefficient of
the ratio of operating expenses to sales has a high t-ratio. Second, the
null hypothesis that this coefficient is unity cannot be rejected by the data
even at the 10 percent level of significance. In interpreting these results
7Nooteboom, et al. (1988), use a combined cross-section time series dataset with sixteen retail sectors and eight years of observations for eachsector.
14

mention should also be made of the fact that sales is in the denominator of
all the variables in the equation, dependent as well as independent. Hence,
the simultaneity bias or error in the variables problem discussed earlier
also arises here. Of course, since the variable appears in the same form on
both sides of the equation, in this case, one expects a strong positive
association as a result of this problem.
The regression reported under the label of scaling arises from the
following reasoning. Suppose that there is no simultaneity bias due to sales
and suppose that sales is measured without error, i.e., the source of all
TABLE 1
Hedonic and Mark-Up Specifications"
R2 F .6 a1
0,23aa4 5 6
a7 a8
CZ9
Linear1.1 (Xl(B)) .38 2.65 .44* 7.13 .0000000 -.02* -.41 5.78* 1.19 -1.13 .002 -.94
(.04) (4.48) (.0000004) (.01) (.35) (2.56) (.90) (.77) (.002) (.49)
1.1 (Ki(A)) .52 4.73 1.43* -.32* .0000002 -.02* .21 1.56 -1.06 3.13* .002 -.72*(.04) (.08) (.0000004) (.01) (.32) (2.56) (.92) (1.26) (.002) (.35)
Semi-Log1.1 (A1(B)) .58 6.02 .69* .03 .003 -.06* -.09* .12* .07 -.14* .02 -.004
(.22) (.03) (.016) (.03) (.02) (.03) (.04) (.06) (.02) (.04)
1.1 (X1(10) .85 25.54 .88* -.28* .003 -.01 -.018 .02 .03 .23* .00 -.01(.11) (.03) (.009) (.02) (.014) (.02) (.02) (.05) (.01) (.02)
Mark-Up .92 176.38 .03 1.01* .001 .02(.02) (.06) (.004) (.06)
Scaling .92 47.65 .06* 4.86 .017* -.003 -.13 3.02* .37 1.42* .001 -.03(.02)(24.76) (.006) (.003) (.07) (.63) (.21) (.21) (.001) (.03)
'Standard errors in parentheses below the coefficient estimates.
*t-ratio greater than or equal to 2.
15

randomness in the dependent variable is cost of goods sold (CG), then one may
want to scale by sales in a relationship explaining variations in cost of
goods sold. After deflation by sales, the dependent variable is CG/X(A) –
1 - R, and one can fit either R or CG/X(A). For comparability, we fitted R
using as explanatory variables the reciprocal of sales 1/X (A), accessibility1
of location X2/X1 (A), product assortment X 3 (A), assurance of product delivery
X4/X2 (A), information X5/X1 (A), ambiance X8/X1(A), specific distribution
services X7/X
1(A), concentration ratio X
8 and our measure of barriers to
entry X9 . Since three of the variables are measured as ratios, i.e., X 3 , X8,
X9, they are not affected by the scaling procedure. If there is no
simultaneity or error in the variables problem, we have a very strong
relationship as can be seen from the R2 or F value in Table 1; if as is
likely there is a problem, we have little confidence in the meaning of these
results. Additional insight into this issue can be obtained in the context
of the hedonic approach to which we now turn.
Consider the following definition of the retail margin
R E (p* - P)X1/P*X1(P* - P)/P*
(10)
The identity in (10) is consistent with either a multiple item or a single
item specification of output; on the other hand, the equality in (10) is only
consistent with a single item specification of output. Under this
assumption, there is a direct relationship between the retail margin and the
retail price, i.e., 8R/ap* > 0. This suggests postulating a function
analogous to the hedonic price function for the empirical analysis of retail
margins. Thus, one can postulate
R – h(X1 , 2{,j , X8 , X9 ) + v , (11)
16

where v is a disturbance term with the usual properties and the other
variables have been defined already. Incidentally, it is possible to develop
arguments as to what the expected signs of the effects of these variables
would be on the basis of the hedonic specification.
The indexes of monopoly power would be expected to affect the retail
margin positively, other things equal. For instance, the higher
concentration and barriers to entry in a retail sector the more likely are
retailers to be able to squeeze suppliers and lower their prices, thus
increasing retail margins. Similarly, distribution services would be
expected to affect the retail margin positively. Since these services play
the role of outputs on the cost side, the higher their levels the higher the
costs and the higher retail margins have to be on these grounds; moreover,
since these services yield benefits to consumers, the higher their levels the
higher the retail prices consumers are willing to pay and, thus, the higher
the retail margins on these grounds. Therefore, the only coefficient with an
ambiguous sign in (1) will be the coefficient of physical quantity output
(X1) since on the cost side it will be positively related to the retail
margin but on the demand side it will be negatively related to the margin.
Hence, this hedonic type of specification generates a number of restrictions
grounded on economic theory that can be confronted with the data.
The hedonic type of model was implemented by considering two frequently
used alternative functional forms in each of the nine independent variables.8
8Parenthetically, no attempt was made to find the best fit with a Box-Cox type of transformation, as suggested by Halvorsen and Pollakowski (1981),or to develop a second stage to identify demand and supply parameters ascustomary in the hedonic literature, for example in the work of Kaufman andQuigley (1987) or Cropper, et al. (1988) and in the criticisms and proceduresdeveloped by Epple (1987) and Bartik (1987). The reason is that the initialresults rejected the hedonic approach.
17

9R E aiXi + v , (11a)
and
9R E a.logXi + v .
i-1 i(11b)
The specification of the variables in the regressions in Table 1 corresponds
to the model that treats retail markets as local and uses the quantity based
index X3(A) as a measure of product assortment, i.e., the one identified as
IA in the previous section. The difference between the two rows within each
functional form stems from the use of sales X 1 (A) as a measure of output in
the second and fourth row and the use of the value of building rentals X1(B)
as a proxy for output in the first and third rows. A comparison of the
results in the first and second rows or in the third and fourth rows provides
evidence on the simultaneity bias or error in the variables problem mentioned
earlier. Since sales is in the denominator of the dependent variable and in
the numerator of the independent one, a strong negative correlation would be
expected. This is indeed the case in both cases as the coefficient of Xl(A)
(a1 ) is negative and has a high t-ratio; moreover, there is a dramatic change
in the sign and significance of this coefficient when the proxy is used to
replace Xl (A) in both linear and semi-log specifications. Other evidence of
the existence of a simultaneity or error in the variables problem is the
substantial increase in fit (R 2 ) with both specifications and the fact that
other coefficient estimates even change signs. Therefore, we will view the
specifications using Xl (B) as the preferred ones.
With both functional forms the results of our preferred specification
(X1 (B)) reject the hedonic approach. The theory underlying this approach
requires that all variables except quantity of output have a positive
18

coefficient but there are several negative coefficients in each case.
Furthermore, using 2 as a critical value one must reject the null hypothesis
that these negative coefficients are not significantly different from zero for
one case in the first row and for three cases in the third row. In terms of
predictive power the semi-log formulation is undoubtedly superior to the linear
one, although this finding is somewhat useless in view of the contradiction of
the theoretical basis underlying the hedonic approach by the data. Succinctly
put, the analogy used here between the retail margin and the retail price is
not supported by the data.
IV. Results
Each of the four models was estimated by nonlinear least squares for both
the hybrid and the full logit specification. Before presenting the detailed
results for each model, it is useful to discuss the statistics that allow one
to evaluate overall performance within each model as well as across models. In
Table 2 we present the necessary information for this evaluation in terms of
both classical tests and non-nested tests for each of the two specifications.
Two classical tests of hypotheses were performed on each of the four
models within each specification. The first one was designed to test the null
hypothesis that monopolistic competition is the appropriate market structure
for the analysis of retail sectors. If this is the case, and given the
traditional long-run interpretation of cross-section data, one would expect
that the determinants of the profit margin (X8 through X12 ) would not
contribute to the explanation of retail margins, since the profit margin for
each sector would be expected to be zero in long-run equilibrium. The first
column of Table 2 shows that the null hypothesis cannot be rejected for any of
the four models at the 5 percent level (F 05 (5,36) — 2.48) in either the hybrid
or the full specification.
19

Table 2. Model Comparison Statistics
A: Hybrid Specification
Model Classical Tests Non-Nested Tests4
FullF1 F2 GF3 I.1 1.2 II.1 11.2
1.1 .93 6.57 .5429 0.47 0.54 0.56 1.00(0.28) (0.29) (0.25) (.22)
1.2 .07 2.48 .4497 .99 .69 .86 .81(.04) (.23) (.05) (.19)
II.1 .60 5.23 .4266 0.87 0.33 1.56 -.78(0.24) (0.46) (9.99) (.36)
11.2 .41 4.98 .3994 0.95 0.003 1.95 -.87(0.22) (0.43) (1.09) (.30)
B: Full Specification
Model Classical Tests4
Non-Nested TestsHybridF1 F2 GF3 1.1 1.2 II.1 11.2
1.1 .92 3.56 .5444 1.14 .79 .71 .94(.32) (.16) (.16) (.14)
1.2 1.10 2.89 .4920 .93 .93 .90 .93(.19) (.17) (.20) (.17)
11.1 0.60 2.23 .4275 1.02 .97 .92 .98(.14) (.14) (.16) (.17)
11.2 0.56 2.03 .4099 1.00 .83 1.78 -.69(.20) (.18) (1.28) (.32)
'Observed value of the F statistic when the five coefficients of thedeterminants of the profit margin are set to zero (# - ... -
/3 - 0).8
12
20bserved value of the F statistic when the twelve coefficients of thedeterminants of the retail margin are set to zero (fit - ... -
/312 - 0)'
3A descriptive measure of goodness of fit obtained as the R 2 in a simplelinear regression using the predicted value from the model as theindependent variable and the retail margin as the dependent one.
4Each entry in the table is the estimated value of 8 and its associatedstandard error. The estimates are obtained from the nonlinear least squaresestimation of (14).
20

A second classical test employed was designed to test the null
hypothesis that none of the variables identified as determinants of the
retail margin has any effect on the retail margin, either variables
postulated as determinants of the profit margin (X8 - X
12) or determinants of
the cost and demand structure as output or distribution services (X1 - X7).
The results reported in the second column of Table 2(A) lead to a categorical
rejection of the null hypothesis, except for model 1.2, at the 1 percent
level of significance (F 01 (12,36) – 2.72). Even for model 1.2, the null
hypothesis is rejected at the 5 percent level (F 05 (12,36) – 2.03). Similar
results hold for the full specification in part B of Table 2. Together these
two tests bring out the importance of incorporating distribution services in
any analyses of retail margins under both specifications.
While the third column in Table 2 is not a classical test statistic, it
is a useful descriptive statistic that measures goodness of fit. It is the
R2 in a regression of the retail margin on the predictive value obtained from
each model. Thus, it provides an informal measure of performance across
models. As can be seen from the table, this measure of performance leaves no
doubt that model 1.1 is superior to the other three in terms of explaining
variations in retail margins under both specifications, hybrid and full. It
also suggests that the full model fits the data somewhat better than the
hybrid one. Since this measure of performance is an informal one, we also
performed nonnested hypotheses tests on the results to obtain formal
comparisons of the models.
In Table 2 we also report the results of the particular nonnested test
that we employed. This test is based on the artificial embedding procedure
developed by Davidson and McKinnon (1981) and subsequently extended by other
21

(12)
(13)
authors, e.g., McKinnon, White and Davidson (1983). This procedure is known
as the J-test. For instance, consider the null hypothesis
Ho : Ri - g(Xifl) + u0i ,
and the alternative
1111 :iti -11(2--""17) 1
whereLrepresents one of the four models in question, for example I.1, andiP
Z.represents another of the four models, for example 1.2. One can then17
construct a compound model in the following manner:
110 : Ri - (1 - O)g(X ifl) + Oh(Z i7) + ui , (14)
where " indicates the nonlinear least squares estimator of the parameter
vector.
Estimation of (14) by nonlinear least squares yields estimates of 8 that
can be used to test the null hypothesis that one model, for example I.1,
contains all of the information available in the data for the explanation of
retail margins (0 - 0) against the alternative that another one of the
models, for example 1.2, contains additional information (8 o 0) relevant for
this purpose. One weakness of this test is that, in general, it can be
inconclusive. Interestingly enough, the results presented in Table 2 for the
four models under the hybrid specification (part A) are not inconclusive;
however, the results presented under the full specification (part B) are
inconclusive.
Each row of the table gives the estimate of 8 obtained by assuming as
the null hypothesis the particular combination of measure of product
assortment and nature of the retail market embodied in the model identified
22

at the margin. The estimate of 8 then indicates whether an additional
contribution to the explanation of the retail margin can be obtained by
introducing the predicted values of the model obtained under the particular
alternative hypothesis indicated by the column heading. In part A of Table
2, using the model that employs the quantity index as a measure of product
assortment and the local market as the relevant one for the retail sector
(1.1), at the 1 percent level of significance (t 005(36) — 2.75) one cannot
reject the null hypothesis that this is the true model when tested against
each of the other three alternatives. By contrast, using each one of the
other three possibilities as the null hypothesis, at the 1 percent level of
significance one can always reject the null hypothesis that each of these
alternatives contains all the information relevant for explaining the retail
margin against the alternative that model I.1 contains additional relevant
information. Hence, these results provide conclusive evidence in favor of
model I.1 under the hybrid specification. In part B of Table 2, on the other
hand, the results are inconclusive using the same level of significance.
Model I.1 is rejected against each of the other three when treated as the
null hypothesis; however, each of the other three models is rejected when
treated as the null hypothesis against the alternative of model I.1.
The last column in Table 2 provides the results of a non-nested test of
the two specifications, hybrid and full. Thus, in part A of the table the
estimates of the coefficient of the predicted value obtained from the
corresponding model regression in the full specification are presented. In
part B of the table, similar estimates for the coefficient of the predicted
value from the hybrid specification are presented. Once again, the results
are inconclusive. Our explanation of these results is that the specification
supported by the data is neither the hybrid one nor the full one but a
23

restricted one in which all the coefficients of the variables representing
indexes of monopoly power are set to zero. This interpretation is precisely
what the classical test in column 1 suggests for all four models under both
specifications.
The detailed results are presented in Table 3. For each of the four
models and under both specifications, we present the nonlinear least squares
coefficient estimates obtained with the variables that determine the profit
margin; we also present the results of eliminating these variables. Thus,
the first finding that emerges from those results is that none of the
individual coefficient estimates associated with the determinants of the
profit margin differs from zero in a statistically significant manner at
either the 5 percent or the 1 percent level. 9 This result holds true in each
of the four models for both specifications and it is consistent with the
corresponding result presented in Table 2 for the joint test. Within each
model the results for the coefficients of the other variables (X 1 to X7 ) are
relatively insensitive to the removal of the determinants of the profit
margin. For instance, in model 1.1 under both specifications there are no
changes in coefficient signs and only one change in coefficients that differ
from zero in a statistically significant manner using 2 as a critical value
of the t-ratio. -°
Since the model comparisons presented in Table 2 strongly favor the
selection of 1.1 and since the individual results presented in Table 3 are
9Parenthetically, it is useful to remember that the bias in our measureof concentration is toward creating statistical significance when there isnone.
10The estimate of )93 in the full specification is so close to 2 that weare treating it as equal to 2 throughout our discussion of results.
24

We 3. tbrilnesr nest Sq-ares Estimates ofDatmatrorts of
4 A 02 03 4 A 06 07 4 4 1310 fill fill
Os:b1 1.1: Per Establishert Variables, Qxrcity Ines of Amapa:re
Hytrisi .1963* 41.37 - cacaos - 6269* -33.64*189.45* 46.14 144.41* .0057 .5168 .2277(.02035)(.0649) (6).93) (.2716) (14.34) (63.42) (2514) (17.11) .CC60 (.5815) (.0410) (.00006) (.7760)
Restricted .33e9* 126.53 -.0333013 -.8632* 149.51* 269.6e 31.65 449.e(.02116) (74.35) (-0O3126) (.2913) (19.92) (81.87) (33-54) (19.84)
11,11 .3370* 128.54 -.03=61 .7877* -37.9e 165.77* 53.57 145.47 -.2436 -24.2 -.4753 -.01C4 6.18(.0203) (99.07) ( 031269) (.3955) (16.68) (91.14) (44.46) (25.76) (.1920)(25.74) ( .4 773) (.0393)(254.93)
ttchl 1.2: Ike- Estreillstrec Varna's; Enure, Inc af Assxtnent
Hybrid .2548* 133.34 .00015 -.0749 -87.57 361.65 -77.65 -36.56 .0323 .4793 .0061(.0592) (169.60) (.0333013) (1 OMB) (47.03) (222.13) (60.52) (40.25) (.058) ( .6134 (-043) (.037) (.8380)
Restrict .3303* 218.04 .0)3314 -59.24* 463.99* -72.18 -57.47(.0186) (134.05) 032003 ( 8669) (40.21) (167.54) (58.11) (32.69)
Ral .3161* 233.31* .COC26 "6539 -71.66* 168.75 -95.62 7.83 .3113 -60.15 2.68 -.0178 19.75(.0e28) (114.02) (.000O36) (1 9318) (31.02) (148.12) (99.86) (59.23) (.1356)(34.40) (2.21) (.0101) (23.44)
?tea 1:1.1: &saute levels Variables; Qarrity Iniac of Pastel:cent
-.0360 .00135 .03301 -.0664 .0012* -.0323 .0316 -.7223 .0334 .03331 .2461(.0567) (.0206) ( (3037) ( 0506) (.03336) (.0335) .0018 (.03310) (.0O57) (.E077) (.0512) (.01127) (.9358)
Restricted -.0363* .0035 -.0112M -.03312* .0712* - 03035(.(e85) (.02) (.03CCC6) (.0279) ( CCM) (.am) (.02(09) (.02036)
Pull .0305 .03E2* -.031138 .0262 -3.0349 .0287 .03304 5674(.0513) (.0207) (.03332) (.0611) (.a=7) (.000s) (.0)019) (SLOW .0233 (2.6727) (.2126) (.03036) (4 C6)
thel 11.2 Absolute Levels Variables; Ercropy bras of Assn-tart
.OWE -.02033 0191 -.03014* .coe -.0X715 .0O38 -.832 .0146 -.03334 .1133(.(69)) (.0337) (.03C0017) ( 1236) (.00335) (.03(6) ( 033331) (.0301) (.0159) (.618) (.0521) (.00(706) (1.004)
Restricted -.1147* .03349 -.21204 .0139 .cance .C011*C(3) (.0330) (.CO205) (.090 (.0200 (.0(6) (.03333) ( 0315)
31.111 .OWE -.cc= .0676 -.01017* .cart -.0O320 .0105 -3.90 .0315 -.0332 .1792(.0691) (.0337) (.030:03) (.1266) (.03337) (.0006) (.1:032) (.0011) (.0237) (2.67) (.2125) (.0333) (4.07)
15t:mead errces in pmentteses belts fie cceffaciax estimates.
*tastio gee= Own ar emea to 2.

more stable for this model than for the other three models, we will limit the
interpretation of the results for the individual coefficients to this model.
First of all if for simplicity we use 2 as a critical value of the t-ratio,
we find that the following distribution services have a statistically
significant effect in lowering retail margins: namely, product assortment
(03 ), assurance of product delivery (#4) and specific distribution services
(a7 ) (except in the full model). By contrast, with the same critical value
we find that information 05 ) has a statistically significant effect in
raising retail margins. The former results imply that the effect of the
distribution services on demand dominates their effect on cost for each of
these three distribution services; similarly, the latter result leads one to
conclude that the effect of information on demand is dominated by its effect
on the cost of providing information. 11 The results for ambiance (P6 ) and
accessibility of location (02) suggest that the effect of the distribution
service on demand is cancelled by its effect on cost. This result is quite
noticeable for accessibility of location which has an observed t-ratio
substantially less than unity.12
Finally, the output variable (p i ) has a positive effect on the retail
margin although this effect is not statistically significant using the same
critical value as before. For completeness, we have estimated the same four
models replacing our proxy for output with sales. These results are
110ne should not fail to mention that advertising expenditures, which isour measure of information, can also be interpreted as an index of barriersto entry. Indeed, it is a common explanation in the traditional literatureon profit margins, Schmalensee (1988), and it also appears in recentempirical analyses of contestable markets, Kessides (1986).
12An alternative interpretation, based on the discussion of section II,is that this variable represents the number of local markets in a retailsector and that variations in this number across retail sectors has no effecton the retail margins.
26

presented in two tables, identical to 2 and 3 attached to the Data Appendix.
Here, we merely note that some of the results, particularly those based on
individual coefficients, are dramatically different when sales is used as a
measure of output. For instance, the coefficient of output changes sign and
becomes 'statistically significant' when sales is used while that of specific
information changes sign and remains 'statistically significant'. Once again
these changes are suggestive of either a simultaneity bias or an error in the
variables problem. Finally, it is worth noting two results not affected by
the change in output variable: the per establishment version (I) and the
full logit specification fit the data better than the alternatives, namely
the absolute levels (II) and the hybrid.
Concluding Remarks
Our main substantive findings are: monopolistic competition is
supported by this data as a relevant market structure for the analysis of
retail markets; distribution services play a critical role in determining
retail margins. On the methodological side the economic framework based on
the definition of profits is shown to be an attractive alternative to the
mark-up model, because it avoids the use of sales on both sides of the
equation and it provides straightforward links to prior literature.
Furthermore, in contrast to the hedonic approach, it is not rejected by the
data.
Considering the extensive literature on the analysis of profit margins,
we suspect that subsequent literature will try to challenge the first
substantive finding. Those who follow the traditional empirical paradigm can
note one of Schmalensee's (1988) stylized facts, namely concentration
measures are not systematically associated with profits in cross-section
studies; however, they have a harder time explaining why our measure of
27

barriers to entry also fails to exhibit such an association. Those who
follow the new empirical paradigm a la Bresnahan (1988) might argue for the
need to specify the unobservable price cost margin. Note, however, that
specification of the nature of monopoly power through this margin is only
necessary if one chooses as the null hypothesis the existence of monopoly
power. An advantage of the approach based on the definition of profits is
that one can choose monopolistic competition as the null hypothesis and this
is as legitimate an econometric procedure as the other one. Our position is
that the result must be interpreted with caution for two reasons. First, our
empirical finding with respect to advertising can be interpreted as an
indication of the existence of an association between barriers to entry and
retail margins and, thus, be used to argue for rejection of the null
hypothesis; second, we are accepting a null hypothesis and we do not know
what is the power of this test.
Empirical analysis of the role of distribution services in retail
activities is nonexistent. Therefore, from our perspective, the second
substantive finding is important as the first source of empirical support for
the ideas in recent theoretical work identifying and formalizing the role of
distribution services in these activities. The positive nature of the
results should stimulate further empirical and theoretical research along
these lines. Indeed, at present we are engaged in developing and analyzing
similar data sources for several European countries.
By the way of a conclusion, it is worthwhile to place our empirical
approach in the context of the empirical traditions in industrial
organization as articulated recently by Schmalensee (1988) and Bresnahan
(1988).
28

Schmalensee concludes his survey by arguing that interindustry
research... "should generally be viewed as a search for empirical
regularities, not as a set of exercises in structural estimation." Since our
data is limited to the retail sector, it is not clear that this advice is
applicable; nevertheless, if it were deemed applicable, we think it is poor
advice. For instance, a robust finding of our analysis is the rejection of
the hedonic approach as a framework for the analysis of retail margins. This
robustness stems from our identification of the single output assumption as
necessary for its applicability as well as from the statistical results being
inconsistent with the approach under alternative specifications. Had we been
just looking for patterns, it is very doubtful that we would have thought of
the hedonic approach as a possibility.
At the other extreme one can quote Bresnahan (1988) "a typical NEIO
paper is first and foremost an econometric model of an industry." Our
position is that much insight and information can be gained by intermediate
approaches that bring information from the theory to bear on the data without
having a fully specified econometric model of an industry. To illustrate,
consider one of our most robust findings, namely that the full logit
specification of the determinants of retail margins is the one which best
fits the data. This specification follows from selecting the definition of
profits as an appropriate economic framework for the analysis of retail
margins and deriving the logical consequences of this definition and of the
role of distribution services for the functional form to be used empirically.
Searching for patterns or for a fully specified econometric model would not
have generated this finding.
Finally, just as in the case of the hedonic approach with respect to
prices, we certainly would agree that a useful task for future research is
29

the identification of some structural parameters via special cases which
arise through the use of simplifying assumptions and/or particular
characteristics of certain markets and data sets. Such a task, however, may
be impossible to accomplish with our data set. For instance, specification
of a simple cost function and a simple demand function in our analysis
generates fourteen parameters which would have to be estimated with seven
variables in our data set. Since the issues presented here have not been
empirically analyzed before, it is certainly useful to exploit the
information available before embarking on a laborious and expensive data
construction project. Indeed, one of the contributions of this research is
as a standard or reference to use, together with the knowledge gained from
detailed studies of specific industries (for example, Borenstein's and
Shephard's studies of the gasoline market), in designing ambitious data
construction projects.
30

REFERENCES
Amemiya, T., Advanced Econometrics, Cambridge, 1964.
Bartik, T., "The Estimation of Demand Parameters in Hedonic Price Models,"Journal of Political Economy, February 1987, 95, 81-88.
Betancourt, R. and D. Cautschi, "The Economics of Retail Firms," Managerialand Decision Economics, June 1988, 9, 133-144.
, "Demand Complementarities, Household Production, and RetailAssortments," forthcoming, Marketing Science.
, "Two Essential Characteristics of Retail Markets and TheirEconomic Consequences," Maryland Working Paper No. 89-6.
, "The Demand for Retail Products and the Household ProductionModel: New Views on Complementarity and Substitutability," forthcoming,Journal of Economic Behavior and Organization.
Bittlingmayer, G., "The Elasticity of Demand for Books, Resale PriceMaintenance and the Lerner Index," mimeo, University of California-Davis, March 1989.
Bliss, C., "A Theory of Retail Pricing," Journal of Industrial Economics,June 1988, 36, 372-391.
Borenstein, S., "Selling Costs and Switching Costs: Explaining RetailGasoline Margins," Institute of Public Policy Discussion Paper #305,University of Michigan, September 1989.
Bresnahan, T., "Empirical Studies of Industries with Market Power," in R.Schmalensee and T. Willig, eds., Handbook of Industrial Organization,Amsterdam, 1988.
Chamberlin, E., The Theory of Monopolistic Competition, 8th edition,Cambridge, 1962.
Cropper, M., L. Deck and K. McConnell, "On the Choice of Functional Form forHedonic Price Functions," Review of Economics and Statistics, November1988, 70, 668-675.
Epple, D., "Hedonic Prices and Implicit Markets: Estimating Demand and SupplyFunctions for Differentiated Products," Journal of Political Economy,February 1987, 95, 59-80.
Gallant, R., "Nonlinear Regressions," The American Statistician, 1975, 29,73-81.
, "Testing a Subset of the Parameters of a Nonlinear Regression,"Journal of the American Statistical Association, 1975, 70, 927-32.
31

Gerstner, E. and J. Hess, "Why Do Hot Dogs Come in Packs of 10 and Buns in 8sor 12s? A Demand Side Investigation," ,Journal of Business, October1987, 60, 491-517.
R. Halvorsen and H. Pollakowski, "Choice of Functional Form for Hedonic PriceEquations," Journal of Urban Economics, July 1981, 10, 37-49.
Hess, J. and E. Gerstner, "Loss Leader Pricing and Rain Check Policy,"Marketing Science, Fall 1987, 6, 358-374.
Hotelling, H., "Stability in Competition," Economic Journal, March 1929, 39,41-57.
Kaufman, D. and J. Quigley, "The Consumption Benefits of Investment inInfrastructure: The Evaluation of Sites and Services Programs inUnderdeveloped Countries," Journal of Development Economics, April 1987,25, 263-84.
Kessides, I., "Advertising, Sunk Costs and Barriers to Entry," Review ofEconomics and Statistics, February 1986, 68, 84-96.
Lazear, E., "Retail Pricing and Clearance Sales," American Economic Review,March 1986, 76, 14-32.
Metcalf, D., "Concentration in the British Retail Grocery Trade," in K.Tucker and B. Yamey The Economics of Retailing, London, 1973.
Mueller, D., Profits in the Long Run, Cambridge, 1986.
Nooteboom, B., "A Mark-Up Model of Retail Margins," Ap plied Economics, August1985, 17, 647-667.
, A. Kleijweg and R. Thurik, "Normal Costs and Demand Effects inPrice Setting: A Study of Retailing," European Economic Review, April1988, 32, 999-1011.
Pashigian, P., "Demand Uncertainty and Sales: A Study of Fashion and MarkdownPricing," American Economic Review, December 1988, 78, 936-953.
Perry, M. and R. Groff, "Resale Price Maintenance and Forward Integrationinto a Monopolistically Competitive Industry," Quarterly Journal of Economics November 1985, 100, 1293-1311.
Rosen, S., "Hedonic Prices and Implicit Markets: Product Differentiation inPure Competition," Journal of Political Economy, Jan./Feb. 1974, 82, 34-55-
Schmalensee, R., "Inter-Industry Studies of Structure and Performance," in R.Schmalensee and T. Willig, eds., Handbook of Industrial Organization,Amsterdam, 1988.
Sharkey, W.. "The Theory of Natural Monopoly," London, 1982.
32

Shephard, A., "Price Discrimination in Retail Markets," MIT Working Paper No.526, June 1989.
Smith, A. and D. Hitchens, Productivity in the Distributive Trades, London,1985
Waterson, M., Economic Theory of the Industry, London, 1984.
Winsten, C. and M. Hall, "The Measurement of Economies of Scale," Journal ofIndustrial Economics, July 1961, 9, 255-64.
U.S. Bureau of the Census, Census of Retail Trade, Industry Series Reports,RC82 I-1, 1-2, 1-3.
33

DATA APPENDIX
We start with the dependent variable, R. For each sector the retail
margin is measured as [sales (X 1 (A)) - cost of goods sold (CG)]/sales. Both
of these variables are taken directly from the original data source and
require no further discussion.
The output of a retail sector (X1 ) is much more difficult to measure.
As mentioned in the text, one obvious candidate is sales or sales per
establishment. If all sectors provide the same or proportional levels of
services per unit of output and price each unit of output the same, either
sales or sales per establishment would capture variability in quantity output
across sectors. Neither assumption holds and the first one has been
thoroughly discussed in the early economic literature on the use of Census
data, Winsten and Hall (1961). More recent literature, Smith and Nitchens
(1985), makes the same point. In addition, there is the simultaneity or
error in the variables problem indicated in the text. Thus, our proxy
measure for output, which is directly available in the data source, will be
the value of building rentals [X1(B)] or the value of building rentals per
establishment. The basic idea is that higher quantities of output are
associated with larger spaces and rents are positively associated with these
spaces. While this measure is subject to some of the same shortcomings as
sales, it avoids the most important limitation of sales which is the
simultaneity bias.
Accessibility of location (X 2 ) will be measured by the number of
establishments in each sector, which is directly available in the data.
While the theoretical concept is broader than this empirical measure, e.g.,
it could include other dimensions of access such as size of parking lot,
etc., the empirical measure is as good a counterpart of the theoretical
1

concept as any that one finds in an economic study if retail markets were
national or if they were local to the same degree in each sector.
A distribution service which has very well defined empirical
counterparts is the breadth of product assortment (X3). We are able to
construct two alternative indexes of this theoretical variable. For each
sector the data contain information on the number of establishments carrying
and the sales made on a particular product line for a universe of thirty
product lines. Thus, we construct two alternative indexes of assortment for
each sector or observation, i.e.,
30X3i
(A) - E X ../X .. 21j 21J-I
and
30X31
(B) a - E (S../S.)1n(S../S.) ,ji
j-1 J"
where the first index, X31
(A), is based on the number of establishments
carrying a product line in a sector relative to the total number of
establishments in the sector and the second one, X 31 (B), is based on the
percentage of sales of a product line in a sector relative to total sales in
this sector. The second index simply measures the level of breadth of
assortment in a sector by the entropy of sales over product lines in that
sector. In both cases there is a direct relation between the value of the
index and the level of assortment.
With respect to the remaining distribution services, there is a wider
gap between the theoretical construct and the empirical counterpart and
little that can be done about it. For instance, assurance of product
delivery at the desired time and in the desired form has several dimensions.
Our empirical measure (X 4) will be the average of inventory holdings at the
(Al)
(A2)
2

beginning and at the end of the year (both pieces of information are directly
available in the original source) or the same concept on a per establishment
basis. This empirical measure captures the idea that the greater the number
of goods available the more likely the consumer is to find the desired
product, but it does so imperfectly because it is a value term rather than a
quantity measure. Moreover, this measure captures mainly the common aspects
of this distribution service, i.e., those that are available to all the items
in the assortment, but not the specific ones, i.e., those that would be
available to particular items in the assortment as a result of the efforts
for example of specialized sales personnel.
Just as with respect to the previous distribution service, the next one
(information) has several dimensions. Our empirical construct, (X5)
advertising expenditures, is directly available in the data and purports to
capture one of these dimensions: namely, the higher the level of advertising
the more information is made available to the consumer on issues such as
prices, store hours and product availability. Once again, however, this
measure is a value measure and it does not capture other aspects of this
distribution service such as the specific information on an item that can be
provided by a sales force. Moreover, as this discussion suggests, in some
cases there is jointness between the provision of information and assurance
of product delivery in the desired form or time.
Last among the common distribution services is ambiance (X6 ), which will
be measured empirically by the gross value of assets in buildings and
structures in each sector which is taken directly from the data source. This
distribution service varies across retail sectors and our argument is that
higher levels of this 'quantity' will be associated with higher values of
building and structures.
3

Finally, different sectors provide different levels of specific
distribution services, that is, those associated with a particular item or
sets of items in the assortment. Thus, we will define a variable (X 7) to
capture the levels of these specific distribution services. Since most of
them require the use of labor resources, sometimes specialized ones, we will
use the sector's payroll, which is available in our data source, as an
indication of the level of specific distribution services provided.
Turning to the determinants of the profit margin, we will be measuring
concentration (X8) by the ratio of sales of the four largest firms in the
sector to total sales in the sector. This measure is directly available in
the data. Its shortcomings have been discussed in the text. Finally, we
note that barriers to entry (X 9 ) will be measured by the ratio of multi-
establishment firms to single establishment firms. The number of both types
of firms is directly available in the data. While this variable is a
sensible measure of barriers to entry, it may also proxy for economies in
purchasing thus capturing part of the effect of concentration.
Since the measurement of distribution services is a unique feature of
our study and the analysis of retail margins is somewhat neglected, we
provide two summary statistics on the values of all our variables in Table
Al. Namely, we present the mean and the range of each variable for nine
broad retail sectors into which the forty-nine sectors from the Census of
Retail Trades can be aggregated.
4
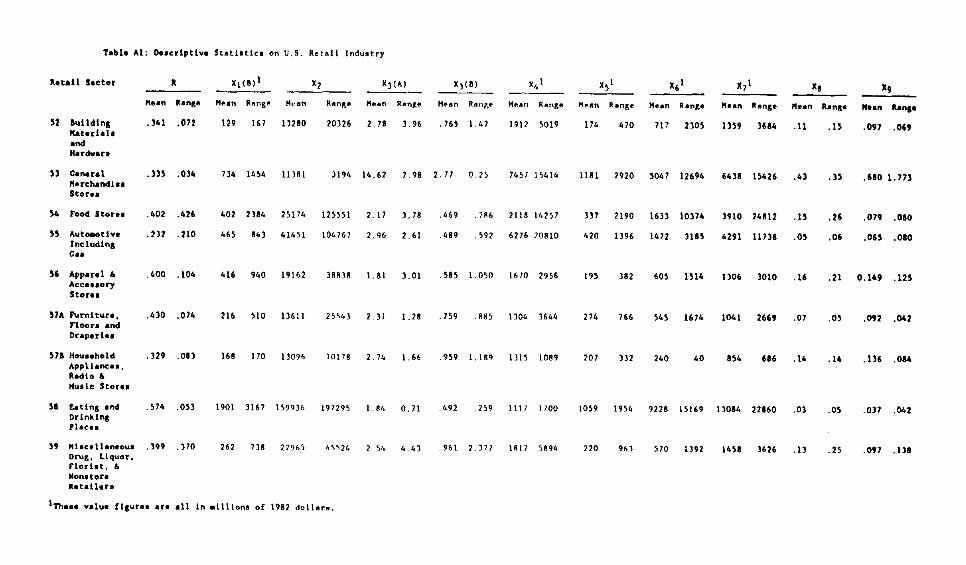
Table Al: Descriptive Statistics on U.S. Retell Industry
Retail Sector R X1(8)1 X2 X3(A) X3(B) X61 X51 X61 X21 Xg X9
Mean Range Mean Range Mean Range Mean Range Mean Raw Mean Range Mean Range Mean Range Mean Range Mean Range Mean Range
52 BuildingMaterialsand
.341 .072 129 167 13280 20326 2.78 3.96 .765 1.47 1912 5019 174 470 717 2305 1359 3684 .11 .15 .097 .069
Hardware
53 Genets' .335 .034 734 1454 11381 3194 14.62 7,98 2.77 0.25 7457 15414 1181 2920 5047 12694 6438 15426 .43 .35 .680 1.773MerchandiseStores
54 Food Stores .402 .426 402 2384 25174 125551 2.17 3.78 .469 .796 2118 14257 337 2190 1633 10374 3910 24812 .15 .26 .079 .080
55 Automotive .232 .210 465 843 41451 104767 2.96 2.61 .489 .592 6276 70810 420 1396 1472 3185 4291 11738 .05 .06 .065 .080IncludingCam
56 Apparel 4 .400 .104 416 940 19162 38838 1.81 3.01 .585 1.050 1670 2956 195 382 605 1514 1306 3010 .16 .21 0.149 .125AccessoryStores
574 Furniture, .430 .014 216 510 13611 25543 2.31 1.28 .759 .885 1304 3644 274 766 545 1674 1041 2669 .07 .05 .092 .042Floor, andDraperies
578 Household .329 .083 168 170 13096 10178 2.74 1.66 .959 1.189 1315 1089 207 332 240 40 854 686 .14 .14 .136 .084Appliances.Radio 4Music Stores
58 Eating and .574 .053 1901 3167 159936 197295 1.84 0.71 .492 .259 1117 1700 1059 1954 9228 15169 13084 22860 .03 .05 .037 .042DrinkingPlaces
59 Miscellaneous .399 .370 262 738 22965 45524 2.54 4.43 .961 2.377 1817 51194 220 963 570 1392 1458 3626 .13 .25 .097 .138Drug. Liquor.Florist,None toreRetailers
I nes• value figures are all In millions of 1982 dollars.

Table A2: Model Comparison Statistics (Sales)
A: Hybrid Specification
Classical Tests Non-Nested Tests4
F1Model F2 GF3F I.1 1.2 I1.1 11.2 Full
I. 1 0.86 7.512 0.7479 -0.572 -0.609 -0.504 0.9740.101 0.157 0.161 0.063
1.2 0.52 7.164 0.7396 -0.585 -0.544 -0.525 0.9310.102 0.167 0.164 0.054
II.1 0.60 2.743 0.4777 1.012 0.956 -1.170 -1.1920.140 0.137 0.148 0.141
11.2 0.41 2.524 0.4557 1.013 0.972 1.771 -1.1930.129 0.135 1.195 0.140
B: Full Specification
Classical Tests Non-Nested Tests4
Model Fl F2 I.1 1.2 II.1 11.2 Hybrid
I.1 9.8 19.16 0.8667 -0.427 0.304 0.369 0.3790.135 0.161 0.142 0.096
1.2 10.0 19.71 0.8717 -0.440 0.356 0.377 0.1950.120 0.148 0.128 0.070
II.1 0.61 2.747 0.4780 0.970 0.956 -1.049 -1.2560.064 0.060 0.154 0.137
11.2 0.46 2.467 0.4595 0.945 0.931 -0.789 -1.1400.058 0.052 0.339 0.147
'Observed value of the F statistic when the five coefficients of thedeterminants of the profit margin are set to zero 08 -
4412 - 0).
20bserved value of the F statistic when the twelve coefficients of thedeterminants of the retail margin are set to zero (pi
/312 - 0).
3A descriptive measure of goodness of fit obtained as the R 2 in a simplelinear regression using the predicted value from the model as theindependent variable and the retail margin as the dependent one.
4Each entry in the table is the estimated value of 6 and its associatedstandard error. The estimates are obtained from the nonlinear least squaresestimation of (14).
6

table A): Nonlinear Lasst Squares Estimates of Daterminents of U.S. Retell IlargIns1
Model 1.1; Bales Definition of Output, Per Establishment Variables. Quantity Index of Assortment80 61 82 63 84 Bs 86 67 68 89 810 811 812
Hybrid .007 -2.394' -.0000007 -.048 -I 86) 14.117 6.311 11_ 409' -.0005 -.419 -.001 ..00003 .059(.043) (.403) (.000001) (.041) (1.421) (9.619) (4.652) (4.864 ) (.004) (.449) (.014) (.00005) (.632)
Restricted • .020 .2.3)6' .0000004 -.004 -2.285 14.366 3.430 10.640'(.023) (.364) (.000001) (.021) (1.332) (8.772) (3.127) 4.324
Full .236• -9.447' -.000002' .007 -4.045' 83.228' -.911 38.557' ..0110 -10.557' 52' .00002 -2.716(.016) (1.688) (.000001) (.087) (2.08) (21.9) (8.05) (8.071) (.018) (2.568) (.182) (.0004) (4.274)
Model 1.2: Sales Definition of Output. Per Establishment Variables, Entropy Index of Assortment
go 82 83 84 Bs 86 87 88 Ifq 810 811 812
Hybrid -.007 -2.442' -.0000001 -.001 -2.357 11.244 6.464 12.731' -.001 371 .007 -.000004 -.136(.045) (.389) (.000001) (.102) (1.387) (10.806) (4.848) (4.867) (.004) (.463) (.0344) (.00004) (.64)
Restricted -.027 4.313' .0000003 .043 -2.586' 12.746 4.109 10.487'(.026) (.164) (.000001) (.072) (1.267) (9.556) (3.134) (4.343)
Full .2388 -9.911' -S(00002" .117 -1.625 80.177' -4.906 47.033' -.042' -11.195' .577 -.000009 -2.266
(.016) (1.669) (.000001) (.1)) (2.013) (21.788) (8.266) (8.619) (.019) (2.571) (.176) (.0003) (4.245)
Model 11.1: Sa/es Definition of Output. Absolute Levels Variables, Quantity Index of Assortment
ep 61 12 61 64 As 68 67 88 Bq 810 811 812
Hybrid -.063 -.00001 .000004 056 00006 .0008' -.0001 .0001 .001 ..596 .011 .000006 .115(.064) (.000006) (.000005) (.045) (.00005) (.0004) (.0001) (.0001) (.005) (.575) (.046) (.00007) (.651)
Restricted -.112' -.00001' .000003 -.02 00005 .0008* -.0001 .00008(.027) (.000005) (.000003) (.024) (.00004) (.0004) (.00009) (.00008)
Full -.062 -.00001 .000004 -.053 -.00006 .0008' -.0002' .0001 .003 -2.496 053 .00002 .422(.065) (.000006) (.000005) (.064) (.00005) (.0004) (.0001) (.0001) (.021) (2.171) (.169) (.0001) (1.474)
Model 11.2: Sallee Definition of Output, Absolute Levels Variables, Entropy Index of Assortment
Bo 81 62 83 84 85 68 67 88 68 810 811 812
Hybrid -.067(.065)
-.00001(.000006)
.000005(.000005)
.027(.115)
-.00008 .0006(.00005) (.0005)
-.0002'(.0001)(.0001) (.04050)2 (. 65 18 29) 046)(.046)
-.00004(.00006)
-.195(.858)
Restricted -.127. -.00001 .00000) .012 -.00006 .0006' -.0001 .0001(.027) (.000005) (.000003) (.088) (.00004) (.0004) (.00008) (.00008)
Pull -.079 -.00001 .000005 .031 -.00009 .0006 -.0002' .0001 ..001 -2.788 .131 -.0002 -.969(.065) (.000006) (.000005) (.115) (.00005) (.0005) (.0001) (.0001) ( 022) (2.43) (.189) (.0002) (3.465)
1 Standard errors In psrenthesee below the coefficient estimatem.*t.ratio greater than or equal to 2.

86/24 David GAUTSCHIand Vithala R. RAO
"The R I D/Production interface".
"Subjective estimation in integratingcommunication budget and allocationdecisions: a case study", January 1986.
"Sponsorship and the diffusion oforganizational innovation: a preliminary viev".
"Confidence intervals: an empiricalinvestigation for the series in the M-Competition" .
"A note on the reduction of the vorkveek",July 1985.
"The real exchange rate and the fiscalaspects of a natural resource discovery",Revised version: February 1986.
"Judgmental biases in sales forecasting",February. 1986.
"Forecasting political risks forinternational operations", Second Draft:March 3, 1986.
"Les primes des offres publiques, la noted'information et le marchd des transferts decontrAle dea sociAtds".
"Strategic capability transfer in acquisitionintegration", May 1986.
"Tovards an operational definition ofservices", 1986.
"Nostradamus: a knovledge-based forecastingadvisor".
"The pricing of equity on the London stockexchange: seasonality and size premium",June 1986.
"Risk-premia seasonality in U.S. and Europeanequity markets", February 1986.
"Seasonality in the risk-return relationshipssome international evidence", July 1986.
"An exploratory study on the integration ofinformation systems in manufacturing",July 1986.
"A methodology for specification andaggregation in product concept testing",July 1986.
1986
86/01 Arnoud DE MEYER
86/02 Philippe A. NAERTMarcel VEVERBERGHand Guido VERSVIJVEL
86/03 Michael BRIER
86/04 Spyros MAKRIDAKISand Michele NIHON
86/05 Charles A. VYPLOSZ
86/06 Francesco GIAVAllI,Jeff R. SHEEN andCharles A. VYPLOSZ
86/07 Douglas L. MacLACHLANand Spyros MAKRIDAKIS
86/08 Jose de la TORRE andDavid H. NECKAR
INSEAD DORKING PAPERS SERIES 86/16 B. Espen ECKBO andHervig M. LANGOHR
86/17 David B. JEMISON
86/18 James TEBOULand V. MALLERET
86/19 Rob R. VEITZ
86/20 Albert CORHAY,Gabriel HAVAVINIand Pierre A. MICHEL
86/21 Albert CORHAY,Gabriel A. HAVAVINIand Pierre A. MICHEL
86/22 Albert CORHAY,Gabriel A. HAVAVINIand Pierre A. MICHEL
86/23 Arnoud DE MEYER
86/09 Philippe C. HASPESLAGH "Conceptualizing the strategic process indiversified firma: the role and nature of thecorporate influence process", February 1986.
"Analysing the issues concerningtechnological de-maturity".
86/25 H. Peter GRAYand Ingo VALTER
86/26 Barry EICHENGREENand Charles VYPLOSZ
86/27 Karel COOLand Ingemar DIERICKX
86/28 Manfred KETS DEVRIES and Danny MILLER
"Protection", August 1986.
"The economic consequences of the FrancPoincare", September 1986.
"Negative risk-return relationships inbusiness strategy: paradox or truism?",October 1986.
"Interpreting organizational texts.
86/10 R. MOENART,Arnoud DE MEYER,J. BARBE andD. DESCHOOLMEESTER.
86/11 Philippe A. NAERTand Alain BULTEZ
"From "Lydiametry" to "Pinkhamization":misspecifying advertising dynamics rarelyaffects profitability".
Manfred KETS DE VRIES "Vhy follov the leader?"."The economics of retail firms", RevisedApril 1986.
"Spatial competition a la Cournot".
"Comparaison internationale des merges brutesdu commerce", June 1985.
"Elov the managerial attitudes of firms vithVMS differ from other manufacturing firms:survey results", June 1986.
86/29
86/30 Manfred KETS DE
86/31 Arnoud DE MEYER
86/31 Arnoud DE MEYER,Jinichiro NAKANE,Jeffrey G. MILLERand Rasta FERDOWS
86/32 Karel COOLand Dan SCHENDEL
"Flexibility: the next competitive battle",October 1986.
"Flexibility: the next competitive battle",Revised Version: March 1987
Performance differences among strategic groupmembers", October 1986.
86/12 Roger BETANCOURTand David CAUTSCHI
86/13 S.P. ANDERSONand Damien J. NEVEN
86/14 Charles WALDMAN
86/15 Mihkel TOMBAK andArnoud DE MEYER
VRIES "The succession game: the real story.

86/33 Ernst BALTENSPERGERand Jean DERMINE
86/34 Philippe HASPESLAGHand David JEMISON
86/35 Jean DERMINE
86/36 Albert CORHAY andGabriel HAVAVINI
86/37 David GAUTSCHI andRoger BETANCOURT
86/38 Gabriel HAVAVINI
86/39 Gabriel HAVAVINIPierre MICHELand Albert CORHAY
86/40 Charles VYPLOSZ
86/41 Kasra FERDOVSand Wickham SKINNER
86/42 Kasra FERDOVSand Per LINDBERG
86/43 Damien NEVEN
86/44 Ingemar DIERICKICarmen MATUTESand Damien NEVEN
1987
87/01 Manfred KETS DE VRIES
87/02 Claude VIALLET
87/03 David GAUTSCHIand Vithala RAO
87/04 Sumantra GHOSHAL andChristopher BARTLETT
87/05 Arnoud DE MEYERand Kasra FERDOVS
"The role of public policy in insuringfinancial stability: a cross-country,comparative perspective", August 1986, RevisedNovember 1986.
"Acquisitions: myths and reality",July 1986.
"Measuring the market value of a bank, aprimer", November 1986.
"Seasonality in the risk-return relationship:some international evidence", July 1986.
"The evolution of retailing: a suggestedeconomic interpretation".
"Financial innovation and recent developmentsin the French capital markets", Updated:September 1986.
"The pricing of common stocks on the Brusselsstock exchange: a re-examination of theevidence", November 1986.
"Capital flows liberalization and the EMS, aFrench perspective", December 1986.
"Manufacturing in a new perspective",July 1986.
"FMS as indicator of manufacturing strategy",December 1986.
"On the existence of equilibrium in hotelling'smodel", November 1986.
"Value added tax and competition",December 1986.
"Prisoners of leadership".
"An empirical investigation of internationalasset pricing", November 1986.
"A methodology for specification andaggregation in product concept testing",Revised Version: January 1987.
"Organizing for innovations: case of themultinational corporation", February 1987.
"Managerial focal points in manufacturingstrategy", February 1987.
"Customer loyalty as a construct in themarketing of banking services". July 1986.
"Equity pricing and stock market anomalies",February 1987.
"Leaders who can't manage', February 1987.
"Entrepreneurial activities of European MBAs",March 1987.
"A cultural view of organizational change",March 1987
"Forecasting and loss functions", March 1987.
"The Janus Bead: learning from the superiorand subordinate faces of the manager's Job",April 1987.
"Multinational corporations as differentiatednetworks", April 1987.
"Product Standards sad Competitive Strategy: AnAnalysis of the Principles", May 1987.
"METAPORECASTINC: Nays of improvingForecasting. Accuracy and Usefulness",May 1987.
"Takeover attempts: what does the language tellus?, June 1987.
"Managers' cognitive maps for upward anddownward relationships", June 1987.
"Patents and the European biotechnology lag: astudy of large European pharmaceutical firms",June 1987.
*Vhy the EMS? Dynamic games and the equilibriumpolicy regime, May 1987.
"A new approach to statistical forecasting",June 1987.
"Strategy formulation: the impact of nationalculture", Revised: July 1987.
"Conflicting ideologies: structural andmotivational consequences", August 1987.
"The demand for retail products and thehousehold production model: new views oncomplementarity and substitutability".
87/06 Arun K. JAIN,Christian PINSON andNaresh K. MALHOTRA
87/07 Rolf BANZ andGabriel HAVAVINI
87/08 Manfred KETS DE VRIES
87/09 Lister VICKERY,Mark PILKINCTONand Paul READ
87/10 Andre LAURENT
87/11 Robert PILDES andSpyros MAKRIDAKIS
87/12 Fernando BARTOLOMEand Andre LAURENT
87/13 Sumantra GHOSHALand Nitin NOHRIA
87/14 Landis GABEL
87/15 Spyros MAKRIDAKIS
87/16 Susan SCHNEIDERand Roger DUNBAR
87/17 Andre LAURENT andFernando BARTOLOME
87/18 Reinhard ANGELMAR andChristoph LIEBSCHER
87/19 David BEGG andCharles VYPLOSZ
87/20 Spyros MAKRIDAKIS
87/21 Susan SCHNEIDER
87/72 Susan SCHNEIDER
87/23 Roger BETANCOURTDavid GAUTSCHI

87/29 Susan SCHNEIDER andPaul SHRIVASTAVA
"The internal and external careers: atheoretical and cross-cultural perspective",Spring 1987.
"The robustness of EDS configurations in theface of incomplete data", March 1987, Revised:July 1987.
"Demand complementarities, household productionand retail assortments", July 1981.
*Is there a capital shortage in Europe?",August 1987.
"Controlling the interest-rate risk of bonds:an introduction to duration analysis andimmunization strategies", September 1987.
"Interpreting strategic behavior: basicassumptions theses in organizations", September1987
87/41 Gavriel HAVAVINI andClaude VIALLET
87/42 Damien NEVEN andJacques-F. THISSE
87/43 Jean GABSZEVICZ andJacques-F. THISSE
87/44 Jonathan HAMILTON,Jacques-F. THISSEand Anita VESKAMP
87/45 Karel COOL,David JEMISON andIngemar DIERICKX
87/46 Ingemar DIERICKXand Karel COOL
*Seasonality, size premium and the relationshipbetween the risk and the return of Frenchcommon stocks', November 1987
"Combining horizontal and verticaldifferentiation: the principle of max-mindifferentiation", December 1987
"Location", December 1987
"Spatial discrimination: Bertrand vs. Cournotin a model of location choice", December 1987
"Business strategy, market structure and risk-return relationships: a causal interpretation",December 1987.
"Asset stock accumulation and sustainabilityof competitive advantage", December 1987.
87/24 C.B. DERR endAndre LAURENT
87/25 A. K. JAIN,N. K. MALHOTRA andChristian PINSON
87/26 Roger BETANCOURTand David CAUTSCRI
87/27 Michael BURDA
87/28 Gabriel HAVAVINI
87/30 Jonathan HAMILTONV. Bentley MACLEODand J. F. THISSE
"Spatial competition and the Core", August1987. 1988
87/31 Martine OUINZII andJ. F. THISSE
87/32 Arnoud DE MEYER
87/33 Yves DOZ andAmy SHUEN
87/34 Kasra FERDOVS andArnoud DE MEYER
87/35 P. J. LEDERER andJ. F. THISSE
87/36 Manfred KETS DE VRIES
87/37 Landis GABEL
87/38 Susan SCHNEIDER
87/39 Manfred KETS DE VRIES1987
87/40 Carmen MATUTES andPierre REGIBEAU
"On the optimality of central places",September 1987.
"German, French and British manufacturingstrategies less different than one thinks",September 1987.
"A process framework for analyzing cooperationbetween fires", September 1987.
"European manufacturers: the dangers ofcomplacency. Insights froe the 1987 Europeanmanufacturing futures survey, October 1987.
"Competitive location on netvorks underdiscriminatory pricing", September 1987.
"Prisoners of leadership", Revised versionOctober 1987.
"Privatization: its motives and likelyconsequences", October 1987.
"Strategy formulation: the impact of nationalculture", October 1987.
"The dark side of CEO succession", November
"Product compatibility and the scope of entry",November 1987
88/01 Michael LAWRENCE andSpyros MAKRIDAKIS
88/02 Spyros MAKRIDAKIS
88/03 James TEBOUL
88/04 Susan SCHNEIDER
88/05 Charles VYPLOSZ
88/06 Reinhard ANGELMAR
88/07 Ingemar DIERICKXand Karel COOL
88/08 Reinhard ANGELMARand Susan SCHNEIDER
88/09 Bernard SINCLAIR-DESGAGNO
88/10 Bernard SINCLAIR-DESGAGNe
88/11 Bernard SINCLAIR-DESGAGNe
"Factors affecting judgemental forecasts andconfidence intervals", January 1988.
"Predicting recesaices and other turningpoints", January 1988.
"De-industrialize service for quality", January1988.
"National vs. corporate culture: implicationsfor human resource management", January 1988.
"The swinging dollar: is Europe out of step?",January 1988.
"Lea conflits dens les canaux de distribution",January 1988.
"Competitive advantage: a resource basedperspective", January 1988.
"Issues in the study of organizationalcognition", February 1988.
"Price formation and product design throughbidding", February 1988.
"The robustness of some standard auction gameforms", February 1988.
"Vhen stationary strategies are equilibriumbidding strategy: The single-crossingproperty", February 1988.

88/12 Spyros MAKRIDAKIS
88/13 Manfred KETS DE VRIES
88/14 Alain NOEL
88/15 Anil DEOLALIKAR andLars-Hendrik ROLLER
88/16 Gabriel NAVAVINI
88/17 Michael BURDA
88/18 Michael BURDA
88/19 M.J. LAWRENCE andSpyros MAKRIDAKIS
88/20 Jean DERMINE,Damien NEVER andJ.F. THISSE
88/21 James TEBOUL
88/22 Lars-Hendrik ROLLER
88/23 Sjur Didrik FLAXand Georges ZACCOUR
88/24 B. Espen ECKBO andHervig LANCOHR
88/25 Everette S. CARONERand Spyros MAKRIDAKIS
88/26 Sjur Didrik FLAMand Georges ZACCOUR
88/27 Murugappa KRISHNANLars-Hendrik ROLLER
"Business firms and managers in the 21stcentury", February 1988
"AlexIthymia in organizational life: theorganization man revisited", February 1988.
'The interpretation of strategies: a study ofthe impact of CEOs on the corporation",March 1988.
"The production of and returns from industrialinnovation: an econometric analysis for adeveloping country", December 1987.
"Market efficiency and equity pricing:international evidence and implications forglobal investing", March 1988.
"Monopolistic competition, costs of adjustmentand the behavior of European employment",September 1987.
"Reflections on "Veit Unemployment" inEurope", November 1987, revised February 1988.
"Individual bias in judgements of confidence",March 1982.
'Portfolio selection by mutual funds, anequilibrium model", March 1988.
"De-industrialize service for quality",March 1988 (88/03 Revised).
"Proper Quadratic Functions with an Applicationto AT&T", May 1987 (Revised March 1988).
"Equilibres de Nash-Cournot dans le earcheeuropAen du gaz: un cas o6 les solutions enboucle ouverte et en feedback coincident",Mars 1988
"Information disclosure, means of payment, andtakeover premia. Public and Private tenderoffers in France", July 1985, Sixth revision,April 1988.
"The future of forecasting", April 1988.
"Semi-competitive Cournot equilibrium inmultistage oligopolies", April 1988.
"Entry game with resalable capacity",April 1988.
88/29 Naresh K. MALHOTRA,Christian PINSON andArun K. JAIN
88/30 Catherine C. ECKELand Theo VERMAELEN
88/31 Sumantra CHOSHAL andChristopher BARTLETT
88/32 Kasra FERDOVS andDavid SACKRIDER
88/33 Mihkel M. TOMBAK
88/34 Mihkel M. TOMBAK
88/35 Mihkel M. TOMBAK
88/36 Vikas TIBREVALA andBruce BUCHANAN
88/37 Murugappa KRISHNANLars-Hendrik ROLLER
88/38 Manfred KETS DE VRIES
88/39 Manfred KETS DE VRIES
88/40 Josef LAKONISHOK andTheo VERMAELEN
88/41 Charles VYPLOSZ
88/42 Paul EVANS
88/43 B. SINCLAIR-DESGAGNE
88/44 Essam MAHMOUD andSpyros MAKRIDAKIS
88/45 Robert KORAJCZYKand Claude VIALLET
88/46 Yves DOZ andAmy SHUEN
"Consumer cognitive complexity and thedimensionality of multidimensional scalingconfigurations", May 1988.
"The financial fallout from Chernobyl: riskperceptions and regulatory response", May 1988.
"Creation, adoption, and diffusion ofinnovations by subsidiaries of multinationalcorporations", June 1988.
"International manufacturing: positioningplants for success", June'1988.
"The importance of flexibility inmanufacturing", June 1988.
"Flexibility: an important dimension inmanufacturing", June 1988.
"A strategic analysis of investment in flexiblemanufacturing systems", July 1988.
"A Predictive Test of the NBD Model thatControls for Non-stationarity", June 1988.
"Regulating Price-Liability Competition ToImprove Velfare", July 1988.
"The Motivating Role of Envy : A ForgottenFactor in Management, April 88.
"The Leader as Mirror : Clinical Reflections",July 1988.
"Anomalous price behavior around repurchasetender offers". August 1988.
"Assymetry in the EMS: intentional orsystemic?", August 1988.
"Organizational development in thetransnational enterprise", June 1988.
"Croup decision support systems implementBayesian rationality', September 1988.
"The state of the art and future directionsin combining forecasts", September 1988.
'An empirical investigation of internationalasset pricing", November 1986, revised August1988.
"Prom intent to outcome: a process frameworkfor partnerships", August 1988.
88/28 Sumantra GHOSHAL and
"The multinational corporation as a network:C. A. BARTLETT
perspectives from interorganizational theory',May 1988.

88/47 Alain BULTEZ,Els GIJSBRECHTS,Philippe NAERT andPiet VANDEN ABEELE
88/48 Michael BURDA
88/49 Nathalie DIERKENS
88/50 Rob VEITZ andArnoud DE MEYER
88/51 Rob VEITZ
88/52 Susan SCHNEIDER andReinhard ANGELMAR
88/53 Manfred KETS DE VRIES
88/54 Lars-Hendrik ROLLERand Mihkel M. TOMBAK
88/55 Peter BOSSAERTSand Pierre HILLION
88/56 Pierre HILLION
88/57 Vilfried VANHONACKERand Lydia PRICE
88/58 8. SINCLAIR-DESGAGNEand Mihkel M. TOMBAK
*Asymmetric cannibalism between substituteitems listed by retailers", September 1988.
"Reflections on "Wait unemployment' inEurope, II", April 1988 revised September 1988.
"Information asymmetry and equity issues",September 1988.
"Managing expert systems: from inceptionthrough updating", October 1987.
"Technology, work, and the organization: theimpact of expert systems", July 1988.
"Cognition and organizational analysis: who'sminding the store?", September 1988.
"Vhatever happened to the philosopher-king: theleader's addiction to power, September 1988.
"Strategic choice of flexible productiontechnologies and welfare implications",October 1988
"Method of moments tests of contingent claimsasset pricing models", October 1988.
"Size-sorted portfolios and the violation ofthe random walk hypothesis: Additionalempirical evidence and implication for testsof asset pricing models", June 1988.
"Data transferability: estimating the responseeffect of future events based on historicalanalogy", October 1988.
"Assessing economic inequality", November 1988.
88/63 Fernando NASCIMENTOand Vilfried R.VANHONACKER
88/64 Kasra FERDOVS
88/65 Arnoud DE MEYERand Kasra FERDOWS
88/66 Nathalie DIERKENS
88/67 Paul S. ADLER andKasra FERDOWS
1989
89/01 Joyce K. BYRER andTavfik JELASSI
89/02 Louis A. LE BLANCand Tavfik JELASSI
89/03 Beth H. JONES andTavfik JELASSI
89/04 Kasra FERDOVS andArnoud DE MEYER
89/05 Martin KILDUFF andReinhard ANGELMAR
89/06 Mihkel M. TOMBAK andB. SINCLAIR-DESGAGNE
"Strategic pricing of differentiated consumerdurables in a dynamic duopoly: a numericalanalysis", October 1988.
"Charting strategic roles for internationalfactories", December 1988.
"Quality up, technology down", October 1988.
"A discussion of exact measures of informationassymetry: the example of Myers and MaJlufmodel or the importance of the asset structureof the firm", December 1988.
"The chief technology officer", December 1988.
"The impact of language theories on DSSdialog", January 1989.
"DSS software selection: a multiple criteriadecision methodology", January 1989.
"Negotiation support: the effects of computerintervention and conflict level on bargainingoutcome", January 1989."Lasting improvement in manufacturingperformance: In search of a new theory",January 1989.
"Shared history or shared culture? The effectsof time, culture, and performance oninstitutionalization in simulatedorganizations", January 1989.
"Coordinating manufacturing and businessstrategies: I", February 1989.
88/59 Martin KILDUFF
"The interpersonal structure of decision
89/07 Damien J. NEVEN
"Structural adjustment in European retailmaking: a social comparison approach to
banking. Some view from industrialorganizational choice", November 1988. organisation", January 1989.
88/60 Michael BURDA
88/61 Lars-Hendrik ROLLER
88/62 Cynthia VAN HULLE,Theo VERMAELEN andPaul DE WOUTERS
"Is mismatch really the problem? Some estimatesof the Chelvood Cate II model with US data",September 1988.
"Modelling cost structure: the Bell Systemrevisited", November 1988.
"Regulation, taxes and the market for corporatecontrol in Belgium", September 1988.
89/08 Arnoud DE MEYER andHellmut SCHOTTE
89/09 Damien NEVEN,Carmen MATUTES andMarcel CORSTJENS
89/10 Nathalie DIERKENS,Bruno GERARD andPierre HILLION
"Trends in the development of technology andtheir effects on the production structure inthe European Community", January 1989.
"Brand proliferation and entry deterrence",February 1989.
"A market based approach to the valuation ofthe assets in place and the growthopportunities of the firm", December 1988.

89/11 Manfred KETS DE VRIESand Alain NOEL
89/12 Vilfried VANHONACKER
89/13 Manfred KETS DE VRIES
89/14 Reinhard ANGELMAR
89/15 Reinhard ANGELMAR
89/16 Vilfried VANHONACKER,Donald LEHMANN andFareena SULTAN
89/17 Gilles AMADO,Claude FAUCHEUX andAndre LAURENT
89/18 Srinivasan BALAK-RISHNAN andMitchell KOZA
89/19 Vilfried VANHONACKER,Donald LEHMANN andFareena SULTAN
89/20 Vilfried VANHONACKERand Russell VINER
89/21 Arnoud de MEYER andKasra FERDOVS
89/22 Manfred KETS DE VRIESand Sydney PERZOW
89/23 Robert KORAJCZYK andClaude VIALLET
89/24 Martin KILDUFF andMitchel ABOLAFIA
89/25 Roger BETANCOURT andDavid GAUTSCHI
89/26 Charles BEAN,Edmond MALINVAUD,Peter BERNHOLZ,Francesco GIAVAllIand Charles VYPLOSZ
"Understanding the leader-strategy interface:application of the strategic relationshipinterviev method", February 1989.
"Estimating dynamic response models vhen thedata are subject to different temporalaggregation", January 1989.
"The impostor syndrome: a disquietingphenomenon in organizational life', February1989.
"Product innovation: a tool for competitiveadvantage", March 1989.
"Evaluating a firm's product innovationperformance", March 1989.
"Combining related and sparse data in linearregression models*, February 1989.
"Changement organisationnel et realitisculturelles: contrastes franco-americains",March 1989.
"Information asymmetry, market failure andjoint-ventures: theory and evidence",March 1989
"Combining related and sparse data in linearregression models",Revised March 1989
"A rational random behavior model of choice",Revised March 1989
"Influence of manufacturing improvementprogrammes on performance", April 1989
"What is the role of character inpsychoanalysis? April 1989
"Equity risk preaia and the pricing of foreignexchange risk" April 1989
"The social destruction of reality:Organisational conflict as social drama"April 1989
"Two essential characteristics of retailmarkets and their economic consequences"March 1989
"Macroeconomic policies for 1992: thetransition and after", April 1989
89/27 David KILWKHARDT andMartin KILDUFF
89/28 Martin KILDUFF
89/29 Robert GOGEL andJean-Claude LARRECHE
89/30 Lars-Hendrik ROLLERand Mihkel M. TONBAK
89/31 Michael C. BURDA andStefan GERLACH
89/32 Peter HAUL andTavfik JELASSI
89/33 Bernard SINCLAIR-DESGAGNE
89/34 Sumantra GROSHAL andNittin NOHRIA
89/35 Jean DERMINE andPierre MILLION
89/36 Martin KILDUFF
89/37 Manfred KETS DE VRIES
89/38 Nanfrd KETS DE VRIES
89/39 Robert KORAJCZYK andClaude VIALLET
89/40 Balaji CHAKRAVARTRY
89/41 B. SINCLAIR-DESGAGNEand Nathalie DIERKENS
89/42 Robert ANSON andTavfik JELASSI
89/43 Michael BURDA
89/44 Balaji CHAKRAVARTHYand Peter LORANGE
89/45 Rob WEITZ andArnoud DE MEYER
"Friendship patterns and cultural attributions:the control of organizational diversity',April 1989
"The interpersonal structure of decisionmaking: a social comparison approach toorganizational choice", Revised April 1989
"The battlefield for 1992: product strengthand geographic coverage", May 1989
"Competition and Investment in FlexibleTechnologies", May 1989
"Intertemporal prices and the US trade balancein durable goods", July 1989
"Application and evaluation of a multi-criteriadecision support system for the dynamicselection of U.S. manufacturing locations",May 1989
"Design flexibility in monopsonisticindustries", May 1989
"Requisite satiety versus shared values:managing corporate-division relationships inthe M-Form organisation", May 1989
"Deposit rate ceilings and the market value ofbanks: The case of France 1971-1981", May 1989
"A dispositional approach to social networks:the case of organizational choice", May 1989
"The organisational fool: balancing a leader'shubris", May 1989
"The CEO blues", June 1989
"An empirical investigation of internationalasset pricing", (Revised June 1989)
"Management systems for innovation andproductivity", June 1989
"The strategic supply of precisions", June 1989
"A development framework for computer-supportedconflict resolution", July 1989
'A note on firing costs and severance benefitsin equilibrium unemployment", June 1989
"Strategic adaptation in multi-business firms",June 1989
"Managing expert systems: a framework and casestudy", June 1989

89/46 Marcel CORSTJENS,Carmen NAMES andDamien NEVEN
89/47 Manfred KETS DE VRIESand Christine MEAD
89/48 Damien NEVEN andLars-Hendrik ROLLER
89/49 Jean DERMINE
89/50 Jean DERMINE
89/51 Spyros MAKRIDAKIS
89/52 Arnoud DE MEYER
89/53 Spyros MAKRIDAKIS
89/54 S. BALAKRISHNANand Mitchell KOZA
89/55 H. SCHUTTE
89/56 Wilfried VANHONACKERand Lydia PRICE
89/57 Taekvon KIM,Lars-Hendrik ROLLERand Mihkel TONBAK
89/58 Lars-Hendrik ROLLER(EP,TM) and Mihkel TOMBAK
89/59 Manfred KETS DE VRIES,(08) Daphna ZEVADI,
Alain NOEL andMihkel TOMBAK
89/60 Enver YliCESAN and(TM) Lee SCHRUBEN
89/61 Susan SCHNEIDER and(All) Arnoud DE MEYER
"Entry Encouragement", July 1989
"The global dimension in leadership andorganization: issues and controversies",April 1989
'European integration and trade floes",August 1989
'Rome country control and mutual recognition",July 1989
"The specialization of financial institutions,the EEC model", August 1989
"Sliding simulation: a nev approach to timeseries forecasting", July 1989
"Shortening development cycle times: amanufacturer's perspective", August 1989
"Vhy combining vorks?", July 1989
"Organisation costs and a theory of jointventures", September 1989
"Euro-Japanese cooperation in informationtechnology", September 1989
"On the practical usefulness of mete-analysisresults", September 1989
'Market growth and the diffusion ofmultiproduct technologies", September 1989
"Strategic aspects of flexible productiontechnologies", October 1989
"Locus of control and entrepreneurship: athree-country comparative study", October 1989
"Simulation graphs for design and analysis ofdiscrete event simulation models", October 1989
"Interpreting and responding to strategicissues: The impact of national culture",October 1989
"Complexity of simulation models: A graphtheoretic approach", November 1989
"MARS: A mergers and acquisitions reasoningsystem", November 1989
"On the regulation of procurement bids",November 1989
'Market microstructure effects of governmentintervention in the foreign exchange market",December 1989
89/64 Enver YUCESAN and(TM) Lee SCHRUBEN
89/65 Soumitra DUTTA and(TM, Piero BONISSONEAC, PIN)
89/66 B. SINCLAIR-DESCAGNE(TM,EP)
89/67 Peter BOSSAERTS and(FIN) Pierre HILLION
89/62 Arnoud DE MEYER
"Technology strategy and international R 6 D(TN) operations", October 1989
89/63 Enver ItICESAN and
"Equivalence of simulations: A graph theoretic(TN) Lee SCHRUBEN
approach", November 1989

1990 90/16 Richard LEVICH and "Tax-Driven Regulatory Drag: EuropeanFIN Ingo WALTER Financial Centers in the 1990's", January 1990
90/01 B. SINCLAIR-DESCACNE 'Unavoidable Mechanisms", January 1990
TM/EP/AC 90/17FIN
Nathalie DIERKENS "Information Asymmetry and Equity Issues",Revised January 1990
90/02 Michael BURDA "Monopolistic Competition, Costs of
EP Adjustment, and the Behaviour of European 90/18 Wilfried VANHONACKER "Managerial Decision Rules and the EstimationManufacturing Employment", January 1990 MKT of Dynamic Sales Response Models", Revised
90/03 Arnoud DE MEYER "Management of Communication in InternationalJanuary 1990
TM Research and Development", January 199090/19 Beth JONES and "The Effect of Computer Intervention and Task
90/04FIN/EP
Gabriel HAVAVINI and 'The Transformation of the European Financial
Eric RAJENDRA Services Industry: From Fragmentation to
TM Tavfik JELASSI Structure on Bargaining Outcome", February
1990
Integration', January 1990
90/05 Gabriel HAVAVINI and, 'European Equity Markets: Toward 1992 and90/20TM
Tavfik JELASSI,Gregory KERSTEN and
"An Introduction to Group Decision and
Negotiation Support", February 1990
FIN/EP Bertrand JACOUILLAT Beyond", January 1990 Stanley ZIONTS
90/06 Gabriel HAVAVINI and 'Integration of European Equity Markets: 90/21 Roy SMITH and "Reconfiguration of the Global SecuritiesFIN/EP Eric RAJENDRA Implications of Structural Change for Key FIN Ingo WALTER Industry in the 1990's", February 1990
Market Participants to and Beyond 1992',
January 1990 90/22 Ingo WALTER "European Financial Integration and ItsFIN Implications for the United States", February
90/07FIN/EP
Gabriel HAVAVINI "Stock Market Anomalies and the Pricing of
Equity on the Tokyo Stock Exchange", January1990
199090/23 Damien NEVEN "EEC Integration towards 1992: Some
90/08 Tavfik JELASSI and 'Modelling vith MCDSS: What about Ethics?".EP/SM Distributional Aspects", Revised December 1989
TM/EP B. SINCLAIR-DESCACNE January 199090/24 Lars Tyge NIELSEN "Positive Prices in CAPM", January 1990
90/09EP/FIN
Alberto CIOVANNINI "Capital Controls and International Trade
and Jae WON PARK Finance", January 1990
PIN/EP
90/25 Lars Tyge NIELSEN "Existence of Equilibrium in CAPE", January
90/10 Joyce BRYER and "The Impact of Language Theories on DSS PIN/EP 1990TM Tavfik JELASSI Dialog", January 1990
90/26 Charles KADUSHIW and "Why networking Pails: Double Binds and the90/11TM
Enver YUCESAN "An Overviev of Frequency Domain Methodologyfor Simulation Sensitivity Analysis",
January 1990
0B/BP
90/27
Michael BRINE
Abbas FOROUGHI and
Limitations of Shadow Networks", February 1990
"NSS Solutions to Major Negotiation Stumbling
90/12 Michael BURDA "Structural Change, Unemployment Benefits andTM Tavfik JELASSI Blocks", February 1990
EP High Unemployment: A U.S.-EuropeanComparison", January 1990
90/28TM
Arnoud DE MEYER "The Manufacturing Contribution toInnovation". February 1990
90/13TX
Soumitra DUTTA and "Approximate Reasoning about Temporal
Shashi SHEKHAR Constraints in Real Time Planning and Search",
January 1990
90/29FIN/AC
Nathalie DIERKENS "A Discussion ut Correct. Measures ofInformation Asymmetry", January 1990
90/14 Albert ANCEHRN and 'Visual Interactive Modelling and Intelligent 90/30 Lars Tyge NIELSEN "The Expected Utility of Portfolios of
TM Hans-Jakob Lt1THI DSS: Putting Theory Into Practice". FIN/EP Assets", March 1990
January 1990
90/15 Arnoud DE MEYER, "The Internal Technological Renewal of a
TM Dirk DESCHOOLMEESTER, Business Unit vith a Mature Technology",
Rudy MOENAERT and January 1990
Jan BARBE