What Defines Nanomaterials? - RIVM
80
Imagine the result Request A1: Rijksinstituut voor Volksgezondheid en Milieu (National Institute for Public Health and the Environment; RIVM) What Defines Nanomaterials? TENDER EU 2011/S 120-199032 COMPANY NO. 4410000004 5 October 2012
Transcript of What Defines Nanomaterials? - RIVM

Imagine the result
Request A1: Rijksinstituut voor Volksgezondheid en Milieu (National Institute for Public Health and the Environment; RIVM)
What Defines Nanomaterials?
TENDER EU 2011/S 120-199032
COMPANY NO. 4410000004
5 October 2012
Request A1: What Defines Nanomaterials?
Christopher Hassinger Staff Scientist Kathleen Sellers, PE Principal Environmental Engineer
Prepared for:
National Institute for Public Health and the Environment (RIVM)
Prepared by:
ARCADIS NEDERLAND BV Utopialaan 40-48 P.O. Box 1018 5200 BA ’s-Hertogenbosch The Netherlands www.arcadis.nl
Our Ref.:
B0036258
Date:
5 October 2012 This document is intended only for the use of the individual or entity for which it was prepared and may contain information that is privileged, confidential and exempt from disclosure under applicable law. Any dissemination, distribution or copying of this document is strictly prohibited.

http://team/clients/rivm/shared documents/a1 - what defines nanomaterials/report/rivm_a1_final report.doc i
Table of Contents
List of Tables iii
List of Figures iii
List of Appendices iii
Executive Summary 1
1 Introduction 4
2 Defining Critical Physicochemical Properties 6
2.1 Identifying Critical Properties 6
2.2 Screening for Physicochemical Properties 6
2.3 Literature Search 14
3 Results 15
3.1 Surface Morphology 16
3.2 Crystalline Structure 17
3.2.1 Basis for Evaluation 18
3.2.2 Change in Lattice Parameters with Particle Size 20
3.2.2.1 Lattice Contraction 20
3.2.2.2 Lattice Expansion 21
3.2.3 Stability of Different Crystalline Structures at Different Particle Sizes 23
3.2.4 Effect of Particle Size on Phase Transformation 24
3.2.5 Formation of Otherwise Unstable Structures at Nanoscale 24
3.2.6 No Change in Lattice Structure with Particle Size 25
3.2.7 Summary 25
3.3 Water Solubility 26
3.3.1 Increased Rate of Dissolution 26
3.3.2 Effect on Equilibrium Solubility Concentration 28
3.3.3 Summary 30

http://team/clients/rivm/shared documents/a1 - what defines nanomaterials/report/rivm_a1_final report.doc ii
Table of Contents
3.4 Reactivity 30
3.4.1 Iron Oxides 31
3.4.2 Cobalt 32
3.4.3 Palladium 34
3.4.4 Gold 34
3.4.5 Platinum 35
3.4.6 Other Substances 37
3.4.6.1 Metals 37
3.4.6.2 Metal Oxides 38
3.4.6.3 Carbon 39
3.4.7 Summary 39
3.5 Photocatalytic Reactivity 40
3.5.1 Titanium Dioxide 40
3.5.2 Cadmium Sulphide 41
3.5.3 Gold–Titanium Dioxide and Other Gold Nanoparticles 41
3.5.4 Summary 42
4 Discussion 43
4.1 High Priority Properties 43
4.2 Lower Priority Properties 45
4.3 Recommendations 45
4.3.1 Adequacy of Data with Respect to Common Nanomaterials 45
4.3.2 Adequacy of Data with Respect to Parameters Characterised 48
5 Conclusions 50
6 References 53

http://team/clients/rivm/shared documents/a1 - what defines nanomaterials/report/rivm_a1_final report.doc iii
Table of Contents
List of Tables Table 1. Physicochemical Properties with Potential Size Thresholds 7
Table 2. Physicochemical Properties Not Selected in Screening Evaluation 12
Table 3. Catalogue of Relevant Papers 15
Table 4. Observations of Lattice Contraction and Expansion and Phase Change 26
Table 5. ‘Bright Line’ Thresholds Identified in the Literature Review 44
List of Figures Figure 1. Size Distribution of Particles Studied 16
Figure 2. Nanomaterials Found Most Frequently in Consumer Products 47
Figure 3. Number of Studies Reviewed for Each Substance 48
List of Appendices A. Literature Search
B. Copy of Database

http://team/clients/rivm/shared documents/a1 - what defines nanomaterials/report/rivm_a1_final report.doc 1
Request A1: What Defines Nanomaterials?
ACKNOWLEDGMENT
This study is the result of a project commissioned by the Dutch National Institute for Public Health and the Environment (RIVM) under contract reference EU 2011/S120-199032 Request A1. In addition to the financial support, we thank RIVM for the valuable scientific discussions and contributions.

http://team/clients/rivm/shared documents/a1 - what defines nanomaterials/report/rivm_a1_final report.doc 2
Request A1: What Defines Nanomaterials?
Executive Summary
The aim of this project is to determine which physicochemical properties make a nanomaterial different from a ‘conventional’ material and at what size these properties are changed to ‘nanospecific’ properties. These size thresholds can then be used to prepare the Dutch input into the foreseen review of nanomaterial definition.
This work is being done within the context of the European Commission (2011) definition of “nanomaterial”, which is:
A natural, incidental or manufactured material containing particles, in an unbound state or as an aggregate or as an agglomerate and where, for 50% or more of the particles in the number size distribution, one or more external dimensions is in the size range 1 nm to 100 nm.
In specific cases and where warranted by concerns for the environment, health, safety or competitiveness the number size distribution threshold of 50% may be replaced by a threshold between 1 and 50%.
By derogation from the above, fullerenes, graphene flakes and single wall carbon nanotubes with one or more external dimensions below 1 nm should be considered as nanomaterials.
The work began with the selection and prioritisation of physicochemical parameters that were thought to be particularly relevant to nanomaterials and to the regulation of chemical substances under the European Community Regulation on chemicals and their safe use (EC 1907/2006) Registration, Evaluation, Authorisation and Restriction of Chemical substances (REACH). This report focuses on the following parameters, judged to be of highest priority: surface morphology and crystalline structure, water solubility, reactivity, and photocatalytic reactivity. A summary of the research on each of these parameters follows. More detailed descriptions of published research are provided in the body of this report and in an appended database.
Surface morphology was included in the literature review based on initial information that surface morphology may affect the rate of dissolution and equilibrium solubility and that morphology can depend in part on size for very small nanoparticles. However, the literature search identified few papers that discussed size-related effects on morphology. While these papers suggest that in some cases the shape and structure of an inorganic particle may depend upon its size, the data are too few to draw general conclusions about the size dependence of morphology or its relevance to the definition of a nanomaterial. Additional information is available regarding the effect of size on crystalline structure, a specific aspect of morphology.

http://team/clients/rivm/shared documents/a1 - what defines nanomaterials/report/rivm_a1_final report.doc 3
Request A1: What Defines Nanomaterials?
Several aspects of the crystallinity of metals and metal oxides may vary with particle size. With changes in particle size the unit cell can contract or expand, as represented by changes in lattice parameters. Particles of two different sizes can also assume different crystalline phases. While many studies have demonstrated size-related effects, no simple conclusions can be drawn to inform the definition of nanomaterial.
Decreasing the particle size can increase the rate at which a substance dissolves and can also increase the equilibrium solubility concentration. The former phenomenon is well known in the pharmaceutical industry, where poorly-soluble drugs are often “nanosized” to increase their bioavailability. No clear distinction of a threshold size-related effect exists to support a definition of nanomaterial, however. The increase in the equilibrium solubility concentration with decreasing particle size has a basis in thermodynamics theory. Some experimental data with silver (5 to 80 nm), titanium dioxide (ca. 10, 30 nm), zinc oxide (26, 216 nm), and zinc sulphide (1 to 3 nm, bulk) do show an increase in solubility for nanoscale particles relative to the corresponding bulk material. However the data do not suffice to inform the definition of a nanomaterial.
The literature on reactivity generally centres on the use of metal and metal oxide nanoparticles as catalysts. Almost all studies reporting a size effect noted an inverse relationship between size and catalytic reactivity. Maximum catalytic activity generally occurred at particle sizes below 15 to 20 nm, with a sharp change in reactivity below approximately 5 nm in some cases. Many of the studies focused on particles below 100 nm and, because the European Commission definition sets an upper size limit for nanomaterials of 100 nm, such studies do not provide direct perspective on the definition of a nanomaterial.
Researchers have studied the effect of particle size on the photocatalytic reactivity of certain metal oxides and sulphides. The studies summarised herein generally showed that photoreactivity increased with decreasing particle size. In some cases the behaviour of the material changed at a particle size of approximately 5 to 10 nm.
In summary, most of the studies described in this report indicate that the physical chemical parameters evaluated do depend on particle size at the nanoscale. The particle size at which effects occur can vary with the property, the material tested, and the experimental conditions. Researchers are beginning to elucidate the thermodynamic and quantum mechanical basis for these effects. However, neither the experimental data nor the theoretical explanations for those data currently suffice to define the size at which these properties are changed to ‘nanospecific’ properties.

http://team/clients/rivm/shared documents/a1 - what defines nanomaterials/report/rivm_a1_final report.doc 4
Request A1: What Defines Nanomaterials?
1 Introduction
The aim of this project is to determine which physicochemical properties make a nanomaterial different from a ‘conventional’ material and at what size these properties are changed to ‘nanospecific’ properties. These size thresholds can then be used to prepare the Dutch input into the foreseen review of nanomaterial definition.
This work is being done within the context of the European Commission (2011) definition of “nanomaterial”, which is:
A natural, incidental or manufactured material containing particles, in an unbound state or as an aggregate or as an agglomerate and where, for 50% or more of the particles in the number size distribution, one or more external dimensions is in the size range 1 nm to 100 nm.
In specific cases and where warranted by concerns for the environment, health, safety or competitiveness the number size distribution threshold of 50% may be replaced by a threshold between 1 and 50%.
By derogation from the above, fullerenes, graphene flakes and single wall carbon nanotubes with one or more external dimensions below 1 nm should be considered as nanomaterials.
The European Commission (2011) also notes that:
Technological development and scientific progress continue with great speed. The definition including descriptors should therefore be subject to a review by December 2014 to ensure it corresponds to the needs. In particular, the review should assess whether the number size distribution threshold of 50% should be increased or decreased and whether to include materials with internal structure or surface structure in the nanoscale such as complex nanocomponent nanomaterials including nanoporous and nanocomposite materials that are used in some sectors.
Certain physicochemical properties depend on particle size. This effect generally results from three phenomena:
• Decreasing the particle size increases the proportion of atoms or molecules on the surface of the particle. Consequently, for example, the rate of dissolution increases and the relative rate of reactivity can increase.
• Atoms at the surface of a particle experience a different local environment than do atoms in the bulk of the material. Each of the atoms on the particle surface is surrounded by fewer atoms than it would be if it were located in the middle of the particle. As a result, the energy associated with those atoms, known as the

http://team/clients/rivm/shared documents/a1 - what defines nanomaterials/report/rivm_a1_final report.doc 5
Request A1: What Defines Nanomaterials?
“surface free energy” differs from the free energy associated with atoms in the centre of the particle. This effect becomes significant in particles at the nanoscale (Dingreville et al., 2005). The energetic condition at the surface of the particle can also reflect, in part, the strain associated with the curvature of the surface, which becomes more pronounced as the particle diameter decreases; this surface stress can be especially pronounced in particles on the order of a few nanometers (Ma et al., 2012). The surface free energy associated with nanoparticles can affect such fundamental physical properties as the melting point, heat capacity, and equilibrium solubility.
• For certain of the smallest particles, such as quantum dots,1 the nanoscale results in quantum confinement. That is, when the diameter of the particle is of the same magnitude as the wavelength of the electron wave function (or in other words, when the electrons and electron holes in the crystal are squeezed into a dimension that approaches the “exciton Bohr radius”), the electrical and optical properties of the particle differ substantially from those of the bulk counterpart.
Parameters that are either required to characterise chemical substances under REACH and/or identified by authorities as important for characterising nanomaterials were identified and evaluated with respect to their dependence on particle size. Wherever possible, the characteristics of particles at sizes less than 100 nm were compared to the characteristics of the “bulk” material. For the purpose of this study, “bulk” material comprised particles > 100 nm in size. Some researchers have defined “bulk” using other criteria, such as > 1000 nm in size. Where this report cites such work, the relevant “bulk” particle size is indicated.
A literature search identified relevant papers, which were obtained, summarised, and evaluated with respect to the weight of evidence indicating the size dependence of physicochemical properties.
1 Quantum dots are semiconductor nanocrystals of various sizes and compositions, typically comprising a CdSe, CdTe, ZnSe, or PbSe core surrounded by a zinc or cadmium sulfide shell. For some applications, they are encapsulated with amphiphilic polymers. A quantum dot can be on the order of 4 to 20 nm, depending on the size of the crystal and the surface coating. (Mahendra et al., 2008)

http://team/clients/rivm/shared documents/a1 - what defines nanomaterials/report/rivm_a1_final report.doc 6
Request A1: What Defines Nanomaterials?
2 Defining Critical Physicochemical Properties
2.1 Identifying Critical Properties
The objective of this task was to identify the physicochemical properties that are considered to be important for risk assessment of nanomaterials (i.e., those properties that potentially influence hazard and exposure, both for humans and the environment), which may be influenced by particle size. ARCADIS surveyed the following sources of information to identify these properties:
• Recommendations from government agencies, non-governmental organisations (NGOs) or committees/task forces (authoritative recommendations) regarding critical properties:
• Compilations of information on the behaviour of nanomaterials
• Scientific literature on the behaviour of nanomaterials.
Specific sources are indicated below (Tables 1 and 2).
Properties identified by any of these sources as being important for the risk assessment of nanomaterials were recorded for prioritisation as described below.
2.2 Screening for Physicochemical Properties
The next step was to prioritise the physicochemical properties identified in the previous step. Three categories of priority were established: low, medium and high.
Parameters that are either required to characterise chemical substances under REACH and/or identified by authorities as important for characterising nanomaterials were identified and evaluated with respect to their dependence on particle size. Properties which are the most likely candidates for which size thresholds can be found were categorised as low/medium/high priority and were considered further in the screening evaluation (Table 1). Categories were assigned to each property by evaluating the overall importance of the property for risk assessment and the possibility of size-dependence as determined by the literature search and expert judgment.
Properties that are not relevant to nanoparticles or else do not appear to be size dependent were not selected in the screening evaluation (Table 2).

http://team/clients/rivm/shared documents/a1 - what defines nanomaterials/report/rivm_a1_final report.doc 7
Request A1: What Defines Nanomaterials?
Table 1. Physicochemical Properties with Potential Size Thresholds
Endpoint Screening Evaluation Priority for Literature Search Reference
Appearance/ physical state/colour
The colour of certain materials can change as the particle size decreases. This parameter does not relate directly to risk assessment, but colour change is an easily-observed indicator of quantum effects resulting from size change. The shape of a nanomaterial can also affect its toxicity, although the physical appearance of a nanomaterial will not be observable simply by looking at the material.
Low
Expert judgment
Melting point/freezing point
The melting point of certain nanoparticles (e.g., metallic species) can be lower than bulk counterparts. For example, Luo et al. (2008) found that for nanosilver particles, the melting point decreased from approximately 1180 K for a 20-nm particle to 1000 K for a 5-nm particle. While this may be an important characteristic in certain circumstances, it is unlikely to be relevant under the ambient conditions typically considered in risk characterisation.
Low Luo et al. (2008)
Boiling point While the free energy associated with phase change can be affected by particle size, this parameter is not likely to be relevant to solid particles under the ambient conditions typically considered in risk characterisation.
Low Expert judgment
Particle size distribution (granulometry)
Critical property that reflects particle size, but not a consequence of particle size per se. Analysts use different techniques to determine particle size, which can affect the measurements.
Low
(relates to particle size; not used as an independent search term)
Expert judgment

http://team/clients/rivm/shared documents/a1 - what defines nanomaterials/report/rivm_a1_final report.doc 8
Request A1: What Defines Nanomaterials?
Endpoint Screening Evaluation Priority for Literature Search Reference
Partition coefficient (octanol/water)
The n-octanol/water partition coefficient (Kow) is defined as the ratio of the equilibrium concentrations of a dissolved substance in a two-phase system comprising n-octanol and water (ECHA, 2008). It does not characterise the behaviour of particles suspended in a solution. SCENIHR (2009) concluded that Kow could be an important parameter for soluble nanomaterials, citing work on fullerenes.
Low
(not relevant to particles in suspension, although may be important for soluble nanomaterials; sorption behaviour of suspended particles described by DLVO2 theory rather than by Kow, which pertains to dissolved materials)
Expert judgment;
Hansen et al. (2011)
SCENIHR, 2009
Solubility in organic solvents/ fat solubility
By analogy to water solubility, may vary with particle size. May also be affected by the particle coating.
Not directly linked to risk assessment, however; the fat solubility has essentially been replaced by the octanol water partition coefficient in the characterisation of chemicals.
Low Expert judgment
2 Derjaguin and Landau, Verwey and Overbeek (DLVO) theory describes forces between charged surfaces contained in a liquid medium.

http://team/clients/rivm/shared documents/a1 - what defines nanomaterials/report/rivm_a1_final report.doc 9
Request A1: What Defines Nanomaterials?
Endpoint Screening Evaluation Priority for Literature Search Reference
Relative surface area
Related to particle size, shape, and porosity. As the size of a particle decreases, the ratio of surface area to volume increases or, in other words, the proportion of the atoms on the surface of the particle increases. Important with respect to rate of reaction, dissolution, and adsorption. Specific surface area appears to be relevant for a number of parameters for toxicological and ecological risk assessment. It will dictate the surface charge density in cases where nanomaterials are surface functionalised, which has direct consequences on (a) nanomaterial interaction (i.e., agglomeration) with other naturally occurring particulate matter (i.e., contaminant vectors); (b) route of exposure as a function of surface ligand-biological interface (i.e., bioaccumulation pathway, bioavailability); and (c) mechanisms of toxicity (OECD, 2010). Highlighted in European Commission (2011) Recommendations as metric that may be used to characterise nanomaterials in future.
Low (Although surface area is an important property for risk assessment, it is directly related to particle size and, therefore, is not used as an independent search term.)
SCENIHR (2007,2009,2010)
EDF/DuPont (2007)
U.S. EPA (2007a,2007b)
OECD (2009a, 2010)
JRC (2011)
BAUA (2007)
ENRHES (2009)
NICNAS (2010)
U.S. FDA (2010)
NIOSH (2009)
Dustiness This parameter refers to the propensity to generate airborne dust during handling. Data provide a basis for estimating the potential health risk due to inhalation exposure. The ability to generate dust depends on particle size and density (thereby buoyancy).
Low OECD (2009a,2010)
EDF/DuPont (2007)
Flammability Flammability may be related to particle size Medium Expert judgment
Auto flammability The relative self-ignition temperature is defined for solids as the minimum temperature at which a certain volume of a substance will ignite under defined conditions. For solids the self-ignition temperature will also depend on the particle size (ECHA, 2008).
Medium Expert judgment
Explosiveness Explosiveness can be related to particle size. In general dust explosions may occur when the particle diameter is smaller than 1 to 0.1 mm. The combustion rate increases with smaller particle sizes with an optimal combustion at particle diameters of approximately 10 to 15 μm (Eckhoff, 2003, as cited in Pronk et al., 2009).
Medium, with respect to defining nanomaterial but an important parameter when establishing physical hazards.
Expert judgment

http://team/clients/rivm/shared documents/a1 - what defines nanomaterials/report/rivm_a1_final report.doc 10
Request A1: What Defines Nanomaterials?
Endpoint Screening Evaluation Priority for Literature Search Reference
Oxidising properties
An oxidising substance is one that may cause or contribute to the combustion of other materials as an oxygen donor. For the majority of substances, oxidising properties are not a concern; it may be of concern for certain metal oxides, for example. (ECHA, 2008). While reactivity may be increased with decreasing particle size, this parameter was not judged to be a priority for the literature search and may be reflected in the search regarding “reactivity”.
Medium Expert judgment
Magnetism A magnetic attraction between certain materials, such as nano-zerovalent iron, can contribute to agglomeration (U.S. EPA, 2011) and thus influence net particle size and behaviour. May be related to size (Park et al., 2007).
Medium SCENIHR (2007)
Park et al. (2007)
Crystalline structure
The crystalline phase refers to how molecules are physically arranged in space (OECD, 2010). Many materials with the same chemical composition can have different lattice structures, and exhibit different physicochemical properties. Several structural investigations on inorganic nanoparticles indicate that also the crystal lattice type may have an important role on the overall bulk lattice. The size reduction may create discontinuous crystal planes that increase the number of structural defects, as well as disrupt the electronic configuration of the material, with possible toxicological consequences (ENRHES, 2009). In short, decreasing particle size can affect the crystalline structure (Gilbert et al., 2004; Auffan et al., 2009). The crystalline structure can affect the toxicity of certain nanomaterials (Auffan et al., 2009).
High
(although only relevant to certain types of nanomaterials capable of crystalline ordering)
ENHRES, 2009
Gilbert et al. (2004)
Auffan et al. (2009)
See also:
EDF/DuPont (2007)
OECD (2010)
U.S. EPA (2007a)
SCENIHR (2007, 2010)
U.S. FDA (2010)
Water solubility The rate of dissolution of soluble materials increases with decreasing particle size. Further, the Ostwald-Freundlich equation predicts that equilibrium solubility should increase with decreasing particle size. Experimentally, this is often not the case due to non-ideal behaviour. Water solubility also depends upon the solution characteristics and can depend on the particle coating.
High Borm (2006)

http://team/clients/rivm/shared documents/a1 - what defines nanomaterials/report/rivm_a1_final report.doc 11
Request A1: What Defines Nanomaterials?
Endpoint Screening Evaluation Priority for Literature Search Reference
Surface morphology
Surface morphology may affect rate of dissolution and equilibrium solubility (Borm et al., 2006). Morphology can be affected by particle size (Auffan et al., 2009).
High
(potential to affect fundamental physical/chemical properties that pertain to behaviour in the environment)
Borm et al. (2006)
Auffan et al. (2009)
Reactivity (including redox activity and ability to generate Reactive Oxygen Species)
Decreasing particle size affects surface free energy. Reactivity is further increased due to surface atoms being less stable and the ability to form bonds increases with decreasing size, due to the higher surface free energy (JRC, 2011). “Nanosizing” can markedly affect reactivity. For example, gold, which is inert at bulk scale, becomes an effective oxidation catalyst when the particle size is reduced to a few nanometers (Auffan et al., 2009).
High JRC (2011)
Auffan et. al. (2009)
See also:
SCENIHR (2009)
EDF/DuPont (2007)
JRC (2011)
BAUA (2007)
OECD (2010)
FOPH/FOEN (2011)
NICNAS (2010)
U.S. FDA (2010)
U.S. EPA (2007b)
Photocatalytic activity (photo-activation)
Photoactivity refers to the generation of electron-hole pairs by nanomaterials exposed to light. These electron-hole pairs can produce free-oxygen radicals, which results in oxidation or reduction of molecules in contact with their surfaces (U.S. EPA, 2011). Recent data have indicated that some nanoparticles may, by virtue of their relatively large surface area and reactive potential, become activated by light (SCENIHR, 2009). Photocatalytic activity is highly material dependent. Within materials, it is size dependent (SCENIHR, 2010).
High SCENIHR (2009,2010)
U.S. EPA (2011)
See also:
JRC (2011)
OECD (2010)

http://team/clients/rivm/shared documents/a1 - what defines nanomaterials/report/rivm_a1_final report.doc 12
Request A1: What Defines Nanomaterials?
Table 2. Physicochemical Properties Not Selected in Screening Evaluation
Endpoint Screening Evaluation Comments References
REACH Endpoints
Density Not anticipated to vary with particle size Does not depend on particle size
Expert judgment
Vapour pressure Typically used to characterise liquids and not significant for particles except for those (e.g., naphthalene) which sublime. Unlikely to be relevant to the most common nanomaterials. A nano QSAR model used to predict the toxicity of metal oxides found that ΔHMe+ (which is a function of the enthalpy of sublimation) is related to toxicity; however, the researchers determined that ΔHMe+ was not related to the size of the studied nanoparticles (Puzyn et al., 2011).
Not relevant to nanoparticles under ambient conditions; thought not to relate to particle size
Puzyn et al. (2011)
Surface tension Property of liquids and solutions of soluble surface-active solids in the context of REACH. Not relevant to particles per se. In solids, surface tension is related to the surface free energy (Luo et al., 2008).
Not relevant to nanoparticles
Expert judgment
Flash point Liquid property, not relevant to particles Not relevant to nanoparticles
Expert judgment
Stability in organic solvents and identity of relevant degradation products
There are rare occasions when it is important to have information on the stability of a compound in an organic solvent, to increase confidence in the results of physicochemical or toxicity tests. However, for many substances, stability in organic solvents will not be critical and testing need not be conducted (ECHA, 2008). This property is not likely to be relevant to most nanomaterials, although it is increasingly apparent that the tendency of nanomaterials to agglomerate during storage and testing can affect experimental results.
N/A ECHA (2008)
Dissociation constant
Property characterises acidity or alkalinity of dissolved substances.
Not relevant to nanoparticles
Expert judgment
Viscosity Liquid property, not relevant to particles Not relevant to nanoparticles
Expert judgment

http://team/clients/rivm/shared documents/a1 - what defines nanomaterials/report/rivm_a1_final report.doc 13
Request A1: What Defines Nanomaterials?
Endpoint Screening Evaluation Comments References
Other Properties
Agglomeration state
Agglomeration increases the net particle size, thereby changing the size-dependent characteristics and behaviour of the original nanomaterial (U.S. EPA, 2011). Dependent in part on solution characteristics. Agglomeration can also reportedly be influenced by particle size, as increasing the particle surface area can enhanced the collision frequency between particles and lead to a higher degree of agglomeration (Suttiponparnit et al., 2011).
Directly related to particle size; not an independent variable
SCENIHR (2007,2009)
EDF/DuPont (2007)
U.S. EPA (2007a)
OECD (2009a,2010)
BAUA (2007)
ENRHES (2009)
FOPH/FOEN (2011)
NIOSH (2009)
Dispersibility (ability to dis-aggregate)
Dispersibility refers to the relative number (or mass) of primary particles in a suspending medium in comparison to agglomerates. Not clear that the ability of an insoluble substance to evenly distribute in a solvent is directly related to decreased particle diameter; cited by multiple authoritative sources.
This parameter initially thought not to depend strongly on particle size. During the course of the project, identified one report indicating size dependence.3
SCENIHR (2007,2009)
JRC (2011)
EDF/DuPont (2007)
OECD (2010)
FOPH/FOEN (2011)
Porosity This parameter measures the fraction of the particle that is devoid of material. A material's porosity affects its fate in the environment by affecting particle density and colloidal stability and may permit a nanomaterial to act as a vector for other constituents (OECD, 2010). While this parameter may relate to the degree of agglomeration, it does not depend on primary particle size.
Does not depend on particle size
RIP-oN 1 (JRC, 2011)
EDF/DuPont (2007)
U.S. EPA (2007a)
SCENIHR (2007)
ENRHES (2009)
OECD (2010)
3 Suttiponparnit et al. (2011) tested TiO2 nanoparticles at 6 sizes between 6 and 104 nm, and found that particle size influenced the zeta potential, dispersion isoelectric point (defined by zeta potential equal to zero), and average hydrodynamic diameter of the particles (i.e., agglomeration state). A sharp change in zeta potential occurred between particle sizes of 6 and 16 nm.

http://team/clients/rivm/shared documents/a1 - what defines nanomaterials/report/rivm_a1_final report.doc 14
Request A1: What Defines Nanomaterials?
Endpoint Screening Evaluation Comments References
Surface charge (Zeta potential)
Any surface charge on nanoparticles causes electrostatic repulsion between particles of like charge that can counter the tendency to agglomerate. The zeta potential represents surface charge. (U.S. EPA, 2011). Zeta potential is an abbreviation for electrokinetic potential in colloidal systems. From a theoretical viewpoint, zeta potential is the electric potential in the interfacial double layer (DL) at the location of the slipping plane versus a point in the bulk fluid away from the interface. In other words, zeta potential is the potential difference between the dispersion medium and the stationary layer of fluid attached to the dispersed particle (OECD, 2010). The zeta potential can be related to the stability of colloidal dispersions. The zeta potential indicates the degree of repulsion between adjacent, similarly-charged particles in dispersion. For molecules and particles that are small enough, a high zeta potential will confer stability, i.e., the solution or dispersion will resist aggregation. When the potential is low, attraction exceeds repulsion and the dispersion will break and flocculate. In nanotoxicology, zeta potential (surface charge) plays a key role in determining (1) the degree of colloidal interaction which is itself a function of the pH and ionic strength of the bulk solution; and (2) bioavailability of a compound when considering mass transport through charged membranes as related to exposure. Zeta potential is not measurable directly but it can be calculated using theoretical models and an experimentally-determined electrophoretic mobility or dynamic electrophoretic mobility (OECD, 2010).
This parameter initially thought not to depend strongly on particle size. During the course of the project, identified literature report indicating size dependence for TiO2 (Suttiponparnit et al., 2011).
EDF/DuPont (2007)
OECD (2009a,2010)
U.S. EPA (2007a,2007b)
SCENIHR (2007)
ENRHES (2009)
NICNAS (2010)
U.S. FDA (2010)
NIOSH (2009)
2.3 Literature Search
The Dialogue® database, which consists of 58 individual databases, were queried with index search strings based on the selected properties. Appendix A documents that process. References either initially or ultimately determined to be relevant for this project were entered into the literature database. Appendix B contains a copy of the database. Much of the information in that database is quoted directly from the references cited.

http://team/clients/rivm/shared documents/a1 - what defines nanomaterials/report/rivm_a1_final report.doc 15
Request A1: What Defines Nanomaterials?
3 Results
Relevant papers identified in the literature search, as indicated in Table 3, were reviewed to determine whether the experimental results for a given substance indicated a size-related effect on the property being examined. Then the results were combined to evaluate whether the weight of evidence indicated whether each physicochemical property could make a nanomaterial different from a ‘conventional’ material and at what size, if any, these properties are changed to ‘nanospecific’ properties.
Table 3. Catalogue of Relevant Papers
Endpoint/Property Number of Papers Summarised
Surface morphology 2
Crystallinity 46
Water solubility 9
Reactivity 52
Photocatalytic activity 13
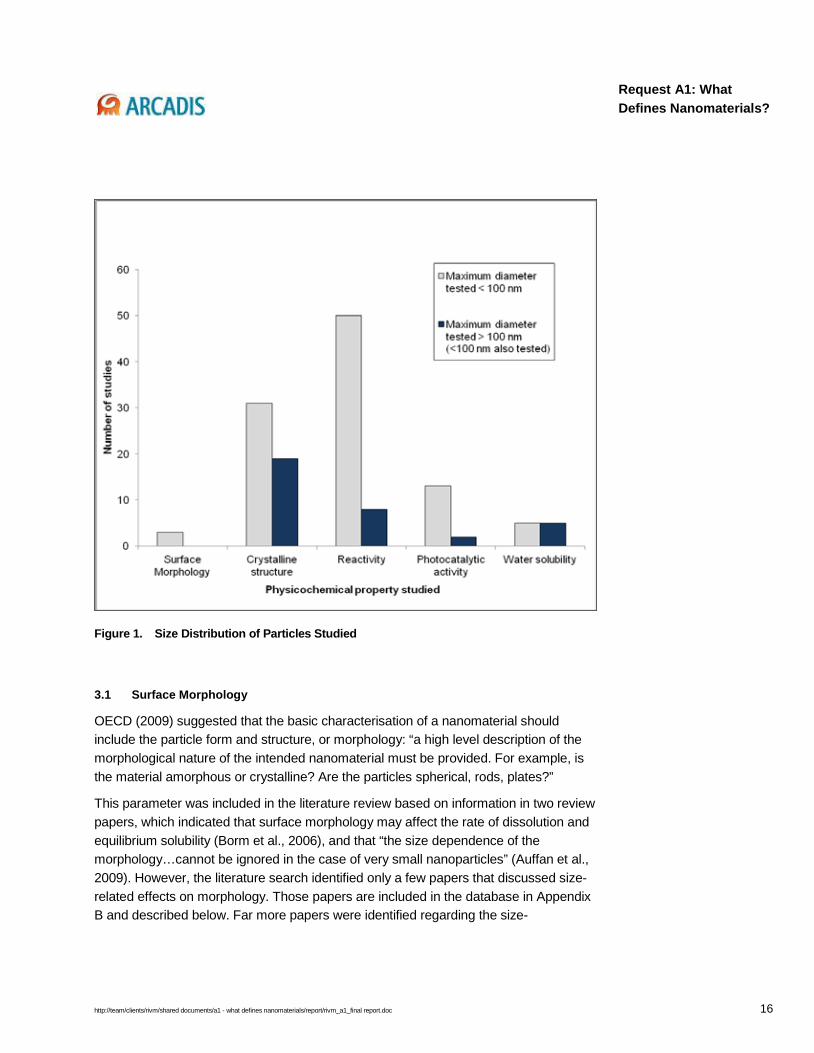
The experimental design of many of the studies presented a challenge with respect to the project objectives. As shown in Figure 1, many of the studies only examined size-related effects at relatively small particle sizes. Relatively few studies compared the properties of bulk material and particles between 1 and 100 nm.
Finally, most of the research described herein pertains to nanoparticles of metals or metal oxides and not to organic substances. That appears to be related in part to the parameters evaluated, and in part to the commercial uses of metals or metal oxides that motivate much of the research.
http://team/clients/rivm/shared documents/a1 - what defines nanomaterials/report/rivm_a1_final report.doc 16
Request A1: What Defines Nanomaterials?
Figure 1. Size Distribution of Particles Studied
3.1 Surface Morphology
OECD (2009) suggested that the basic characterisation of a nanomaterial should include the particle form and structure, or morphology: “a high level description of the morphological nature of the intended nanomaterial must be provided. For example, is the material amorphous or crystalline? Are the particles spherical, rods, plates?”
This parameter was included in the literature review based on information in two review papers, which indicated that surface morphology may affect the rate of dissolution and equilibrium solubility (Borm et al., 2006), and that “the size dependence of the morphology…cannot be ignored in the case of very small nanoparticles” (Auffan et al., 2009). However, the literature search identified only a few papers that discussed size-related effects on morphology. Those papers are included in the database in Appendix B and described below. Far more papers were identified regarding the size-

http://team/clients/rivm/shared documents/a1 - what defines nanomaterials/report/rivm_a1_final report.doc 17
Request A1: What Defines Nanomaterials?
dependence of crystalline structure, a specific aspect of morphology, as discussed in Section 3.2 of this report.
Oezaslan et al. (2012) examined the morphology of platinum-cobalt and platinum-copper alloy particles ranging in size from 3 to 100 nm. The particles were prepared by “dealloying”, an electrochemical leaching process used to prepare highly active fuel cell catalysts. The particles were generally spherical in shape. The study investigated how morphology and particle composition depended on the particle size of dealloyed Pt−Co and Pt−Cu alloy nanoparticle precursor catalysts. The researchers indicated that:
Our results indicate the existence of three distinctly different size-dependent morphology regimes in dealloyed Pt−Co and Pt−Cu particle ensembles: (i) The arrangement of Pt shell surrounding a single alloy core (“single core−shell nanoparticles”) is exclusively formed by dealloying of particles below a characteristic diameter dmultiple cores of 10 to 15 nm. (ii) Above dmultiple cores, nonporous bimetallic core−shell particles dominate and show structures with irregular shaped multiple Co/Cu rich cores (“multiple cores−shell nanoparticles”). (iii) Above the second characteristic diameter dpores of about 30 nm, the dealloyed Pt−Co and Pt−Cu particles start to show surface pits and nanoscale pores next to multiple Co/Cu rich cores. This structure prevails up to macroscopic bulk-like dealloyed particles with diameter of more than 100 nm.
Rockenberger et al. (2010) focused on both stabilised and non-stabilized cadmium sulphide (CdS) nanoparticles, studying the morphology of particles between 1.2 and 14 nm in diameter. After synthesizing the particles, they treated the particles electrochemically to mimic the dealloying process used to manufacture certain catalysts. They found that the size dependence of the mean Cd-S distance depended in part on the capping/stabilisation agent. Static disorder increased sharply above 3 nm compared to bulk CdS particles. The authors indicated that the particles between 3 and 14 nm comprised nanocrystalline powders and particles below 3 nm were essentially single crystals.
While these papers suggest that in some cases the shape and structure of an inorganic particle may depend upon its size, the data are too few to draw general conclusions about the size dependence of morphology. Additional information is available regarding the effect of size on crystalline structure, a specific aspect of morphology.
3.2 Crystalline Structure
The crystalline structure of a material can affect its physicochemical properties and may influence its toxicity. The literature search identified 46 papers that examined
http://team/clients/rivm/shared documents/a1 - what defines nanomaterials/report/rivm_a1_final report.doc 18
Request A1: What Defines Nanomaterials?
size-related effects on crystalline structure. Thirty-two of the papers indicated that crystalline structure depended in some way on particle size. Transition sizes, when observed, ranged from 11.7 to 100-200 nm. However, from the literature reviewed one cannot draw broad, definitive conclusions regarding a sharp property transition related to a specific particle size.
The results of relevant papers are summarised in the database in Appendix B and described briefly below. Other papers reported in the database (Appendix B) pertained less directly to the objectives of this study4 or were not conclusive and so are not described here.
3.2.1 Basis for Evaluation
These studies shared a fundamental basis. The work generally focused on metals and metal compounds prepared via bottom-up synthesis,5 using techniques that allowed the research teams to control particle size formation and/or to segregate materials by particle size. Often, the differences in particle size resulted from calcining the material at different temperatures during synthesis. The researchers examined the crystalline structure of particles at various sizes, often recognizing the interrelationship between calcination temperature, particle size, and crystalline structure. Few studies compared the properties of nanoscale and bulk (i.e., > 1000 nm) particles. Most compared the characteristics of particles within the nanoscale range.
The authors sometimes characterised their results by referring to the unit cell or lattice parameters of the particles. In short, the unit cell is the building block of a crystal: the smallest repeating unit of the three-dimensional crystal structure. A unit cell is characterised by its length(s) of the edges of the cell and the angles between the edges of the cell. In a cubic unit cell, for example, the edge lengths are equal, and the angles between the edges are all 90 degrees. Other unit cells require more complex descriptions, which are given by the following parameters. The lattice parameters (a, b and c), typically measured in Angstroms, represent the edge lengths
4 For example, several research teams examined the effect of particle size on the temperature at which phase transition from (e.g., solid to liquid) occurred, sometimes working outside typical environmental temperatures (Mayo, 2003; Luo et al., 2008). 5 Synthesis of a nanomaterial can begin from the “bottom up”, assembling nanomaterials from their components, for example by chemical synthesis or phase change processes. Other manufacturing methods begin with bulk materials, reducing their size via mass change processes to create nanomaterials from the “top down”. (Sellers et al., 2009)

http://team/clients/rivm/shared documents/a1 - what defines nanomaterials/report/rivm_a1_final report.doc 19
Request A1: What Defines Nanomaterials?
of the crystal or, put another way, the distances between unit cells in a crystal lattice. Unit cells are also characterised by the angles (α, β, γ) between the edges.6
Researchers studying the relationship between particle size and crystallinity have observed several different phenomena. With changes in particle size the unit cell can contract or expand. In some cases this expansion or contraction is asymmetrical; one lattice parameter may change and another may not. This kind of asymmetrical change can distort the a/c ratio. In the most extreme type of distortion, particles of two different sizes will assume different crystalline phases. For example, the unit cell may be tetragonal at bulk scale, but cubic below a certain particle size. Such phase changes may influence the reactivity or toxicity of a particle.
One model of the thermodynamics of phase transition (Mayo et al., 2003) helps to explain the dependence of crystallinity on particle size. In this model, the free energy of phase transition comprises three components:
• Term due to volume free energy (a parameter that relates to the bulk of the material, i.e., to the material chemistry and lattice bonds of the system surfaces or interfaces);
• Term due to surface free energy; and
• Term due to elastic compression of the solid under the pressure exerted by the curved surface (i.e., the LaPlace pressure, which equals the surface free energy times the particle curvature).
As discussed in the introduction to this report, the surface free energy varies with particle size. Intuitively, the curvature of the surface also varies with particle size, increasing with decreasing particle size. While this model has not been used to precisely or absolutely relate crystallinity to particle size for all nanomaterials, it does provide a useful conceptual framework for considering the research described below.
Research by Navrotsky et al. (2010) illustrates the effect of surface free energy on phase stability. They used calorimetric data on surface energies for several transition metal oxide nanoparticles to show that surface energy strongly influences the phase stability of the particles. As the size of the particles decreases, the surface free energy of the particles increases due to large increases in the surface area; however, systems
6 Many references illustrate the available crystal structures and graphically indicate the parameters that characterise the crystalline structure (i.e., a, b, c, α, β, γ). For an illustration from college-level course materials, for example, see http://www.seas.upenn.edu/~chem101/sschem/solidstatechem.html.

http://team/clients/rivm/shared documents/a1 - what defines nanomaterials/report/rivm_a1_final report.doc 20
Request A1: What Defines Nanomaterials?
favour phases with lower surface free energy and, therefore, will react to form crystalline phases with lower surface free energy.
The research described in this report generally explored the following types of size-related effects on crystallinity:
• Lattice parameters
• Stability of different crystalline structures
• Transformation between different crystalline phases
• Formation of otherwise unstable structures
Papers on these topics, as well as a study that showed no effect on crystallinity with particle size, are summarised below.
3.2.2 Change in Lattice Parameters with Particle Size
Literature reports indicate that changing the particle size can result in either lattice contraction or lattice expansion as the particle size decreases. No overarching conclusions can be drawn.
3.2.2.1 Lattice Contraction
Lattice parameters decreased with particle size (lattice contraction) in the experimental work reported below on oxides of nickel, cerium, titanium, barium, and other metals.
Zhang et al. (2009) found that lattice contraction occurred for anatase TiO2 as the particle size decreases, particularly below 5 nm for lattice parameter a. Tsunekawa et al. (2000) reported lattice contraction of the lattice parameter c for barium titanate (BaTiO3) nanoparticles as the particle size decreased from 250 to 15 nm; in another study on BaTiO3, Hoshina et al. (2006) reported a gradual decrease in the lattice parameter c as the particle size decreased from 1000 nm (bulk) to 20 nm.
A slight decrease in the lattice parameters occurred with decreasing size for nickel oxide (NiO) nanoparticles 25 to 16 nm. (Karthik et al., 2011) Lamber et al. (1995) found that palladium clusters (contained within a plasma polymer matrix) had a decreasing lattice parameter a as the particle size decreased from 5 to 1.4 nm. They found that the relative lattice parameter (Δa/a, where a is the Pd bulk lattice parameter) decreases linearly as a function of the reciprocal of the particle diameter.
Working with CeO particles from 26 to 55 nm in size, Morris et al. (2006) determined that lattice contraction occurred as a function of decreasing particle size in a linear relationship; the lattice parameter has also been found to significantly increase with

http://team/clients/rivm/shared documents/a1 - what defines nanomaterials/report/rivm_a1_final report.doc 21
Request A1: What Defines Nanomaterials?
decreasing particle size for CeO when the particle size is smaller than 20 nm (Zhang et al., 2002).
For Lanthanum (0.5) Calcium (0.5) Manganese (VI) oxide (La0.5Ca0.5MnO, LCMO), the lattice parameter, cell volume and the asymmetry parameter decreased in a systematic way with a decrease in the particle size from approximately a few microns to ca. 30 nm (Sarkar et al., 2007).
Shetty et al. (2002), working with BiFeO3, showed that the lattice structure was generally more symmetrical and the unit cell volume decreased with decreasing particle size. Finally, Selbach et al. (2007) determined that size effects on the lattice parameters of BiFeO3 become pronounced at particle sizes below 30 nm and cited work that found that size effects became significant for PbTiO3 below 50 to 150 nm, and for BaTiO3 below 0.15 to 1 μm.
3.2.2.2 Lattice Expansion
In contrast to the results described above, some research has indicated an increase in at least one lattice parameter as the particle diameter of a nanometal oxide or alloys decreases.
Ayyub et al. (1995) studied the effect of particle size on the crystalline structure of partially covalent metal oxides, including oxides of iron, aluminium, lead/titanium, lead/zirconium, and other substances. With a decrease in particle size, these substances became increasingly ionic and the crystals tended to form more symmetric structures. (However, the authors cite work by others showing that the structure of strongly covalent materials such as Si or Ge is independent of particle size down to a particle size of 10 nm.) A decrease in particle size also changed the oxygen stoichiometry in some of the metal oxides. Finally, their work showed a fundamental change in the crystalline structure of the materials studied. The unit cell volume (UCV) (normalised to the number of formula units per unit cell) increased with decreasing size for each phase. The authors noted that “the deviations from bulk properties related primarily to the changes in the size and symmetry of the unit cell” and ultimately concluded that “though the size-induced lattice distortions are relatively small in magnitude, they lead to profound changes in many physical properties ….we observe large deviations in [magnetic properties] and related properties with respect to the corresponding bulk solid when the size is decreased to 10 to 100 nm.”
Li et al. (2004a) reported an increase in the lattice parameter of rutile titanium dioxide (TiO2) with decreasing size between 26.4 and 5.2 nm, and proposed a surface defect dipole model to explain this phenomenon. According to this model, as the particle size decreases an increasing number of Ti atoms appear on the surface and thus have a

http://team/clients/rivm/shared documents/a1 - what defines nanomaterials/report/rivm_a1_final report.doc 22
Request A1: What Defines Nanomaterials?
lower coordination number7. Reactive molecules such as H2O may sorb to these Ti atoms, forming hydration layers which create significant distortion surrounding the surface Ti atoms. This has an electrochemical effect on the entire particle, shifting the negative charge toward the interior of the particle and leaving the surface increasingly positive. It is expected that this shift in charge will create large repulsive dipole-dipole interactions that will affect the crystallinity of the rutile nanocrystals.
Huang et al. (2007) studied BaTiO3 nanoparticles; the lattice parameters a and c both increased with decreasing particle size from bulk (~1000 nm) to nanoparticulate sizes, and within the nanoparticulate size range from 140 to 30 nm. Although Tsunekawa et al. (2000) identified a lattice contraction for parameter c, as described above, they reported a monotonic increase of the lattice parameter a for BaTiO3 nanoparticles as the size increased from 15 to 250 nm. Also testing BaTiO3, Hoshina et al. (2006) reported a gradual increase in the lattice parameter a as the particle size decreased from 1000 nm (bulk) to 20 nm.
Akdogan et al. (2005) reported that the lattice parameter c decreased with decreasing particle size of lead titanate (PbTiO3) while the lattice parameter a increased with decreasing particle size over the range ca. 25 to ca. 150 nm. The c/a ratio decreases with increasing particle size and approaches the bulk value. The authors propose that the bonding characteristics of PbTiO3 may change at sizes < 100 nm such that Ti-O bonds possess increasingly ionic character. Therefore decreasing the particle size to < 100 nm would elongate Pb-Ti bonds and increase electrostatic repulsion and expansion of these bonds, ultimately leading to an increase in the cubic lattice parameter and changing the crystalline structure.
Gamarnik (1994) observed an increase in the lattice parameter a observed for NiO nanoparticles as they decreased in size from 14 to 2.3 nm.
Sharma et al. (2009) reported an increase in the lattice parameters a and c of tin oxide (SnO2) with decreasing particle diameter from 35.2 to 1.9 nm and state that “this is an [sic] agreement with earlier reports that the lattice expands in oxide nanoparticles due to the presence of oxygen ion vacancies or due to the variation in ionicity of the metal oxide semiconductors.”
Multiple studies (Spanier et al., 2001; Zhang et al., 2002; Tsunekawa et al., 2000; Tsunekawa et al., 2004) have examined the effect of particle size on the crystallinity of cerium oxide (CeO2) and identified lattice expansion with decreasing particle size. This substance has been shown to transition from the 4+ to 3+ valence state at a size of 7 The coordination number is defined as the number of points of attachment (i.e., bonds) for a central atom or ion.

http://team/clients/rivm/shared documents/a1 - what defines nanomaterials/report/rivm_a1_final report.doc 23
Request A1: What Defines Nanomaterials?
ca. 1.4 nm (i.e., CeO2 transitions to Ce2O3). The change in valence state (which itself relates to particle size) results in an expansion of the effective ionic radii and thus lattice expansion (Tsunekawa et al., 2004).
In Duan et al. (2005), lattice expansion was reported to occur for the perskovite structure La0.7Sr0.3MnO3 as the particle diameter decreased from 47 to 16 nm. The authors explain this by the increased lattice distortion of surface atoms resulting from the decreased coordination of surface atoms with decreasing size.
Finally, Nowakoski et al. (2008) found a large increase in the lattice parameter a between ruthenium dioxide (RuO2) particles sized 250 nm and 8 to 16.5 nm (i.e., increased with decreasing particle size).
3.2.3 Stability of Different Crystalline Structures at Different Particle Sizes
Various studies have found that different crystalline structures (or phases) occur at different particle sizes.
Zhang and Banfield (2000) reported that the most stable phase transforms from rutile to brookite to anatase as the size of TiO2 nanoparticles decreases from 35 to < 11 nm.
A study of BaTiO3 particles between 30 and 140 nm and bulk BaTiO3 particles (i.e., > 1000 nm) found that with decreasing particle size the crystals were decreasingly tetragonal (i.e., increasingly cubic, the c/a ratio approached the value for bulk BaTiO3 particles) and the cell volume increased (Huang et al., 2007). Several other research teams studying BaTiO3 have also found that with decreasing particle size the crystalline structure changes from tetragonal to cubic, at a threshold measured variously as 120 nm (Uchino, 1989), 100 to 200 nm (Yamamoto, 1993), 80 nm (Tsunekawa et al., 2000), 70 nm (Yan et al., 2006) or 30 nm (Hoshina et al., 2006).
At particle sizes ranging from ca. 150 to ca. 30 nm, PbTiO3 exists in the tetragonal phase; from ca. 30 to ca. 15 nm, in the cubic phase, and below ca. 15 nm, in the paraelectric8 cubic phase (Akdogan et al., 2005). Ishikawa et al. (1996) reported that below a critical size of 11.7 nm, the cubic (ferroelectric9) phase exists for lead titanate (PbTiO3). Above this critical size, the tetragonal phase exists (the c/a ratio approaches 1.0635, the value for bulk particles).
8 The paraelectric phase is defined as unaligned, crystalline phase having a spontaneous, reversible polarisation. 9 The ferroelectric phase is defined as one having a permanent electric polarisation that is spontaneously reversible by application of an external electric field.
http://team/clients/rivm/shared documents/a1 - what defines nanomaterials/report/rivm_a1_final report.doc 24
Request A1: What Defines Nanomaterials?
Antimony clusters were found to transition from an amorphous to crystalline structure above an approximate particle diameter of 120 nm (Kirmse et al., 2003).
Working with 0.5Bi0.8La0.2FeO3–0.5PbTiO3 (BLF-PT) particles of sizes between 80 and ca. 1500 nm, Wei et al. (2010) found that the crystalline structure changed from tetragonal symmetry to rhombohedral for particle sizes of approximately 150 to 400 nm.
Working with LiIn(WO4)2 Hermanowicz et al. (2008) examined particles between 570 and 18 nm and noted that tungstate underwent two size-induced phase transitions at 100 and 30 nm.
Zhang et al. (2006) found that for amorphous zirconium dioxide (ZrO2), the tetragonal phase is thermodynamically favourable (lower surface energy, lower Gibbs free energy) < 13 nm while for particles > 13 nm and < 31 nm, the monoclinic phase is favourable (lower Gibbs free energy).
3.2.4 Effect of Particle Size on Phase Transformation
Other researchers have examined the effect of particle size on the transformation between phases, or different crystalline structures. In experiments with particles between 12 and 23 nm in size, the smaller anatase TiO2 particles had a lower phase transition onset temperature and activation energy for transformation to the rutile form than did larger particles (Li et al., 2004b). Zhang and Banfield (2005) also examined the transformation from the rutile form of TiO2 to the anatase form. With decreasing particle size (21 to 8 nm), the anatase-to-rutile phase transformation rate increased while the required activation energy increased slightly. Ghosh et al. (2003) also found that the stability of anatase TiO2 is size dependent. Experiments with heating TiO2 showed that as the size of nanoparticles decreased from 35 to < 11 nm, the most stable phase changed from rutile to brookite to anatase; particle size determines the thermodynamic phase stability. If particle sizes of the three nanocrystalline phases are equal, anatase is most thermodynamically stable at sizes < 11 nm, brookite is most stable for crystal sizes between 11 and 35 nm, and rutile is most stable at sizes > 35 nm (Zhang and Banfield, 2000).
Singh and Mehta (2005) studied the transformation of In(OH)3 to In2O3 as a function of particle size between 8 and 15 nm. They found that the phase transformation temperature decreased with decreasing particle size.
3.2.5 Formation of Otherwise Unstable Structures at Nanoscale
Some crystalline forms that cannot exist or are not stable at larger particle sizes can exist at nanoscale. Below 13 nm, zirconium particles are stable in the otherwise-

http://team/clients/rivm/shared documents/a1 - what defines nanomaterials/report/rivm_a1_final report.doc 25
Request A1: What Defines Nanomaterials?
unstable tetragonal phase (Xu and Barnard, 2008). Srivastava et al. (2011) were able to synthesize crystalline silver-nickel particles at a size < 7 nm; at larger particle sizes, attempts to mix the two substances resulted in a two-phase structure rather than a crystalline form.
3.2.6 No Change in Lattice Structure with Particle Size
Ma et al. (2012) studied silver nanoparticles in aqueous solution, in contrast to the solid-state studies described above. They did not observe changes in the lattice structure with particle size: Ag-Ag bond lengths and lattice parameters did not vary between particles of 5.5, 26.3, and 80 nm in size, nor did the values measured for these nanoparticles vary significantly from measurements for bulk materials. Ma et al. (2012) attributed this to the fact that they worked with particles in suspension, rather than solid-state systems, and to the theoretical prediction that significant strain would occur only for silver particles smaller than 5 nm.
3.2.7 Summary
Several aspects of the crystallinity of metals and metal oxides may vary with particle size. With changes in particle size the unit cell can contract or expand, as represented by changes in lattice parameters. Particles of two different sizes can also assume different crystalline phases. While many studies have demonstrated size-related effects, no simple conclusions can be drawn to inform the definition of nanomaterial.
In some cases, different experiments with the same material found different results with respect to lattice contraction or expansion. Table 4 indicates those materials and the particle sizes tested. It also indicates the different phases (crystalline structures) observed at different particle sizes. This comparison illustrates the difficulty in drawing broad conclusions about the effects of particle size on crystallinity.

http://team/clients/rivm/shared documents/a1 - what defines nanomaterials/report/rivm_a1_final report.doc 26
Request A1: What Defines Nanomaterials?
Table 4. Observations of Lattice Contraction and Expansion and Phase Change
Substance Particle Sizes at
which Lattice Expansion
Observed (nm)
Particle Sizes at which Lattice Contraction
Observed (nm)
Particle Sizes at which Different Phases Observed at constant T
(nm)
TiO2 < 5 5.2 – 26.4 The most stable phase transforms from rutile – brookite – anatase as the size of TiO2 nanoparticles decreases from 35 to <11 nm.
BaTiO3 * 15 – 250
20 – 1000
15 – 250
20 – 1000
30 – 1000
With decreasing particle size crystals are decreasingly tetragonal and increasingly cubic, with a threshold variously measured as between 30 and 200 nm.
PbTiO3 * 25 – 150 25 – 150 Tetragonal phase at larger particle sizes and cubic phase at lower particle sizes; threshold measured as ca. 30 nm and as ca. 12 nm.
CeO2 < 20
26 – 55
2 – 8
2 – 15
5 – 80
6 – 5000
No studies identified
NiO 16 – 25 2.3 – 14 No studies identified
* As noted above, one study noted an expansion of one lattice parameter and contraction of another with decreasing particle size.
3.3 Water Solubility
Decreasing the particle size can increase the rate at which a substance dissolves and can also increase the equilibrium solubility concentration. Each of these phenomena is discussed below.
3.3.1 Increased Rate of Dissolution
The increased rate of dissolution with reduced particle size is well known, particularly in the pharmaceutical industry, where “nanosizing” increases the bioavailability of poorly-soluble drugs.10 As the United States Food and Drug Administration has noted (2010),
10 For example, see Ambrus et al., 2009; Basa et al., 2008; Dai et al., 2007; Devalapally et al., 2007; Fakes et al., 2009; Hu et al., 2004; Jinno et al., 2006; Kesisoglou, 2007; Kipp, 2004;

http://team/clients/rivm/shared documents/a1 - what defines nanomaterials/report/rivm_a1_final report.doc 27
Request A1: What Defines Nanomaterials?
“’Nanosizing’ is a term developed in the pharmaceutical industry to describe how some previously approved products with particle sizes > 100 nm are being produced with smaller particle sizes, in order to change certain physical and performance characteristics, such as pharmacokinetic profile (i.e., the rate and extent of absorption and clearance from the body).”
Much of the literature on the size dependence of solubility reflects work on pharmaceutical substances. Since the impetus of this project was the European Commission definition of “nanomaterial” within the context of REACH, the literature search did not investigate the pharmaceutical literature on nanosizing but rather includes papers on the dissolution of various non-pharmaceutical substances.
One study examined the dissolution of various metals from airborne particulate samples segregated by size and ranging in size from 57 to 1000 nm (Niu et al., 2010). These samples contained incidental nanoparticles from air pollution rather than manufactured nanoparticles. The research team extracted the samples at neutral pH for 2 hours, analysed the extract for selected metals, and compared the mass in the extract to the total metal in the sample to determine the potentially bioaccessible amount of each metal. No information on the loading rate of the tests was reported. They found that bioaccessibility (or solubility) generally increased with decreasing particle size. Some elements showed a steep increase in solubility as particle size decreased from fine to nano (e.g., V, Fe, Mo, Sn, and Pb); other elements (e.g., Mn, Cu, and Zn) showed little change in solubility with particle size under the test conditions.
Several other studies of metals or metal compounds have found that dissolution rates increase with decreasing particle size. One study found that the rate of dissolution of nanosilver particulate (21 and 111 nm) was up to three times greater than the rate for Ag microparticulates (800 to 3000 nm, 10 to 2000 nm) (Choi et al., 2011). This study tested a single loading rate of 20 mg/L. In an early study, Meulenkamp (1998) found that the dissolution rate of ZnO increased by a factor of 5 when the particle size decreased from 4.3 to 3.15 nm. (Meulenkamp did not discuss the precision and accuracy of the analytical techniques used to distinguish between these particle sizes.)
Barton et al. (2012), studied the dissolution of Fe2O3 (hematite) in the presence of desferrioxamine-B (DFOB), a substance released by aerobic microorganisms in the environment. The ZnO nanoparticles were tested at a single loading rate of typically 2.5 mM. Researchers observed an initial rapid release of Fe in the first few hours
Merisko-Liversidge and Liversidge, 2008; Muller and Peters, 1998; Shikov et al., 2009; Sigfridsson et al., 2009; Tanaka et al., 2009; Takano et al., 2008; Vogta et al., 2007.

http://team/clients/rivm/shared documents/a1 - what defines nanomaterials/report/rivm_a1_final report.doc 28
Request A1: What Defines Nanomaterials?
followed by steady state dissolution that increased the concentration in solution linearly during the 48 hour test. At pH 7, the dissolution rates, normalized to particle surface area (micromole Fe per square meter per hour), were as follows: 0.016 for 3.6 nm particles; 0.018 for 8.6 nm particles, and 0.001 for 40 nm particles. (Note that particle sizes were measured.) The steady state dissolution rates did not vary significantly at pH 3 or 5. Their control experiments, without DFOB, showed that after 24 hours at pH 3 the release of iron ions decreased with increasing particle size; the concentration of Fe ions in the testing medium was ∼6.3, 3.6, and 1.0 μM for 3.6-, 8.6- and 40-nm particles, respectively. Liu et al. (2009a) found that under anoxic conditions at pH 3 the dissolution rate of aggregated PbS crystals varied as a function of particle size and aggregation state. The researchers measured dissolution rates (normalised to surface area) of 4.4×10⁻⁹ mol m-2 s-1 for dispersed 14-nm nanocrystals; 7.7×10⁻¹⁰ mol m-2 s-1 for dispersed 3.1-μm microcrystals; and 4.7×10⁻¹⁰ mol m-2 s-1 for aggregated 14-nm nanocrystals. No information on the loading rate of the PbS nanocrystal aggregates was provided. The authors attributed the difference in dissolution rates to differences in nanotopography and the crystallographic faces present on the ZnO nanoparticles.
3.3.2 Effect on Equilibrium Solubility Concentration
The literature search identified four papers that described experiments to determine the effect of particle size on the equilibrium solubility concentration (i.e., the concentration of the dissolved substance at equilibrium). Those studies demonstrated a size-related effect as described below.
The Ostwald-Freundlich equation predicts that equilibrium solubility should increase with decreasing particle size. While this may not always be the case due to non-ideal behaviour (Borm, 2006), some experimental data do show this effect. The theoretical relationship and available data are described below.
The Ostwald-Freundlich equation relates the solubility of a spherical nanoparticle of radius r (Sr) to the solubility of the bulk form of the substance (Sbulk)11 as follows (Ma et al., 2012).12
Sr = Sbulk * exp ([2γ x Vm] / [R x T x r])
Where γ is the surface tension of the particle (J/m2) Vm is the molar volume of the particle (m3/mol), R is the ideal gas constant, and T is the temperature (K). This
11 Sbulk is defined as the solubility of the bulk form of Ag, which essentially has a flat particle surface compared to the more pronounced surface curvature of a nanoparticle. 12 This simplified form of the equation incorporates the assumption that rbulk >>> rnanoparticle.

http://team/clients/rivm/shared documents/a1 - what defines nanomaterials/report/rivm_a1_final report.doc 29
Request A1: What Defines Nanomaterials?
equation can be applied when surface strain is negligible and γ is independent of particle size, thus it does not apply to the smallest of nanoparticles.13
Ma et al. (2012) examined the dissolution of silver particles between 5 and 80 nm in size and found that solubility increased as the particle size decreased. The experiments were performed in such a way that the availability of oxygen did not limit oxidative dissolution. Further, the experiments continued long enough (for a period of months) to establish steady-state conditions. The authors concluded that under the experimental conditions, solubility correlated well with particle size as measured by transmission electron microscopy, and was not affected by the synthesis method and coating as much as by their size. The results for particles in the range of 5 to 40 nm fit the Ostwald-Freundlich equation (R2 = 0.993). If the data simply reflected an increased rate of dissolution due to the relative increase in the surface area to volume ratio, then the measured release of silver ions per unit surface area would have been constant; however, it was not. The researchers also determined that there was no change in surface tension with decreasing particle size and the particles did not reflect surface strain, regardless of size. Ag-Ag bond lengths and lattice parameters did not vary between particles of 5.5, 26.3, and 80 nm in size.
In another study (Schmidt and Vogelsberger, 2006), different types of industrially produced TiO2 nanoparticles and a precipitated TiO2 were dissolved in aqueous NaCl solutions to study solubility as a function of time (up to 3000 hours), crystalline structure, and particle size. They found a steep increase in the dissolved concentration immediately (approximately in the first hour) followed by a concentration decrease to a value nearly constant over time. The solubility was greater for G5 nanoparticles (9.7 nm, 100% anatase) than for DT51D (23.9-nm diameter, 100% anatase) or P25 (24.4 to 29.7 nm, 86% anatase/14% rutile) nanoparticles.
Wong et al. (2010) measured the solubility of bulk (216 nm) and nano (26 nm) ZnO particles in seawater to support aquatic toxicity testing. The nano ZnO particles tended to form aggregates in the micrometre range (2.3 ± 1.6 μm), which were larger than those formed by the bulk particles (1.7 ± 1.2 μm; t = 4.183, p < 0.01). The authors concluded that nano ZnO had a higher solubility in seawater (3.7 mg/L) than did bulk ZnO (1.6 mg/L) at equilibrium (after 72 hours).
13 Further, this form of the equation does not reflect the potential influence of surface charge. A modified form of the equation, the Ostwald-Freundlich-Knapp equation, accounts for surface charge. That equation predicts that maximum solubility is seen at a critical radius, below which the solubility again decreases (DeVilliars et al., 2009).

http://team/clients/rivm/shared documents/a1 - what defines nanomaterials/report/rivm_a1_final report.doc 30
Request A1: What Defines Nanomaterials?
Another study examined the solubility of ZnS nanoparticles in a basic ethylenediaminetetraacetic acid (EDTA) sodium salt solution (Zhang et al., 2010). As would be expected, the study showed that solubility depended in part on the presence of the chelating agent EDTA and pH. The researchers found that “within the pH range 9 to 10, the lower the pH and the smaller the particles, the higher the conditional dissolution equilibrium constant and hence the higher the solubility of ZnS [nanoparticles].” While these experiments tested nanoparticles (1 to 3 nm) and bulk material, the results do not indicate a “bright line” concentration effect.
3.3.3 Summary
Most data from the studies reported here and with respect to poorly-soluble pharmaceuticals indicate that the rate of dissolution increases with decreasing particle size. However, no clear threshold of a size-related effect exists to support a definition of nanomaterial.
In addition, some experimental data suggest that the equilibrium solubility concentration of a substance originating from a nanoparticle may be greater than the equilibrium concentration resulting from dissolution of a larger particle. Thermodynamic considerations suggest that the solubility varies with the exponent of the particle size diameter.
3.4 Reactivity
The literature search primarily identified studies on metals and metal oxides, not surprisingly given the use of many such materials as catalysts. The literature search identified 52 relevant papers pertaining to reactivity, of which 85% indicated a dependence on particle size. Almost all studies reporting a size effect noted an inverse relationship between size and catalytic reactivity. Maximum activities generally occur below 15 to 20 nm, with a sharp change in reactivity sometime occurring below 5 nm. However, many of the studies focused on particles below 100 nm in size and therefore do not provide direct perspective on the definition of nanomaterial. The results are summarised in the database in Appendix B, and described briefly below.
Some of the literature on the catalytic properties of nanomaterials refers to two parameters: specific activity and mass activity. These terms are used in the summaries below. Specific activity is defined as the catalytic activity normalised to surface area or number of active sites; within the context of fuel cells (Srinivasan, S. [Ed.] 2006) it is the current density relative to the catalyst surface area. Mass activity, as the name implies, is relative to the particle mass.
http://team/clients/rivm/shared documents/a1 - what defines nanomaterials/report/rivm_a1_final report.doc 31
Request A1: What Defines Nanomaterials?
3.4.1 Iron Oxides
Chernyshova et al. (2010) sought to explain the reactivity of hematite (Fe2O3), indicating that:
The dependence of its (bio)chemical reactivity on [nanoparticle] size is observed at sizes larger than 10 nm, i.e., in the size range where neither the quantum confinement (QC) nor surface curvature effects are expected. Hence, the reason for this dependence is likely to be size-induced changes of the [nanoparticle] structure.
They characterised hematite particles between 7 and 120 nm with respect to their size, surface area, crystalline structure, UV-vis absorption spectra, and valence electron population, and found that the band gaps14 decreased with increasing size. Decreasing the band gap with increasing size can increase the particle reactivity. To paraphrase the authors, the decrease in the band gaps and lower energy of the valence band15 edges with increasing particle size imply a higher electron affinity of larger hematite nanoparticles (i.e., larger hematite nanoparticles are stronger electron acceptors than smaller particles). Along with the lower mobility of charge carriers, this effect causes a decrease in the oxidative catalytic activity of hematite with decreasing size. The nanoparticle-driven destabilization of energy of the conduction16 and valence bands observed in this study is also consistent with the degradation of photocatalytic properties of hematite with decreasing particle size.
Chernyshova et al. (2011) then studied the effect of size on the catalytic oxygenation of Mn(II) in the presence of hematite (α-Fe2O3) particles 7 to 150 nm in size. The normalised pseudo-first order reaction rate constant increased with increasing particle size. A large linear increase in this rate constant was observed between 38 and 150 nm hematite particles. The authors postulate that the unexpected increase in reactivity with increasing particle size could be explained by an electrochemical reaction (rather than a chemical reaction) which became more efficient at larger particle sizes due to the difference in electronic states between nano and bulk particles. They distinguish between chemical reaction and electrochemical reaction as follows:
14 The band gap is defined as the difference in energy between the top of the valence band of electrons and the bottom of the conduction band and is measured in electron volts (eV). 15 The valence band is defined as the highest range of energies containing electrons at absolute zero. 16 The conduction band is defined as the range of energies required to free an electron from the valence band of the atomic orbital so that it is free to move within the atomic lattice.
http://team/clients/rivm/shared documents/a1 - what defines nanomaterials/report/rivm_a1_final report.doc 32
Request A1: What Defines Nanomaterials?
The NP size-induced changes in the catalytic redox properties of ferric (hydr)oxides have previously been discussed exclusively within the chemical paradigm in terms of variations in crystallographic facets, aggregation, surface hydration, basicity of the NPs, and surface texture (relative concentration of weakly and strongly adsorbed complexes). This paradigm considers that both the reduction and oxidation half-reactions take place at the same adsorption site or two neighbouring adsorption sites and neglects semiconducting properties of the NPs…. A specific feature of the alternative, electrochemical mechanism is the spatial separation of the oxidation and reduction half reactions, which are electrically coupled by charge transfer within either the interior or surface of the catalyst.
Anschultz and Penn (2004, 2005) studied the oxidation of hydroquinone by various iron oxides, including 6-line iron oxyhydroxide ((Fe3+)2O3.0.5H2O) nanoparticles ca. 3.5 nm, ferrihydrite nanoparticles ((Fe5HO8.4H2O)3, 4 to 6 nm), and goethite rods (α-FeOOH, 5.3 x 64 nm and 22 x 367 nm). They concluded that reactivity increased with decreasing particle/rod size and that the rate of redox reaction, using iron oxyhydroxide nanoparticles as the reducing agent, is strongly particle size and phase dependent.
Strongin et al. (2005) investigated the size-dependent surface reaction rate of iron oxyhydroxide ([Fe3+]2O3.0.5H2O) using particles 2 to 6 nm in diameter and found that the rate of surface reactions that led to the production of adsorbed sulphur oxyanions increased with decreasing particle size.
Vikesland et al. (2007) synthesised 9- and 80-nm magnetite particles (Fe3O4) and tested the rate at which these particles catalysed the reductive dechlorination of carbon tetrachloride. The surface area-normalised degradation rate constant was an order of magnitude greater for the 9-nm catalyst than the 80-nm catalyst.
3.4.2 Cobalt
Several studies have examined the effect of particle size on cobalt catalysts used in Fischer-Tropsch reactions, which are used to produce hydrocarbons from the reaction of hydrogen and carbon monoxide.
Bakhmutskya et al. (2011), exploring the reported decrease in the efficiency of Co catalysts in Fischer-Tropsch synthesis at particle sizes < ca. 7 nm, compared the values for certain thermodynamic parameters for bulk and nanoparticle Co at elevated temperatures. They found that particle size does not affect the redox thermodynamic properties to any significant degree for particles larger than 4 nm.
Another study examined the role of particle size in cobalt-carbon nanofibre catalysts on the Fischer-Tropsch reaction at 1 bar or 35 bar of pressure (Bezemer et al., 2006). At

http://team/clients/rivm/shared documents/a1 - what defines nanomaterials/report/rivm_a1_final report.doc 33
Request A1: What Defines Nanomaterials?
1 bar, the catalyst performance was independent of cobalt particle size for catalysts with sizes between 6 nm and 27 nm with a slight increase in hydrogenation activity near 6 nm. As the Co particle diameter decreases from 6 to 2.6 nm both the activity and the turnover frequency17 (TOF) decrease rapidly. At 35 bar, the activities were dependent on particle size while the TOF was found to be independent of size at particle diameters ranging from ca. 15 to 8 nm with a rapid decrease in TOF as particle size decreases from 8 to 2.6 nm. In an attempt to explain the decrease in activity below sizes 6 to 8 nm, the authors propose a minimal Co particle size required to stabilize surface domains containing the active sites for CO absorption. Below this size (i.e., 6 to 8 nm), the active sites are unstable or they contain a non-optimum ratio of the different active sites.
den Breejen et al. (2010) investigated the role of the cobalt particle size distribution in the Fischer–Tropsch reaction for supported Co catalysts. Their research group tested the reactivity of Cobalt / carbon nanofibre (Co/CNF) catalysts between 2.4 and 11.3 nm and Cobalt / silica (Co/SiO2) catalysts between 4.6 and 15.8 nm in diameter. The catalytic activity of Co/CNF nanoparticles reached a maximum at 5.7 nm and decreased with both increasing and decreasing particle size. The catalytic activity for Co/SiO2 nanoparticles increased with decreasing particle size.
Prieto et al. (2009) examined the effect of particle size on Co3O4 catalysis. They experimented with Co3O4 supported on spherical SiO2 using particles between 5.9 and 141 nm in size. Under realistic Fischer–Tropsch synthesis conditions (493 K, 2.0 MPa) the TOF increased from 1.2×10⁻³ to 8.6×10⁻³ s-1 when d(Co0) was increased from 5.6 to 10.4 nm, and then TOF remained constant up to a particle size of 141 nm.
Strongin et al. (2005) reported an increase in the rate of surface reactions of cobalt oxide (CoO) nanoparticles 2 to 3 nm with decreasing particle size.
Finally, a study on the influence of nanoparticle size on the activity of the inverse spinel CoFe2O4 for CO oxidation measured the temperature at which 50% catalytic conversion was achieved for catalysts ranging in size from ca. 6 to 30 nm and incorporating various capping agents. As the particle diameter increased, the temperature required for 50% conversion of the CO to CO2 within the sample increased; based on data obtained at the same temperature, conversion was much more effective for smaller catalyst particle sizes (Evans et al., 2008).
17 Turnover frequency is defined as the maximum number of molecules of substrate that a catalyst can convert per catalytic site per unit time.

http://team/clients/rivm/shared documents/a1 - what defines nanomaterials/report/rivm_a1_final report.doc 34
Request A1: What Defines Nanomaterials?
3.4.3 Palladium
Two studies found that larger Pd particles could not be oxidised although smaller particles were able to react. Schalow et al. (2007) investigated the reactivity of Pd nanoparticles supported on an ordered Fe3O4 film on Pt(111) for the oxidation of CO as a function of particle size (ca. 4 to ca. 70 nm) at 500 K. Interface oxidation and partial surface oxidation occur easily at particle sizes up to approximately 7 nm (corresponding to a Pd coverage of 0.4 nm). Kinetic hindrances limited oxidation at larger particle sizes. A study of Pd on an MgO substrate found that palladium particles were increasingly oxidised to PdO as particle size decreased from 5.6 to 4.8 nm while particles between 5.6 and 24 could not be oxidised (Nolte et al., 2008).
Several research teams have studied the reaction mechanisms that affect the size dependency of reactivity. However because these studies focused on the smallest of nanoparticles they do not directly inform the definition of a nanomaterial. Doyle et al. (2005), working with particles between 1 and 5 nm, found a strong particle size effect for the hydrogenation of pentene by Pd coated Al2O3, but not for ethene. The authors attributed the different effects of particle size on reactivity to the portion of the crystalline structure involved in the reaction (and the relative effect of size on that aspect of the structure). In another study, Wilson et al. (2006) “report that the rate of hydrogenation of allyl alcohol is a function of the diameter of the Pd nanoparticles (1.3 to 1.9 nm) used to catalyse the reaction. Furthermore, kinetic data indicate that this effect is electronic in nature for particles having diameters < 1.5 nm, but for larger particles it depends primarily on their geometric properties.” In this study, Pd nanoparticles were encapsulated with hydroxyl-terminated polyamidoamine dendrimers.
Another study, of carbon supported Pd in alkaline solution, found different size effects (Jiang et al., 2009). The specific activity of the Pd/C catalyst (i.e., the oxygen reduction reaction current normalised to the Pd active surface area), increased by a factor of 3 with increasing particle size from 3 to 16.7 nm. The researchers surmised that increased OH− adsorption on smaller particles blocked the active reaction sites. The mass activity of Pd slightly increased (by a factor of 1.3) when particle size increased from 3 to 5 nm and then decreased with increasing particle size.
3.4.4 Gold
Many studies have examined the reactivity of nanoscale particles of gold (Au), alone or supported on a metal-based or organic structure. These studies typically examined either the catalytic oxidation of CO or of organic molecules by gold particles between 1 and 60 nm, sometimes on a metal oxide support. The results generally showed that
http://team/clients/rivm/shared documents/a1 - what defines nanomaterials/report/rivm_a1_final report.doc 35
Request A1: What Defines Nanomaterials?
reactivity increased as particle size increased (Cuenya et al., 2003; Haruta et al., 1993; Kalimuthu et al., 2008; Kozlove et al., 2000; Schwartz et al., 2004; Zhou et al., 2010).
Four studies showed that catalytic activity reached a maximum at a relatively small particle size and then decreased as the particle size grew even smaller. In a study utilizing Au nanoparticles between 10 and 48 nm, Sau et al. (2001) found that catalysis of the oxidation of eosin decreased from 10 to 15 nm and then increased from 15 to 48 nm (i.e., minimised at 15 nm). Valden et al. (1998), working with Au particles of 1 to 6 nm in size, determined that oxidation of CO reached a maximum when the Au catalyst was 3.5 nm. A study of Au nanoparticles between 1 and 3.5 nm in size found that the maximum oxidation of CO occurred at 2 to 2.4 nm (Zanella et al., 2004). Finally, Deng et al. (2005), testing particles 2.7 to 24.7 nm, found that the maximum activity of Au nanoparticles for the reduction of anthracene was 5.4 nm.
Catalysis reactions may be affected by the ability of gold itself to be oxidised under aerobic conditions. Miller et al. (2006), working with 2- to 5-nm Au particles supported on SiO2, Al2O3 or TiO2, found that Au particles < 3 nm oxidize in air (with approximately 10% reacting); larger particles are not oxidised.
Parker and Campbell (2007) appear to have obtained contrary results regarding the effect of particle size on catalytic activity. In their work with Au deposited on titanium dioxide TiO2, they found that the catalytic reaction rate for the oxidation of CO increased with increasing nanoparticle size. However, they did not clearly report the particle size range tested, simply reporting on the coverage of Au on the TiO2 substrate. By inference from one of the figures in the paper they may have examined particles in the size range ca. 1 nm to ca. 6 nm.
3.4.5 Platinum
Platinum (Pt) can catalyse oxidation reactions, such as the oxidation of CO, and reduction reactions. In fact, Pt catalysts can be used in both the anode and cathode of fuel cells (Yano et al., 2006). The studies described below examined both types of reactions. Some studies showed increasing catalytic activity as the particle size decreased; others showed the opposite effect, or a peak reactivity at a small particle size (with declining reactivity of larger particles or particles that were smaller yet), or no effect at all. Brief summaries of these studies follow.
Wang et al. (2009b), investigating the size-dependent activity of nanoplatinum bimetallic alloy catalysts (Pt3Co) on the oxygen reduction reaction (ORR), found that the specific activity of the particles increased by a factor greater than two as the particle size decreased from 9 to 3 nm while the maximum mass activity occurred at 4.5 nm. In a study of ethylene hydrogenation, the activity of 5-nm MCF-17 mesoporous
http://team/clients/rivm/shared documents/a1 - what defines nanomaterials/report/rivm_a1_final report.doc 36
Request A1: What Defines Nanomaterials?
silica-supported Pt nanocrystals was 2 to 3 times higher than that of 9-nm nanocrystals (Tsung et al., 2009). Also studying mesoporous silica-supported Pt nanocatalysts, Grass et al. (2009) evaluated the effect of particle size on the hydrogenation of crotonaldehyde to crotyl alcohol and butyraldehyde. They reported that with an increase in particle size from 1.7 to 7.1 nm, the selectivity towards crotyl alcohol as the reaction product (rather than butyraldehyde) increased from 13.7 to 33.9%. In addition, the TOF for the catalytic hydrogenation increased with increasing particle size. The initial rate of decarbonylation to form propene and CO was higher for smaller catalyst particles, and the authors inferred that these reaction products “poisoned” or deactivated the smaller catalyst particles to a greater degree than the larger catalyst particles, thus explaining the higher TOF for larger particles.
Mayrhofer et al. (2005) found that the specific activity of carbon-supported Pt catalysts increased with decreasing particle size (from 30 to 1 nm) for the CO oxidation reaction and decreased with decreasing particle size for ORR.
Several studies found that specific activity decreased with decreasing particle size. However given the ranges of particle sizes tested in two of the studies, the results may be consistent with the data described further below which showed a maximum reactivity at a relatively small particle size, with reactivity decreasing for particles larger or smaller than that critical size. A study of particles ranging in size from bulk to nanoscale (Nesselberger et al., 2011) found that the specific activity of the ORR decreased as particle size decreased from 5,000,000 nm to 5 nm. Differences in the ORR from 5 to 1 nm Pt were insignificant. Wang et al. (2010), working with a Pt-Co bimetallic alloy supported on carbon black, found that as the particle size decreased from 9 to 3 nm, the specific activity for ORR also decreased , with the activity at 9-nm nanoparticles being twice that for 3-nm Pt3Co nanoparticles. The authors noted that 4.5-nm Pt3Co nanoparticles exhibited the maximum mass activity for the ORR.
Two studies identified an optimum particle size, above and below which reactivity decreased. Sharma et al. (2003) used Pt nanoparticles (ranging from 10 to 80 nm in size) to catalyse the reaction between Fe(CN)6
3- and S2O32-. The maximum reaction
rate was observed at a catalyst particle diameter of ca. 38 nm. Below a catalyst particle diameter of 38 nm, the reaction rate decreased with the decrease in particle size. Above a catalyst particle diameter of 38 nm, the experimental results showed a steady decline of reaction rate with increasing size. The authors attributed the slow reaction rate for the smallest particles to surface adsorption of Fe(CN)6
3- onto the nanoparticles and consequent enhancement of band gap, which leads to a higher activation energy for particle-mediated electron transfer. As the size of the particle is increased to 38 nm the band gap is reduced, leading to lower energy for the reaction process. For larger particles (> 38 nm), the total surface area available for the reactants becomes an

http://team/clients/rivm/shared documents/a1 - what defines nanomaterials/report/rivm_a1_final report.doc 37
Request A1: What Defines Nanomaterials?
important factor in deciding the reaction rate. Perez et al. (1998) found that the activity of Pt nanoparticles supported on carbon electrodes depended on solution pH, particle size, and the structure of the active layer. In alkaline solution, the maximum specific activity occurred at ca. 4.5 nm, then decreased at sizes of 9 to 12 nm and then an increase in specific activity up to the maximum diameter tested, 16.5 nm. The authors noted that in alkaline solution, the carbon played a role in the reaction. However in acid medium specific activity decreased with decreasing particle size, particularly when the calculation compensated for the structural effects of the active layer.
One study found no effect of particle size on reactivity. Yano et al. (2006) tested the reactivity of Pt supported on carbon black (nanoparticles 1.6 to 4.8 nm in size). They concluded that “the electronic properties of the surface atoms on platinum nanoparticles do not show any particle size effect” with respect to ORR.
3.4.6 Other Substances
This section of the report summarizes information obtained for other substances. Typically, only one or two studies were performed on each of the substances described below.
3.4.6.1 Metals
Sun et al. (2006) studied the reaction of Al particles (passivated with a layer of Al2O3 and ranging in size from 17 to 3000 nm) with oxygen and with molybdenum trioxide (MoO3). They found that the maximum oxidation reaction rate increased with decreasing particle size over the size range tested. Zachariah et al. (2004) tested the oxidation of Al particles between ca. 15 and 150 nm. The rate of oxidation of Al increased with decreasing particle size. Aluminium nanopowder with a primary particle size > ca. 80 nm was not fully oxidised even at 1100 °C.
A study of the catalytic activity of Ni aerosols (5 to 26 nm) found that the reactivity varied with particle size such that reactivity peaked at a critical size and then declined for particles larger or smaller than that size. The test reaction was the methanation of CO and H2, and reactivity was characterised according to the TOF. The TOF increased by a factor of 20 between Ni particle sizes of 5 and 18 nm and decreased to the initial value for particles 25 to 26 nm (Seipenbusch et al., 2000).
Two papers identified in the literature search described the reactivity of silver particles of various sizes. Ivanova and Zamborini (2010) studied the voltammetry of citrate-capped Ag nanoparticle oxidation as a function of size. The redox potential decreased with decreasing particle size (i.e., greater tendency to be oxidised as particle size decreases) within the size ranged studied of 10.4 to 44.2 nm. Chaki et al. (2004)
http://team/clients/rivm/shared documents/a1 - what defines nanomaterials/report/rivm_a1_final report.doc 38
Request A1: What Defines Nanomaterials?
investigated the variation in electrochemical properties with size for Ag nanoparticles, 2 to 7.2 nm in size, which were protected with dodecanethiol in aqueous medium. The authors concluded based on voltammetric data that electron transfer facility in redox reactions should be at its maximum, within the size range tested, at 3.5 to 6 nm.
3.4.6.2 Metal Oxides
Zaki et al. (2011) investigated the relationship between the catalytic activity of anatase TiO2 nanoparticles and particle diameter. This study found that smaller particle sizes (within the size range 8 to 19 nm) had a larger number and/or energy of catalytically active sites, as evidenced by an increase in the TOF of alcohol decomposition with decreasing particle size. A second study evaluated the reactive oxygen species (ROS) generating capacity of anatase TiO2 nanoparticles of nine different sizes between 5 and 182 nm. The production of ROS was constant with size for particles < 10 nm and > 30 nm, with a sharp increase between 10 and 30 nm (Jiang et al., 2008). The authors noted that for particles between 30 and195 nm and below 10 nm, the ROS activity was proportional to the surface area. They also noted that reactivity can be related to the defect site density (i.e., density of defects in the crystalline structure) and that the defect site density is approximately constant above 30 nm, decreases between 30 and 10 nm, and then is very low and approximately constant for particles below 10 nm.
An investigation into the size-dependent redox potentials of ZnO particles between 2.55 and 4.22 nm in size found that the critical redox potential increased with decreasing particle size (Hoyer and Weller, 1994).
Two studies were identified which investigated the reactivity of ruthenium dioxide (RuO2). Jirkovský et al. (2006) studied the electrochemical behaviour of RuO2 in acidic media containing chlorides to address the activity of nanocrystals toward both oxygen and chlorine evolution reactions (OER and CER, respectively). They found that the activity of the nanoparticles for the OER increased with decreasing particle size from 50 to 10 nm but did not find a size-related effect for CER. These relationships were explained by the amount of crystalline edges and faces present on the particles. Nowakowski et al. (2008) studied the catalytic conversion of methane by RuO2 nanoparticles ranging from 8 to 16.5 nm; it was found that catalytic efficiency increases with decreasing particle size.
Finally, Kumar et al. (2004) evaluated the catalytic activity of uranium oxide (U3O8) co-encapsulated in the pore system of mesoporous silica for the decomposition and oxidation reactions of methanol. Nanoparticles were produced by two different methods resulting in particle size ranges of 2 to 5 nm and 3 to 15 nm. The catalysts synthesised by different methods had different structures, in addition to different sizes.

http://team/clients/rivm/shared documents/a1 - what defines nanomaterials/report/rivm_a1_final report.doc 39
Request A1: What Defines Nanomaterials?
The study found that the 2- to 5-nm particles had a higher catalytic activity than the particles ranging from 3 to 15 nm in size.
3.4.6.3 Carbon
Williams et al. (2010), working with diamond nanoparticles, found that reactivity of the particles increased as the particle size decreased from 20 to 4 nm. Core-sized diamond nanoparticles (4 nm) were able to react with molecular hydrogen while 20-nm diamond nanoparticles and bulk diamond particles did not.
3.4.7 Summary
Mayrhofer et al. (2005) provided succinct perspective on the effect of catalyst particle size:
Decades before the prefix “nano” appeared so prominently in the scientific lexicon, catalytic chemists had already realized that unique catalytic properties were obtained on metallic clusters in the diameter range of 1 to 10 nm…. In the scale of this dimension, two kinds of parameters can control the catalytic activity of nanoparticles: electronic factors, mainly related to the surface electronic structure and energetics, and geometric factors, naturally believed to be associated with the topography of atom distribution on the catalysts’ surface. … Given that the distribution of surface atoms varies with the characteristic dimension of the aggregates, each size cluster may exhibit unique electronic and structural properties. This would generate what is now widely known in heterogeneous catalysis as the “crystallite size effect”, that is, the variation of the reaction rate or selectivity with the characteristic dimension of a metallic catalyst.
Most of the studies described in this report determined that reactivity increased as particle size decreased, with maximum activity often occurring below 15 to 20 nm. Some studies reported the opposite effect, and some noted a size corresponding to peak reactivity (with lesser reactivity of particles above and below that size). The studies often focused on particles well below 100 nm in size and such studies do not aid in evaluating the upper bound of the proposed definition of a nanomaterial.
At least two phenomena, electronic and geometric, may explain the size dependence of reactivity. First, decreasing the particle size increases the relative number of atoms at the surface of the particle; not only does that mean that a higher proportion of atoms are available to participate in reactions, but they are less energetically stable than the atoms in the centre of the particle. Second, some reactions depend on geometry. A reaction may require a certain type of surface atom, e.g., a crystal edge or face, in

http://team/clients/rivm/shared documents/a1 - what defines nanomaterials/report/rivm_a1_final report.doc 40
Request A1: What Defines Nanomaterials?
order to occur. Reactivity may also be affected by the presence of capping agents, solution conditions, or the sorption of reactants to the particle surface.
3.5 Photocatalytic Reactivity
The following paragraphs summarize studies of the effect of particle size on the photocatalytic activity of titanium dioxide, cadmium sulphide, and gold-titanium dioxide films and composites.
3.5.1 Titanium Dioxide
Several studies have evaluated the effect of particle size on the photocatalytic degradation of chlorinated solvents such as chloroform (CHCl3) and trichloroethylene (TCE). Wang et al (1997) tested primarily anatase TiO2 particles between 6 and 21 nm in size and found that the highest photoactivity occurred for the intermediate particle size of 11 nm. Zhang et al. (1998) found similar results: for pure TiO2 catalysts, which were primarily anatase, the photonic efficiency18 of pure TiO2 increased when particle size was reduced from 21 to 11 nm, but decreased when the size was further reduced to 6 nm; they concluded that a particle size of ca. 10 nm might be the optimal value for pure TiO2 photocatalyst in liquid-phase decomposition of CHCl3.
Maira et al. (2000) examined the photocatalytic activity of nanometre-sized anatase TiO2 and TiO2 aggregates using gas-phase TCE photooxidation. The rate of oxidation increased as the TiO2 crystal size decreased from 27 to 7 nm, but catalyst activity dropped when smaller primary particles (i.e., 3.8 and 2.3 nm) were used. The authors propose that the drop in catalyst activity for crystal sizes smaller than 7 nm may be due to changes in the structural and electronic properties of the nanometre crystals. Secondary particle size also had a strong effect on the catalytic activity of TiO2. For aggregates smaller than 600 nm, TCE conversion exhibited a rapid linear decline with increasing secondary particle size.
Three studies tested the efficacy of various sized nanoparticles in the photooxidation of phenol. The first investigated the photoactivities of TiO2 nanoparticles (4 to 58.2 nm) in the anatase, rutile or mixed-phases (Gao and Zhang, 2001). For rutile TiO2, the photocatalytic activity increased with decreasing crystallite size (40.8 to 7.2 nm), and the activity of rutile-type TiO2 nanoparticles of 7.2 nm in size was comparable to that of anatase TiO2 nanoparticles. Another study used TiO2 particles (> 70% anatase; < 30% rutile) between 5 and 169 nm in size as photocatalysts for the oxidation of phenol.
18 Photonic efficiency is defined as the ratio of the overall rate of photocatalytic process to the intensity of incident light falling on the reactor. (Klabunde, K. J. and Richards, R. M. [Eds.] 2009.)
http://team/clients/rivm/shared documents/a1 - what defines nanomaterials/report/rivm_a1_final report.doc 41
Request A1: What Defines Nanomaterials?
Researchers observed a strong effect of particle size on photoactivity. They found that the effects of particle size on the efficiency of light absorption and scattering and charge-carrier dynamics at particle sizes < 25 nm dominated the apparent photoactivity of TiO2, and concluded that an optimum particle size of 25 to 40 nm existed under the test conditions (Almquist and Biswas, 2002). The third study (Calza et al., 2007) showed that the reaction rate for the photocatalytic degradation of phenol by TiO2 nanoparticles increased with increasing particle size over the range of 3.7 to 7.8 nm.
Another study (Jang et al. 2001) evaluated the decomposition of several materials – methylene blue, two bacterial species, and ammonia gas – by TiO2 nanoparticles at varying particle size and anatase mass fractions (the latter at a constant particle size of 15 nm) under low intensity UV light. The photocatalytic decomposition of methylene blue (1 mW UV light) increased with decreasing particle size from 30 to 15 nm; however, the effect of anatase mass fraction played a more important role in enhancing the degrees of decomposition of methylene blue than did particle size. TiO2 nanoparticles of smaller size (13 to 15 nm) were more effective in the decomposition of both bacterial species at 1 µW UV light. Again, the anatase mass fraction was much more effective in the decomposition of the bacteria than the particle size. For the decomposition of ammonia gas (1 µW UV light), 13- to 15-nm nanoparticles were more effective than were large particles (28 to 30 nm).
In summary, the research described here indicates that reactivity increases with decreasing particle size. In some cases that occurred until a particle size of approximately 7 to 11 nm, and particles that were smaller still showed reduced photoreactivity. In addition to depending on particle size, photoreactivity depended on the mineral form (anatase or rutile) of TiO2.
3.5.2 Cadmium Sulphide
Pal et al. (2004) investigated the size-dependent photocatalytic activity of silica-coated cadmium sulphide for the dehydrogenation of methanol, using catalyst particles of 2.4 to > 100 nm in size and found the maximum reaction rate was obtained for 2.8-nm particles. Above and below this size the reaction rate decreased. Datta et al. (2008) performed experiments to investigate the size-dependency of photocatalytic activity of thiol-capped CdS nanoparticles on nitroaromatics. The photocatalytic rate constant increased with decreasing particle size (5.8 to 3.8 nm). The authors noted that for particles > 6 nm, the photocatalytic efficiency of CdS nanoparticles is negligible.
3.5.3 Gold–Titanium Dioxide and Other Gold Nanoparticles
As described by Yogi et al. (2011), “Improvement of the photocatalytic activity of TiO2 is one of the most important aspects of heterogeneous photocatalysis. Au nanoparticles
http://team/clients/rivm/shared documents/a1 - what defines nanomaterials/report/rivm_a1_final report.doc 42
Request A1: What Defines Nanomaterials?
(AuNPs)-doped TiO2 is well-known to possess a high photocatalytic activity due to its inhibition of a recombination of photogenerated electron hole pairs by AuNPs.” Several studies, as summarised below, have examined the effect of varying the Au nanoparticle size on the photocatalytic activity of Au-doped TiO2.
A study of the reduction of reduction of boron-dipyrromethene via gold-titanium dioxide (Au-TiO2) composite nanoparticles (5 to 14 nm) found that the time for substrate to adsorb to catalyst surface and to be catalysed decreased with decreasing particle size (Wang et al., 2011).
Kaur and Pal (2012) investigated the effects of the size and shape of supported Au nanoparticles on the co-catalytic activity imparted to TiO2 during photocatalytic oxidation of salicylic acid. The photodegradation rate was rapidly enhanced with decreasing size of Au nanoparticles on the TiO2 catalyst from 9.5 nm to > 5 nm and 3.5 nm. The addition of Au nanoparticles to TiO2 increased the rate of photodegradation compared to bare TiO2.
Yogi et al. (2011) investigated the size effects of Au nanoparticles on the TiO2 crystalline phase of nanocomposite Au nanoparticle-embedded TiO2 (Au-TiO2) thin films, their adsorption ability, and photocatalytic activity. Their results showed an indirect effect of particle size on reactivity. The size of the Au nanoparticle affected the TiO2 crystalline phase (anatase vs. rutile); the highest photocatalytic activity occurred in the film with the well-crystallised anatase phase.
Another type of gold nanoparticle has also been studied. Kell et al. (2005) evaluated the photoreactivity of Au-core monolayer-protected nanoparticles modified using a series of aryl ketones. Their objective was to probe aspects of site reactivity as it varies with core size, recognizing that reactivity may depend on aspects of the structure/ crystallinity that vary with nanoparticle size. The reactivity of aryl-ketone modified Au nanoparticles increased with decreasing particle size from 4.6 to 1.7 nm for all four ketones tested.
3.5.4 Summary
The studies summarised herein, for TiO2, CdS, and Au and various Au composites, generally showed that photoreactivity increased with decreasing particle size. In some cases the behaviour of the material changed at a particle size of approximately 5 to 10 nm. For example, some studies of TiO2 showed that photoreactivity reached a maximum at a particle size of approximately 7 to 11 nm, and decreased at smaller sizes. A study of CdS showed that particles above 6 nm in size were not photoreactive at all, but that smaller particles effectively catalysed the dehydrogenation of methanol.
http://team/clients/rivm/shared documents/a1 - what defines nanomaterials/report/rivm_a1_final report.doc 43
Request A1: What Defines Nanomaterials?
4 Discussion
By compiling and evaluating the literature on critical physical/chemical parameters of nanomaterials, this project sought to define, where possible, the particle sizes at which the “nano” distinction might become clear. Review of the literature indicated that:
• Few published studies tested materials at size ranges that included particles both above and below the threshold criterion of 100 nm;
• The studies focused on inorganic substances rather than carbon-based nanomaterials; and
• Most studies did not use standard methods, in part because the research community has struggled with the application of standard methods to nanomaterials and in part because much of the research to date has occurred in university research laboratories.
Physical/chemical properties were prioritised with respect to their potential variation with size and importance with respect to fate, transformation, and/or toxicological effects in the environment. The findings for high priority parameters are presented below, followed by a discussion of lower priority parameters and recommendations.
4.1 High Priority Properties
The high priority physicochemical properties investigated were surface morphology, crystalline structure, water solubility / dissolution, reactivity and photocatalytic activity. Of these properties, water solubility and reactivity/ photoreactivity have the most direct implications for environmental fate, transformation, and toxicity of nanomaterials.
The effects of particle size on surface morphology have not been widely investigated in the peer-reviewed literature.
Many studies have investigated the size-related effects on crystallinity, including contraction / expansion of the unit cell (lattice contraction / expansion) and phase transformation between different crystalline phases of inorganic materials. Crystallinity can affect solubility and reactivity, and thus influence the fate, transformation, and toxicity of nanomaterials, and thus was assigned a high priority. The majority of the studies reported size related effects. Most notably, they reported that distortion of the crystal lattice structure and the transformation between different crystalline forms occur at particle sizes ranging from 11.7 to 200 nm (See Table 5). However, no simple conclusions can be drawn to inform the definition of nanomaterials.
It is widely understood that nanosizing materials increases the rate of dissolution and equilibrium water solubility concentration. Both phenomena have immediate

http://team/clients/rivm/shared documents/a1 - what defines nanomaterials/report/rivm_a1_final report.doc 44
Request A1: What Defines Nanomaterials?
implications for environmental effects: an increase in the rate of solubility could, for example, change the dynamics of toxicity, and an increase in equilibrium solubility could increase the bioavailability and thus perhaps the toxicity of a substance. A common application of this phenomenon is in the pharmaceutical industry where drugs are milled to nanosizes to increase the bioavailability. The majority of the peer-reviewed literature investigating water solubility/dissolution of nanomaterials study poorly-soluble organic compounds used in the pharmaceutical industry. A small number of papers investigated the size-related effects of water solubility / dissolution; a ‘bright line’ particle size threshold could not be calculated from these papers. However, some data suggest that equilibrium solubility concentrations of substances originating from nanoparticles may be greater than the equilibrium concentration resulting from dissolution of larger particles.
The catalytic and photocatalytic properties of inorganic materials can be enhanced through a reduction in size, particularly at particle sizes much smaller than 100 nm. The majority of the peer-reviewed literature on this topic describes the catalytic and photocatalytic activities of various materials at sizes in the range of 1 to 20 nm. ‘Bright line’ particle size thresholds were determined from the literature as being 15 to 20 nm and 5 to 10 nm for catalytic and photocatalytic reactivity, respectively. (The literature does not suggest a second threshold at a larger particle size.) These thresholds are not useful for informing the definition of nanomaterials as they relate to the current widely-accepted particle diameter of 100 nm.
Table 5. ‘Bright Line’ Thresholds Identified in the Literature Review
Substance Bright Line Threshold Identified?
Bright Line Threshold (nm)
Basis for Threshold
Surface morphology None N/A N/A
Crystalline structure Yes 11.7 to 200
Distortion of crystal lattice structure
Different crystalline forms
Water solubility / Dissolution None N/A N/A
Reactivity Yes 15 to 20 Maximum catalytic activity
Photocatalytic activity Yes 5 to 10 Maximum photocatalytic activity

http://team/clients/rivm/shared documents/a1 - what defines nanomaterials/report/rivm_a1_final report.doc 45
Request A1: What Defines Nanomaterials?
4.2 Lower Priority Properties
Some of the parameters assigned a lower priority in this project may also be important to environmental fate and transformation in some cases. Physical hazards can result from the increase in flammability, self-ignition potential, and explosiveness that can result from decreasing particle size. The effect of particle size on magnetism has been widely evaluated for non-environmental purposes, but may affect the environmental transport of certain metals such as nano zero-valent iron.
Finally, it may be worth noting that the particle-size dependence of two properties that were screened out of this evaluation may become more important as scientists gather more data. Zeta potential characterises the electrokinetic potential of a nanoparticle suspended in solution. It indicates the tendency for nanoparticles to either agglomerate or remain suspended. Dispersibility, a related parameter, describes the relative number or mass of suspended particles. Both parameters relate to the potential for environmental transport in aqueous suspension as nanoparticles or, conversely, to agglomerate and accumulate in soil or sediment. Very limited data published within the last few years suggest that these parameters may relate to particle size. Zeta potential and dispersibility may be very important to the definition of nanomaterial, as the concepts were initially developed in the characterisation of colloids (which are often defined as particles up to one micron or more in size). The currently-available data for these properties do not suffice to inform the definition of nanomaterial, however.
4.3 Recommendations
One way to view the data presented in this report is to ask how well they characterise the properties of the nanomaterials in most common use. The answer to that question illuminates the practical aspects of developing a definition for nanomaterials. A second way to assess the data is to consider how well the data describe the nanomaterials that they have characterised. Each of these questions is addressed below within the context of developing recommendations for further evaluation.
4.3.1 Adequacy of Data with Respect to Common Nanomaterials
The definition of nanomaterials refers to “natural, incidental or manufactured material”. Few data were identified on the size-related properties of natural or incidental materials.
Information from several authorities on the prevalence of specific nanomaterials in commerce was compared to the data reviewed in this study to determine how well those data represent the characteristics of the most common nanomaterials in commerce.
http://team/clients/rivm/shared documents/a1 - what defines nanomaterials/report/rivm_a1_final report.doc 46
Request A1: What Defines Nanomaterials?
The OECD has focused on the following substances in their Safety Testing of a Representative Set of Manufactured Nanomaterials (OECD, 2010): aluminum dioxide, cerium dioxide, dendrimers19, fullerenes (C60), gold nanoparticles, iron nanoparticles, multi-walled carbon nanotubes (MWCNTs), nano clays, silicon oxide, silver nanoparticles, single walled carbon nanotubes (SWCNTs), titanium dioxide, and zinc oxide.
For additional perspective on the nanomaterials in most common use, one can also consider inventories of consumer products that contain nanomaterials. RIVM has compiled an inventory of nanomaterials in consumer products on the European market in 2010 (Wijnhoven et al., 2011). It includes a total of 858 consumer products with a “nanoclaim”. Further work by RIVM to characterise nanomaterials in consumer products “focused on the presence of nanomaterials of the elements silver, silicon, titanium and/or zinc, as these are the insoluble ‘hard’ nanomaterials that are most likely to be present in consumer products” (Oomen et al., 2011).
The RIVM inventory is based in part on a database of nano-enabled consumer products, compiled by the Project on Emerging Nanomaterials20, which now lists 1,317 items. Figure 2 illustrates the nanomaterials found most often in those products and the relative frequency with which they occur.
Finally, a few nanomaterials are used in high quantities for very specialised uses. For example, nanoparticles of copper carbonate are widely used in wood preservation and may represent the nanomaterial in greatest commercial use, by tonnage, according to one source (Evans, 2009).
19 “Dendrimers are hyper-branched, well-organized polymer molecules made up of three components: core, branches, and end groups. Dendrimer surfaces terminate in several functional groups that can be modified to enhance specific chemical activity” (OECD, 2009b). 20 Data obtained from product inventories maintained by The Project on Emerging Nanotechnologies http://www.nanotechproject.org/inventories/ as of April 14, 2011.

http://team/clients/rivm/shared documents/a1 - what defines nanomaterials/report/rivm_a1_final report.doc 47
Request A1: What Defines Nanomaterials?
Figure 2. Nanomaterials Found Most Frequently in Consumer Products
In summary, these various sources indicate that the following nanomaterials may be in particularly wide use: aluminum dioxide, cerium dioxide, dendrimers, fullerenes (C60), gold nanoparticles, iron nanoparticles, MWCNTs, nano clays, silicon oxide, silver nanoparticles, SWCNTs, titanium dioxide, and zinc oxide; copper carbonate may also be important commercially. Substances in wide use are important with respect to the potential for exposure and the consequent applicability of regulations.
In contrast, and as illustrated in Figure 3, the studies reviewed in this project pertained primarily to gold, titanium dioxide, platinum, silver, and cobalt21. Few or no size-related data were available for aluminum dioxide, cerium dioxide, copper carbonate, dendrimers, fullerenes (C60), iron nanoparticles, MWCNTs, nano clays, silicon oxide, SWCNTs, or zinc oxide. Some of these materials (i.e., dendrimers, fullerenes, carbon nanotubes) are arguably nanomaterials by definition. Therefore data on the size-related properties of such materials may not be as relevant to the definition of nanomaterials.
21 “Other” in Figure 3 includes substances for which only one study was identified: C (diamond), CdSe, CuO, In(OH)3, LiIn(WO4)2, PbS, PbZrO3, Pd3Co, Pr, Pt3Co, Sb, SiO2, SnO2, U3O8, V.

http://team/clients/rivm/shared documents/a1 - what defines nanomaterials/report/rivm_a1_final report.doc 48
Request A1: What Defines Nanomaterials?
Figure 3. Number of Studies Reviewed for Each Substance
In summary, this comparison suggests that few size-related data are available for some of the nanomaterials in widest use. In particular, additional data on copper carbonate, silicon, zinc, organic nanomaterials, and some characteristics of silver and titanium dioxide would be valuable. The OECD programme on Safety Testing of a Representative Set of Manufactured Nanomaterials will provide some relevant data, but is not expressly designed to test materials of various particle sizes and compare those data to the characterisation of bulk materials.
Therefore, one recommendation is to obtain additional data on the size related properties of common nanomaterials in commercial use, and to consider whether additional data should be collected on the size-related properties of natural or incidental nanomaterials.
4.3.2 Adequacy of Data with Respect to Parameters Characterised
The data summarised in this report were also reviewed with respect to their adequacy to describe the nanomaterials tested.
Solubility – both the rate of dissolution and the equilibrium solubility concentration – is fundamental to environmental fate and the risks resulting from exposure.

http://team/clients/rivm/shared documents/a1 - what defines nanomaterials/report/rivm_a1_final report.doc 49
Request A1: What Defines Nanomaterials?
Thermodynamic theory predicts the change in equilibrium solubility with particle size, yet few data are available from laboratory studies. Those studies examined the solubility of metals in the following substances: particulate air pollutants, silver, hematite, lead sulphite, and brushite. The data do not adequately characterise the size-related solubility of nanomaterials, particularly by comparison to the roster of the most common nanomaterials described above.
The size dependence of reactivity has been extensively studied for many catalysts. Few studies were identified, however, pertaining to the size-dependent reactivity of some of the most common nanomaterials, including copper, silver, titanium, and zinc.
Zeta potential and dispersibility characterise the properties which determine whether a particle is transported in aqueous suspension or else agglomerates and accumulates in soil or sediment. These parameters may relate to particle size. Additional data need to be collected to characterise the size dependence of these properties.
The effects of particle size on crystallinity have been widely studied for some substances. Changes in crystallinity can affect the behaviour of a material in the environment. However, the data reviewed in this project do not point to a simple relationship between size-related changes in crystallinity and characteristics such as solubility or reactivity, Therefore, collection of additional data regarding crystallinity is considered of lower priority with respect to the recommendations of this report than the data described above.

http://team/clients/rivm/shared documents/a1 - what defines nanomaterials/report/rivm_a1_final report.doc 50
Request A1: What Defines Nanomaterials?
5 Conclusions
This project constituted a review of the literature to determine which physicochemical properties make a nanomaterial different from a ‘conventional’ material and at what size these properties change to ‘nanospecific’ properties. The European Commission (2011) definition of “nanomaterial” provided the context for the review. That definition is:
A natural, incidental or manufactured material containing particles, in an unbound state or as an aggregate or as an agglomerate and where, for 50% or more of the particles in the number size distribution, one or more external dimensions is in the size range 1 to 100 nm.
In specific cases and where warranted by concerns for the environment, health, safety or competitiveness the number size distribution threshold of 50% may be replaced by a threshold between 1 and 50%.
By derogation from the above, fullerenes, graphene flakes and single wall carbon nanotubes with one or more external dimensions below 1 nm should be considered as nanomaterials.
A review of the parameters which characterise nanomaterials at ambient temperatures and pressures led to a focus on morphology/crystallinity, water solubility, reactivity, and photoreactivity. Other characteristics may also vary with particle size but were judged to be of lesser priority and so are not discussed in this report in detail. Those parameters include, among others, flammability, autoflammability, explosiveness and magnetism.
The scientific literature was reviewed to obtain information on the effect of particle size on morphology/ crystallinity, water solubility, reactivity, and photoreactivity. Few published studies tested materials at size ranges that included particles both above and below the threshold criterion of 100 nm. That lack of information, along with a general lack of experimental focus on the percentage of particles in a test substance within the size range 1 to 100 nm, limited the evaluation described in this report with respect to the EU definition of nanomaterials. Most of the papers described herein pertained to metals and metal oxides rather than carbon-based substances. The emphasis on metals and metal oxides in the published literature may reflect the commercial value of such inorganic substances and the consequent impetus to research their properties. It may also reflect in part the parameters evaluated. For example, carbon-based substances such as carbon nanotubes are valued in part due to their physical strength and conductivity and the search terms used in this study, which were based on the study objectives, did not reflect such properties.

http://team/clients/rivm/shared documents/a1 - what defines nanomaterials/report/rivm_a1_final report.doc 51
Request A1: What Defines Nanomaterials?
The outcome of the literature review for each of the target parameters is summarised below.
Surface morphology may affect the rate of dissolution and equilibrium solubility, as well as the reactivity of a particle. The literature review identified two relevant papers. These papers suggest that in some cases the shape and structure of an inorganic particle may depend upon its size, but the data are too few to draw general conclusions about the size dependence of morphology. Additional information is available regarding the effect of size on crystalline structure, a specific aspect of morphology.
The crystalline phase refers to how molecules are physically arranged in space. Many materials with the same chemical composition can have different lattice structures and consequently exhibit different physicochemical properties. The literature search identified 46 papers that examined size-related effects on crystalline structure, most of which indicated that crystalline structure depended in some way on particle size. The researchers often recognised the interrelationship between calcination temperature, particle size, and crystalline structure. Several aspects of the crystallinity of metals and metal oxides may vary with particle size. With changes in particle size the unit cell can contract or expand, as represented by changes in lattice parameters. Particles of two different sizes can also assume different crystalline phases. In some cases, different experiments with the same material found different results with respect to lattice contraction or expansion. In summary, while many studies have demonstrated size-related effects, no simple conclusions can be drawn to inform the definition of nanomaterial.
Water solubility can depend on particle size, as well as on solution characteristics and the particle coating. Two aspects of water solubility can change with particle size: the rate of dissolution and the equilibrium solubility concentration. The rate of dissolution of soluble materials commonly increases with decreasing particle size. However, based on the 9 papers reviewed in this report, no clear threshold of a size-related effect exists to support a definition of nanomaterial. Further, thermodynamic theory predicts that equilibrium solubility should increase with decreasing particle size, which is supported by some experimental data. Thermodynamic considerations suggest that the solubility varies as an exponential function of the particle size diameter.
Catalytic activity was studied as a measure of nanoparticle reactivity, which also depends on particle size. Decreasing the particle size affects the surface free energy and can change the geometry at the surface of the particle, thereby increasing the catalytic activity of surface atoms. Most of the studies described in this report determined that catalytic activity increased as particle size decreased, with maximum

http://team/clients/rivm/shared documents/a1 - what defines nanomaterials/report/rivm_a1_final report.doc 52
Request A1: What Defines Nanomaterials?
activity often occurring below 15 to 20 nm. Some studies reported the opposite effect, and some noted a size corresponding to peak reactivity (i.e., with lesser catalytic activity of particles above and below that size).
Photoactivity refers to the generation of electron-hole pairs by nanomaterials exposed to light. The thirteen studies summarised herein generally showed that photoreactivity increased with decreasing particle size. In some cases the behaviour of the material changed at a particle size of approximately 5 to 10 nm.
Finally, as discussed in the Recommendations section of this report, the data do not suffice to characterise the size-related behaviour of natural or incidental nanomaterials or of many of the common nanomaterials in commercial use. Additional data on the critical properties of such materials would provide valuable input to the definition of nanomaterials.
http://team/clients/rivm/shared documents/a1 - what defines nanomaterials/report/rivm_a1_final report.doc 53
Request A1: What Defines Nanomaterials?
6 References
Akdogan, E. K., Rawn, C. J., Porter, W. D., Payzant, E. A. and Safari, A. 2005. Size effects in PbTiO3 nanocrystals: Effect of particle size on spontaneous polarization and strains. Journal of Applied Physics, 97: 084305.
Almquist, C. B. and Biswas, P. 2002. Role of synthesis method and particle size of nanostructured TiO2 on its photoactivity. J. Catalys., 212: 145–56.
Ambrus, R., Kocbek, P., Kristl, J., Sibanc, R., Rajkó, R. and Szabó-Révész, P. 2009. Investigation of preparation parameters to improve the dissolution of poorly water-soluble meloxicam. International Journal of Pharmaceutics, 381 (2): 153-9.
Anschutz, A. J. and Penn, R. L. 2004. Size dependent reactivity of iron oxyhydroxide nanoparticles. Interfacial Phenomena: Linking Atomistic and Macroscopic Properties. Abstract. 1:00 PM-5:50 PM, Tuesday, March 30, 2004 Marriott -- Marquis NW, Oral Division of Geochemistry. The 227th ACS National Meeting, Anaheim, CA, March 28-April 1, 2004.
Anschutz, A. J. and Penn, R. L. 2005. Reduction of crystalline iron(III) oxyhydroxides using hydroquinone: Influence of phase and particle size. Geochemical Transactions, 6(3): 60-6.
Auffan, M., Rose, J., Bottero, J.-Y., Lowry, G. V., Jolivet, J.-P. and Wiesner, M. R. 2009. Towards a definition of inorganic nanoparticles from an environmental, health and safety perspective. Nature Nanotechnology, 4: 634-641.
Ayyub, P., Palkar, V. R., Chattopadhyay, S. and Multani, M. 1995. Effect of crystal size reduction on lattice symmetry and cooperative properties. Phys. Rev. B, 51: 6135–8.
Bakhmutsky, K., Wiedera, N. L., Baldassare, T., Smith, M. A. and Gortea, R. J. 2011. A thermodynamic study of the redox properties of supported Co particles. Applied Catalysis A: General, 397(1-2): 266-71.
Barton, L. E., Quicksall, A. N. and Maurice, P. A. 2012. Siderophore-Mediated Dissolution of Hematite (α-Fe2O3): Effects of Nanoparticle Size. Geomicrobiology Journal, 29: 314-22.
Basa, S., Muniyappan, T., Karatgi, P., Prabhu, R. and Pillai, R. 2008. Production and in vitro characterization of solid dosage form incorporating drug nanoparticles. Drug Development and Industrial Pharmacy, 34 (11): 1209-18.
Bezemer, G. L., Bitter, J. H., Kuipers, H. P. C. E., Oosterbeek, H., Holewijn, J. E., Xu, X., Kapteijn, F., van Dillen, A. J. and de Jong, K. P. 2006. Cobalt Particle Size Effects in the Fischer−Tropsch Reaction Studied with Carbon Nanofiber Supported Catalysts. J. Am. Chem. Soc., 128: 3956-64.

http://team/clients/rivm/shared documents/a1 - what defines nanomaterials/report/rivm_a1_final report.doc 54
Request A1: What Defines Nanomaterials?
Borm, P., Klaessig, F. C., Landry, T. D., Moudgil, B., Pauluhn, J., Thomas, K., Trottier, R. and Wood, S. 2006. Research Strategies for Safety Evaluation of Nanomaterials, Part V: Role of Dissolution in Biological Fate and Effects of Nanoscale Particles. Toxicol. Sci., 90(1): 23-32.
Calza, P., Pelizzetti, E., Mogyorósi, K., Kun, R. and Dékány, I. 2007. Size dependent photocatalytic activity of hydrothermally crystallized titania nanoparticles on poorly adsorbing phenol in absence and presence of fluoride ion. Applied Catalysis B: Environmental, 72(3-4): 314-21.
Chaki, N. K., Sharma, J., Mandle, A. B., Mulla, I. S., Pasricha, R. and Vijayamohanan, K. 2004. Size dependent redox behavior of monolayer protected silver nanoparticles (2–7 nm) in aqueous medium. Physical Chemistry Chemical Physics, 6: 1304-9.
Chernyshova, I. V., Ponnurangam, S. and Somasundaran, P. 2010. On the origin of an unusual dependence of (bio)chemical reactivity of ferric hydroxides on nanoparticle size. Physical Chemistry Chemical Physics, 12(42): 14045.
Chernyshova, I. V., Ponnurangam, S. and Somasundaran, P. 2011. Effect of nanosize on catalytic properties of ferric (hydr)oxides in water: Mechanistic insights. Journal of Catalysis, 282(1): 25-34.
Choi, J., Reipa, V., Hitchins, V. M., Goering, P. L. and Malinauskas, R. A. 2011. Physicochemical Characterization and In Vitro Hemolysis Evaluation of Silver Nanoparticles. Toxicological Sciences, 123(1): 133-43.
Cuenya, B. R., Baeck, S. H., Jaramillo, T. F. and McFarland, E. W. 2003. Size- and support-dependent electronic and catalytic properties of Au0/Au3+ nanoparticles synthesized from block copolymer micelles. J. Am. Chem. Soc., 125(42): 12928-34.
Dai, W., Dong, L.C., and Song, Y. 2007. Nanosizing of a drug/carrageenan complex to increase solubility and dissolution rate. International Journal of Pharmaceutics, 342 (1-2): 201-7.
Datta, A., Priyam, A., Bhattacharyya, S. N., Mukherjea, K. K. and Saha, A. 2008. Temperature tunability of size in CdS nanoparticles and size dependent photocatalytic degradation of nitroaromatics. J. Colloid Interface Sci., 322(1): 128-35.
De Villiars, M. M., Aramwit, P. and Kwon, G. S. 2009. Nanotechnology in Drug Delivery. Springer. New York. Pp. 22-23. Available at: http://books.google.com/books?id=avUQuJTXnX0C&printsec=frontcover&dq=Nanotechnology+in+Drug+Delivery&hl=en&sa=X&ei=0iPKT429Ocuu6gHg54D-Dw&ved=0CEEQ6AEwAA#v=onepage&q=Nanotechnology%20in%20Drug%20Delivery&f=false .

http://team/clients/rivm/shared documents/a1 - what defines nanomaterials/report/rivm_a1_final report.doc 55
Request A1: What Defines Nanomaterials?
den Breejen, J. P., Sietsma, J. R. A., Friedrich, H., Bitter, J. H. and de Jong, K. P. 2010. Design of supported cobalt catalysts with maximum activity for the Fischer–Tropsch synthesis. J. Catal., 270: 146-52.
Deng, J.-P., Shih, W.-C. and Mou, C.-Y. 2005. Hydrogenation of Anthracene Catalyzed by Surfactant-Protected Gold Nanoparticles in Aqueous Solution: Size Dependence. Phys. Chem. Phys. Chem., 6: 2021-5.
Devalapally, H., Chakilam, A. and Amiji, M. M. 2007. Role of nanotechnology in pharmaceutical product development. Journal of Pharmaceutical Sciences, 96(10): 2547-65.
Dingreville, R., Qu, J. and Cherkaoui, M. 2005. Surface free energy and its effect on the elastic behavior of nano-sized particles, wires and films. Journal of the Mechanics and Physics of Solids, 53(8): 1827-54.
Doyle, A. M., Shaikhutdinov, S. K. and Freund, H.-J. 2005. Surface-Bonded Precursor Determines Particle Size Effects for Alkene Hydrogenation on Palladium. Angew. Chem., Int. Ed., 44: 629.
Duan, Y. W., Kou, X. L. and Li, J. G. 2005. Size dependence of structure and magnetic properties of La0.7Sr0.3MnO3 nanoparticles. Physica B: Condensed Matter, 355(1–4): 250–4.
Eckhoff, R. K. 2003. Dust explosions in the process industries. 3rd edition, Gulf Professional Publishing, 719 pp. As cited in RIVM, 2009.
Engineered Nanoparticles - Review of Health and Environmental Safety (ENRHES). 2009. Engineered Nanoparticles: Review of Health and Environmental Safety. Edingurgh Napier University, Available online at: http://ihcp.jrc.ec.europa.eu/whats-new/enhres-final-report
Environmental Defense and Dupont. 2007. Nano-Risk Framework. Available at: http://www.edf.org/documents/6496_Nano%20Risk%20Framework.pdf
European Chemicals Agency (ECHA). 2008. Guidance on information requirements and chemical safety assessment. Chapter R.7a: Endpoint specific guidance.
European Commission (EC). 2011. Recommendations of 18 October 2011 on the definition of nanomaterial. Official Journal of the European Union. Available at: http://eur-lex.europa.eu/LexUriServ/LexUriServ.do?uri=OJ:L:2011:275:0038:0040:EN:PDF (accessed 25 January 2012).

http://team/clients/rivm/shared documents/a1 - what defines nanomaterials/report/rivm_a1_final report.doc 56
Request A1: What Defines Nanomaterials?
Evans, G., Kozhevnikov, I. V., Kozhevnikova, E. F., Claridge, J. B., Vaidhyanathan, R., Dickinson, C., Wood, C. D., Cooper, A. I. and Rosseinsky, M. J. 2008. Particle size–activity relationship for CoFe2O4 nanoparticle CO oxidation catalysts. J. Mater. Chem., 18: 5518-23.
Evans, P. 2009. World’s Largest Industrial Application of Nanoparticles. Presented at: 2009 International Conference on Nanotechnology for the Forest Products Industry Edmonton, Alberta, Canada - June 23-26, 2009. Available at: http://www.tappi.org/content/events/09nano/papers/09nan69e.pdf (accessed July 9, 2012).
Fakes, M. G., Vakkalagadda B. J., Qian, F., Desikan, S., Gandhi, R. B., Lai, C., Hsieh, A., Franchini, M. K., Toale, H. and Brown, J. 2009. Enhancement of oral bioavailability of an HIV-attachment inhibitor by nanosizing and amorphous formulation approaches. Int. J. Pharm., 31; 370(1-2): 167-74.
Federal Institute for Occupational Safety and Health (BAUA). 2007. Nanotechnology: Health and environmental risks of nanomaterials – Research strategy. Final Report. December 2007. Available at: http://www.baua.de/en/Topics-from-A-to-Z/Hazardous-Substances/Nanotechnology/pdf/research-strategy.pdf;jsessionid=F5B6387481A6203E7F8C205A895F4D6A.1_cid246?__blob=publicationFile&v=2
Gamarnik, M. Y. 1994. Size-related change of lattice parameters in NiO nanoparticles. J. Aerosol Sci., 25(S1): S411-2.
Gao, L. and Zhang, Q. 2001. Effects of amorphous contents and particle size on the photocatalytic properties of TiO2 nanoparticles. Scr. Mater., 44: 1195.
Gilbert, B., Huang, F., Zhang, H., Waychunas, G. A. and Banfield, J. F. 2004. Nanoparticles: Strained and Stiff. Science, 305: 651-4.
Ghosh, T. B., Dhabal, S. and Datta, A. K. 2003. On crystallite size dependence of phase stability of nanocrystalline TiO2. J. Appl. Phys., 94: 4577.
Grass, M. E., Rioux, R. M. and Somorjai, G. A. 2009. Dependence of Gas-Phase Crotonaldehyde Hydrogenation Selectivity and Activity on the Size of Pt Nanoparticles (1.7–7.1 nm) Supported on SBA-15. Catal. Lett., 128: 1-8.
Grassian, V. H. 2008. When Size Really Matters: Size-Dependent Properties and Surface Chemistry of Metal and Metal Oxide Nanoparticles in Gas and Liquid Phase Environments. J. Phys. Chem. C., 112: 18303. As cited by Suttiponparnit et al. (2008).

http://team/clients/rivm/shared documents/a1 - what defines nanomaterials/report/rivm_a1_final report.doc 57
Request A1: What Defines Nanomaterials?
Hansen, S. F., Baun, A., Tiede, K., Gottshalk, F., van der Meent, D., Peijenburg, W., Fernandes, T. and Riediker, M. 2011. Consensus Report based on the NanoImpactNet workshop: Environmental fate and behaviour of nanoparticles - beyond listing of limitations Bilthoven, October 7th 2009. Accepted by the NanoImpactNet Management Committee on 11 February 2011. Available at: http://www.nanoimpactnet.eu/uploads/file/Reports_Publications/D2.4_Workshop_Report_Bilthoven.pdf
Haruta, H., Tsubota, S., Kobayashi,T., Kageyama, H., Genet, M. J., Delmon, B. and Catal, J. 1993. Low-Temperature Oxidation of CO over Gold Supported on TiO2, α-Fe2O3, and Co3O4. Journal of Catalysis, 144(1): 175-92.
Hermanowicz, K., Maczka, M., Tomaszewski, P. E., Krajczyk, L., Hanuza, J. and Baran, J. 2008. Size dependent structural, vibrational, and luminescence properties of nanocrystalline Liln(WO4)2:Cr3. Journal of Nanoscience and Nanotechnology, 8(7): 3545-54.
Hoshina, H., Kakemoto, H., Tsurumi, T., Wadaa, S. and Yashima, M. 2006. Size and temperature induced phase transition behaviors of barium titanate nanoparticles. J. Appl. Phy., 99, 054311.
Hoyer, P. and Weller, H. 1994. Size-dependent redox potentials of quantized zinc oxide measured with an optically transparent thin layer electrode. Chem. Phys. Lett., 221: 379-84.
Huang, T.-C., Wang, M-T., Sheu, H.-S. and Hsieh, W.-F. 2007. Size-dependent lattice dynamics of barium titanate nanoparticles. Journal of Physics: Condensed Matter, 19(47): 6212.
Ishikawa, K., Nomura, T., Okada, N. and Takada, K. 1996. Size effect on the phase transition in PbTiO3 fine particles. Jpn. J. Appl. Phys. Vol., 35: 5196-8.
Ivanova, O. S. and Zamborini, F. P., 2010. Size-Dependent Electrochemical Oxidation of Silver Nanoparticles. J. Am. Chem. Soc., 132(1): 70-2.
Jang, H. D., Kim, S.-K. and Kim, S.-J. 2001. Effect of particle size and phase composition of titanium dioxide nanoparticles on the photocatalytic properties. J. Nanopart. Res., 3: 141-7.
Jiang, L., Hsu, A., Chu, D. and Chen, R. 2009. Size-Dependent Activity of Palladium Nanoparticles for Oxygen Electroreduction in Alkaline Solutions. J. Electrochem. Soc., 156(5): B643-9.

http://team/clients/rivm/shared documents/a1 - what defines nanomaterials/report/rivm_a1_final report.doc 58
Request A1: What Defines Nanomaterials?
Jinno, J., Kamada, N., Miyake, M., Yamada, K., Mukai, T., Odomi, M., Toguchi, H., Liversidge, G.G., Higaki, K., and Kimura, T. 2006. Effect of particle size reduction on dissolution and oral absorption of a poorly water-soluble drug, cilostazol, in beagle dogs. Journal of Controlled Release, 111(1-2): 56-64.
Jirkovský, J., Hoffmannová, H., Klementová, M. and Krtil, P. 2006. Particle Size Dependence of the Electrocatalytic Activity of Nanocrystalline RuO2 Electrodes. Journal of the Electrochemical Society, 153(6): E111-8.
Joint Research Council (JRC). 2011. REACH Implementation Project Substance Identification of Nanomaterials (RIP oN1) AA N°070307/2009/D1/534733 between DG ENV and JRC. Advisory Report. March. Available at: http://ec.europa.eu/environment/chemicals/nanotech/pdf/report_ripon1.pdf
Kalimuthu, P. and John, S. A. 2008. Size dependent electrocatalytic activity of gold nanoparticles immobilized onto three dimensional sol-gel network. Journal of Electroanalytical Chemistry, 617(2): 164-70.
Karthik, K., Selvan, G. K., Kanagaraj, M., Arumugam, S. and Jaya, N. V. 2011. Particle size effect on the magnetic properties of NiO nanoparticles prepared by a precipitation method. Journal of Alloys and Compounds, 509(1): 181-4.
Kaur, T. and Pal, B. 2012. Size and shape dependent attachments of Au nanostructures to TiO2 for optimum reactivity of Au-TiO2 photocatalysis. Journal of Molecular Catalysis A: Chemical, 355: 39-43.
Kell, A. J., Donkers, R. L. and Workentin, M. S. 2005. Core size effects on the reactivity of organic substrates as monolayers on gold nanoparticles. Langmuir, 21(2): 735-42.
Kesisoglou, F., Panmai, S. and Wu, Y. 2007. Nanosizing-oral formulation development and biopharmaceutical evaluation. Adv. Drug Deliv. Rev., 30; 59(7):631-44.
Kipp, J. E. 2004. The role of solid nanoparticle technology in the parenteral delivery of poorly water-soluble drugs. International Journal of Pharmaceutics, 284(1-2): 109-22.
Kirmse, H., Stegemann, B., Neumann, W., Rademann, K. and Kaiser, B. 2003. Size-dependent phase transition from amorphous to crystalline in antimony clusters on crystalline surfaces. Microscopy and Microanalysis, 9: 338-9.
Klabunde, K. J. and Richards, R. M. [Eds.] 2009. Nanoscale Materials in Chemistry. 2nd Edtition. John Wiley & Sons, Inc. Hoboken, NJ. pp. 592, 634.
Kozlov, A. I., Kozlova, A. P., Asakura, K., Matsui, Y., Kogure, T., Shido, T. and Iwasawa, Y. 2000. Supported gold catalysts prepared from a gold phosphine precursor and as-precipitated metal-hydroxide precursors: Effect of preparation conditions on the catalytic performance. Journal of Catalysis, 196: 56-65.

http://team/clients/rivm/shared documents/a1 - what defines nanomaterials/report/rivm_a1_final report.doc 59
Request A1: What Defines Nanomaterials?
Kumar, D., Varma, S. and Gupta, N. M. 2004. The influence of particle size on H2-reduction, catalytic activity and chemisorption behavior of uranium oxide species dispersed in MCM-41: TPR, methanol-TPD and in situ FTIR studies. Catalysis Today, 93–95: 541–51.
Lamber, R., Wetjen, S. and Jaeger, N. I. 1995. Size dependence of the lattice parameter of small palladium particles. Phys. Rev. B, 51, 10968–71.
Li, G., Goates, J. B., Woodfield, B. F. and Li, L. 2004a. Evidence of linear lattice expansion and covalency enhancement in rutile TiO2 nanocrystals. Appl. Phys. Lett., 85: 2059-61.
Li, W., Ni, C., Lin, H., Huang, C. P. and Shah, S. I. 2004b. Size dependence of thermal stability of TiO2 nanoparticles. J. Appl. Phys., 96: 6663-9.
Liu, J., Arguette, D. M., Murayama, M. and Hochella, M. F., Jr. 2009a. Influence of size and aggregation on the reactivity of an environmentally and industrially relevant manomaterial (PbS). Environ. Sci. Technol., 43(21): 8178−83.
Luo, W., Hu, W. and Xiao, S. 2008. Size Effect on the Thermodynamic Properties of Silver Nanoparticles. J. Phys. Chem. C, 112: 2359-69.
Ma, R., Levard, C., Marinakos, S. M., Cheng, Y., Liu, J., Michel, F. M., Brown, G. E. and Lowry, G. V. 2012. Size-controlled dissolution of organic-coated silver nanoparticles. Environ. Sci. Technol., 46(2): 752-9.
Mahendra, S., Zhu, H., Colvin, V. L. and Alvarez, P. J. 2008. Quantum Dot Weathering Results in Microbial Toxicity. Environ. Sci. Technol., 42: 9424-30.
Maira, A. J., Yeung, K. L., Lee, C. Y., Yue, P. L. and Chan, C. K. 2000. Size effects in gas-phase photo-oxidation of trichloroethylene using nanometer-sized TiO2 catalysts. J. Catalysis.,192: 185-96.
Mayo, M. J., Suresh, A. and Porter, W. D. 2003. Thermodynamics for nanosytems: Grain and particle size-dependent phase diagrams. Rev. Adv. Mater. Sci., 5: 100-9.
Mayrhofer, K. J. J., Blizanac, B. B., Arenz, M., Stamenkovic, V. R., Ross, P. N. and Markovic, N. M. 2005. The Impact of Geometric and Surface Electronic Properties of Pt-Catalysts on the Particle Size Effect in Electrocatalysis. J. Phys. Chem. B, 109: 14433-40.
Merisko-Liversidge E. M. and Liversidge G. G. 2008. Drug nanoparticles: formulating poorly water-soluble compounds. Toxicologic Pathology, 36 (1): 43-8.
Meulenkamp, E. A. 1998. Size Dependence of the Dissolution of ZnO Nanoparticles. J. Phys. Chem. B, 102(40): 7764–9.
http://team/clients/rivm/shared documents/a1 - what defines nanomaterials/report/rivm_a1_final report.doc 60
Request A1: What Defines Nanomaterials?
Miller, J. T., Kropf, A. J., Zha, Y., Regalbuto, Z. R., Delannoy, L., Louis, C., Bus, E. and van Bokhoven, J. A. 2006. The effect of gold particle size on Au–Au bond length and reactivity toward oxygen in supported catalysts. J. Catalysis, 240: 222–34.
Morris, V. N., Farrell, R. A., Sexton, A. M. and Morris, M. A. 2006. Lattice Constant Dependence on Particle Size for Ceria prepared from a Citrate Sol-Gel. Journal of Physics: Conference Series, 26(1): 119-22.
Muller R.H. and Peters K. 1998. Nanosuspensions for the formulation of poorly soluble drugs - I. Preparation by a size-reduction technique. International Journal of Pharmaceutics, 160 (2): 229-37.
National Industrial Chemicals Notification and Assessment Scheme (NICNAS). 2010. Adjustments to NICNAS new chemicals processed for industrial nanomaterials. Australian Government Gazette, No.: C 10, 5 October 2010. Available at: http://www.nicnas.gov.au/Publications/Chemical_Gazette/pdf/2010oct_whole.pdf#page=14.
National Institute for Occupational Safety and Health (NIOSH). 2009. Approaches to Safe Nanotechnology: Managing the Health and Safety Concerns Associated with Engineered Nanomaterials. U.S. Department of Health and Human Services, Centers for Disease Control and Prevention. Available at: http://www.cdc.gov/niosh/docs/2009-125/pdfs/2009-125.pdf.
Navrotsky, A., Ma, C., Lilova, K. and Birkner, N. 2010. Nanophase Transition Metal Oxides Show Large Thermodynamically Driven Shifts in Oxidation-Reduction Equilibria. Science, 330: 199-201.
Nesselberger, M., Ashton, S., Meier, J. C., Katsounaros, I., Mayrhofer, K. J. and Arenz, M. 2011. The particle size effect on the oxygen reduction reaction activity of Pt catalysts: influence of electrolyte and relation to single crystal models. J. Am. Chem. Soc., 133(43): 17428-33.
Niu, J., Rasmussen, P., Hassan, N. and Vincent, R. 2010. Concentration distribution and bioaccessibility of trace elements in nano and fine urban airborne particulate matter: Influence of particle size. Water, Air, and Soil Pollution, 213(1-4): 211-25.
Nolte, P., Stierle, A., Kasper, N., Jin-Phillipp, N. Y., Reichert, H., Rühm, A., Okasinski, J., Dosch, H. and Schöder, S. 2008. Combinatorial high-energy x-ray microbeam study of the size-dependent oxidation of Pd nanoparticles on MgO(100). Physical Review B, 77(11): 5444-51.

http://team/clients/rivm/shared documents/a1 - what defines nanomaterials/report/rivm_a1_final report.doc 61
Request A1: What Defines Nanomaterials?
Nowakowski, P., Dallas, J.-P., Villain, S., Kopia, A. and Gavarri, J.-R. 2008. Structure, microstructure, and size dependent catalytic properties of nanostructured ruthenium dioxide. Journal of Solid State Chemistry, 181(5): 1005–16.
Oezaslan, M., Heggen, M. and Strasser, P. 2012. Size-dependent morphology of dealloyed bimetallic catalysts: linking the nano to the macro scale. J. Am. Chem. Soc., 134(1): 514-24.
Oomen, A. G., Bennink, M., van Engelen, J. G. M., Sips, A. J. A. M. 2011. Nanomaterial in consumer products: Detection, characterisation and interpretation. National Institute for Public Health and the Environment. RIVM Report 320029001/2011. Available at: http://www.rivm.nl/bibliotheek/rapporten/320029001.pdf (accessed July 2012).
Organisation for Economic Co-operation and Development (OECD). 2010. List of manufactured nanomaterials and list of endpoints for phase one of the OECD Testing Programme. ENV/JM/MONO(2008). Available at: http://www.oecd.org/officialdocuments/displaydocumentpdf/?cote=env/jm/mono(2010)46&doclanguage=en.
Organisation for Economic Co-operation and Development (OECD). 2009a. Guidance Manual for the Testing of Manufactured Nanomaterials, available at http://www.oecd.org/officialdocuments/displaydocumentpdf/?cote=env/jm/mono(2009)mr20/rev&doclanguage=en.
Organisation for Economic Co-operation and Development (OECD). 2009b. OECD Conference on Potential Environmental Bene ts of Nanotechnology: Fostering Safe Innovation-Led Growth. 15-17 July 2009, OECD Conference Centre, Paris – France. Abstracts and Session Materials. Available at: http://www.oecd.org/dataoecd/4/45/43289415.pdf (accessed July 2012).
Pal, B., Torimoto, T., Iwasaki, K., Shibayama, T., Takahashi, H. and Ohtani, B. 2004. Size and Structure-Dependent Photocatalytic Activity of Jingle-Bell-Shaped Silica-Coated Cadmium Sulfide Nanoparticles for Methanol Dehydrogenation. J. Phys. Chem. B, 108(48): 18670-4.
Palkar, V. R., Ayyub, P., Chattopadhyay, S. and Multani, M. 1996. Size-induced structural transitions in the Cu-O and Ce-O systems. Phy. Rev. B, 53(5): 2167-70.
Park, T.-J., Papaefthymiou, G. C., Viescas, A. J., Moodenbaugh, A. R. and Stanislaus, S. W. 2007. Size-Dependent Magnetic Properties of Single-Crystalline Multiferroic BiFeO3 Nanoparticles. Nano Lett., 7(3): 766-72.

http://team/clients/rivm/shared documents/a1 - what defines nanomaterials/report/rivm_a1_final report.doc 62
Request A1: What Defines Nanomaterials?
Parker, S. C. and Campbell, C. T. 2007. Reactivity and sintering kinetics of Au/TiO2(110) model catalysts: particle size effects. Topics in Catalysis, 44(1-2): 3-13.
Perez, J., Gonzalez, E. R. and Ticianelli, E. A. 1998. Oxygen electrocatalysis on thin porous coating rotating platinum electrodes. Electrochim. Acta., 44(8-9): 1329-39.
Prieto, G., Martinez, A., Concepcion, P. and Moreno-Tost, R. 2009. Cobalt particle size effects in Fischer–Tropsch synthesis: structural and in situ spectroscopic characterisation on reverse micelle-synthesised Co/ITQ-2 model catalysts. J. Catal., 266: 129-44.
Pronk, M. E. J., Wijnhoven, S. W. P., Bleeker, E. A. J., Heugens, E. H. W., Peijenburg, W. J. G. M., Luttik, R. and Hakkert, B. C. 2009. Nanomaterials under REACH - Nanosilver as a case study. RIVM report 601780003/2009. Available at: http://www.rivm.nl/bibliotheek/rapporten/601780003.pdf.
Puzyn, T., Rasulev, B., Gajewicz, A., Hu, X., Dasari, T. P., Michalkova, A., Hwang, H. M., Toropov, A., Leszczynska, D. and Leszczynski J. 2011. Using nano-QSAR to predict the cytotoxicity of metal oxide nanoparticles. Nature Nanotechnology, 6: 175-8.
Rockenberger, J. Tröger, L., Kornowski, A., Voßmeyer, T., Eychmüller, A., Feldhaus, J. and Weller, H. 2010. Size dependence of structural and dynamic properties of CdS-nanoparticles. Berichte der Bunsengesellschaft für physikalische Chemie, 101(11): 1613-6.
Sarkar, T., Barnali, G. and Raychaudhuri, A. K. 2007. Effect of Size Reduction on Charge Ordering in La0.5Ca0.5MnO3. Journal of Nanoscience and Nanotechnology, 7(6): 2020-4.
Sau, T. K., Pal, A. and Pal, T. 2001. Size regime dependent catalysis by gold nanoparticles for the reduction of eosin. J. Phys. Chem. B, 105: 9266-72.
Schalow, T., Brandt, B., Starr, D. E., Laurin, M., Shaikhutdinov, S. K., Schauermann, S., Libuda, J. and Freund, H. J. 2007. Particle size dependent adsorption and reaction kinetics on reduced and partially oxidized Pd nanoparticles. Phys. Chem. Chem. Phys., 9(11): 1347-61.
Schmidt, J. and Vogelsberger, W. 2006. Dissolution kinetics of titanium dioxide nanoparticles: The observation of an unusual kinetic size effect. Journal of Physical Chemistry B, 110(9): 3955-63.
Schwartz, V., Mullins, D. R., Yan, W., Chen, B., Dai, S. and Overbury, S. H. 2004. XAS Study of Au Supported on TiO2: Influence of Oxidation State and Particle Size on Catalytic Activity. J. Phys. Chem. B, 108: 15782-90.

http://team/clients/rivm/shared documents/a1 - what defines nanomaterials/report/rivm_a1_final report.doc 63
Request A1: What Defines Nanomaterials?
Scientific Committee on Emerging and Newly Identified Health Risks (SCENIHR). 2007. Opinion on the appropriateness of the risk assessment methodology in accordance with the technical guidance documents for new and existing substances for assessing the risks of nanomaterials. Available at: http://ec.europa.eu/health/ph_risk/committees/04_scenihr/docs/scenihr_o_010.pdf.
Scientific Committee on Emerging and Newly Identified Health Risks (SCENIHR). 2009. Risk assessment of products of nanotechnologies. Available at: http://ec.europa.eu/health/ph_risk/committees/04_scenihr/docs/scenihr_o_023.pdf.
Scientific Committee on Emerging and Newly Identified Health Risks (SCENIHR). 2010. Scientific basis for the definition of the term “nanomaterial.” Available at: http://ec.europa.eu/health/scientific_committees/emerging/docs/scenihr_o_032.pdf.
Seipenbusch, M., Weber, A. P and Kasper, G., 2000. Aerosol catalysis on nickel-nanoparticles: Dependence of catalytic activity on particle size. Journal of Aerosol Science, 31(S1): S634-5.
Selbach, S. M., Tybell, T., Einarsrud, M. A. and Grande, T. 2007. Size-dependent properties of multiferroic BiFeO3 nanoparticles. Chem. Mater., 19: 6478-84.
Sellers, K., et al., 2009. Nanotechnology and the Environment. Taylor & Francis/ CRC Press.
Sharma, A., Kumar, S., Kumar, R., Varshney, M. and Verma, K. D. 2009. Size dependent structural, optical and magnetic properties of un-doped SnO2 nanoparticles. Optoelectronics and Advanced Materials Rapid Communications, 3(12): 1285-9.
Sharma, R. K., Sharma, P. and Maitra, A. 2003. Size-dependent catalytic behavior of platinum nanoparticles on the hexacyanoferrate- (III)/thiosulfate redox reaction. J. Colloid Interface Sci., 265: 134-40.
Shetty, S., Palkar, V.R. and Pinto, R., 2002. Size effect study in magnetoelectric BiFeO3 system. Pramana – J. Phys., Vol. 58, Nos 5 & 6, May & June. Available at: http://www.ias.ac.in/pramana/mayjune2002/as46.pdf.
Shikov, A. N., Pozharitskaya, O. N., Miroshnyk, I., Mirza, S., Urakova, I. N., Hirsjärvi, S., Makarov, V. G., Heinämäki, J., Yliruusi, J. and Hiltunen, R. 2009. Nanodispersions of taxifolin: impact of solid-state properties on dissolution behavior. Int. J. Pharm., 377(1-2):148-52.
Sigfridsson, K., Lundqvist, A. J., Strimfors, M. 2009. Particle size reduction for improvement of oral absorption of the poorly soluble drug UG558 in rats during early development. Drug Development and Industrial Pharmacy, 35 (12): 1479-86.

http://team/clients/rivm/shared documents/a1 - what defines nanomaterials/report/rivm_a1_final report.doc 64
Request A1: What Defines Nanomaterials?
Singh, V. N. and Mehta, B. R. 2005. Nanoparticle size-dependent lowering of temperature for phase transition from In(OH)3 to In2O3. J. Nanosci. Nanotechnol., 5(3): 431-5.
Spanier, J. E., Robinson, R. D., Zhang, F., Chan, S.-W. and Herman, I. P. 2001. Size-dependent properties of CeO2 nanoparticles as studied by Raman scattering. Physical Review B, 64, 245407: 1-8.
Srivastava, C., Chithra, S., Malviya, K. D., Sinha, S. K. and Chattopadhyay, K. 2011. Size dependent microstructure for Ag–Ni nanoparticles. Acta. Materialia, 59(16): 6501–9.
Srinivasan, S. [Ed.] 2006. Fuel Cells: Fundamentals to Applications. Springer Science, pp. 691.
Strongin, D. R., Hosein, H. A., Debnath, S. and Liu, G. 2005. Size-reactivity relationship of iron and cobalt oxyhydroxide nanoparticles assembled within ferritin protein. Nanotechnology and the Environment. Abstract. 8:30 AM-11:10 AM, Monday, 14 March 2005 Hyatt Regency -- Del Mar B, Oral. Division of Industrial and Engineering Chemistry. The 229th ACS National Meeting, in San Diego, CA, March 13-17, 2005.
Sun, J., Pantoya, M. L. and Simon, S. L. 2006. Dependence of size and size distribution on reactivity of aluminium nanoparticles in reactions with oxygen and MoO3. Thermochimica Acta., 444(2): 117–27.
Suttiponparnit, K., Jiang, J., Sahu, M., Suvachittanont, S., Charinpanitkul, T. and Biswas, P. 2011. Role of Surface Area, Primary Particle Size, and Crystal Phase on Titanium Dioxide Nanoparticle Dispersion Properties. Nanoscale Res. Lett., 6(1): 27.
Switzerland Federal Office of Public Health (FOPH)/ Federal Office for the Environment (FOEN). 2011. Precautionary Matrix for Synthetic Nanomaterials, 14 July 2011, Version 2.1. Available at: http://www.bag.admin.ch/themen/chemikalien/00228/00510/05626/index.html?lang=en
Takano, R., Furumoto, K., Shiraki, K., Takata, N., Hayashi, Y., Aso, Y. and Yamashita, S. 2008. Rate-limiting steps of oral absorption for poorly water-soluble drugs in dogs; prediction from a miniscale dissolution test and a physiologically-based computer simulation. Pharmaceutical Research, 25 (10): 2334-44.
Tanaka, Y., Inkyo, M., Yumoto, R., Nagai, J., Takano, M. and Nagata, S. 2009. Nanoparticulation of poorly water soluble drugs using a wet-mill process and physicochemical properties of the nanopowders. Chemical and Pharmaceutical Bulletin, 57(10): 1050-7.

http://team/clients/rivm/shared documents/a1 - what defines nanomaterials/report/rivm_a1_final report.doc 65
Request A1: What Defines Nanomaterials?
Tsunekawa, S., Ishikawa, K., Li, Z. Q., Kawazoe, Y. and Kasuya, A. 2000. Origin of Anomalous Lattice Expansion in Oxide Nanoparticles. Physical Review. Lett., 85: 3440-3.
Tsunekawa, S., Ito, S. and Kawazoe, Y. 2004. Surface structures of cerium oxide nanocrystalline particles from the size dependence of the lattice parameters. Appl. Phys. Lett., 85(17): 3845-8.
Tsung, C.-K., Kuhn, J. N., Huang, W., Aliaga, C., Hung, H., Somorjai, G. A. and Yang, P. 2009. Sub-10 nm Platinum Nanocrystals with Size and Shape Control: Catalytic Study for Ethylene and Pyrrole Hydrogenation. J. Am. Chem. Soc., 131: 5816-22.
Uchino, K., Sadanaga, E. and Hirose, T. J. 1989. Dependence of the crystal structure on particle size in barium titanate. Am. Ceram. Soc., 72: 1555-8.
U.S. Environmental Protection Agency (U.S. EPA). 2007a. Nanoscale Materials Stewardship Program Data Form, available at http://www.regulations.gov/#!documentDetail;D=EPA-HQ-OPPT-2007-0572-0003.
U.S. Environmental Protection Agency (U.S. EPA). 2007b. Nanotechnology White Paper. EPA/100/B-07/001. Prepared for the U.S. Environmental Protection Agency, by members of the Nanotechnology Workgroup, a group of EPA’s Science Policy Council: 5, 22-27. Available at: http://www.epa.gov/osa/nanotech.htm.
U.S. Environmental Protection Agency (U.S. EPA). 2011. Release, fate and transport of engineered nanosilver from consumer products. Final Report. Prepared for: U.S. EPA Air Pollution Prevention and Control Division. Research Triangle Park, NC 27711.
U.S. Food and Drug Administration (FDA). 2010. Manual of policies and procedures - Reporting Format for Nanotechnology-Related Information in CMC Review. Center for Drug Evaluation and Research – Office of Pharmaceutical Science. MAPP 5015.9 Available at: http://www.fda.gov/downloads/AboutFDA/CentersOffices/CDER/ManualofPoliciesProcedures/UCM214304.pdf.
Valden, M., Lai, X. and Goodman, D. W. 1998. Onset of Catalytic Activity of Gold Clusters on Titania with the Appearance of Nonmetallic Properties. Science, 281(5383): 1647-50.
Vikesland, P. J., Heathcock, A. M., Rebodos, R. L. and Makus, K. E. 2007. Particle Size and Aggregation Effects on Magnetite Reactivity toward Carbon Tetrachloride. Environ. Sci. Technol., 41: 5277-83.

http://team/clients/rivm/shared documents/a1 - what defines nanomaterials/report/rivm_a1_final report.doc 66
Request A1: What Defines Nanomaterials?
Vogta, M., Kunath, K., and Dressman, J. B. 2007. Dissolution enhancement of fenofibrate by micronization, cogrinding and spray-drying: Comparison with commercial preparations. European Journal of Pharmaceutics and Biopharmaceutics, 68(2): 283-8.
Wang, C.-C., Zhang, Z. and Ying, J. Y. 1997. Phtocatalytic decomposition of halogenated organics over nanocrystalline titania. Nanostr. Mater., 9: 583-6.
Wang, C., van der Vliet, D., Chang, K.-C., You, H., Strmcnik, D., Schlueter, J. A., Markovic, N. M. and Stamenkovic, V. R. 2009. Monodisperse Pt3Co nanoparticles as a catalyst for the oxygen reduction reaction: size-dependent activity. J. Phys. Chem. Lett., 113: 19365-8.
Wang, C., Wang, G., van der Vliet, D., Chang, K-C., Markovic, N. M. and Stamenkovic, V. R. 2010. Monodisperse Pt3Co nanoparticles as electrocatalyst: the effects of particle size and pretreatment on electrocatalytic reduction of oxygen. Phys. Chem. Chem. Phys., 12: 6933-9.
Wang, N., Tachikawa, T. and Majima, T. 2011. Single-molecule, single-particle observation of size-dependent photocatalytic activity in Au/TiO2 nanocomposites. Chem. Sci., 2: 891-900.
Wei, T., Liu, H. M., Zhu, C., Guo, Y. J., Liu, J.-M., Wu, Y. J. and Chen, X. M. 2010. Size-dependent structural preferences and magnetization enhancement in 0.5Bi0.8La0.2FeO3-0.5PbTiO3. J. Appl. Phys., 108(12): 4108-13.
Williams, O. A., Hees, J., Dieker, C., Jager, W., Kirste, L. and Nebel, C. E. 2010. Size-Dependent Reactivity of Diamond Nanoparticles. ACS Nano, 4(8): 4824-30.
Wilson, O. M., Knecht, M. R., Garcia-Martinez, J. C. and Crooks, R. M. 2006. Effect of Pd Nanoparticle Size on the Catalytic Hydrogenation of Allyl Alcohol. J. Am. Chem. Soc., 128: 4510.
Wijnhoven, S. W. P., Dekkers, S., Kooi, M., Jongeneel, W. P. and de Jong, W.H., 2011. Nanomaterials in consumer products Update of products on the European market in 2010. RIVM Report 340370003/2010. National Institute for Public Health and the Environment. Available at: http://www.rivm.nl/bibliotheek/rapporten/340370003.pdf (accessed July 2012).
Wong, S. W. Y., Leung, P. T. Y., Djurišić, A. B. and Leung, K. M. Y. 2010. Toxicities of nano zinc oxide to five marine organisms: influences of aggregate size and ion solubility. Analytical and Bioanalytical Chemistry, 396(2): 609-18.

http://team/clients/rivm/shared documents/a1 - what defines nanomaterials/report/rivm_a1_final report.doc 67
Request A1: What Defines Nanomaterials?
World Technology Evaluation Center (WTEC). 2010. Nanotechnology Research Directions for Societal Needs in 2020. Retrospective and Outlook. September 30, 2010. Available at: http://wtec.org/nano2/Nanotechnology_Research_Directions_to_2020/Nano_Resarch_Directions_to_2020.pdf.
Xu, H. and Barnard, A. S. 2008. Nano-minerals: Size-dependent crystal structure, shape and chemical reactivity changes. Abstract. Geochimica et. Cosmochimica Acta., 72(12): A1045.
Yamamoto, T., Urabe, K. and Banno, H. 1993. BaTiO3 particle-size dependence of ferroelectricity in BaTiO3/polymer composites. Jpn. J. Phys., 32: 4272-6.
Yan, T., Shen, Z. G., Zhang, W. W. and Chen, J. F. 2006. Size dependence on the ferroelectric transition of nano-sized BaTiO3 particles. Mater. Chem. Phys., 98: 450-5.
Yano, H., Inukai, J., Uchida, H., Watanabe, M., Babu, P. K., Kobayashi, T., Chung, J. H., Oldfield, E. and Wieckowski, A. 2006. Particle-size effect of nanoscale platinum catalysts in oxygen reduction reaction: an electrochemical and 195Pt EC-NMR study. Phys. Chem. Chem. Phys., 8(42): 4932-9.
Ye, H., Crooks, J. A. and Crooks, R. M. 2007. Effect of Particle Size on the Kinetics of the Electrocatalytic Oxygen Reduction Reaction Catalyzed by Pt Dendrimer-Encapsulated Nanoparticles. Langmuir, 23: 11901.
Yogi, C., Kojima, K., Hashishin, T., Wada, N., Inada, Y., Gaspera, E. D., Bersani, M., Martucci, A., Liu, L. and Sham, T. K. 2011. Size Effect of Au Nanoparticles on TiO2 Crystalline Phase of Nanocomposite Thin Films and Their Photocatalytic Properties, J. Phys. Chem. C, 115: 6554-60.
Zachariah, M. R., Park, K. and Lee, D. 2004. Size-dependent reactivity of aluminium nanoparticles measured by single-particle mass-spectrometry. Nanoscience and Nanotechnology. Abstract. 8:30 AM-11:45 AM, Wednesday, March 31, 2004 Marriott -- Orange County 5, Oral. Division of Colloid and Surface Chemistry. The 227th ACS National Meeting, Anaheim, CA, March 28-April 1, 2004.
Zaki, M. I., Mekhemer, G. A. H., Fouad, N. E., Jagadale, T. C. and Ogale, S. B. 2010. Surface texture and specific adsorption sites of sol–gel synthesized anatase TiO2 nanoparticles. Mater. Res. Bull., 45: 1470-5.
Zanella, R., Giorgio, S., Shin, C. -H., Henry, C. R. and Louis, C. 2004. Characterization and reactivity in CO oxidation of gold nanoparticles supported on TiO2 prepared by deposition-precipitation with NaOH and urea. Journal of Catalysis, 222(2): 357-67.
http://team/clients/rivm/shared documents/a1 - what defines nanomaterials/report/rivm_a1_final report.doc 68
Request A1: What Defines Nanomaterials?
Zhang. Z., Wang, C.-C., Zakaria, R. and Ying, J. Y. 1998. Role of Particle Size in Nanocrystalline TiO2-Based Photocatalysts. J. Phys. Chem. B, 102: 10871-8.
Zhang, F., Chan, S.-W., Spanier, J. E., Apak, E., Jin, Q., Robinson, Herman, I. P. 2002. Cerium oxide nanoparticles: Size-selective formation and structure analysis. Appl. Phys. Lett., 80: 127-9.
Zhang, H. and Banfield, J. F. 2000. Understanding Polymorphic Phase Transformation Behavior during Growth of Nanocrystalline Aggregates: Insights from TiO2. J. Phys. Chem. B, 104: 3481-7.
Zhang, H. and Banfield, J. F. 2005. Size Dependence of the Kinetic Rate Constant for Phase Transformation in TiO2 Nanoparticles. Chem. Mater., 17(13): 3421-5.
Zhang, H., Chen, B. and Banfield, J. F. 2009. The size dependence of the surface free energy of titania nanocrystals. Phys. Chem. Chem. Phys., 11(14): 2553-8.
Zhang, Y. L., Jin, X. J., Rong, Y. H., Hsu, T. Y., Jiang, D. Y. and Shi, J. L. 2006. The size dependence of structural stability in nano-sized ZrO2 particles. Materials Science and Engineering: A, 438-440(25): 399-402.
Zhang, H., Chen, B. and Banfield, J. F. 2010. Particle Size and pH Effects on Nanoparticle Dissolution. J. Phys. Chem. C, 114(35): 14876-84.
Zhou, X., Xu, W., Liu, G., Panda, D. and Chen, P. 2010. Size-Dependent Catalytic Activity and Dynamics of Gold Nanoparticles at the Single-Molecule Level. J. Am. Chem. Soc., 132: 138-46.

Appendix A
Literature Search

A-1
Appendix A
Details of Database Searches
1 Developing the Database Searches
An index search string was developed to query the Dialog® databases, which consists of 58 individual databases. The index search consisted of three major concepts, each designed to search titles and subject headings. Duplicate references and patents were removed.
· Concept 1 - was designed to capture titles/subject headings that studied nanoparticles. This concept included the following search terms (“?” indicates that the search term will include all words containing additional characters following the “?” symbol):
– NANO or NANOPARTICLE? or NANOMATERIAL?
AND
· Concept 2 - was designed to capture titles that investigated the size of nanoparticles and a threshold
– (DIAMETER OR SIZE) AND (RELATED or DEPENDENT or DEPENDENCE or DRIVEN or REDUCTION or THRESHOLD or RELATIONSHIP)
AND
· Concept 3 – was designed to capture title/subject headings that investigated one of the priority physicochemical properties (“()” indicates that two adjacent terms are next to each other in that order [i.e., a space or a punctuation mark such as a hyphen can be found between the search terms])
– (WATER()SOLUBILITY) or DISSOLUTION or
– (CRYSTALLINE()STRUCTURE) or (CRYSTAL()STRUCTURE) or
– MORPHOLOGY or
– REACTIVITY or REDOX or (REACTIVE()OXYGEN()SPECIES) or
– (PHOTOCATALYTIC()ACTIVITY) or (PHOTO()ACTIVATION) or
– FLAMMABILITY or
– (AUTO()IGNITION) or (SELF()IGNITION) or
– EXPLOSIVENESS or EXPLOSIVITY or EXPLODE or COMBUSTION or
– OXIDIZING or OXIDISING or OXIDIZER or OXIDISER or OXIDANT or
– MAGNETISM or MAGNETIC or
– DISPERSABILITY or (DIS()AGGREGAT?) or DISAGGREGATION or
– APPEARANCE or COLOR or COLOUR or
– (MELTING()POINT) or (FREEZING()POINT) or
– (BOILING()POINT) or
– (PARTICLE()SIZE) or GRANULOMETRY or
– (PARTITION()COEFFICIENT) or KOW or (OCTANOL()WATER) or POW or
– (SOLUBILITY(2W)(ORGANIC()SOLVENTS)) or
– (FAT()SOLUBILITY) or
– (RELATIVE()SURFACE()AREA) or

A-2
– DUSTINESS
The first index search was performed on 9 February 2012. Twenty-nine of the databases contained at least one reference that matched the search criteria. Focused queries of these databases and elimination of duplicate references identified 611 potential references.
The applicability of each reference (i.e., studying size-dependent effects of a low/medium/high priority property) was determined by examining each reference’s title, and, in many cases, the abstract. Many publications were ruled out because they pertained to synthesis methods, characterization methods, or to the antimicrobial properties of nanoparticles such as nanosilver. Therefore, it was necessary to refine the literature search to exclude such references.
2 Refining the Database Search
In the second Dialog® search, performed on 27 February 2012, a fourth concept was added to the original literature search to remove references whose titles contained any of the following terms:
· Concept 4
– SYNTHESIS or SYNTHESES or CHARACTERIZATION or CHARACTERISATION or PREPARATION or COMPOSITIONS or FABRICATION or FORMATION or ANTIBACTERIAL or ANTIMICROBIAL
This search produced 724 references.
The second Dialog® search failed to identify any relevant papers investigating carbonaceous nanomaterials such as fullerenes, carbon nanotubes or carbon black. Therefore, on 19 June 2012 a supplemental Dialog® search was performed by modifying the search terms in the first concept and keeping concepts 1-3 identical to the second Dialog® search.
· Concept 1
– FULLERENE? or NANOTUBE? or CARBON()BLACK
This search produced 83 potentially-relevant references. Based on the titles and abstracts of the papers, 5 papers were obtained for possible inclusion into the database. Upon review, none were judged relevant and included.
3 List of Databases Queried in the Dialog® Search
The Dialog® searches inspected the following databases:
2: INSPEC_1898-2012/Jan W5
5: Biosis Previews(R)_1926-2012/Jan W5
6: NTIS_1964-2012/Jan W5
8: Ei Compendex(R)_1884-2012/Feb W1
10: AGRICOLA_70-2012/Jan
24: CSA Life Sciences Abstracts_1966-2012/Jan
28: Oceanic Abstracts_1966-2012/Jan
29: Meteorology & Geoastrophysical Abstracts_1966-2012/Jan
34: SciSearch(R) Cited Ref Sci_1990-2012/Jan W5

A-3
35: Dissertation Abs Online_1861-2012/Jan
40: Enviroline(R)_1975-2008/May
41: Pollution Abstracts_1966-2012/Jan
44: Aquatic Science & Fisheries Abstracts_1966-2012/Jan
49: PAIS Int._1976-2012/Jan
50: CAB Abstracts_1972-2012/Jan W4
51: Food Sci.&Tech.Abs_1969-2012/Jan W5
53: FOODLINE(R): Science_1972-2012/Feb 06
58: GeoArchive_1974-2012/Aug
60: ANTE: Abstracts in New Tech & Engineer_1966-2012/Jan
61: Civil Engineering Abstracts._1966-2012/Jan
64: Environmental Engineering Abstracts_1966-2012/Jan
65: Inside Conferences_1993-2012/Feb 06
72: EMBASE_1993-2012/Feb 06
73: EMBASE_1974-2012/Feb 06
74: Int.Pharm.Abs_1970-2012/Feb B1
76: Environmental Sciences_1966-2012/Jan
87: TULSA (Petroleum Abs)_1965-2012/Jan W4
89: GeoRef_1785-2012/Jan B1
96: FLUIDEX_1972-2012/Feb
98: General Sci Abs_1984-2011/Nov
99: Wilson Appl. Sci & Tech Abs_1983-2011/Nov
103: Energy SciTec_1974-2012/Jan B2
108: Aerospace and High Technology Database_1962-2012/Jan
110: WasteInfo_1974-2002/Jul
117: Water Resources Abstracts_1966-2012/Jan
118: ICONDA-Intl Construction_1976-2011/Sep
134: Earthquake Engineering Abstracts_1966-2012/Jan
144: Pascal_1973-2012/Jan W5
155: MEDLINE(R)_1950-2012/Feb 03
156: ToxFile_1965-2012/Jan W2
162: Global Health_1983-2012/Jan W4

A-4
172: EMBASE Alert_2012/Feb 06
181: Adverse Reaction Database_2008/Q3
203: AGRIS_1974-2012/Dec
266: FEDRIP_2012/Dec
292: GEOBASE(TM)_1980-2012/Jan W5
317: Chemical Safety NewsBase_1981-2012/Jan
332: Material Safety Data Sheets__2
336: RTECS_2012/Q1
354: Ei EnCompassLit(TM)_1965-2012/Jan W4
369: NEW SCIENTIST_1994-2010/JAN W5
370: Science_1996-1999/Jul W3
428: ADIS Newsletters(Curr)_2012/Feb 06
429: ADIS Newsletters(Arc)_1982-2012/Feb 06
434: SciSearch(R) Cited Ref Sci_1974-1989/Dec
444: New England Journal of Med._1985-2011/May W3
624: McGraw-Hill Publications_1985-2012/Feb 04
4 Screening Database Results
The papers were sorted into one of three categories:
• Relevant for this project – Based on title, the reference was obtained.
• Possibly relevant for this project – Based on title, it was unclear if the reference was relevant for the project and required discussion among the
ARCADIS project team. Abstracts were obtained for each reference to assist in this determination. Papers ultimately determined to be relevant were obtained while papers determined not to be relevant were moved to the third category.
• Not relevant for this project – Based on title, the reference was determined not to be in-scope for this project. No further action was taken for
these references.
References either initially or ultimately determined to be relevant for this project were entered into the literature database.
5 Project Literature Database
An Excel database was created to summarize the information from each paper deemed critical and to highlight any size-dependent relationships. Table 1 summarizes the number of papers entered into the database for each property.

A-5
Table 1 Summary of Papers Entered into Database Per Property
Property: Priority Total Number of Papers Identified
Number of Papers Determined to be Relevant
Boiling point Low 0 --
Dispersability Low 0 --
Dustiness Low 1 Low priority papers were not
reviewed
Melting / freezing point Low 12 Low priority papers were not
reviewed
Partition coefficient Low 1 Low priority papers were not
reviewed
Solubility in organic solvents Low 1 Low priority papers were not
reviewed
Auto-flammability: Medium 0 --
Explosiveness Medium 10 Medium priority papers were
not reviewed
Flammability Medium 0 --
Magnetism Medium 48 Medium priority papers were
not reviewed
Crystalline structure (structure) High 47 46
Photocatalytic activity High 13 13
Reactivity High 64 52
Surface morphology High 3 2
Water solubility High 9 9
TOTAL: 209 122

Appendix B
Copy of Database