What are the driving forces behind trends in inequality among pensioners? ( Lessons from a stylized...
15
What are the driving forces behind trends in inequality among pensioners? (Lessons from a stylized model) Paper presented at the Séminaire Scientifique 2010, Caisse des depots, Bordeaux, March 29 th , 2010 Gijs Dekkers Federal Planning Bureau & CESO, K.U.Leuven Federal Planning Bureau Economic analyses and forecasts
-
date post
21-Dec-2015 -
Category
Documents
-
view
217 -
download
0
Transcript of What are the driving forces behind trends in inequality among pensioners? ( Lessons from a stylized...
What are the driving forces behind trends in inequality among pensioners?
(Lessons from a stylized model)
Paper presented at the Séminaire Scientifique 2010, Caisse des depots, Bordeaux,
March 29th, 2010
Gijs DekkersFederal Planning Bureau &CESO, K.U.Leuven
FederalPlanning Bureau
Economic analyses and forecasts

What are the driving forces behind trends in inequality among pensioners?
Starting point: Future trends in inequality are usually simulated using large
microsimulation models. Yet simulation results are often explained using “common
sense” reasonings, using only a few parameters
Theses: 1. It should be possible to build a simple, stylized model that
simulates trends in inequality.2. The results of this stylized model could then be compared to
the simulation results of a dynamic microsimulation model.
FederalPlanning Bureau
Economic analyses and forecasts
Overview of this presentation
A base stylized model for the inequality of pensions
Simulate a change of the indexation parameter, and the impact of the retirement age
Apply two ‘forms’ of demographic ageing- A ‘baby boom’ generation- Increasing longevity
Comparison with results of the Belgian MIDAS model
FederalPlanning Bureau
Economic analyses and forecasts

The base model Suppose
1. 100 individuals in time t≥0, each of a different age (so, aget=[0,…, 100], t=[0, …, 100].
2. everybody retires at 60 and dies at 100, 3. the pension benefit at 60 equals € 100. 4. The model is expressed relative to wage growth, and pensions lag behind the
development of wages with a constant fraction Ψ.
Thenp0,age =100(1- Ψ)age-60 when t=0
Pt,age=
)60&60,)1(100
)60,)1(
0)60()(
0)(
0
0 ageageif
ageifpaget
t
(1)
100,60,60, ,...,,..., tagettt PPPFGini (3)
FederalPlanning Bureau
Economic analyses and forecasts

age 60.000 100.000
pension benefit p
60.500
100.000
year t
100.000
0.000
.01
.06
.11
.16
.21
.26
.31
.36
Gin
i
0 20 40 60 80 100simulation year
psi=5% psi=2.5% psi=1.25% psi=0.5%
base model (Ψ=1.25%)
FederalPlanning Bureau
Economic analyses and forecasts

Pt,age=
)(&))60((&)60(&)60(,)1(100
)(&))60((&)60&60,)1(
)1()1(100)(&))60((&)60(&)60(,)1(100
)(&)60(,)1()1(
)(&)60(,)1(
00)60()(
2
00)60(1
)(2
)(1
00)60()(
1
0)(
2)(
10
0)(
10
0
0
0
chttchtageageageif
chttchtageageageif
chttchtageageageifchttageifp
chttageifp
aget
age
chttcht
aget
chttcht
t
(
A change of the indexation parameter ψ in the period cht
FederalPlanning Bureau
Economic analyses and forecasts

age 60.000 100.000
pension benefit p
48.410
99.998
year t
100.000
0.000Ψ decreases from 1.8% to 1.25% in t=20
1.12
1.14
1.16
1.18
1.2
1.22
Ra
tio
.06
.08
.1.1
2.1
4G
ini
0 20 40 60 80 100simulation year
Gini, retirement age 55 Gini, retirement age 60
Gini, retirement age 65 Gini, retirement age 70ratio of Gini '55' and '60' ratio of Gini '60' and '65'ratio of Gini '65' and '70'
FederalPlanning Bureau
Economic analyses and forecasts

Demographic ageing I: a ‘baby boom generation’ Write the base model as
tF with 100,60,60, ...... tagettt PPP or
1.0.0
.....
0.1.0
.....
0.0.1
...... 100,60,60, tagettt PPP
A special case is
Wt
Wt FGini
And
100,
60,
60,
100,60,60,
.0.0
.....
0..0
.....
0.0.
......
t
aget
t
tagettWt
w
w
w
PPP
with w0,age0~N(43,23) and wt,age=w0,(age-t)
FederalPlanning Bureau
Economic analyses and forecasts

Demographic ageing I: a ‘baby boom generation’KDE of age at t≤50
.004
.006
.008
.01
.012
.014
De
nsity
0 20 40 60 80 100Age
t=0 t=10 t=20 t=30 t=40 t=50
Source: PSBH, MIDAS starting dataset in 2002, and own calculations.
.005
.01
.015
.02
kde
nsity
ag
e
0 20 40 60 80 100x
t=0 t=30 t=60 t=90
KDE of age at t≤90
FederalPlanning Bureau
Economic analyses and forecasts

.01
.06
.11
.16
.21
.26
.31
.36
Gin
i
0 20 40 60 80 100simulation year
psi=5% psi=2.5% psi=1.25% psi=0.5%
Demographic ageing I: a ‘baby boom generation’
FederalPlanning Bureau
Economic analyses and forecasts
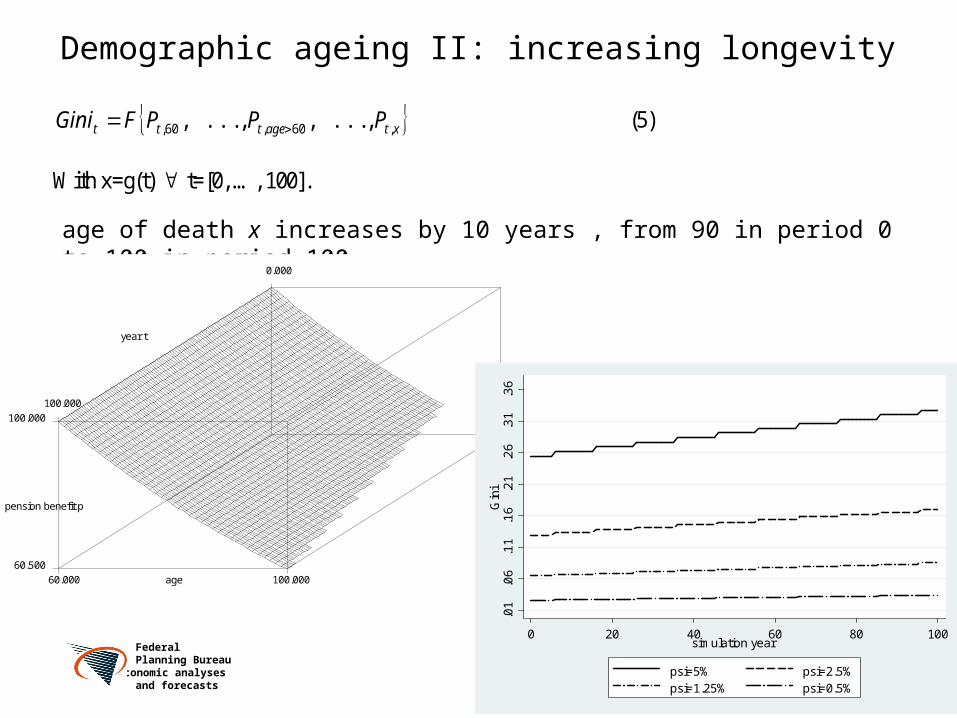
Demographic ageing II: increasing longevity xtagettt PPPFGini ,60,60, ,...,,..., (5)
With x=g(t) t=[0, …, 100].
age of death x increases by 10 years , from 90 in period 0 to 100 in period 100.
age 60.000 100.000
pension benefit p
60.500
100.000
year t
100.000
0.000
.01
.06
.11
.16
.21
.26
.31
.36
Gin
i
0 20 40 60 80 100simulation year
psi=5% psi=2.5% psi=1.25% psi=0.5%
FederalPlanning Bureau
Economic analyses and forecasts

Demographic ageing: impact of ageing on pension inequality: the compound effect of fertility shock and increasing life expectancy
.01
.06
.11
.16
.21
.26
.31
.36
Gin
i
0 20 40 60 80 100simulation year
psi=5% psi=2.5% psi=1.25% psi=0.5%
FederalPlanning Bureau
Economic analyses and forecasts
MIDAS Belgium
An acronym for ‘Microsimulation for the Development of Adequacy and Sustainability’ A dynamic microsimulation model with cross-sectional ageing Developed in the FP6 project AIM The aim is to simulate the consequences of the assumptions and projections of the
AWG on the adequacy of pensions.• MIDAS was simultaneously developed for Belgium, Germany and Italy, by teams
from the FPB, DIW and ISAE.• The starting dataset of MIDAS_BE is the PSBH cross-sectional dataset representing a
population of all ages in 2002 (8,488 individuals) MIDAS simulates• demographics: fertility, mortality, education• labour market: work, unemployment, disability, retirement, private & public
sector, ...• pension module, 1st pillar: employees’ pensions, civil servants’ pensions, self-
employed minimum pensions, CELS, IGO
FederalPlanning Bureau
Economic analyses and forecasts

Validation of the results of MIDAS_Belgium
.075
.08
.085
.09
.095
.1G
ini S
tyliz
ed m
ode
l
.2.2
2.2
4.2
6.2
8G
ini e
quiv
ale
nt p
ensi
on
inco
me
s M
IDA
S_
Bel
gium
1980 2000 2020 2040 2060 2080simulation year
Gini MIDAS_Belgium Gini Stylized model
FederalPlanning Bureau
Economic analyses and forecasts

Conclusions The more pensions lag with the development of wages, the higher
inequality of pensions at any point in time. The lower the retirement age, the higher the inequality of
pensions. The lower the retirement age, the slower inequality of pensions
reacts to changes of the indexation regime. The two underlying causes of demographic ageing each have a
different impact on the inequality of pensions.
FederalPlanning Bureau
Economic analyses and forecasts
These findings obviously are not surprising. However, they are generated by a very rudimentary model so there is no black box
Besides a difference in base levels and a sluggish reaction of inequality on a change in the indexation parameter , the results of the stylized model seems to resemble those of MIDAS_BE.