What are microarrays? Microarrays consist of thousands of oligonucleotides or cDNAs that have been...
17
What are microarrays? Microarrays consist of thousands of oligonucleotides or cDNAs that have been synthesized or spotted onto a solid substrate (nylon, glass, or plastic). Samples of cell DNA or cDNA are labeled with radioactivity or fluorescent probes and hybridized to the array. When the labeled sample DNA binds to its complementary strand on the array, the specific spot for that gene ‘lights up’ with color or radioactivity. Spots that bind a lot of DNA (or cDNA) appear bright, spots that bind less DNA are dim. The relative signal for each spot can be measured quantitatively using an array scanner and image analysis software. This allows one to simultaneously measure expression of thousands of genes .
-
date post
21-Dec-2015 -
Category
Documents
-
view
217 -
download
0
Transcript of What are microarrays? Microarrays consist of thousands of oligonucleotides or cDNAs that have been...

What are microarrays?
Microarrays consist of thousands of oligonucleotides or cDNAs that have been synthesized or spotted onto a solid substrate (nylon, glass, or plastic).
Samples of cell DNA or cDNA are labeled with radioactivity or fluorescent probes and hybridized to the array.
When the labeled sample DNA binds to its complementary strand on the array, the specific spot for that gene ‘lights up’ with color or radioactivity.
Spots that bind a lot of DNA (or cDNA) appear bright, spots that bind less DNA are dim.
The relative signal for each spot can be measured quantitatively using an array scanner and image analysis software. This allows one to simultaneously measure expression of thousands of genes.
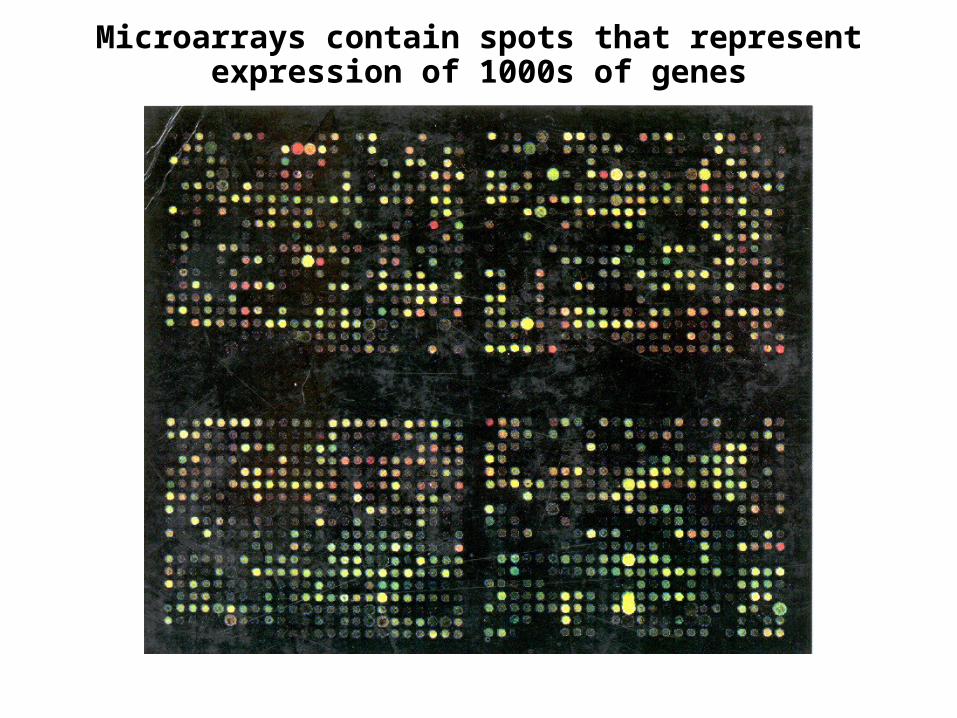
Microarrays contain spots that representexpression of 1000s of genes

How do microarrays measure gene expression?
1. The total RNA is isolated from 2 different biological samples (for example, RNA from normal cells and cancer cells).
2. The RNA is reversed transcribed to cDNA. Each population of cDNA is labeled with a different fluorescent dye (ie, red for cancer and green for normal). The 2 cDNA populations contain all expressed genes in the cells.
3. The cDNAs are denatured and hybridized to the microarray (similar to Southern hybridization) under stringent conditions. The colored cDNAs stick to the complementary sequences on the array.
4. If equal amounts of RNA (cDNA) are present in normal and cancer cells, the color of the spot is yellow (equal amounts of red and green make yellow).
5. If there is more red labeled cDNA (cancer) than green (normal), the spot is red.

6. If the gene is highly expressed, there is more cDNA and the spot is bright (either yellow, green, or red). If the gene is expressed poorly, the spot is dimmer. Genes that are expressed at a very low level can create problems for array analysis.
7. The intensity and the color of each spot is read and quantitatively analyzed using an array scanner and image analysis software.

Why measure gene expression on a global scale?
It is estimated that humans have about 30,000 genes. Microarrays have been constructed that could simultaneously measure all genes in a human cell. All spots could fit on several microscope slides.
1. Classification of human diseases: Most pathologists classify cancer or other illness by looking at cells in the microscope and describing how they appear. This is sometimes not very precise.
Microarrays have been used to compare normal and disease tissue for differences in gene expression. This method is very precise and discriminating. Some types of tumors that were thought to be similar by microscopic analysis were found to be very different when examined by microarray.
This led to a different strategy of treatment based on the genes that were overexpressed, and this was more effective therapy. For example, different types of human leukemia were found to appear similar in the microscope, but to be very different when one examined their pattern of gene expression.

2. Discovery of new drugs: When one can compare normal and diseased tissue, it is possible to find all of the genes that are expressed abnormally.
When all of these genes are grouped together, they often suggest major pathways that are perturbed in a specific disease.
For example, if many genes for apoptosis were upregulated in diseased tissue, the underlying problem may be that the cells are dying via too much apoptosis. If many genes for cell cycle progression are upregulated in disease, then an underlying cause of disease may be too much cell growth.
If major pathways are discovered, it is easier to develop a drug that can prevent or reverse the effects of disease. This leads to a more rational method of drug development.
3. Measuring drug toxicity: the traditional method is to treat animals (rabbits/mice) with drugs to see whether they become sick or die.This method is slow, expensive, and harms animals.
Cell death or degeneration can also be examined by using microarrays to analyze cultured cells. Many of the changes in gene expression that occur during toxicity testing in animals can be seen after similar treatment of cell cultures.
Microarrays can provide a rapid and inexpensive first screen for new drugs. Decreases the need for large scale studies with animals.

4. Discovery of gene function: now that the first draft of the human gene sequence is complete, the big question is “what do all of these genes do”? There is information about 6,000 but the other 25,000 or more are mainly unknown.
Microarrays can provide answers to this question.
1. One method is to introduce a gene into cultured cells using transfection and then ask how the gene alters cell function. Microarrays identify many other genes that are regulated by the original gene and these can suggest activation of major cell pathways (growth, differentiation, secretion, death, etc).
2. Use microarrays to study transgenic mice or gene knockout mice to identify the gene’s function in the whole animal.

5. Analysis of genomic DNA for single nucleotide polymorphisms (SNPs): small differences in the sequence of genes occur naturally between different individuals. Many of these SNPs have been carefully described and correlated with increased susceptibility to specific diseases.
Microarrays containing all known SNPs can be used to rapidly screen any individual for SNPs and susceptibility.
In the future, children may be screened for SNPs using array based methods. This would allow physicians to predict which diseases the person will suffer from and to suggest changes in lifestyle to minimize future risk.

1. High density oligonucleotide ‘chips’: these are constructed on glass or silicon wafers by a process similar to photolithography. The surface is altered to create artificial oligos that can hybridize with the sample.
Affymatrix has pioneered this technology.
The advantage of this method is that the oligos can be arrayed at a very high density (20 apart), thus they can fit on a small substrate. Whole genomes can be arrayed on several slides.
The disadvantage is that the technology is difficult to perform and the arrays are very expensive. Only large well funded labs can participate.
There are many types of arrays
2. Nylon membrane filters: nylon membranes are the oldest array technology. They are similar to Southern blots in that the DNA samples are immobilized on nylon membranes for hybridization.
The membranes may be spotted with cDNAs, oligonucleotides, or ESTs (expressed sequence tags are small bits of cDNA that have not been characterized for function).
The RNA from the cell is reverse transcribed and labeled with P32. The cDNA probe is hybridized to the membrane as a typical Southern blot and is used to determine the level of expression for each of the genes.
The advantage of this method is that it is cheap and easy. You need no special equipment to read or scan the arrays. The disadvantage is that not as many genes can be arrayed on a nylon filter.

3. Spotted oligonucleotide or cDNA arrays: robotic arraying machines can place microspots of DNA on a glass slide (about 100 nL or the size of 100 ) that are too small to see with the naked eye. This is the most popular method.
• It can be used to place tens of thousands of spots on 2-3 microscope slides (even all genes in humans).
• It is versatile. The technique can also be used to make smaller arrays of defined genes (death,growth, cancer genes).
• Not as expensive as ‘chips’
• You need a lot of cash to get started (the robot, all of the cDNAs or oligonucleotides, an array scanner = 100-200K).

1. Validation of results: One microarray experiment can yield tremendous amounts of data, however, due to the small size of spots, the data sometimes contains artifacts.
It is important to validate results from microarray experiments usingan additional method.
Northern blotting: is a good way to check for differences in gene expression. However, it is labor intensive and only a few genes can be screened at once.
RT-PCR: is also good but not as quantitative as Northern blotting. It is the method of choice when not much sample is available (clinical specimens).
Tissue arrays: Pathologists usually section a tissue in large pieces before examining the cells under the microscope. In tissue arrays, about 100-300 tiny tissue plugs are arrayed on 1 glass slide. This allows the pathologist to rapidly analyze multiple samples for both protein expression and morphology.
Problems with microarrays

2. What to do with all that data? Microarray experiments quickly generate more data than most scientists can cope with. Software makes life easier.
• Self organizing maps: software that looks at similarities and differences between samples from different arrays. It groups experiments or groups by a common characteristic.
For example, the self organizing map software was used to compare different types of tumors and discover that some were completely unrelated to others (this influences therapy).
• Cluster analysis: software that can select those genes out of the 1000s expressed that go up or down in unison.
If a cluster analysis showed that cyclins, kinases, and DNA polymerases were increased coordinately, it clearly indicates that a specific growth pathway was activated.

cluster I
cluster II
cluster III
cluster IV
cluster V
cell cycle genes and TGF-2-responsive genes-downregulated
cell-cycle genes and NF-k responsive genes-up regulated
genes induced in immortal lines
genes dependent on dsRNA
interferon-inducible genes-down regulated
1 2 3 4 5
Cluster Analysis and Self-Organizing Map SoftwareIn Analysis of HPV-16-Infected Keratinocytes

• Data mining: maybe it is not necessary for a small lab to actually perform arrays. Efforts are underway to develop a central storage area for all data. This would contain billions of pieces of information.
In the future you might be able to just mine existing data to answer your questions.


![Cloning Protein, Calmodulin, vulgare L.4 · CALMODULIN cDNAs FROM BARLEY PlaqueHybridization The cam oligonucleotides were end-labeled with [y-32P] ATPusing T4 polynucleotide kinase](https://static.fdocuments.net/doc/165x107/5f4559d0eb877a614d086f97/cloning-protein-calmodulin-vulgare-l4-calmodulin-cdnas-from-barley-plaquehybridization.jpg)