
What Americans Are Paying in Advisory Fees Americans Are Paying in Advisory Fees. ... RESULTS > Fee...
31
GO TO WWW.PERSONALCAPITAL.COM TO LEARN MORE ABOUT OUR FREE FINANCIAL TOOLS What Americans Are Paying in Advisory Fees
Transcript of What Americans Are Paying in Advisory Fees Americans Are Paying in Advisory Fees. ... RESULTS > Fee...

GO TO WWW.PERSONALCAPITAL.COM TO LEARN MORE ABOUT OUR FREE FINANCIAL TOOLS
What Americans Are Paying in Advisory Fees

p2PERSONAL CAPITAL ADVISOR FEE REPORT
TABLE OF CONTENTS
03
04
08
INTRODUCTION
METHODOLOGY
RESULTS
> Fee Calculation
> Investment Advisor Selection
> Additional Fees
> Estimated Fees by Institution
> Dual Registration = Double Standard
12
15
21
25
THE EFFECT OF FEES ON RETURNS
WHAT FEES DON’T MEASURE
EVALUATING YOUR OPTIONS
APPENDIX
PERSONAL CAPITAL ADVISOR FEE REPORT p3
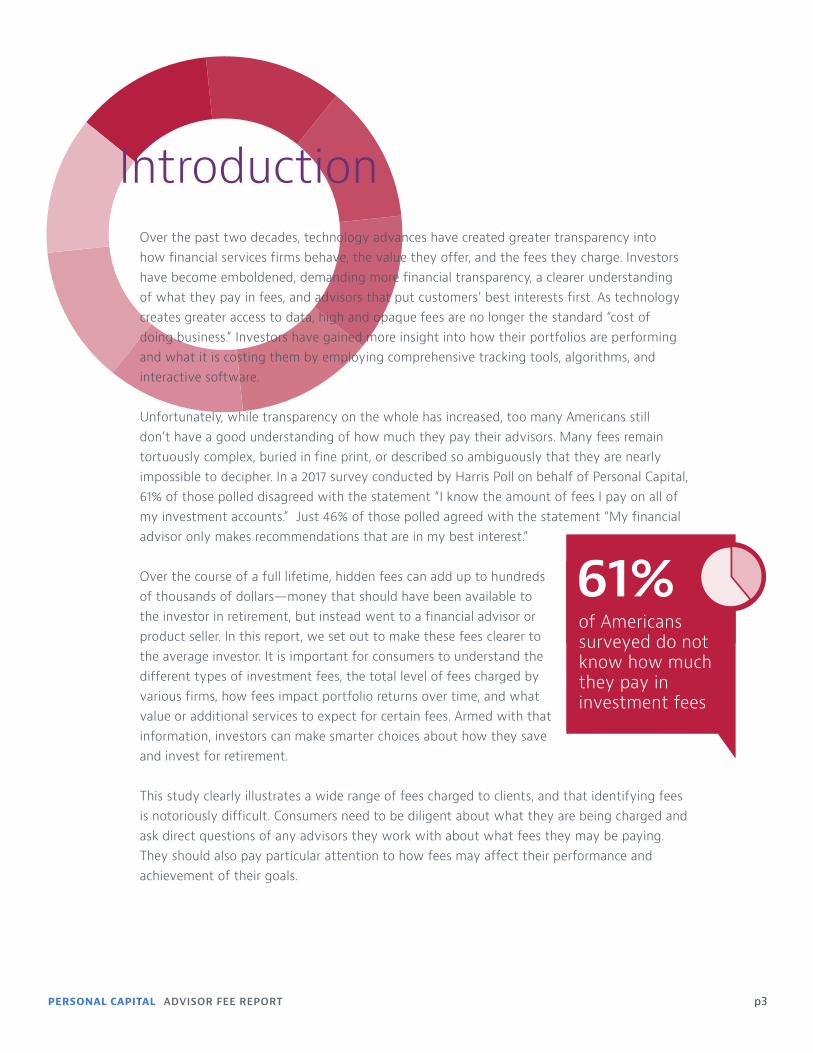
of Americans surveyed do not know how much they pay in investment fees
61%
Over the past two decades, technology advances have created greater transparency into how financial services firms behave, the value they offer, and the fees they charge. Investors have become emboldened, demanding more financial transparency, a clearer understanding of what they pay in fees, and advisors that put customers’ best interests first. As technology creates greater access to data, high and opaque fees are no longer the standard “cost of doing business.” Investors have gained more insight into how their portfolios are performing and what it is costing them by employing comprehensive tracking tools, algorithms, and interactive software.
Unfortunately, while transparency on the whole has increased, too many Americans still don’t have a good understanding of how much they pay their advisors. Many fees remain tortuously complex, buried in fine print, or described so ambiguously that they are nearly impossible to decipher. In a 2017 survey conducted by Harris Poll on behalf of Personal Capital, 61% of those polled disagreed with the statement “I know the amount of fees I pay on all of my investment accounts.” Just 46% of those polled agreed with the statement “My financial advisor only makes recommendations that are in my best interest.”
Over the course of a full lifetime, hidden fees can add up to hundreds of thousands of dollars—money that should have been available to the investor in retirement, but instead went to a financial advisor or product seller. In this report, we set out to make these fees clearer to the average investor. It is important for consumers to understand the different types of investment fees, the total level of fees charged by various firms, how fees impact portfolio returns over time, and what value or additional services to expect for certain fees. Armed with that information, investors can make smarter choices about how they save and invest for retirement.
This study clearly illustrates a wide range of fees charged to clients, and that identifying fees is notoriously difficult. Consumers need to be diligent about what they are being charged and ask direct questions of any advisors they work with about what fees they may be paying. They should also pay particular attention to how fees may affect their performance and achievement of their goals.
Introduction

p4PERSONAL CAPITAL ADVISOR FEE REPORT
CHAPTER 1
METHODOLOGY

PERSONAL CAPITAL ADVISOR FEE REPORT p5
The investable asset range is between $100,000 and $1,000,000
The investor seeks a managed account with guidance from a human advisor—purely algorithmic “robo-advisor” options were excluded
The portfolio consists of individual stocks, bonds, mutual funds, or ETFs
The effects of tax consequences are excluded
The costs tied to electronic funds transfer and wire fees, IRA and retirement plan fees, margin interest, ADR fees, account opening or closing fees, or other account-level transactional fees, which can be significant with firms that don’t have a single all-in fee, are also excluded
In order to create viable comparisons between different firms and compute the impact of fees, we assumed a hypothetical investor applying the following criteria:
METHODOLOGY
FEE CALCULATION

p6PERSONAL CAPITAL ADVISOR FEE REPORT
ADVISORY FEES
“FUND-RELATED FEES” OR “EXPENSE RATIOS”
Advisory fees (also sometimes called management fees) are an advisor’s compensation for advice. They are typically structured as a percentage of assets under management (AUM), usually tiered by account balance. These fees are disclosed in a firm’s “Uniform Application for Investment Adviser Registration and Report by Exempt Reporting Advisers,” also known as a Form ADV, which is filed with the SEC and available online or by request. These fees can vary widely depending on the amount of assets under management and the type of strategy the investor is seeking. Because of this, we provided a range of fees for each firm using their public ADV filings in a manner consistent with the type of investor described above. Actually detecting these fees in statements and published account data is notoriously difficult.
Fund fees (also called expense ratios) often go unnoticed by the average investor and are charged in addition to advisory fees. They are charged directly by the underlying investment funds and are used to pay the managers of those funds for management, record-keeping, trading, and pricing of securities. For this analysis we assumed the only types of funds used are mutual funds or exchange-traded funds (ETFs). Fees for these vehicles legally must be disclosed by the fund providers, although advisors who put investors into them often do not draw attention to these additional fees other than through dense legal disclosures.
To calculate fund fees, we aggregated data from a sample of more than 6,000 Personal Capital users who are in an advisory relationship and have used our free tools to link their accounts. For each financial institution in our analysis, we examined the account history of real users to pinpoint the exact dollar amount of mutual fund or ETF fees they paid as part of an advisory relationship during Q1 of 2017. Dividing the total fund fees paid by the total account values, we determined a weighted average fund fee across all advisory accounts held at each firm.
METHODOLOGY

PERSONAL CAPITAL ADVISOR FEE REPORT p7
METHODOLOGY
Our methodology takes into account only two narrow definitions of fees. In the real world, there are many other fees that can add to an investor’s total cost, as well. For example, brokerages sometimes charge additional commissions to trade in and out of individual stocks or bonds. They also frequently sell products like insurance and annuities, which can add another 1%-2% in fees per year. Even worse, they often come with stiff surrender clauses, meaning an investor could lose up to 10% of an investment when pulling out money for an emergency or other spending need. None of these charges are reflected in our analysis, but should be considered before evaluating any firm or the actual performance of the investments.
To select the investment advisory firms for this study, we used the following criteria:
> The firm must have a major national presence
> The firm must have a statistically viable number of users in our database
> The firm must have fee data we can identify and interpret
Given these criteria, the scope of this study includes a representative sample of firms for which Personal Capital has a significant sample of users. There are numerous small regional firms, for example, that were excluded due to the first condition, and a handful of nationally prominent firms that were excluded due to the second or third condition. Nevertheless, we believe the list we’ve compiled is representative of the general range of costs and is therefore useful investor education.
Moreover, the difficulty in constructing an accurate and comprehensive list of available options in the universe of financial institutions speaks to a broader point—fees are very hard to detect and compare—and the odds are stacked against the average investor when it comes to comparing fees across different organizations. Fee schedules are frequently complicated, thick with legalese, and too often come with hidden charges that are separate from the main schedule (not unlike the airline industry). In other words, considering the difficulty we as financial services experts had finding this information, even with all the technology, data science, and data we have for over 1.5 million users of our tools, the average investor faces a comparatively daunting challenge.
ADDITIONAL FEES
INVESTMENT ADVISOR SELECTION

p8PERSONAL CAPITAL ADVISOR FEE REPORT
CHAPTER 2
RESULTS

PERSONAL CAPITAL ADVISOR FEE REPORT p9
The below table shows estimated fee ranges at each institution, using publicly available advisory fee schedules and actual fund fee data from Personal Capital dashboard users. These estimates are not meant to represent the average fees across all advisory clients at each firm. Rather, they reflect what an investor could potentially pay if charged full advisory fees through the listed programs, combined with fund fees in line with what we have observed across a broad sample of accounts in our own data. As always, investors should consult their individual advisors for their specific fee.
FIRM PROGRAM BROKER-DEALER? ADVISORY FEE* AVERAGE
FUND FEE**TOTAL
ESTIMATED FEE
Morgan Stanley
UBS
Ameriprise
Personal Capital
JP Morgan
Merrill Lynch
Wells Fargo
Charles Schwab
Vanguard
Select UMA Program
Portfolio Management Program
Managed Accounts & Financial Planning Service
Investment Services/Wealth Management
Mutual Fund Advisory Portfolio
Personal Investment Advisory
Private Investment Management
Schwab Intelligent Advisory
Personal Advisor Services
Edward JonesUnified Managed Account Model
0.42%
0.44%
0.50%
0.08%
0.41%
0.33%
0.43%
0.16%†
0.08%
2.00% — 2.50%
2.50%
1.75% — 3.00%
0.79% — 0.89%
1.15% — 1.45%
1.00% — 2.00%
1.50% — 2.00%
0.28%
0.30%
1.25% — 1.35% 0.45%
2.42% — 2.92%
2.94%
2.25% — 3.50%
0.87% — 0.97%
1.56% — 1.86%
1.33% — 2.33%
1.93% — 2.43%
0.44%
0.38%
1.70% — 1.80%
YES
YES
YES
YES
YES
YES
YES
YES
NO
YES
*Taken from the firm’s Form ADV filings (see appendix)
**Calculated by Personal Capital based on user account data from Q1 2017
† From Charles Schwab for moderate risk portfolio: https://intelligent.schwab.com/public/intelligent/faq-intelligent-portfolios/pay-no-advisory-fees.html
ESTIMATED FEES BY INSTITUTION

p10PERSONAL CAPITAL ADVISOR FEE REPORT
According to our analysis, the hypothetical investor described in the methodology section faces a wide range of possible fees as a client of one of the 10 programs in our sample. The highest estimated possible fee was through the Ameriprise Managed Accounts & Financial Planning program, where advisory plus fund management fees can easily exceed 3% per year. The lowest was through Vanguard Personal Advisor Services, where total fees were only about 0.38%.
As previously stated, individual advisors at the above firms often have leeway to lower their advisory fees based on negotiation with the client. Accordingly, there are advisors at each of these institutions who charge significantly less than our range estimate. That decision varies by advisor, with some choosing to compete more aggressively on fees, and others opting for a higher service, higher cost model. Nevertheless, these public schedules exist to set an explicit maximum on what advisors can charge, and there are advisors at these institutions who fully exploit the upper limit.
RESULTS
The key takeaway for investors is that fees vary greatly not only across different firms, but even within the same organization—and ignoring these differences can be extremely costly.

PERSONAL CAPITAL ADVISOR FEE REPORT p11
RESULTS
It’s important to note that of the 10 investment advisors in our study, all but Personal Capital also operate as broker-dealers.
Broker-dealers are transaction-oriented and make money by charging commissions for selling securities or products such as mutual funds. Because their traditional role has been the sale of securities, and not objective advice, broker-dealers are not held to the fiduciary standard. That means they are not legally required to act in their clients’ best interests.
Often, broker-dealers also manage the products they sell, which means they make money both through the sale of these funds and their ongoing management. Other forms of revenue include:
> Commissions through expensive one-time share class loads
> Perpetual fees on sales and marketing 12(b)1 fees
> Lending against surplus cash in client portfolios
> Skimming money on trades and rebalancing portfolios known as “order flow”
> Monetization schemes on other product sales based on a firm profit orientation vs. an obligation to do what’s best for the client
Conversely, registered investment advisors (RIAs) are legally bound by the fiduciary standard, which requires them to act in their clients’ best interest. RIAs typically charge a flat fee and do not earn additional income through transactions. Their sole business is advice, with financial incentives that don’t fluctuate based on the path chosen. In this sense, an RIA is objective since it earns the same fee regardless of what the client invests in.
As RIAs have grown in prominence, the broker-dealer world has adapted to the competitive pressure. Their solution has been “dual-registration,” which means they can continue to earn commissions and other transactional charges as broker-dealers, but they also offer theoretically objective advice as investment advisors. They are allowed to freely vacillate between the two standards as long as they inform the client which capacity they are acting under. As advisors, they register with the SEC and are legally expected to act in their clients’ best interests. As broker-dealers, they often stand to make more money by recommending their own funds, leading to financial incentives that can be at odds with what is best for the client.
Investors should understand the important differences between broker-dealers and RIAs when evaluating the advice they receive.
DUAL REGISTRATION = DOUBLE STANDARD

p12PERSONAL CAPITAL ADVISOR FEE REPORT
THE EFFECT OF FEES ON RETURNSIn a March 2017 poll conducted for Personal Capital by Harris Poll, 32% of respondents agreed that higher fees for investment accounts generally result in higher returns—an improper perception the data do not support. Most academic studies have shown professional investors as a group have no ability to outperform broad market indices over long time horizons. Even a small percentage difference in extra fees per year can seriously erode an account’s growth potential. If an investor’s primary objective is total portfolio return, then keeping costs low is a crucial component (though not the only component, as discussed on the pages that follow).
CHAPTER 3

PERSONAL CAPITAL ADVISOR FEE REPORT p13
The investor begins contributing $18,000 to a 401k at age 21; these contributions increase by 2% every year thereafter
At age 50, the investor increases annual contributions by the “catch-up” amount offered under current IRS guidelines (also adjusted for inflation)
The investor stops making contributions at age 65
Annual returns are 6%
Fees, as a percent of assets, remain level throughout
1.00%
1.50%
2.00%
2.50%
3.00%
3.50%
Cumulative Fees AGE 21-65
$830,931
$758,973
$675,687
$578,971
$466,320
$334,754
The following table illustrates the hypothetical dollar amount of fees paid by an investor from starting a job until retirement. For this projection we assumed the following, which may not be representative of your specific situation.
THE EFFECT OF FEES ON RETURNS

p14PERSONAL CAPITAL ADVISOR FEE REPORT
Account Growth AGE 21-65
Annual Fee
$500,000
$1,000,000
$1,500,000
$2,000,000
$2,500,000
$3,000,000
$1,878,758
1.0%FEE
3.0%FEE
Using all of the above assumptions, the total amount an investor loses at a 3% fee vs. a 1% fee – including both fees and forgone returns—is more than $740,000.
$2,620,504
While the difference between a 1.0% annual fee and a 3.0% annual fee may sound trivial, the impact over time can be staggering. For example, the total additional amount lost to fees in this example is more than $400,000—higher than the median price of a home in the U.S. Even a one percent difference (i.e., 2.0% vs. 1.0%) costs the investor an extra $240,000 in fees over the full time horizon.
Even worse, that doesn’t fully capture the amount the investor loses in total return. Because fees are taken out along the way, that money doesn’t have time to grow and compound.
THE EFFECT OF FEES ON RETURNS

PERSONAL CAPITAL ADVISOR FEE REPORT p15
WHAT FEES DON’T MEASURESo if high fees are bad, does that mean investors should always seek out the lowest cost option? Not necessarily.
Consider Vanguard and Charles Schwab, the two lowest cost providers in our study. Both have been tremendously successful in attracting assets, but their approaches are not without limitations.
CHAPTER 4

p16PERSONAL CAPITAL ADVISOR FEE REPORT
Vanguard is the world’s largest mutual fund provider. With more than $4.4 trillion under management, and over 20 million investors, their core competencies are scale, mass production, and low fees.
Through sales of its mutual funds and ETFs, Vanguard earns fees as a broker-dealer. The bulk of the firm’s revenue comes from its mutual funds, with a much smaller percentage coming from advice. Their Personal Advisory Service offering currently comprises about 2% of their overall AUM.
When Vanguard does provide investment recommendations as an RIA, it is primarily focused on purchases of its own mutual funds and ETFs.
The heavy emphasis on mutual funds limits opportunities for tax optimization, and can create potential phantom gains that would not be incurred with ETFs or individual stocks.
Vanguard advisors typically do not provide explicit advice or investment recommendations on assets held at other firms.
Charles Schwab is one of the world’s largest brokerage firms, as well as one of the largest banks. The firm’s primary sources of revenue are net interest, trading fees, administration fees, and fees from managing mutual funds and ETFs.
As with Vanguard, the advice business is secondary to Schwab’s core business. Intelligent Advisory and Intelligent Portfolios strategies are largely built from the firm’s own ETF products.
The firm’s “free” robo-advisor, Intelligent Portfolios, is purely algorithmic and has no access to human advice outside of basic support questions. Recommended cash allocations can be as high as 30%, which Schwab Bank can use to invest and generate a positive return for itself. The cost for the Intelligent Portfolios investor, while not expressed as an explicit fee, is the forgone return from the high cash balance.
Schwab Intelligent Advisory typically does not provide explicit advice or investment recommendations on assets held at other firms.
VANGUARD CHARLES SCHWAB

PERSONAL CAPITAL ADVISOR FEE REPORT p17
For some investors, especially those with smaller portfolios or uncomplicated financial lives, those tradeoffs may be perfectly fine. For larger investors or those with more complex financial needs, these drawbacks may be woefully inadequate.
The distinction represents a crucial point: There is no one-size-fits-all solution, and it is critical to evaluate the entire picture—including all of the services available through various options—when selecting an investment approach. Investors have different needs, levels of experience, and financial circumstances. Depending on these variables, some features may have value, and some may not, but an investor should always understand what they are getting in exchange for their fee.
The following additional services are also worth considering when evaluating options.
WHAT FEES DON’T MEASURE
A fiduciary wealth manager often provides financial planning services such as retirement and estate planning, charitable giving, budgeting, or education savings plans. These are valuable services, (for which professionals can charge thousands of dollars when offered as stand-alone services), that are unaddressed by simply owning low-cost mutual funds or ETFs. Moreover, mistakes in these areas can cost significantly more than the advisory fees.
One of the biggest drawbacks of mutual funds is a concept known as “phantom gains.” A mutual fund buys and sells many individual securities throughout the year. Unfortunately, the mutual fund company is not responsible for paying the tax bill on these gains—the owners of the fund are. These gains are passed through to the holders, who are then liable for the tax, even if they personally did not make any sales of the fund. A good advisor can help an investor build a portfolio with individual securities, thereby avoiding this phantom gain scenario. Even better, individual securities can be used to employ “tax-loss harvesting” and “asset location,” two tax optimization strategies that can increase after-tax returns by as much as 1% per year, amounting to thousands or even hundreds of thousands of dollars in savings over the course of a lifetime.
FINANCIAL PLANNING
TAXATION

p18PERSONAL CAPITAL ADVISOR FEE REPORT
WHAT FEES DON’T MEASURE
Rebalancing is critical to a sound, long-term investment strategy. Investors with low-cost funds must take the time to regularly rebalance their own portfolios. This can be especially difficult with mutual funds, which usually own hundreds of positions and have overlapping exposure with other funds. By owning multiple funds, especially with a single institution, investors often don’t have a good understanding of their true exposure to various sectors or styles. This tends to create inadvertent concentrations in the largest, and frequently most overvalued, sectors of the market—exposing the investor to undue risk if not properly addressed. Regular rebalancing takes time, diligence, and know-how, all of which have a financial value.
Human beings are emotional, and we can all make bad decisions. Unfortunately, self-managers tend to make bad decisions frequently. According to a 2016 study by DALBAR Inc., at year-end 2015 the 20-year annualized return for the S&P 500 was 8.19%, while the 20-year annualized return for the average equity mutual fund investor was only 4.67%—a loss of almost half the total return. The primary reason for this underperformance was poor timing decisions. Holders of the funds bought when prices were high, and sold when they were low. While no one is perfect, a good advisor can frequently keep an investor from making these types of emotional mistakes, often at a cost far lower than what the investor would lose through chronic underperformance.
REBALANCING
COUNSELING

PERSONAL CAPITAL ADVISOR FEE REPORT p19
WHAT FEES DON’T MEASURE
That is a personal decision depending on your specific situation and what is important to you, but one methodology is to take your all-in fee and allocate it across all of the financial benefits you accrue. As a hypothetical illustration, consider an example where an investor is choosing between two options:
> A low-cost mutual fund and ETF strategy combined with a robo-advisor tool, and
> A digital wealth manager that provides holistic financial advice and tax planning, including advice for all of the investor’s assets, even those held at other institutions. The first option has lower fees, but which option provides the best value?
WHAT ARE THESE FEATURES WORTH, & HOW DO YOU QUANTIFY THEM?
Management Fee
Value of Advice forNon-managed Assets *
0.89%
Expenses (low-cost mutual fund fee) 0.08%
+0.45%
OPTION 2Digital Wealth Manager
Tax Optimization ** +1.0%
Value after 30 years.
$2,630,881
Management Fee
Value of Advice forNon-managed Assets
Expenses (low-cost mutual fund fee)
OPTION 1Low-Cost Mutual Fund with a Robo Advisor
Tax Optimization
$800,000
6.00%
$400,000
Total Portfolio
Amount Placed With Advisor
Rate of Return (gross)
$800,000
6.00%
$400,000
0.30%
0.08%
0.00%
0.00%
Value after 30 years.
$2,062,472
Total Portfolio
Amount Placed With Advisor
Rate of Return (gross)
* Represents the value of advice that extends to non-managed assets.
** Represents the annual amount saved through tax-loss harvesting, tax location, capital gains management,
and avoiding mutual fund phantom gains.

p20PERSONAL CAPITAL ADVISOR FEE REPORT
WHAT FEES DON’T MEASURE
In this example, the digital wealth manager delivers a much greater
total value over the full time horizon, even at a higher fee.
While the digital wealth manager in this example has a higher fee, the financial advice extends to the total portfolio, not just the managed assets. In other words, because the investor is paying fees on a $400,000 account, but is receiving advice on $800,000 worth of assets, this is roughly equivalent to an extra 0.45% in yearly value. Likewise, because the digital wealth manager also provides tax-loss harvesting, tax location, capital gains management, and avoids mutual fund phantom gains, the investor in this example is able to save enough in taxes in each year to equate to another 1% return in his portfolio.
Adding in the value of these services, the digital wealth manager delivers a much greater total value over the full time horizon, even at a higher fee. This is before even considering the thousands of dollars in value for advice related to retirement, charitable giving, estate planning, legacy planning, college savings, and insurance. It also excludes the value of automated portfolio rebalancing, portfolio diversification, and the ensuing benefits to risk management and overall performance.

PERSONAL CAPITAL ADVISOR FEE REPORT p21
CHAPTER 5
EVALUATING YOUR OPTIONSIf you’re concerned about how much you’re paying in fees, or whether your portfolio is well-attuned to your goals, there are a number of free, easy-to-use resources available to help. With Personal Capital’s free app and dashboard, you can use tools like our Fee Analyzer to discover the impact of hidden fees on your retirement savings. Our Investment Checkup tool allows you to compare your current portfolio allocation to the ideal target allocation designed to minimize risk and maximize returns to meet your financial goals.
If you’re currently evaluating managers, or rethinking your current relationship, here are some important questions to ask to ensure you are receiving financial advice in your best interest.

p22PERSONAL CAPITAL ADVISOR FEE REPORT
A fiduciary has a legal obligation to act in your best interest. This includes disclosing fees and any potential conflicts of interest. Brokers do not always have this legal obligation, but registered investment advisors (RIAs) do. RIAs can provide you with comprehensive advice addressing your entire financial picture. Unlike financial institutions that promote their own products and funds, they legally must always do what is in your best interest. Avoid an advisor who earns higher fees by pushing certain products.
Some non-fiduciary firms have fee-sharing arrangements with mutual fund or insurance companies. That might mean your financial advisor is heavily motivated to sell a certain company’s investment products over another’s. A good technique is to ask your financial advisor if he or she is willing to invest in the same products that they recommend to you, or if they receive an incentive for recommending that product. Alternatively, you can also ask why they picked a product recommended over another similar offering. Do they have a fee-sharing arrangement with another company?
If the answer is vague or takes more than a minute to answer, walk away. You should also know what your all-in costs are. Make sure you understand how much you are paying per transaction, per product, or per service. Ask how much your financial advisor makes when he sells mutual funds, annuities, and individual stock or bond trades. Be sure to ask if those costs to you are in addition to the annual, or ongoing management fee he or she makes from working with you. Also, know what services you are entitled to. Tax optimization? Rebalancing? Retirement planning? Estate planning? College planning? How much is your time worth to perform these on your own? Alternatively, how much would it cost you to hire multiple advisors to perform these stand-alone services versus getting all of them from one advisor?
Are you a fiduciary?
Why did you recommend that investment?
How are you compensated?
EVALUATING YOUR OPTIONS

PERSONAL CAPITAL ADVISOR FEE REPORT p23
Ask your advisor what kind of on-going service you can expect. How often can you contact them and what can you expect in response times? Do they have online tools that allow you to review your account data in real time and perform what-if analyses? Another important consideration is performance reporting. What materials do they provide so you can track how your investments are doing? Equally important, how do they keep your financial plan up to date? Do they have online tools that are dynamically updated by daily changes in market conditions and life events? If not they can become out of date they day after they are printed.
What service can I expect from you?
EVALUATING YOUR OPTIONS
Does your advisor understand your specific needs and goals? Did you work together to build your long-term investment strategy? Ask your financial advisor what his or her investment strategy is, and most importantly, how it is customized for your specific needs, risk tolerance, age, and other financial priorities. This is where you should be looking for strategy on tax plans, mutual funds, and ETFs. Investment strategies change over time as risk tolerance and life stages change, so make sure your investment strategy is dynamic and you have an ongoing dialogue with your financial advisor.
What is your investment strategy, and how will it achieve my goals?

p24PERSONAL CAPITAL ADVISOR FEE REPORT
The smart way to track & manage your financial life.
Personal Capital is a flat-percentage fee-only digital wealth manager. We offer award-winning online financial tools that provide unprecedented transparency into your finances, allowing you to see all of your accounts in one place. Our clients also receive personal attention from registered financial advisors. The result is a complete transformation in the way you understand, manage and grow your net worth. Personal Capital’s state-of-the-art personal finance software enables real-time financial visibility and management for 1.5 million registered users. The firm manages more than $5 billion in assets on behalf of its clients and tracks $400 billion in assets for registered users.
PERSONAL CAPITAL ADVISOR FEE REPORT p25
The smart way to track & manage your financial life.
APPENDIX

p26PERSONAL CAPITAL ADVISOR FEE REPORT
APPENDIX
GET THEIR ADV
AmeripriseFinancial
GET THEIR ADV
UBS

PERSONAL CAPITAL ADVISOR FEE REPORT p27
APPENDIX
GET THEIR ADV
WellsFargo
GET THEIR ADV
MorganStanley
p28PERSONAL CAPITAL ADVISOR FEE REPORT
APPENDIX
GET THEIR ADV
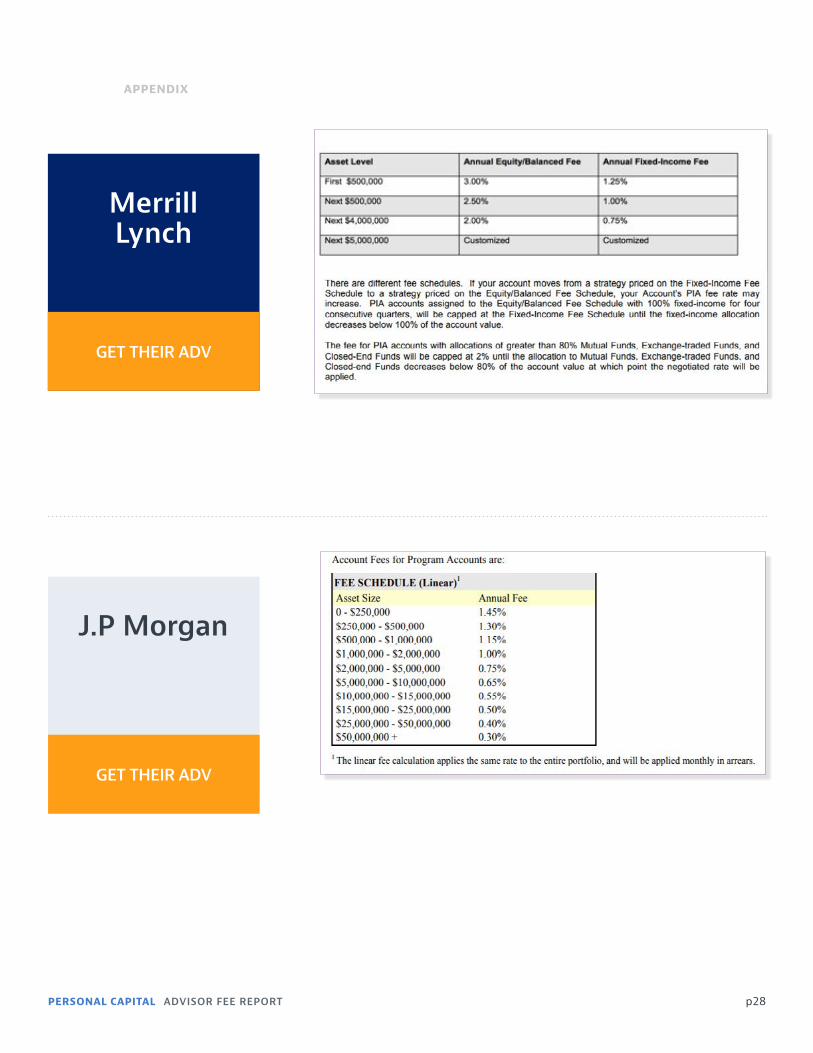
MerrillLynch
GET THEIR ADV
J.P Morgan

PERSONAL CAPITAL ADVISOR FEE REPORT p29
APPENDIX
PersonalCapital
GET OUR ADV
GET THEIR ADV
EdwardJones

p30PERSONAL CAPITAL ADVISOR FEE REPORT
APPENDIX
Vanguard
GET THEIR ADV
CharlesSchwab
GET THEIR ADV

PERSONAL CAPITAL ADVISOR FEE REPORT p31
GO TO WWW.PERSONALCAPITAL.COM TO LEARN MORE ABOUT OUR FREE FINANCIAL TOOLS
ONE CIRCLE STAR WAY, FIRST FLOORSAN CARLOS, CALIFORNIA 94070
999 18TH STREET, SUITE 800DENVER, COLORADO 80202
250 MONTGOMERY ST, SUITE 700SAN FRANCISCO, CA 94104
This guide and all data are for informational purposes only and do not constitute a recommendation to buy or sell securities. You should not rely on this information as the primary basis of your investment, financial, or tax planning decisions. You should consult your legal or tax professional regarding your specific situation. Third-party data is obtained from sources believed to be reliable. However, PCAC cannot guarantee that data’s cur-rency, accuracy, timeliness, completeness or fitness for any particular purpose. Certain sections of this commentary may contain forward-look-ing statements that are based on our reasonable expectations, estimate, projections and assumptions. Forward-looking statements are not guar-antees of future performance and involve certain risks and uncertainties, which are difficult to predict. Past performance is not a guarantee of future return, nor is it necessarily indicative of future performance. Keep in mind that investing involves risk. The value of your investment will fluctuate over time, and you may gain or lose money.


