What about me? Factors affecting individual adaptive ... · What about me? Factors affecting...
161
Kerrie Unsworth, Sally Russell, Stephan Lewandowsky, Carmen Lawrence, Kelly Fielding, Jon Heath, Alice Evans, Mark Hurlstone and Ilona McNeill What about me? Factors affecting individual adaptive coping capacity across different populations Final Report
Transcript of What about me? Factors affecting individual adaptive ... · What about me? Factors affecting...
Kerrie Unsworth, Sally Russell, Stephan Lewandowsky, Carmen Lawrence, Kelly Fielding, Jon Heath, Alice Evans, Mark Hurlstone and Ilona McNeill
What about me? Factors affecting individual adaptive coping capacity across different populationsFinal Report
INDIVIDUAL ADAPTATION TO CLIMATE CHANGE AND PSYCHOLOGICAL DRIVERS
What about me? Factors affecting individual adaptive coping capacity across different
populations
The University of Western Australia
KERRIE L. UNSWORTH
SALLY V. RUSSELL
STEPHAN LEWANDOWSKY
CARMEN LAWRENCE
KELLY FIELDING
JON HEATH
ALICE EVANS
MARK J. HURLSTONE
ILONA MCNEILL
ii
Published by the National Climate Change Adaptation Research Facility ISBN: 978-1-925039-43-6 NCCARF Publication 72/13 © The University of Western Australia and National Climate Change Adaptation Research Facility This work is copyright. Apart from any use as permitted under the Copyright Act 1968, no part may be reproduced by any process without prior written permission from the copyright holder. Please cite this report as: Unsworth, KL, Russell, SV, Lewandowsky, S, Lawrence, C, Fielding, K, Heath, J, Evans, A, Hurlstone, MJ, McNeill, I 2013 What about me? Factors affecting individual adaptive coping capacity across different populations, National Climate Change Adaptation Research Facility, Gold Coast, pp. 161. Acknowledgement This work was carried out with financial support from the Australian Government (Department of Climate Change and Energy Efficiency) and the National Climate Change Adaptation Research Facility (NCCARF). The role of NCCARF is to lead the research community in a national interdisciplinary effort to generate the information needed by decision-makers in government, business and in vulnerable sectors and communities to manage the risk of climate change impacts. Disclaimer The views expressed herein are not necessarily the views of the Commonwealth or NCCARF, and neither the Commonwealth nor NCCARF accept responsibility for information or advice contained herein. Cover image © Andy Dohlman, Flickr Creative Commons
What about me? Factors affecting individual adaptive coping capacity across different populations i
Table of contents
ABSTRACT .................................................................................................................. 1
EXECUTIVE SUMMARY .............................................................................................. 3
1. OBJECTIVES OF THE RESEARCH ..................................................................... 5
1.1 Background to the Research ............................................................................... 5
1.2 Triggers for Change ............................................................................................. 8
1.3 Summary ........................................................................................................... 10
2. RESEARCH ACTIVITIES .................................................................................... 11
2.1 Overview of the Studies ..................................................................................... 12
2.2 How Do We Define Adaptation and Adaptive Capacity? .................................... 13
3. METHODS AND RESULTS ................................................................................ 21
3.1 Overview of the Results ..................................................................................... 21
3.2 Coping with Climate Change Tool Development ................................................ 21
3.2.1 Tool development ............................................................................................................. 21
3.2.2 Tool psychometrics ........................................................................................................... 25
3.3 Study One – How do the goals of agricultural workers affect their adaptive behaviour? .................................................................................................................. 38
3.3.1 Sample .............................................................................................................................. 38
3.3.2 Procedure ......................................................................................................................... 38
3.3.3 Terminology ...................................................................................................................... 39
3.3.4 Why adapt to sustainable farming? .................................................................................. 41
3.3.5 Concerns with Changing Weather Patterns (Climate Change) ........................................ 41
3.3.6 Adapting Practices to Changing Weather ......................................................................... 43
3.3.7 Promoting Sustainable Farming and Becoming ‘Organic’ ................................................ 44
3.3.8 Differences between Organic and Conventional Farmers’ Goals .................................... 44
3.3.9 Factors Influencing the Ability to Adapt ............................................................................ 45
3.3.10 Strengths, Limitations and Summary of Findings from Study One ................................... 46
3.4 Study Two: How are goals and goal structures related to adaptive behaviour? .. 47
3.4.1 Sample .............................................................................................................................. 47
3.4.2 Experimental Design ......................................................................................................... 47
3.4.3 Measures .......................................................................................................................... 48
3.4.4 Descriptives: Green and Non-Green Goal Priorities ......................................................... 50
3.4.5 Effect of Goal Importance on Coping ................................................................................ 53
3.4.6 Effect of Goal Importance on Adaptive Behaviour ............................................................ 54
3.4.7 Effect of Goal Connectedness on Adaptive Behaviour ..................................................... 55
What about me? Factors affecting individual adaptive coping capacity across different populations ii
3.4.8 Relationship between Coping and Adaptive Behaviour .................................................... 56
3.4.9 Is it Possible to Change Goal Structure? .......................................................................... 56
3.4.10 Strengths, Limitations and Summary of Findings from Study Two ................................... 57
3.5 Study Three – How do goals, coping and beliefs affect adaptive behaviours? ... 59
3.5.1 Sample .............................................................................................................................. 59
3.5.2 Measures .......................................................................................................................... 59
3.5.3 Descriptives: Green and Non-Green Goals, Beliefs, Coping Strategies & Behaviours .... 64
3.5.4 Comparisons across Gender, Age, and Political Orientation ........................................... 67
3.5.5 Effect of Goal Importance on Adaptive Behaviour ............................................................ 71
3.5.6 Hypothesis Testing: Relationships between Individual Differences, Goals, Coping and Adaptive Behaviours ................................................................................................................... 75
3.5.7 Strengths, Limitations and Summary of Findings from Study Three ................................ 82
3.6 Study Four – How do political orientation and goals affect adaptation and can we manipulate those? ...................................................................................................... 83
3.6.1 Sample .............................................................................................................................. 83
3.6.2 Experimental Design ......................................................................................................... 83
3.6.3 Measures .......................................................................................................................... 84
3.6.4 Descriptives: Green & Non-Green Goals, Beliefs & Adaptive Behaviours ....................... 88
3.6.5 Did the environmental salience manipulation work? ........................................................ 91
3.6.6 Did the political salience manipulation work? ................................................................... 91
3.6.7 What is Related to Intention to Engage in Adaptive Behaviour? ...................................... 94
3.6.8 What is Related to Support for Policies? .......................................................................... 94
3.6.9 Strengths, Limitations and Summary of Findings from Study Four .................................. 95
3.7 Study Five – Does a commitment or progress orientation towards an environmental goal affect adaptive behaviour? ........................................................... 97
3.7.1 Sample .............................................................................................................................. 97
3.7.2 Experimental design ......................................................................................................... 97
3.7.3 Procedure ....................................................................................................................... 101
3.7.4 Preliminary analyses ....................................................................................................... 102
3.7.5 Hypotheses Testing ........................................................................................................ 102
3.7.6 Strengths, Limitations and Summary of Findings from Study Five ................................. 104
3.8 Study Six – How does top management support and organisational culture affect workplace adaptive behaviour? ................................................................................. 105
3.8.1 Step 1: Pilot Study – Top Management Support and Organisational Culture ................ 105
3.8.2 Step 2: Pledge at Mater Health Services ........................................................................ 106
3.8.3 Step 3: Interviews ........................................................................................................... 110
3.8.4 Strengths, Limitations and Summary of Findings from Study Six .................................. 115
What about me? Factors affecting individual adaptive coping capacity across different populations iii
3.9 Study Seven – How do goal congruence, blame, and emotion affect adaptive behaviour and policy support? .................................................................................. 116
3.9.1 Step 1: Pilot Study – Question Wording ......................................................................... 116
3.9.2 Step 2: Pilot Study – Goal Congruence and Blame ........................................................ 117
3.9.3 Step 3: Main Study – Goal Congruence and Blame ....................................................... 119
3.9.4 Strengths, Limitations and Summary of Findings from Study Seven ............................. 121
3.10 Study Eight – Executive interviews .................................................................. 122
3.10.1 Aim & Design .................................................................................................................. 122
3.10.2 Sample ............................................................................................................................ 122
3.10.3 Measures & Procedure ................................................................................................... 122
3.10.4 Results ............................................................................................................................ 123
3.10.5 Strengths, Limitations and Summary of Findings from Study Eight ............................... 123
3.11 Study Nine – Can norming information and message framing affect climate change beliefs regardless of their ideology? ............................................................. 124
3.11.1 Sample ............................................................................................................................ 125
3.11.2 Design & procedure ........................................................................................................ 125
3.11.3 Results ............................................................................................................................ 125
3.11.4 Strengths, Limitations and Summary of Findings from Study Nine ................................ 126
3.12 Study Ten – Are people’s beliefs in consensus of climate change accurate, does this affect adaptive behaviour and can it be changed? .............................................. 128
3.12.1 Sample ............................................................................................................................ 128
3.12.2 Design & Procedure ........................................................................................................ 128
3.12.3 Beliefs about climate change .......................................................................................... 129
3.12.4 Adaptive behaviours ....................................................................................................... 132
3.12.5 Comparisons across age and gender ............................................................................. 133
3.12.6 Strengths, Limitations and Summary of Results from Study Ten ................................... 134
4. DISCUSSION .................................................................................................... 136
4.1 Can we measure coping with climate change? ................................................ 136
4.2 What makes a person adapt to climate change? ............................................. 136
4.2.1 Adaptive capacity ............................................................................................................ 136
4.2.2 Adaptive behaviour ......................................................................................................... 138
4.3 What can we do to influence a person’s adaptation? ....................................... 139
4.4 Comparisons across Population Groups .......................................................... 141
4.5 Key Implications .............................................................................................. 142
5. GAPS AND FUTURE RESEARCH DIRECTIONS ............................................. 143
6. GLOSSARY & ABBREVIATIONS ..................................................................... 145
REFERENCES ......................................................................................................... 147
What about me? Factors affecting individual adaptive coping capacity across different populations iv
List of figures Figure 1. Overall Theoretical Framework ...................................................................................... 6 Figure 2. Theoretical Framework with Triggers Included (Shaded boxes) ................................... 8 Figure 3. Mean Ranking of Importance of Values ...................................................................... 51 Figure 4. Mean Ranking of Importance of Identities ................................................................... 51 Figure 5. Mean Ranking of Importance of Long-Term Project Goals ......................................... 52 Figure 6. Mean Rankings of Importance of Environmental Behaviours ..................................... 52 Figure 7. Percentage of sample and climate change beliefs ...................................................... 65 Figure 8. Mean participant ratings of use of climate change coping strategies .......................... 65 Figure 9. Mean participant ratings of importance of goals .......................................................... 66 Figure 10. Engagement in Different Adaptive Behaviours .......................................................... 67 Figure 11. Percentage of male and female participants’ reported use of coping strategies ....... 67 Figure 12. Comparison of Importance of Goals across Males and Females .............................. 68 Figure 13. Percentage of participants in different age categories and climate change beliefs .. 69 Figure 14. Mean Reported Engagement in Adaptive Behaviours across Age Categories ......... 70 Figure 15. Percentage of participants with different political affiliations and climate change beliefs .......................................................................................................................................... 71 Figure 16. Path analysis for Self-Reported Adaptive Behaviours ............................................... 77 Figure 17. Original path analysis for Petition Behaviour ............................................................. 78 Figure 18. Modified path analysis for Petition Behaviour ............................................................ 79 Figure 19. Original path analysis for Policy Support ................................................................... 80 Figure 20. Modified path analysis for Policy Support .................................................................. 81 Figure 21. Percentage of Participants with Different Climate Change Beliefs ............................ 88 Figure 22. Participants’ Rating of Goal Importance .................................................................... 89 Figure 23. Mean Ratings of Support for Policies ........................................................................ 89 Figure 24. Goal Connectedness of Categories of Adaptive Behaviours across Political Orientation ................................................................................................................................... 90 Figure 25. Self-Reported Intentions to Engage in Adaptive Behaviours across Political Orientation ................................................................................................................................... 90 Figure 26. Plots of the Interaction Between Political Salience, Political Orientation and Cognitive Complexity................................................................................................................................... 93 Figure 27. Recent green behaviours manipulation: Positive (greener than average) feedback condition. ..................................................................................................................................... 98 Figure 28. Recent green behaviours manipulation: Negative (less green than average) feedback condition. ..................................................................................................................................... 99 Figure 29. The means and 95% CI’s for ‘Past Behaviour Interpretations and ‘Recent Green Behaviour’ in the ‘Easy Donation’ condition .............................................................................. 103 Figure 30. The means and 95% CI’s for ‘Past Behaviour Interpretations and ‘Recent Green Behaviour’ in the ‘Difficult Donation’ condition .......................................................................... 104 Figure 31. Mean % emission cuts as a function of social norming and message framing conditions. ................................................................................................................................. 126 Figure 32. Climate change beliefs for Time One : Actual climate change beliefs (A); Actual and estimated climate change beliefs (B); Estimated climate change beliefs as a function of belief (C); and Actual climate change beliefs as a function of free-market ideology. ......................... 131 Figure 33. Adaptive behaviours for Time One. Panels show the mean green actions scores as a function of climate change belief (A), and the relationship between mean green actions scores and mean scores on the support for the free-market system scale (B). ................................... 133
What about me? Factors affecting individual adaptive coping capacity across different populations v
Figure 34. Climate change beliefs and adaptive behaviours—as a function of age and gender. Panels show the distribution of climate change beliefs as a function of gender (A), the distribution of climate change belie beliefs as a function of age group (B), mean green actions scores as a function of climate change belief and gender (C), and mean green actions scores as a function of climate change belief and age group (D). ....................................................... 134 Figure 35. Simplified Diagram of the Findings of our Research ............................................... 139
List of tables Table 1. Summary of Studies Conducted. .................................................................................. 11 Table 2. Items and Their Corresponding Sub-Scale for General Pro-Environmental Behaviours .................................................................................................................................................... 16 Table 3. CCC Items, their Subscale, and their Source ............................................................... 23 Table 4. Factor Loadings from Exploratory Factor Analysis with Oblique Rotation.................... 26 Table 5. Factor Loadings of the Reser Coping Scale of an Exploratory Factor Analysis with Oblique Rotation ......................................................................................................................... 28 Table 6. Means, Standard Deviations, Internal Reliabilities (Diagonal), and Intercorrelations of Coping with Climate Change Subscales ..................................................................................... 30 Table 7. Fit Statistics for Confirmatory Factor Analyses ............................................................. 31 Table 8. Loadings of Items, Variance, Composite Reliability & Average Variance Extracted .... 32 Table 9. Comparisons of Squared Correlations and Composite Reliabilities ............................. 34 Table 10. Correlations Between Coping Strategies and Climate Change Appraisals ................ 37 Table 11. Correlations between Environmental Goals and Coping Styles ................................. 53 Table 12. Correlations between environmental goals and donation behaviour .......................... 54 Table 13. Correlations between centrality of environmental goals and donation behaviour. ..... 55 Table 14. Correlations between climate change coping styles and donation behaviour ............ 56 Table 15. Differences between prompt and no-prompt conditions on goal importance ............. 57 Table 16. Correlations between Importance of Values and Reported Engagement in Adaptive Behaviours .................................................................................................................................. 73 Table 17. Correlations between Importance of Goals and Reported Engagement in Adaptive Behaviours .................................................................................................................................. 74 Table 18. Regression on Intentions to Engage in Adaptive Behaviour ...................................... 94 Table 19. Regression on Support for Policies............................................................................. 95 Table 20. Correlations between and Descriptives of Control Variables and and the Amount of Money Donated to the Green Charity ....................................................................................... 102 Table 21. Frequency and percentage of choice for each of the pledge behaviours ................. 108

What about me? Factors affecting individual adaptive coping capacity across different populations vi
What about me? Factors affecting individual adaptive coping capacity across different populations 1
ABSTRACT
When and why will people adapt to climate change? We conducted a number of studies examining the psychological drivers of individual adaptation to climate change across different populations. We used a variety of methodologies including interviews, surveys, survey experiments and face-to-face experiments. There was a high level of rigour involved in each of these methodologies which means that we can believe in the results. This programme of research represents one of the largest and most integrated attempts to understand some of the psychological drivers of individual-level adaptation.
First, we used the most recent advances in the psychological literature of coping more generally to develop a valid scale to measure coping with climate change. Across three studies we found that our tool was both reliable and valid, providing an accurate measure of the different ways in which people cope with climate change. This tool can now be used to understand the effects of both adaptive and maladaptive coping and to understand what leads to these different ways of coping.
Next, we examined adaptive capacity. We found that adaptive coping strategies were associated with perceiving climate change as a threat to oneself and one’s way of life, rating environmental goals as important, and believing that adaptive behaviours could help achieve significant personal goals. Furthermore, when looking at societal adaptive capacity (support for governmental policies) we found that not only were a threat appraisal, climate change or environmental goal, and goal connectedness related to support, but also political affiliation, perceived human contribution to climate change, (lack of) denying that climate change exists, and a number of emotions (enthusiasm, worry, (lack of) happiness, and (lack of ) embarrassment). By knowing these factors that lead to adaptive coping and support for adaptive policies we can identify strategies to improve individual adaptive capacity.
Third, based on a range of psychological literature, we hypothesised that adaptive behaviour would be related to goals, goal connectedness, adaptive coping, beliefs about climate change (including denial), and emotions that create an uneasy state of activation (enthusiasm and hope combined with worry). We found support for each of these relationships. Thus, we can again identify strategies to increase adaptive climate change behaviour.
Across the studies, we found that adaptive capacity and adaptive behaviours relied upon both “green” beliefs and goals and “non-green” beliefs and goals. Moreover, believing that the adaptive behaviours helped a person to achieve their goals (whether they were related to climate change or not) was strongly related to adaptive capacity and behaviour. We have therefore shown that we can improve adaptation not only in those people who want to help the environment but also in those who are less interested.
Unfortunately, the goal structure of environmental goals appears difficult to change. However, making people think about politics did have an effect: Regardless of their own political orientation, a person’s belief about the degree of human contribution to climate change decreased when they were thinking about politics (compared to not
What about me? Factors affecting individual adaptive coping capacity across different populations 2
thinking about politics). This has implications for how climate change adaptation is discussed in the media and by researchers.
The results of our research also have implications for the communication of climate change adaptation policies. Our results show that framing the costs of reducing CO2 emissions in terms of a decrease in future gain—rather than as an opportunity-cost—renders people more willing to commit to climate change initiatives.
In summary, this programme of research has taken an integrated and rigorous step towards greater understanding of some of the psychological drivers of individual adaptation to climate change. Given the complexity of the problem, more research is needed, however we believe that our research provides a good early step in this direction.
What about me? Factors affecting individual adaptive coping capacity across different populations 3
EXECUTIVE SUMMARY
Our team of researchers from both Psychology and Business disciplines across four universities conducted 10 studies over the last 15 months. These studies were designed to both replicate each other and extend the research questions in a variety of ways. Overall, our research questions were:
1. How can we measure how people cope with climate change? 2. What makes a person adapt to climate change? In particular, how do goals and
ideologies, goal structures, climate change beliefs, emotions and political orientations affect adaptive capacity and adaptive behaviour? Does this change across different population groups?
3. What can we do to influence a person’s adaptation? In particular: Can we alter a person’s goal structure?; Does thinking about politics affect their adaptation? Does a pledge help them to adapt?; and Does message framing affect their adaptation?
In answering these questions we used a variety of methodologies including interviews, surveys, survey experiments and face-to-face experiments. There was a high level of rigour involved in each of these methodologies ensuring that the data are credible and the results believable. This programme of research represents one of the largest and most integrated attempts to understand some of the psychological drivers of individual-level adaptation.
First, we used the most recent advances in the psychological literature of coping more generally to develop a valid scale to measure coping with climate change. Across three studies we found that our newly developed tool was both reliable and valid. It displayed good psychometric properties and showed predictive validity through significant relationships with adaptive behaviour. Thus, we provide a good tool for accurately measuring adaptive and maladaptive climate change coping.
Next, we examined adaptive capacity. We captured adaptive capacity in two forms: individual capacity through coping with climate change and societal capacity through support for adaptive policies implemented by government or organisations. Building on the coping literature, we hypothesised that cognitive appraisal, goals and goal structure would be related to individual coping. Our results supported these hypotheses: We found that perceiving climate change as a threat to oneself and one’s way of life, rating environmental goals as important, and believing that adaptive behaviours could help achieve significant personal goals were positively associated with adaptive coping strategies. By knowing these factors that lead to adaptive coping and support for adaptive policies we can identify strategies to improve individual adaptive capacity.
The second form of adaptive capacity that we examined was support for governmental or organisational adaptive policies. Once again we found that a threat appraisal, climate change or environmental goal, and goal connectedness were related to adaptive capacity. However, in addition to these, there were a number of other factors that were specifically related to policy support, namely political affiliation, perceived human contribution to climate change, (lack of) denying that climate change exists, and
What about me? Factors affecting individual adaptive coping capacity across different populations 4
a number of emotions (enthusiasm, worry, (lack of) happiness, and (lack of ) embarrassment). By knowing these factors that lead to adaptive coping and support for adaptive policies we can identify strategies to improve individual adaptive capacity.
Third, based on a range of psychological literature, we hypothesised that adaptive behaviour would be related to goals, goal connectedness, adaptive coping, beliefs about climate change (including denial), and emotions that create an uneasy state of activation (enthusiasm and hope combined with worry). We found support for each of these relationships. Thus, we can again identify strategies to increase adaptive climate change behaviour.
Across the studies, we found that adaptive capacity and adaptive behaviours relied upon both “green” beliefs and goals and “non-green” beliefs and goals. Importantly, an appraisal of the situation that denies climate change, beliefs in anthropogenic and non-anthropogenic, and the perceived degree of human contribution to climate change all affected self-reported adaptive behaviours. Just as important, however, was the finding that hedonistic, financial and societal goals were also related to adaptive behaviour. In addition, we found that as long as a person believes that the behaviour helps them to achieve their own important goals, then it does not matter whether or not their goals are environmental or not. This means that people with more hedonistic or individualistic goals might also be influenced to engage in adaptive behaviours, if they can be convinced that the behaviour helps them to achieve those goals.
Unfortunately, the goal structure of environmental goals appears difficult to change. Across three studies we found no significant differences in different manipulations of goal structure. However, making people think about politics and their political identity did have an effect: Regardless of their own political orientation, participants’ belief about the degree of human contribution to climate change decreased when they were thinking about politics (compared to not thinking about politics). This has implications for how climate change adaptation is discussed in the media and by researchers.
The results of our research also have implications for the communication of climate change adaptation policies. People often erroneously assume that reducing CO2 emissions will result in income falling from current levels rendering them less willing to support a climate change adaptation initiative. Our results show that framing the costs of reducing CO2 emissions in terms of a decrease in future gain—rather than as an opportunity-cost—should counteract this tendency, thereby rendering people more willing to commit to climate change initiatives, irrespective of their worldview.
In summary, this programme of research has taken an integrated and rigorous step towards greater understanding of some of the psychological drivers of individual adaptation to climate change. Given the complexity of the problem, more research is needed, however we believe that our research provides a good early step in this direction.
What about me? Factors affecting individual adaptive coping capacity across different populations 5
1. OBJECTIVES OF THE RESEARCH
As the scientific evidence for climate change becomes more convincing, the public shows a paradoxical decline in interest and recognition of the problem (Lewandowsky, Gignac, & Vaughan, in press). Yet little research has examined how people adapt to climate change and even less has drawn on psychological literatures such as coping, goals, emotions, norms and framing. Our team of researchers from both Psychology and Business disciplines across four universities aimed to conduct a number of studies designed to both replicate each other and extend the research questions in a variety of ways. Overall, our research questions were:
1. How can we measure the way individuals cope with climate change? 2. What makes a person adapt to climate change? In particular, how do goals and
ideologies, goal structures, climate change beliefs and emotions affect adaptive capacity and adaptive behaviour?
3. What can we do to influence a person’s adaptation? In particular: Can we alter a person’s goal structure?; Does thinking about politics affect their adaptation? Does a pledge help them to adapt?; and Does message framing affect their adaptation?
4. Do these factors operate in diverse population groups such as students, employees in the agricultural sector and in hospitals, or across the general population?
1.1 Background to the Research Adaptation has been defined as behaviours that both moderate harm and maximise opportunities for the future (IPCC, 2007a). As we discuss later, we look at both of these and examine adaptation on its own as well as the areas where mitigation and adaptation overlap (Huq & Grubb, 2003; IPCC, 2007b). Much of the social science research examining adaptation to climate change has examined how organisations, industry sectors, or societies as a whole will adapt to climate change (e.g., Smith, Lynam, & Preston, 2010; Weaver, 2011; Winn, Kirchgeorg, Griffiths, Linnenluecke, & Gunther, 2011). There is much less research examining how people themselves will adapti (Grothmann & Patt, 2005). Our research examined how the emotions, identities, values and goals of the individual affect not only their interpretation of climate change information but also the actual form that their adaptive (or maladaptive) behaviour will take (see Figure 1).
There are two main premises that underlie our research and that advance our understanding of climate change adaptation. The first comes from the realization that adapting to climate change is only one of many goals that an individual may have (alongside, for example, their work goals and other life goals) as well as their existing identities and “worldviews”. We know that people differ in their responses to climate change depending on their prior beliefs, attitudes, or worldviews (e.g., Schultz & Zelezny, 2003; Stern, 2000) but we do not know why. This is particularly important when dealing with populations who may hold identities that potentially conflict with an adaptation goal (e.g., “farmer” or “battler”) (Unsworth, Dmitrieva, & Adriasola, in press). Because the overall goal system affects the individual’s behaviour and adaptive
What about me? Factors affecting individual adaptive coping capacity across different populations 6
capacity we therefore need to take these goal systems into account when studying how different people interpret information and adapt to climate change (cf. Fishbach, Shah, & Kruglanski, 2004).
Therefore, as well as having studies which look broadly at the general population, we also have studies which focus on three sets of individuals who may hold conflicting goal systems: those with extreme worldviews (i.e., very left-wing or right-wing); those who need to increase adaptive capacity without negatively affecting the core business of providing high-quality care to patients; and those who may potentially be personally negatively affected by organisational responses to climate change such as those in the agricultural sector.
The second premise is that while much of the previous research has focused on action (e.g., pro-environmental behaviour, energy conservation activism) as adaptation (e.g., Black et al., 1985; Lubell, 2002), we believe that there are other ways that people can create adaptive capacity for dealing with climate change. This is in line with very recent thinking regarding adaptation and coping with climate change (Reser et al., 2012; Reser & Swim, 2011). Coping is defined as thoughts and behaviours undertaken to reduce, minimise or master some environmental or psychological demand that represents a potential threat, existing harm or loss (Lazarus & Folkman, 1984). Given the stress involved with the potential and existing threats posed by climate change, psychologists have argued that coping is a form of adaptation (Reser et al., 2012; Reser & Swim, 2011) and by extension the coping strategies one uses is a form of adaptive capacity.
Thus, the second theoretical frame for our research arises from the notion of coping: How do people cope with climate change that is variously perceived as a threat or an irritant but rarely as an opportunity and how do values and goals affect this coping?
Figure 1. Overall Theoretical Framework
ADAPTATION & ADAPTIVE CAPACITY
Adaptive coping
Adaptive behaviour
Policy support
Goals, Values & Free-Market Ideology
Goal structure Climate change beliefs
Emotion
What about me? Factors affecting individual adaptive coping capacity across different populations 7
In this research, we examine the effects of four main categories of psychological variables: goals, goal structures, emotions, and climate change beliefs. Figure 1 shows how each of these variables are related to adaptation (the arrows indicate a hypothesised relationship such that one variable affects the other). First, following a great deal of research into why people engage in pro-environmental behaviours (e.g., Stern, 2000; Stern & Dietz, 1994), and into why people engage in behaviours more broadly (see Austin & Vancouver, 1996) we propose that the goals a person has will affect their motivation and engagement in adaptive behaviours. More specifically, if a person has an environmental or climate change goal then we propose they will be more likely to use adaptive coping strategies, support adaptive policies and engage in adaptive behaviours. When we use the term “goal”, we include both the more common short- and medium-term goals (e.g., look into getting solar panels installed; reduce my carbon footprint) as well as longer-term identities (e.g., I am an environmentally-friendly person) and values (e.g., protecting the environment, or (negatively) idealising the power of the free market).
In addition to this, however, we also propose that the structure of a person’s goal system will affect their adaptation to climate change responses. The degree to which a goal is connected to higher-order goals affects motivation and behaviour (Adriasola & Unsworth, 2011; Adriasola, Unsworth, & Day, 2012; Unsworth, Adriasola, Johnston-Billings, Dmitrieva, & Hodkiewicz, 2011; Unsworth et al., in press) – for example, if a person believes that fixing a dripping tap helps them to save money (for an important holiday) and to have a quiet life (which they desperately want after a busy day at work) then they are more likely to fix that tap than if the behaviour is connected only to an environmental goal which the person does not care about. Therefore, we hypothesise that a positive goal structure (one that shows dense, positive connections between the person’s adaptive behaviours/goals and their other values, identities and tasks) will be strongly and positively related to adaptive coping and adaptive behaviour.
Next, we suggest that the emotions that a person feels will affect their adaptive capacity and adaptation. Emotion research demonstrates that positive and negative emotions provide valuable information about situations and signal appropriate actions (Fredrickson, 2001; Levenson, 1994) and thereby has an effect on subsequent behaviour. It has been suggested that environmental and climate change issues are likely to be highly emotionally-charged (Fineman, 1996, 1997; Pratt & Dutton, 2000), yet surprisingly little research has been conducted in this area. Furthermore, the research that has been done has taken a broad-brush approach to emotions, distinguishing only between positive and negative affect (e.g., Aitken, McMahon, Wearing, & Finlayson, 2004; Kals, Schumacher, & Montado, 1999; Lord, 1994). We therefore examined the effect of discrete emotions on adaptive behaviour.
Finally, inherent in our model is the premise that acceptance of climate science is an important predecessor to adaptive capacity and adaptive behaviour. Although we do not predict that it is the only precursor (as can be seen through other direct links to adaptation), we do acknowledge its importance in individual adaptation. This premise is based on expectancy theory: A person will be motivated to engage in a behaviour if they believe it will result in actual change. Thus, a person who does not believe in climate change or does not believe that what he or she does, as an individual, affects
What about me? Factors affecting individual adaptive coping capacity across different populations 8
the environment or climate change then he or she will not engage in adaptive behaviours.
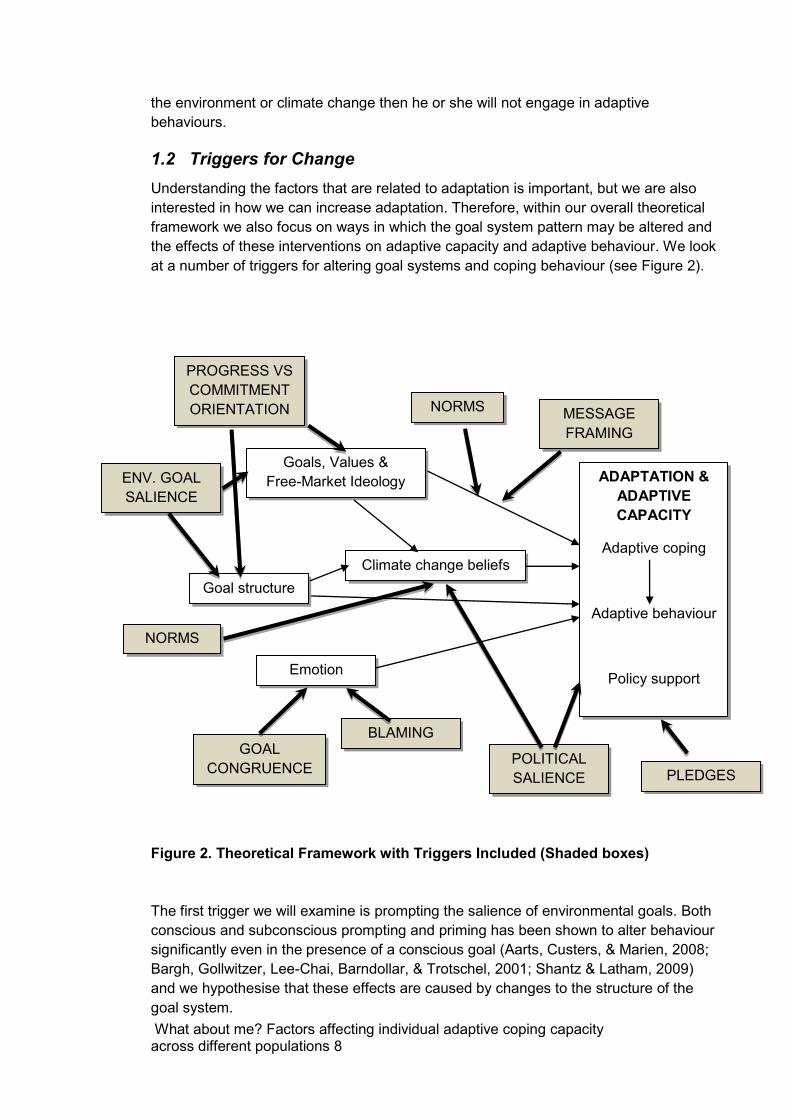
1.2 Triggers for Change Understanding the factors that are related to adaptation is important, but we are also interested in how we can increase adaptation. Therefore, within our overall theoretical framework we also focus on ways in which the goal system pattern may be altered and the effects of these interventions on adaptive capacity and adaptive behaviour. We look at a number of triggers for altering goal systems and coping behaviour (see Figure 2).
Figure 2. Theoretical Framework with Triggers Included (Shaded boxes)
The first trigger we will examine is prompting the salience of environmental goals. Both conscious and subconscious prompting and priming has been shown to alter behaviour significantly even in the presence of a conscious goal (Aarts, Custers, & Marien, 2008; Bargh, Gollwitzer, Lee-Chai, Barndollar, & Trotschel, 2001; Shantz & Latham, 2009) and we hypothesise that these effects are caused by changes to the structure of the goal system.
ADAPTATION & ADAPTIVE CAPACITY
Adaptive coping
Adaptive behaviour
Policy support
Goals, Values & Free-Market Ideology
Goal structure Climate change beliefs
Emotion
NORMS MESSAGE FRAMING
ENV. GOAL SALIENCE
PROGRESS VS COMMITMENT ORIENTATION
NORMS
GOAL CONGRUENCE
BLAMING
POLITICAL SALIENCE PLEDGES
What about me? Factors affecting individual adaptive coping capacity across different populations 9
Moreover, Fishbach, Zhang and Koo (2009) suggest that the way people interpret recently completed goal-related behaviours could influence which goal they will pursue next. More specifically, if they think about not working on a goal-related behaviour in terms of progress (“I have made little progress to this goal”) then they will be motivated to do more for the goal, whereas if they think about it in terms of commitment (“I guess I’m just not very committed to this goal”) then they will do less. When people have done quite a bit already, on the other hand, the effects are opposite with a progress interpretation (“I have made substantial progress to this goal”) leading to less motivation to work on it, whereas a commitment interpretation (“I must be very committed to this goal”) leads to an increased chance of additional behaviours. Thus, we will also examine the extent to which manipulating a person to have either a progress or a commitment orientation affects their adaptive behaviour.
The third trigger is social norms. Nudging a behaviour by providing information about what other people are doing can be very effective. For example, Schultz et al. (Schultz, Nolan, Cialdini, Goldstein, & Griskevicius, 2007) showed that information about average energy consumption in one’s neighbourhood reduced power consumption. We examine whether providing people with accurate social norming information also affects their climate change beliefs. In addition, although prior research suggests that support for a laissez-faire ‘free-market’ ideology predicts rejection of climate science (Heath & Gifford, 2006), we investigate whether normative information can mitigate this effect on participants’ attitudes towards policy action to reduce carbon emissions.
In a similar way, we will also examine whether the way in which a message is framed can mitigate the effects of free-market ideology. Research has shown that losses tend to be viewed more favourably, and are deemed fairer, when they are framed as a decrease in gain (Kahneman & Tversky, 1979; Tversky & Kahneman, 1986). For instance, even though the economic outcome is the same, Hatfield-Dodds and Morrison (2010) found that people were more willing to commit to a climate change policy when the costs of doing so were framed as a foregone-gain rather than as an opportunity-cost. Thus, our fourth trigger is altering the message framing to determine its effect on policy support.
Next, we will examine the way in which emotions may be altered in adaptation to climate change. In particular, we use Lazarus’ Cognitive-Motivational-Relational model (Lazarus, 1991b). This model suggests that primary and secondary appraisals of events (in this case climate change) affect emotional responses, which in turn influence behavioural responses, including coping. We hypothesise that adaptive behaviour will be affected by the extent to which the hospital employee believes that the outcome of adaptive behaviour is likely to lead to harm or benefit, with (potential for) harm leading to negative emotions, and (potential for) benefit leading to positive emotions. Furthermore, we also hypothesise that adaptive behaviour will be affected by whether the employee blames the hospital or not for contributing to climate change. We hypothesise that by manipulating these two appraisals in a hospital setting we will affect the specific emotion that an employee will feel regarding climate change which then will have effects on adaptive capacity and behaviour.
What about me? Factors affecting individual adaptive coping capacity across different populations 10
Finally, given the politicization of adaptation to climate change, we examine the effects that that might have on climate change beliefs and policy support. In particular, we will make an individual’s political identity salient. If that identity is important to the person, they will then take on the characteristics of the prototypical member of that group (e.g., Hogg & Terry, 2000; Turner, Oakes, Haslam, & McGarty, 1994); a person who identifies with more left-wing politics will take on more left-wing characteristics and a person who identifies with more right-wing politics will take on more right-wing characteristics. Thus, we explore whether a person is more (or less) likely to have anthropogenic climate change beliefs and support adaptive policies when they start thinking about their political identity.
1.3 Summary In summary, we will examine three key questions across numerous research populations: 1) How can we measure the way individuals cope with climate change and is it important; 2) How do goals and ideologies, goal structures, and emotions affect adaptive capacity and adaptive behaviour; and 3) What can we do to influence these processes? We now describe the 10 studies that were conducted to examine these questions.
What about me? Factors affecting individual adaptive coping capacity across different populations 11
2. RESEARCH ACTIVITIES
During the course of 2012, our research teams have engaged in 10 projects to answer the question of why people engage in adaptive behaviour and what we can do to influence and increase that behaviour. These have included interviews, surveys and experiments. Table 1 summarises the different studies. Given the variety of studies, their complexity and the complexity of the results, we will present each study separately. However, to begin, we first discuss our overall approach and overview of the studies, our definition of adaptive behaviour and the development of the Coping with Climate Change (CCC) tool.
Table 1. Summary of Studies Conducted
Study Sample Methodology Constructs
Study One
Farmers (N=19; Australia)
Interviews Goals, goal structure, climate change beliefs, coping, why adapt?
Study Two
Students (N=400; WA)
Experiment Goals, goal structure, coping, specific adaptation behaviour
Study Three
National sample (N=303; Australia)
Temporally-lagged survey
Goals, goal structure, coping, climate change beliefs, general adaptive behaviour
Study Four
National sample (N=581; Australia)
Experiment Goals, goal structure, political orientation, climate change beliefs, general adaptive behaviour
Study Five
Students (N=137; WA)
Experiment Goals, goal structure, specific adaptation behaviour
Study Six
Hospital sample (N=121,14 5; Qld)
Pilot survey, pledge, interviews
Goals, top management support, organisational culture, workplace pro-environmental behaviour
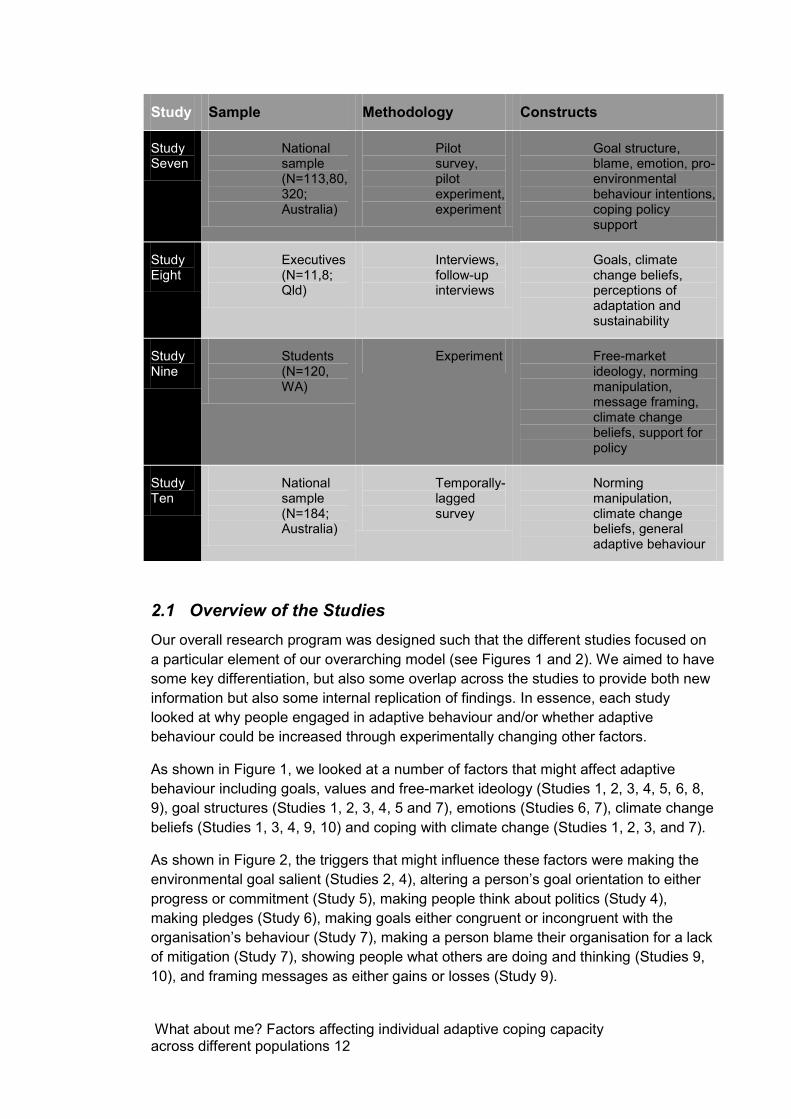
What about me? Factors affecting individual adaptive coping capacity across different populations 12
Study Sample Methodology Constructs
Study Seven
National sample (N=113,80, 320; Australia)
Pilot survey, pilot experiment, experiment
Goal structure, blame, emotion, pro-environmental behaviour intentions, coping policy support
Study Eight
Executives (N=11,8; Qld)
Interviews, follow-up interviews
Goals, climate change beliefs, perceptions of adaptation and sustainability
Study Nine
Students (N=120, WA)
Experiment Free-market ideology, norming manipulation, message framing, climate change beliefs, support for policy
Study Ten
National sample (N=184; Australia)
Temporally-lagged survey
Norming manipulation, climate change beliefs, general adaptive behaviour
2.1 Overview of the Studies Our overall research program was designed such that the different studies focused on a particular element of our overarching model (see Figures 1 and 2). We aimed to have some key differentiation, but also some overlap across the studies to provide both new information but also some internal replication of findings. In essence, each study looked at why people engaged in adaptive behaviour and/or whether adaptive behaviour could be increased through experimentally changing other factors.
As shown in Figure 1, we looked at a number of factors that might affect adaptive behaviour including goals, values and free-market ideology (Studies 1, 2, 3, 4, 5, 6, 8, 9), goal structures (Studies 1, 2, 3, 4, 5 and 7), emotions (Studies 6, 7), climate change beliefs (Studies 1, 3, 4, 9, 10) and coping with climate change (Studies 1, 2, 3, and 7).
As shown in Figure 2, the triggers that might influence these factors were making the environmental goal salient (Studies 2, 4), altering a person’s goal orientation to either progress or commitment (Study 5), making people think about politics (Study 4), making pledges (Study 6), making goals either congruent or incongruent with the organisation’s behaviour (Study 7), making a person blame their organisation for a lack of mitigation (Study 7), showing people what others are doing and thinking (Studies 9, 10), and framing messages as either gains or losses (Study 9).
What about me? Factors affecting individual adaptive coping capacity across different populations 13
We also designed our research program to include a variety of different methodologies depending upon the research question. As such, we have interviews, experiments and surveys using student participants, national survey panel participants and employed participants.
Our research is subject to some caveats. While we aimed for representative samples, the findings can only be generalised to the wider population with caution. Furthermore, the findings are based on the statistics we have run to date; more complex statistical analyses may be run on these data following the publication of this report.
We will now discuss how we measured adaptive behaviour and the development of the CCC tool before looking at the results of each of the studies in turn.
2.2 How Do We Define Adaptation and Adaptive Capacity? We took a broad approach to measuring adaptation. We took for a starting point the IPCC definition, “Adaptation is the adjustment in natural or human systems in response to actual or expected climatic stimuli or their effects, which moderates harm or exploits beneficial opportunities” (IPCC 2007, p. 7). At an individual level, therefore, this would involve changing one’s behaviour to adapt to the effects of climate change including but not limited to climate variability, limited water supplies, limited energy use, and so on, as well as behaviours which moderate harm such as adapting one’s use of transportation.
Some might argue that some of these behaviours, such as transportation use, are mitigation behaviours and therefore are not adaptation and should not be studied as such. We disagree. There is a growing awareness of the overlap between adaptation and mitigation (e.g., Howard, 2008; Reser & Swim, 2011) and the IPCC has indicated that more research needs to investigate the interrelationships and overlaps between the two (Huq & Grubb, 2003; IPCC, 2007b). Indeed, they stated that “the most relevant literature is that which recognises that both adaptation and mitigation often occur as part of ongoing activities” (Huq & Grubb, 2003, p.3, emphasis in original). We therefore decided that in the case of individuals, it was more important to be inclusive about our measures than to focus only on the exploitation of opportunities. Other research in this field has also taken a similar stance (e.g,. Black et al., 1985). Moreover, this broader definition also fits when considering its opposite, namely maladaption, defined by the United Nations Development Program as: “An action or process that increases vulnerability to climate change-related hazards. Maladaptive actions and processes often include planned development policies and measures that deliver short-term gains or economic benefits but lead to exacerbated vulnerability in the medium to long-term.” Thus, we included measures of individual behaviour that both moderate harm and exploit opportunities. Similarly, we also took a broad approach to measuring adaptive capacity. The IPCC definitions of adaptive capacity are “The whole of capabilities, resources and institutions of a country or region to implement effective adaptation measures” (Working group 3) and “The ability of a system to adjust to climate change (including
What about me? Factors affecting individual adaptive coping capacity across different populations 14
climate variability and extremes) to moderate potential damages, to take advantage of opportunities, or to cope with the consequences” (Working group 2). Following recent research (Reser et al., 2012; Reser & Swim, 2011) we suggest that, at an individual level, such ability to implement adaptation measures will require appropriate personal coping strategies as well as supporting societal and systemic adaptation.
We therefore used a number of different methods for accessing the behaviours, beliefs and coping strategies that people engage in to represent either adaptation to climate change or adaptive capacity.
To capture adaptation at an individual level, we measured adaptive behaviours. Different populations and different research designs meant that we needed to use different measures. These are outlined below.
1. Adaptive farming practices o In Study 1, we asked farmers about practices that they engaged in to
adapt to changing weather patterns. We deliberately avoided the use of the term “climate change” so as not to create any biases or defences in the participants.
o Some examples of the adaptive farming practices included mulching, composting and relocation.
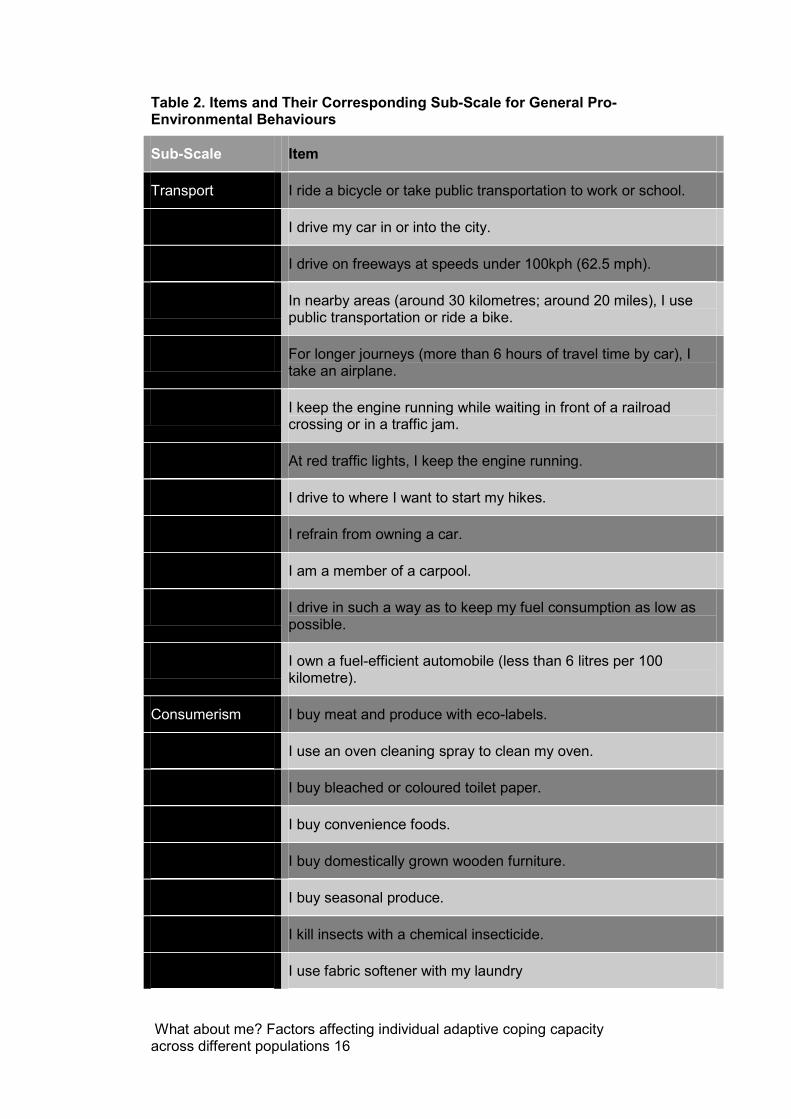
2. General pro-environmental behaviours (self-reported).
The General Ecological Behaviours scale (Kaiser, 1998; Kaiser, Doka, Hofstetter, & Ranney, 2003; Kaiser & Wilson, 2000, 2004) was used in Study 3 to capture a wide range of adaptive behaviours. These covered different categories including transportation, recycling and waste, energy efficiency, activism and so on. The scale has proven to have strong reliability and validity in previous studies .(Kaiser et al., 2003; Kaiser & Wilson, 2004) The items are shown in

What about me? Factors affecting individual adaptive coping capacity across different populations 15
o Table 2 below.
What about me? Factors affecting individual adaptive coping capacity across different populations 16
Table 2. Items and Their Corresponding Sub-Scale for General Pro-Environmental Behaviours
Sub-Scale Item
Transport I ride a bicycle or take public transportation to work or school.
I drive my car in or into the city.
I drive on freeways at speeds under 100kph (62.5 mph).
In nearby areas (around 30 kilometres; around 20 miles), I use public transportation or ride a bike.
For longer journeys (more than 6 hours of travel time by car), I take an airplane.
I keep the engine running while waiting in front of a railroad crossing or in a traffic jam.
At red traffic lights, I keep the engine running.
I drive to where I want to start my hikes.
I refrain from owning a car.
I am a member of a carpool.
I drive in such a way as to keep my fuel consumption as low as possible.
I own a fuel-efficient automobile (less than 6 litres per 100 kilometre).
Consumerism I buy meat and produce with eco-labels.
I use an oven cleaning spray to clean my oven.
I buy bleached or coloured toilet paper.
I buy convenience foods.
I buy domestically grown wooden furniture.
I buy seasonal produce.
I kill insects with a chemical insecticide.
I use fabric softener with my laundry
What about me? Factors affecting individual adaptive coping capacity across different populations 17
Sub-Scale Item
I use a chemical air freshener in my bathroom.
Waste avoidance I buy beverages in cans.
If I am offered a plastic bag in a store, I take it.
I buy beverages and other liquids in returnable bottles.
I buy products in refillable packages.
I reuse my shopping bags.
Energy conservation
I wait until I have a full load before doing my laundry.
In the winter, I air rooms while keeping on the heat and leaving the windows open, simultaneously.
I wash dirty clothes without prewashing.
I use a clothes dryer.
In winter, I turn down the heat when I leave my apartment for more than 4 hours.
I shower (rather than to take a bath).
In the winter, I keep the heat on so that I do not have to wear a sweater.
In hotels, I have the towels changed daily.
I own an energy efficient dishwasher (efficiency class A+ or better).
Recycling I collect and recycle used paper.
I bring empty bottles to a recycling bin.
I put dead batteries in the garbage.
After meals, I dispose of leftovers in the toilet
Vicarious social behaviours & activism
I have pointed out unecological behaviour to someone.
What about me? Factors affecting individual adaptive coping capacity across different populations 18
Sub-Scale Item
I contribute financially to environmental organizations.
I boycott companies with an unecological background.
I read about environmental issues.
I talk with friends about environmental pollution, climate change, and/or energy consumption.
I am a member of an environmental organization.
After a picnic, I leave the place as clean as it was originally.
I own solar panels.
I have looked into the pros and cons having a private source of solar power.
I have a contract for renewable energy with my energy provider.
3. General pro-environmental behaviours (self-reported) o A short adaptive behaviours scale was used in Studies Four and Ten as
the length of the previous scale was prohibitive. In these studies we used items from the CSIRO survey (Leviston & Walker, 2011). These items were:
Walk/cycle/take public transport Use or buy environmentally-friendly cleaning products Use or switch to appliances that are environmentally-friendly Where possible, buy products that are made locally Contact a government member about climate change Reduce the amount of gas and/or electricity I use around the
house Take part in a political campaign about an environmental issue Reduce the amount of water I use around the house and garden Turn lights off around the house Try to fix things rather than replace them Continue to have or switch to Green Power Electricity
4. Workplace adaptive behaviour (self-reported) o In Study Nine we were examining employees of a hospital, therefore the
behaviours needed to be organisationally-focused. The pledge consisted of a list of environmentally-friendly behaviours that participants could choose to pledge to. Behaviours from the categories of procurement, energy, waste, and water were included, for example:
Turn off my computer when I leave work at the end of the day; Turn off my monitor when I leave work at the end of the day;
What about me? Factors affecting individual adaptive coping capacity across different populations 19
Turn off lights when I leave work at the end of the day; Bring my own “Keep Cup” when purchasing coffee or other hot
drinks; Use tele- and video-conferencing to reduce work-related car and
plane trips; Turn off taps while soaping up hands where sensor activation is
available; Reduce paper consumption by printing on both sides.
o Study Seven examined workplace adaptive behaviour intentions. A measure was developed based on studies by Homburg and Stolberg (2006) and Bissing-Olsen, Iyer, Fielding, and Zacher (2012). The measure consisted of three items in response to the opening, I would…
Try to convince my colleagues of the importance of environment protection;
Consider together with my colleagues how we can work in a more environmentally-friendly way in our company; and
Adequately complete assigned duties in environmentally-friendly ways
5. Specific donation behaviours
o Studies Two and Five employed an experimental paradigm, therefore we were able to use a specific behaviour that would be “hidden” from the participants. In this way we were not relying on them telling the truth, as per the self-reported measures. We told the participants that they would be given a small thank-you for completing the survey in the form of a voucher for a coffee and cake or money. We then gave them the option of taking the voucher/money themselves or donating it (or part of it) to a charity. In Study Two, the options were either to donate to the Conservation Council of WA or to the Australian Red Cross. In addition, at the end of the experiment we asked them whether they would be willing to participate in other studies examining adaptation to climate change with a range of options from interviews taking approximately one hour through to online surveys taking approximately 20 minutes. In Study Four, participants were told that they would receive an extra $5 for participating in this study. They were then given the opportunity to donate (all or part of) the $5 to the UWA Green initiative program, the Wheelchair Sports WA association, or a combination of both. They were also given the opportunity to tick a box that indicated they wanted to keep the money themselves.
o By using these more unobtrusive measures, we were able to ascertain whether or not people would engage in adaptive behaviours without any social desirability influences on their behaviour.
To capture adaptive capacity, we examined two main drivers of capacity: personal coping strategies and support for societal/systemic changes.
What about me? Factors affecting individual adaptive coping capacity across different populations 20
1. We measured individual coping strategies in Studies Two, Three and Seven. The design and validation of a tool to measure coping with climate change was a key deliverable of this project, and as such will be discussed in much greater detail in the Results section of this report.
2. The second element of adaptive capacity that we measured was support for policies at a broader level. We measured this across the studies in three ways:
o In Study Three we obtained a behavioural measure of petition-signing. This was designed so that participants would truly believe that it was separate to the survey (and hence would be less influenced by social desirability). Participants were asked to sign or create a petition around increasing the renewable energy target.
o In Studies Three, Four and Five, we examined people’s self-reported support for a range of potential policies at state and federal government levels. These included policies that would have an effect on them both positively (e.g., More incentives for taxpayers to reduce their energy and water use) and negatively (e.g., Regulating a move to greener fuels and lower-emissions energy even if fuel prices will increase) as well as policies that were unlikely to affect them personally at all (e.g., Funding research into producing lower-emissions products).
o Study Seven examined support for adaptive policies in the workplace using Ramus and Steger’s (2000) measure of policy support. The measure consisted of 13 items:
Publishing an environmental policy Specific targets for environmental performance Publishing an annual environmental report Using an environmental management system Apply environmental considerations to purchasing decisions Providing employee environmental training Making employees responsible for company environmental
performance Using life cycle analysis Having management which understands/addresses issues of
sustainable development Systematically reducing fossil fuel use Systematically reducing toxic chemicals use Systematically reducing consumption of unsustainable products Applying the same environmental standards at home and abroad
o In Study Nine, we examined people’s willingness to reduce CO2 emissions.
What about me? Factors affecting individual adaptive coping capacity across different populations 21
3. METHODS AND RESULTS
3.1 Overview of the Results In this section we will review the methods and results from each of the studies. We first provide the results from the development of the Coping with Climate Change tool. We then detail each of the 10 studies, providing information about the methods followed by the results for that study. In the Discussion we will bring these results together thematically and highlight the main findings overall.
Once again, our research is subject to some caveats. While we aimed for representative samples, the findings can only be generalised to the wider population with caution. Furthermore, the findings are based on the statistics we have run to date; more complex statistical analyses may be run on these data following the publication of this report.
3.2 Coping with Climate Change Tool Development Adaptive capacity requires an ability to implement or to make changes in the face of climate change. We argue, as does Reser and colleagues (Reser et al., 2012; Reser & Swim, 2011), that the literature and research in the psychology field examining coping in other areas of life can help in our understanding. Thus, a key outcome from this programme of research was the development of a reliable and valid tool for measuring coping with climate change based on previous psychological research.
These results show that we can accurately measure the different ways in which people cope with the effects of climate change. Having this tool will enable future research to understand why, when and how people cope adaptively, and why, when and how they cope maladaptively.
3.2.1 Tool development To our knowledge, there are two coping scales developed which examine coping with climate change and/or environmental problems (one of which is still unpublished). The first was by Homburg and colleagues (Homburg, Stolberg, & Wagner, 2007) and was based on the theoretical foundations of Lazarus’s cognitive model of stress and coping (Lazarus, 1966, 1991a; Lazarus & Folkman, 1984, 1991). Homburg and colleagues’ scale was comprised of eight subscales: problem-solving, expression of emotion, denial of guilt, relativisation, wishful thinking, self-protection, pleasure, resignation. However there were some problems with some of these subscales. The pleasure and resignation subscales had poor loadings in the factor analyses; the self-protection items were complex and involved concepts that many lay-people are unlikely to understand (e.g., “When there is an elevated ozone concentration outside, I avoid physical strain outside”); the statistics used to confirm the structure contained serious problems (for example, two subscales were not included – wishful thinking and resignation – and to obtain adequate fit statistics the authors were required to correlate the residual errors in items in the denial of guilt, problem-solving, wishful thinking and
What about me? Factors affecting individual adaptive coping capacity across different populations 22
expression of emotion subscales); and wishful thinking was highly correlated with expression of emotion. Moreover, more recent advances in the coping literature since the foundation work by Lazarus and colleagues (E. A. Skinner, Edge, Altman, & Sherwood, 2003) suggest that these subscales might not be completely appropriate. Given these problems we decided that the scale by Homburg and colleagues (2007) was a good basis but could not be used in its entirety.
As noted above, Skinner and colleagues (2003) have suggested that a better approach can be found in the structure of coping than the early one proposed by Lazarus. After reviewing the literature, they propose that the best structure is one which is based on the processes involved in the different action types. There are three overriding processes each with different action types: 1) Coordinating actions and contingencies in the environment (this includes coping strategies such as problem-solving and planning); 2) Coordinating self-reliance and social support (for example, expression of emotion); and 3) Coordinating preferences and available options (for example, accommodation and submission).
We used this overriding structure to develop the Coping with Climate Change (CCC) tool. Mindful of the need to make the items relevant to climate change adaptive capacity (see Reser et al., 2012), we only used coping strategies that made sense in this context. We used both the Homburg and colleagues’ scale (2007) and the most widely-used and validated scale in the broader psychological coping literature, that by Carver, Scheier and Weintraub (1989). In addition, given our broad definition of individual adaptation, we decided to include a subscale for preventive coping (Greenglass & Fiksenbaum, 2009; Greenglass, Schwarzer, Jakubiec, Fiksenbaum, & Taubert, 1999) to determine its relevance for adaptation and adaptive capacity.
During the development of the CCC, we discovered that Reser has also recently developed a coping scale for climate change. This scale is as yet unpublished but was sent to us in a personal communication. The Reser scale was based on a study from a marketing and consumer framework (Duhachek, 2005) and has eight subscales: action, avoidance, denial, emotional support, emotional venting, instrumental support, positive thinking, and rational thinking. The main point of different between the CCC and the Reser scales is the degree of differentiation amongst adaptive active coping styles. The Reser scale contains only one undifferentiated subscale. The CCC includes different types of adaptive active coping including direct action, problem-solving and information seeking, planning, and preventive coping. As such, we decided to keep going with the testing of the CCC.
It should be noted that we used both the more user-friendly term “weather changes” and the more technically-correct term “climate change” in the items and the introduction to the items. Based on CSIRO advice, we wanted to frame the issue with a local, relevant problem and one which would not create bias in people’s responses (Gardner et al., 2009) – hence the term “weather change”. However, others have suggested that climate change is peculiar to itself and needs to be measured as such (Reser et al., 2012) – hence the term “climate change”. As will be shown in Study Seven, we found no differences in affective reaction by urban participants between the two terms. We suggest that future researchers use the term that is most appropriate for their sample.
What about me? Factors affecting individual adaptive coping capacity across different populations 23
We introduced the scale with the following: “We are interested in how people are dealing with the current changes to weather that Australia is experiencing (e.g., reduced rainfall, increasing temperatures and increasing ‘extreme’ weather events such as breaking temperature records, droughts, bushfires, and floods). There are different ways to deal with these problems. This questionnaire asks you to indicate what you generally think, do, and feel when you experience stress arising out of these changes. Obviously different issues bring out somewhat different responses, but think about how true the following statements are for you when dealing with the issue of these weather changes.”
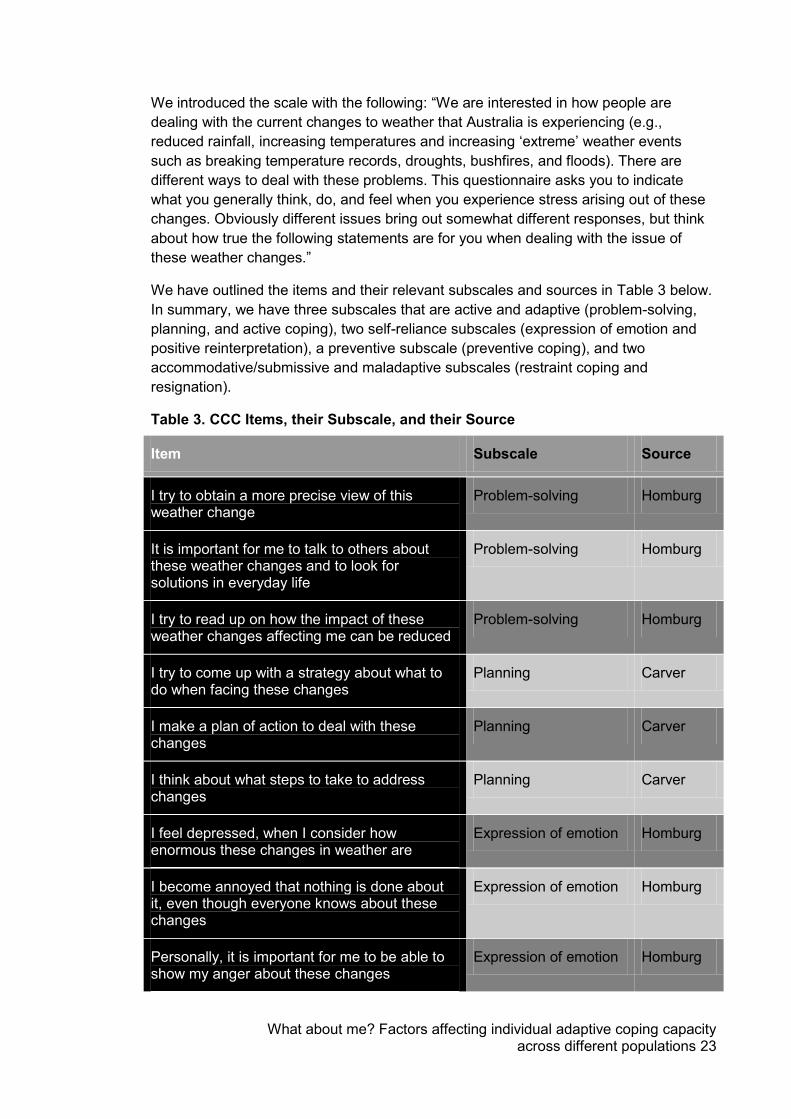
We have outlined the items and their relevant subscales and sources in Table 3 below. In summary, we have three subscales that are active and adaptive (problem-solving, planning, and active coping), two self-reliance subscales (expression of emotion and positive reinterpretation), a preventive subscale (preventive coping), and two accommodative/submissive and maladaptive subscales (restraint coping and resignation).
Table 3. CCC Items, their Subscale, and their Source
Item Subscale Source
I try to obtain a more precise view of this weather change
Problem-solving Homburg
It is important for me to talk to others about these weather changes and to look for solutions in everyday life
Problem-solving Homburg
I try to read up on how the impact of these weather changes affecting me can be reduced
Problem-solving Homburg
I try to come up with a strategy about what to do when facing these changes
Planning Carver
I make a plan of action to deal with these changes
Planning Carver
I think about what steps to take to address changes
Planning Carver
I feel depressed, when I consider how enormous these changes in weather are
Expression of emotion Homburg
I become annoyed that nothing is done about it, even though everyone knows about these changes
Expression of emotion Homburg
Personally, it is important for me to be able to show my anger about these changes
Expression of emotion Homburg
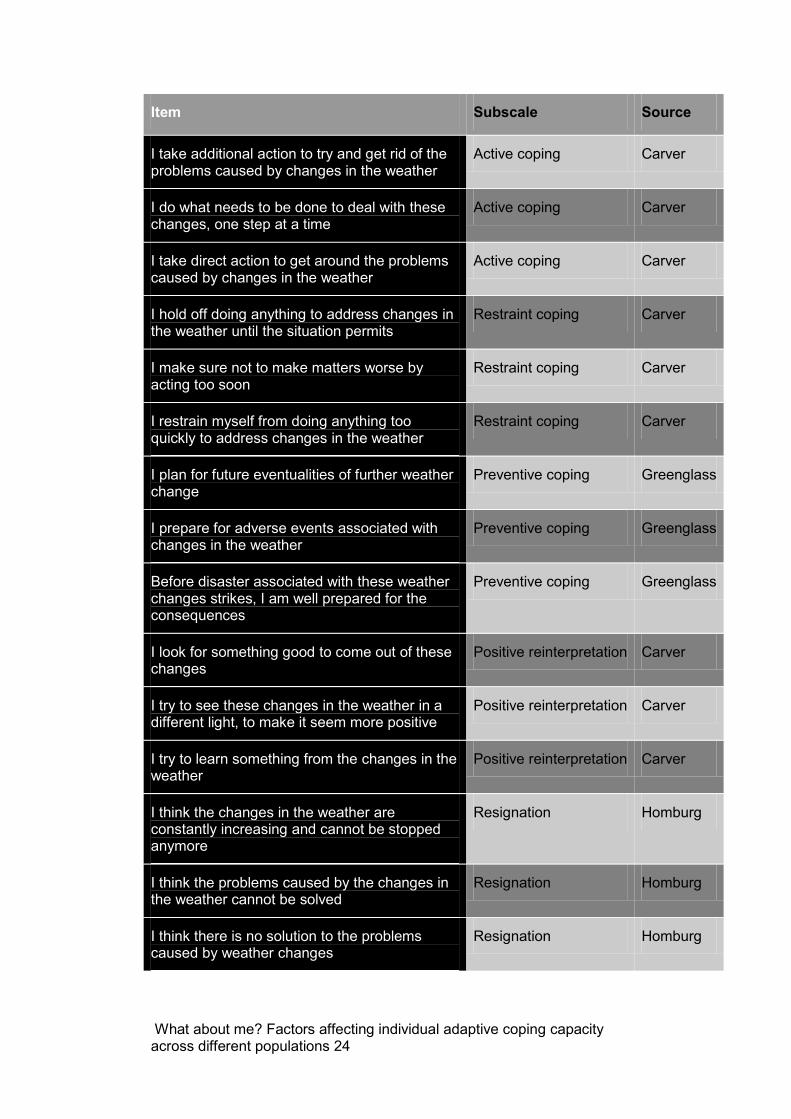
What about me? Factors affecting individual adaptive coping capacity across different populations 24
Item Subscale Source
I take additional action to try and get rid of the problems caused by changes in the weather
Active coping Carver
I do what needs to be done to deal with these changes, one step at a time
Active coping Carver
I take direct action to get around the problems caused by changes in the weather
Active coping Carver
I hold off doing anything to address changes in the weather until the situation permits
Restraint coping Carver
I make sure not to make matters worse by acting too soon
Restraint coping Carver
I restrain myself from doing anything too quickly to address changes in the weather
Restraint coping Carver
I plan for future eventualities of further weather change
Preventive coping Greenglass
I prepare for adverse events associated with changes in the weather
Preventive coping Greenglass
Before disaster associated with these weather changes strikes, I am well prepared for the consequences
Preventive coping Greenglass
I look for something good to come out of these changes
Positive reinterpretation Carver
I try to see these changes in the weather in a different light, to make it seem more positive
Positive reinterpretation Carver
I try to learn something from the changes in the weather
Positive reinterpretation Carver
I think the changes in the weather are constantly increasing and cannot be stopped anymore
Resignation Homburg
I think the problems caused by the changes in the weather cannot be solved
Resignation Homburg
I think there is no solution to the problems caused by weather changes
Resignation Homburg
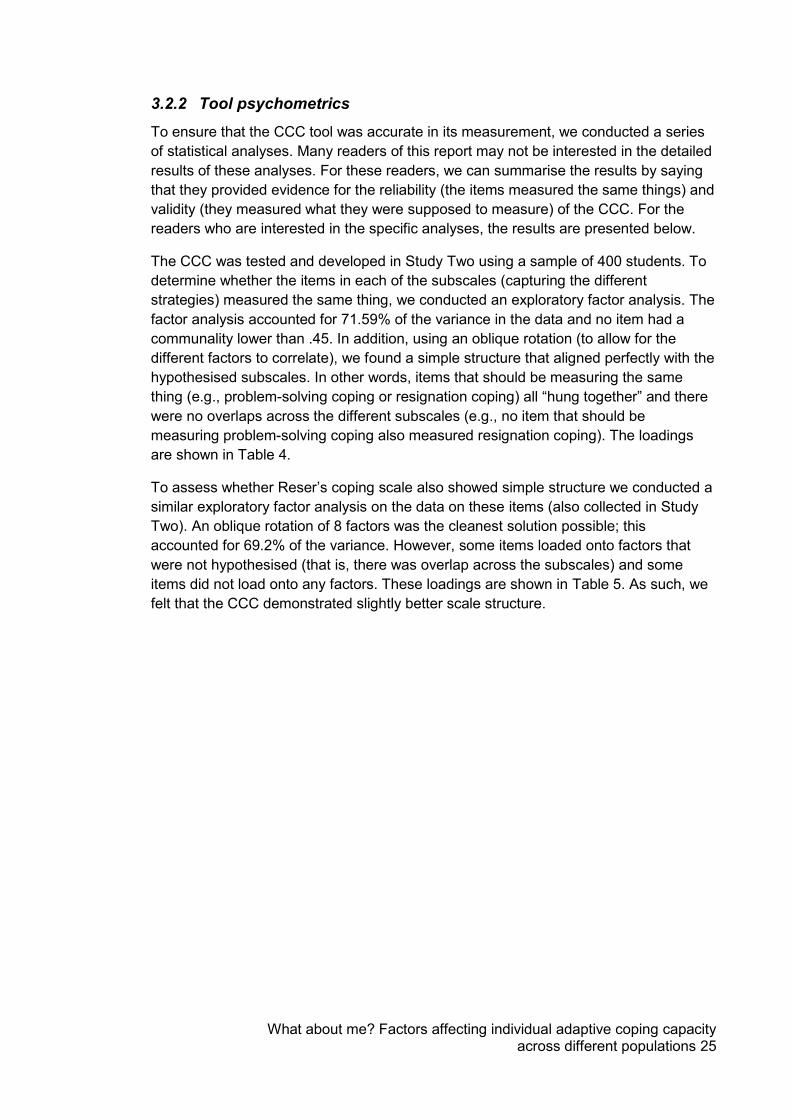
What about me? Factors affecting individual adaptive coping capacity across different populations 25
3.2.2 Tool psychometrics To ensure that the CCC tool was accurate in its measurement, we conducted a series of statistical analyses. Many readers of this report may not be interested in the detailed results of these analyses. For these readers, we can summarise the results by saying that they provided evidence for the reliability (the items measured the same things) and validity (they measured what they were supposed to measure) of the CCC. For the readers who are interested in the specific analyses, the results are presented below.
The CCC was tested and developed in Study Two using a sample of 400 students. To determine whether the items in each of the subscales (capturing the different strategies) measured the same thing, we conducted an exploratory factor analysis. The factor analysis accounted for 71.59% of the variance in the data and no item had a communality lower than .45. In addition, using an oblique rotation (to allow for the different factors to correlate), we found a simple structure that aligned perfectly with the hypothesised subscales. In other words, items that should be measuring the same thing (e.g., problem-solving coping or resignation coping) all “hung together” and there were no overlaps across the different subscales (e.g., no item that should be measuring problem-solving coping also measured resignation coping). The loadings are shown in Table 4.
To assess whether Reser’s coping scale also showed simple structure we conducted a similar exploratory factor analysis on the data on these items (also collected in Study Two). An oblique rotation of 8 factors was the cleanest solution possible; this accounted for 69.2% of the variance. However, some items loaded onto factors that were not hypothesised (that is, there was overlap across the subscales) and some items did not load onto any factors. These loadings are shown in Table 5. As such, we felt that the CCC demonstrated slightly better scale structure.
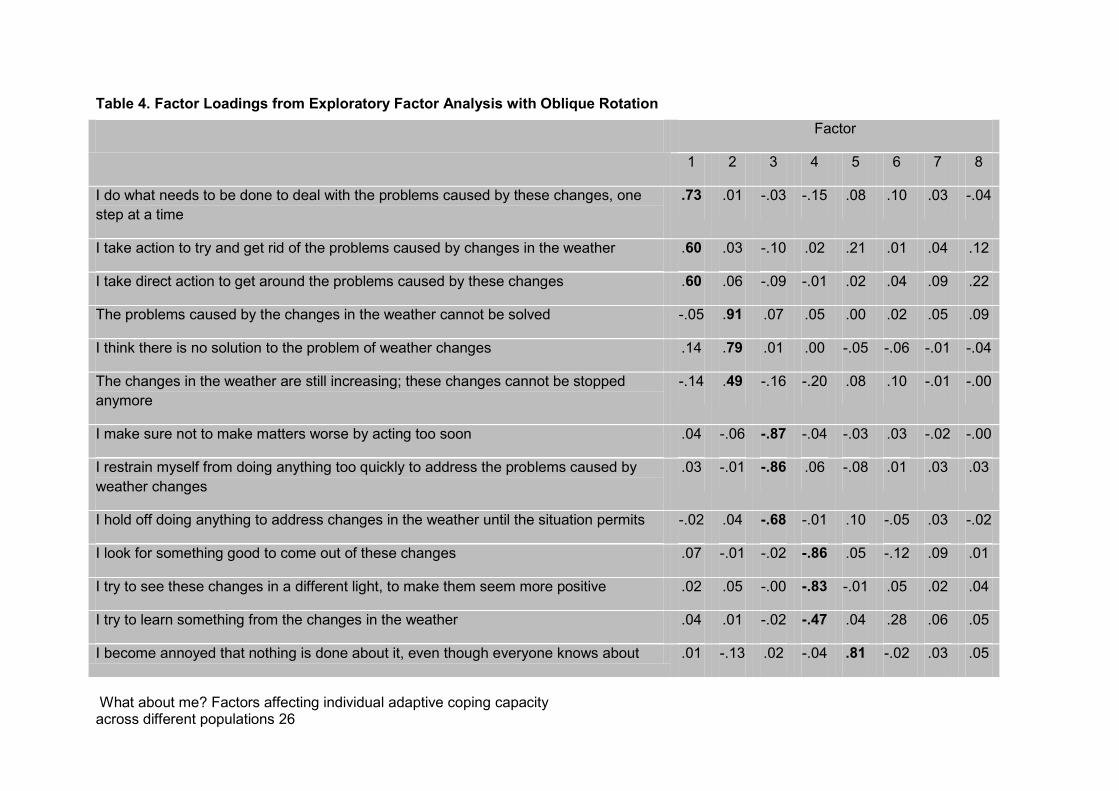
What about me? Factors affecting individual adaptive coping capacity across different populations 26
Table 4. Factor Loadings from Exploratory Factor Analysis with Oblique Rotation
Factor
1 2 3 4 5 6 7 8
I do what needs to be done to deal with the problems caused by these changes, one step at a time
.73 .01 -.03 -.15 .08 .10 .03 -.04
I take action to try and get rid of the problems caused by changes in the weather .60 .03 -.10 .02 .21 .01 .04 .12
I take direct action to get around the problems caused by these changes .60 .06 -.09 -.01 .02 .04 .09 .22
The problems caused by the changes in the weather cannot be solved -.05 .91 .07 .05 .00 .02 .05 .09
I think there is no solution to the problem of weather changes .14 .79 .01 .00 -.05 -.06 -.01 -.04
The changes in the weather are still increasing; these changes cannot be stopped anymore
-.14 .49 -.16 -.20 .08 .10 -.01 -.00
I make sure not to make matters worse by acting too soon .04 -.06 -.87 -.04 -.03 .03 -.02 -.00
I restrain myself from doing anything too quickly to address the problems caused by weather changes
.03 -.01 -.86 .06 -.08 .01 .03 .03
I hold off doing anything to address changes in the weather until the situation permits -.02 .04 -.68 -.01 .10 -.05 .03 -.02
I look for something good to come out of these changes .07 -.01 -.02 -.86 .05 -.12 .09 .01
I try to see these changes in a different light, to make them seem more positive .02 .05 -.00 -.83 -.01 .05 .02 .04
I try to learn something from the changes in the weather .04 .01 -.02 -.47 .04 .28 .06 .05
I become annoyed that nothing is done about it, even though everyone knows about .01 -.13 .02 -.04 .81 -.02 .03 .05
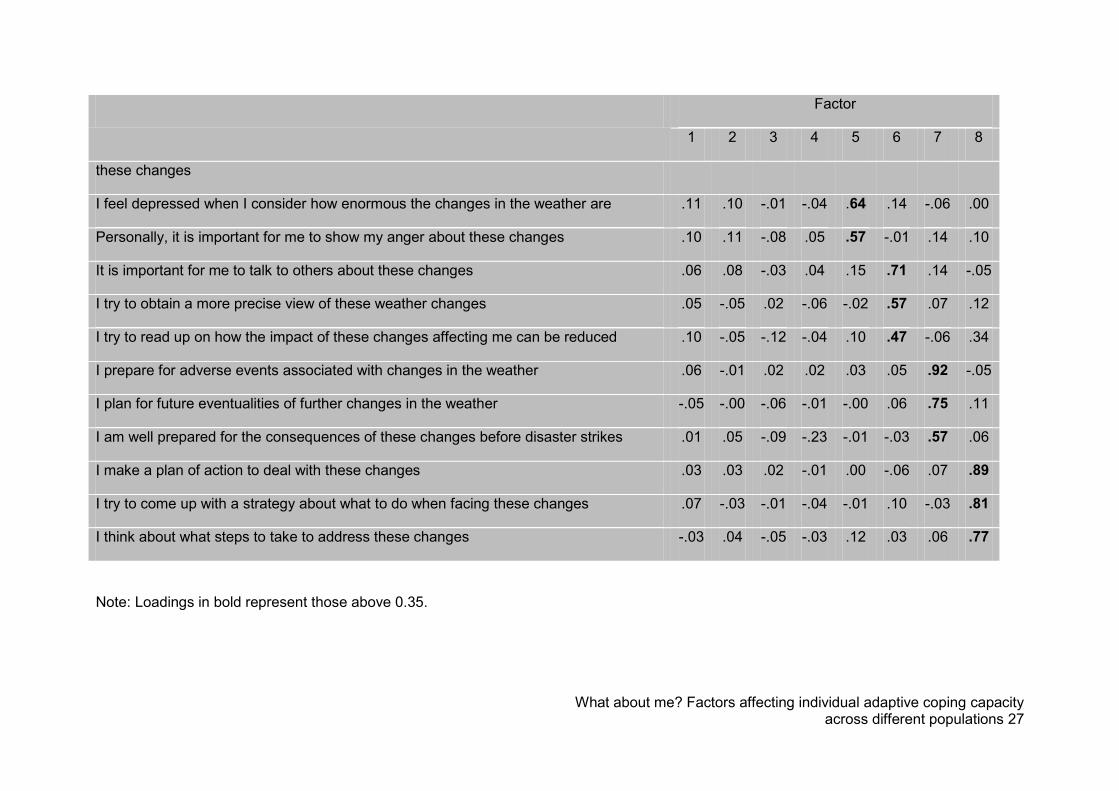
What about me? Factors affecting individual adaptive coping capacity across different populations 27
Factor
1 2 3 4 5 6 7 8
these changes
I feel depressed when I consider how enormous the changes in the weather are .11 .10 -.01 -.04 .64 .14 -.06 .00
Personally, it is important for me to show my anger about these changes .10 .11 -.08 .05 .57 -.01 .14 .10
It is important for me to talk to others about these changes .06 .08 -.03 .04 .15 .71 .14 -.05
I try to obtain a more precise view of these weather changes .05 -.05 .02 -.06 -.02 .57 .07 .12
I try to read up on how the impact of these changes affecting me can be reduced .10 -.05 -.12 -.04 .10 .47 -.06 .34
I prepare for adverse events associated with changes in the weather .06 -.01 .02 .02 .03 .05 .92 -.05
I plan for future eventualities of further changes in the weather -.05 -.00 -.06 -.01 -.00 .06 .75 .11
I am well prepared for the consequences of these changes before disaster strikes .01 .05 -.09 -.23 -.01 -.03 .57 .06
I make a plan of action to deal with these changes .03 .03 .02 -.01 .00 -.06 .07 .89
I try to come up with a strategy about what to do when facing these changes .07 -.03 -.01 -.04 -.01 .10 -.03 .81
I think about what steps to take to address these changes -.03 .04 -.05 -.03 .12 .03 .06 .77
Note: Loadings in bold represent those above 0.35.
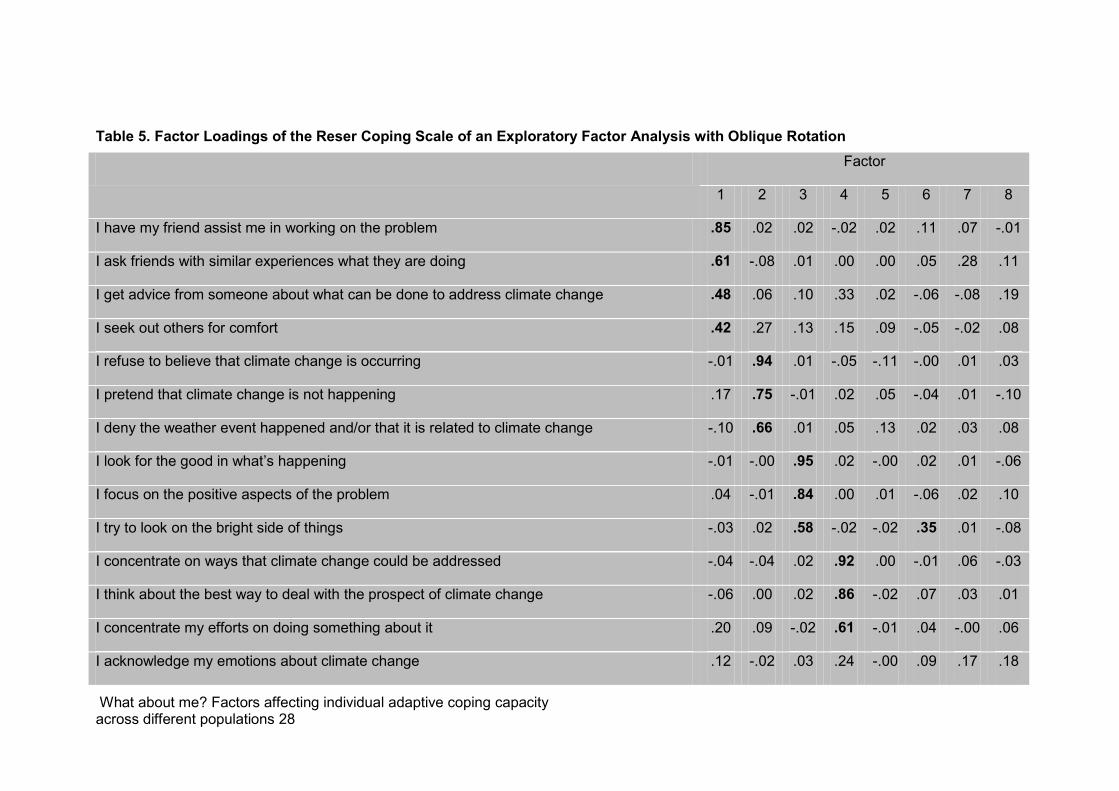
What about me? Factors affecting individual adaptive coping capacity across different populations 28
Table 5. Factor Loadings of the Reser Coping Scale of an Exploratory Factor Analysis with Oblique Rotation
Factor
1 2 3 4 5 6 7 8
I have my friend assist me in working on the problem .85 .02 .02 -.02 .02 .11 .07 -.01
I ask friends with similar experiences what they are doing .61 -.08 .01 .00 .00 .05 .28 .11
I get advice from someone about what can be done to address climate change .48 .06 .10 .33 .02 -.06 -.08 .19
I seek out others for comfort .42 .27 .13 .15 .09 -.05 -.02 .08
I refuse to believe that climate change is occurring -.01 .94 .01 -.05 -.11 -.00 .01 .03
I pretend that climate change is not happening .17 .75 -.01 .02 .05 -.04 .01 -.10
I deny the weather event happened and/or that it is related to climate change -.10 .66 .01 .05 .13 .02 .03 .08
I look for the good in what’s happening -.01 -.00 .95 .02 -.00 .02 .01 -.06
I focus on the positive aspects of the problem .04 -.01 .84 .00 .01 -.06 .02 .10
I try to look on the bright side of things -.03 .02 .58 -.02 -.02 .35 .01 -.08
I concentrate on ways that climate change could be addressed -.04 -.04 .02 .92 .00 -.01 .06 -.03
I think about the best way to deal with the prospect of climate change -.06 .00 .02 .86 -.02 .07 .03 .01
I concentrate my efforts on doing something about it .20 .09 -.02 .61 -.01 .04 -.00 .06
I acknowledge my emotions about climate change .12 -.02 .03 .24 -.00 .09 .17 .18
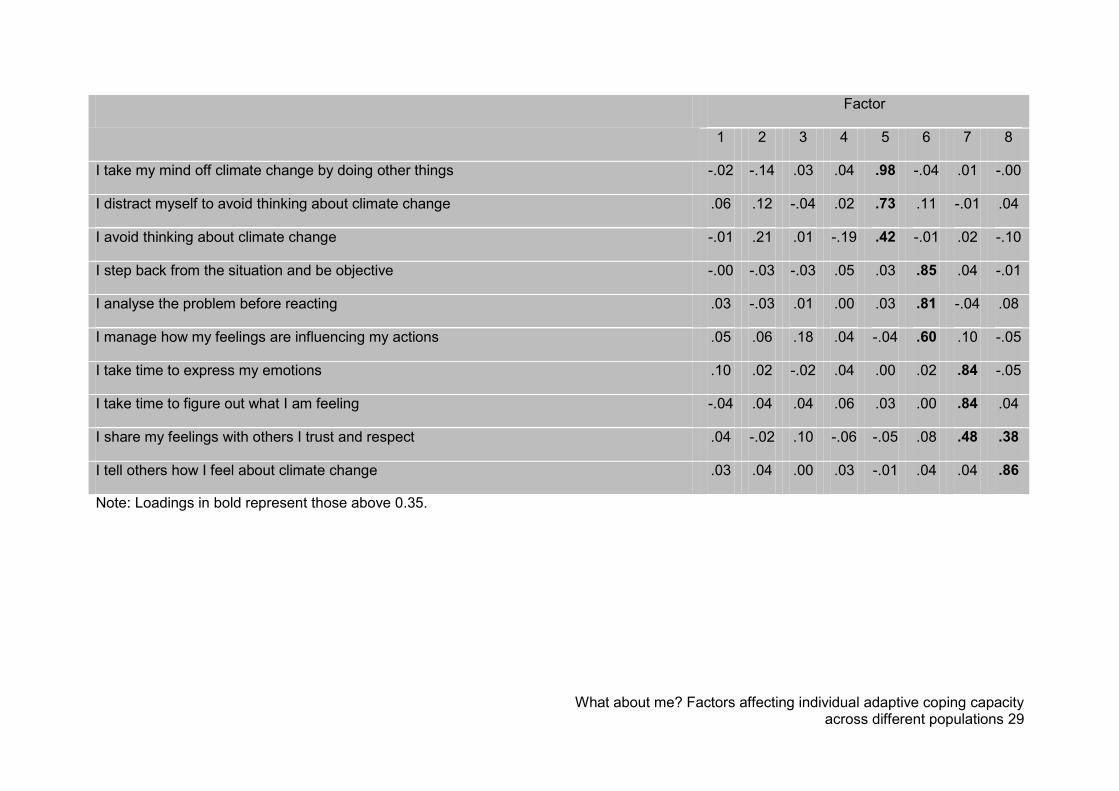
What about me? Factors affecting individual adaptive coping capacity across different populations 29
Factor
1 2 3 4 5 6 7 8
I take my mind off climate change by doing other things -.02 -.14 .03 .04 .98 -.04 .01 -.00
I distract myself to avoid thinking about climate change .06 .12 -.04 .02 .73 .11 -.01 .04
I avoid thinking about climate change -.01 .21 .01 -.19 .42 -.01 .02 -.10
I step back from the situation and be objective -.00 -.03 -.03 .05 .03 .85 .04 -.01
I analyse the problem before reacting .03 -.03 .01 .00 .03 .81 -.04 .08
I manage how my feelings are influencing my actions .05 .06 .18 .04 -.04 .60 .10 -.05
I take time to express my emotions .10 .02 -.02 .04 .00 .02 .84 -.05
I take time to figure out what I am feeling -.04 .04 .04 .06 .03 .00 .84 .04
I share my feelings with others I trust and respect .04 -.02 .10 -.06 -.05 .08 .48 .38
I tell others how I feel about climate change .03 .04 .00 .03 -.01 .04 .04 .86
Note: Loadings in bold represent those above 0.35.
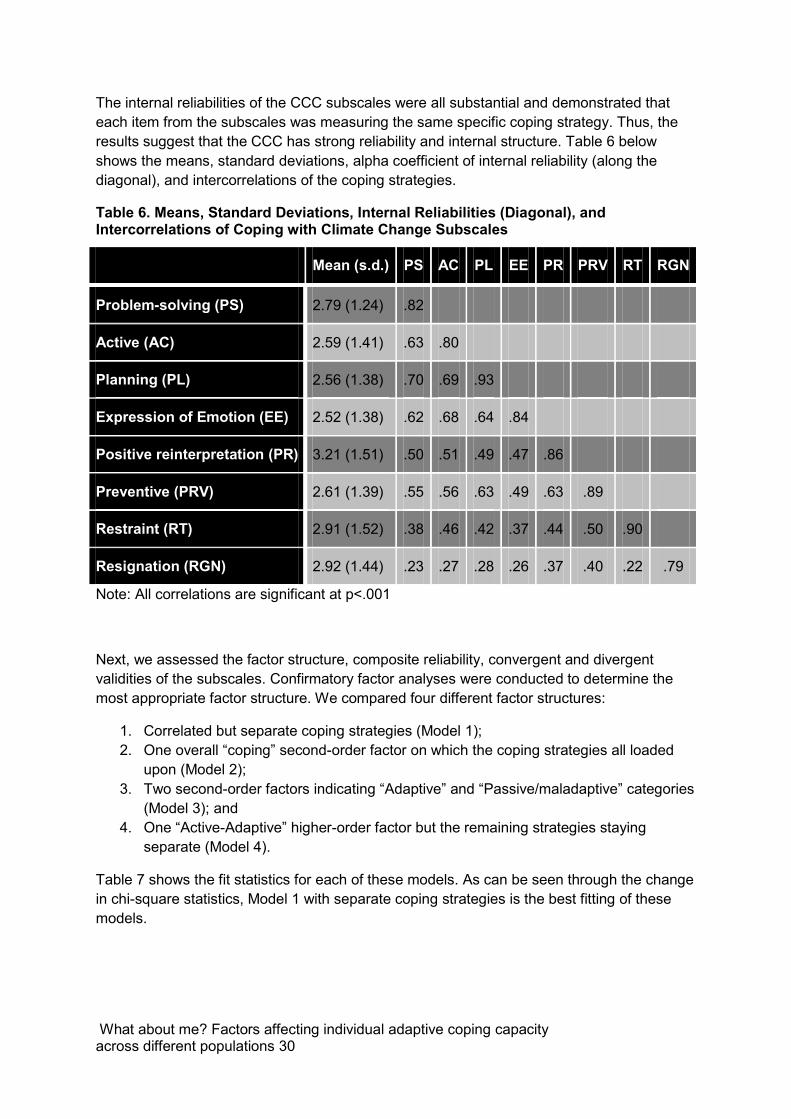
What about me? Factors affecting individual adaptive coping capacity across different populations 30
The internal reliabilities of the CCC subscales were all substantial and demonstrated that each item from the subscales was measuring the same specific coping strategy. Thus, the results suggest that the CCC has strong reliability and internal structure. Table 6 below shows the means, standard deviations, alpha coefficient of internal reliability (along the diagonal), and intercorrelations of the coping strategies.
Table 6. Means, Standard Deviations, Internal Reliabilities (Diagonal), and Intercorrelations of Coping with Climate Change Subscales
Mean (s.d.) PS AC PL EE PR PRV RT RGN
Problem-solving (PS) 2.79 (1.24) .82
Active (AC) 2.59 (1.41) .63 .80
Planning (PL) 2.56 (1.38) .70 .69 .93
Expression of Emotion (EE) 2.52 (1.38) .62 .68 .64 .84
Positive reinterpretation (PR) 3.21 (1.51) .50 .51 .49 .47 .86
Preventive (PRV) 2.61 (1.39) .55 .56 .63 .49 .63 .89
Restraint (RT) 2.91 (1.52) .38 .46 .42 .37 .44 .50 .90
Resignation (RGN) 2.92 (1.44) .23 .27 .28 .26 .37 .40 .22 .79
Note: All correlations are significant at p<.001
Next, we assessed the factor structure, composite reliability, convergent and divergent validities of the subscales. Confirmatory factor analyses were conducted to determine the most appropriate factor structure. We compared four different factor structures:
1. Correlated but separate coping strategies (Model 1); 2. One overall “coping” second-order factor on which the coping strategies all loaded
upon (Model 2); 3. Two second-order factors indicating “Adaptive” and “Passive/maladaptive” categories
(Model 3); and 4. One “Active-Adaptive” higher-order factor but the remaining strategies staying
separate (Model 4).
Table 7 shows the fit statistics for each of these models. As can be seen through the change in chi-square statistics, Model 1 with separate coping strategies is the best fitting of these models.
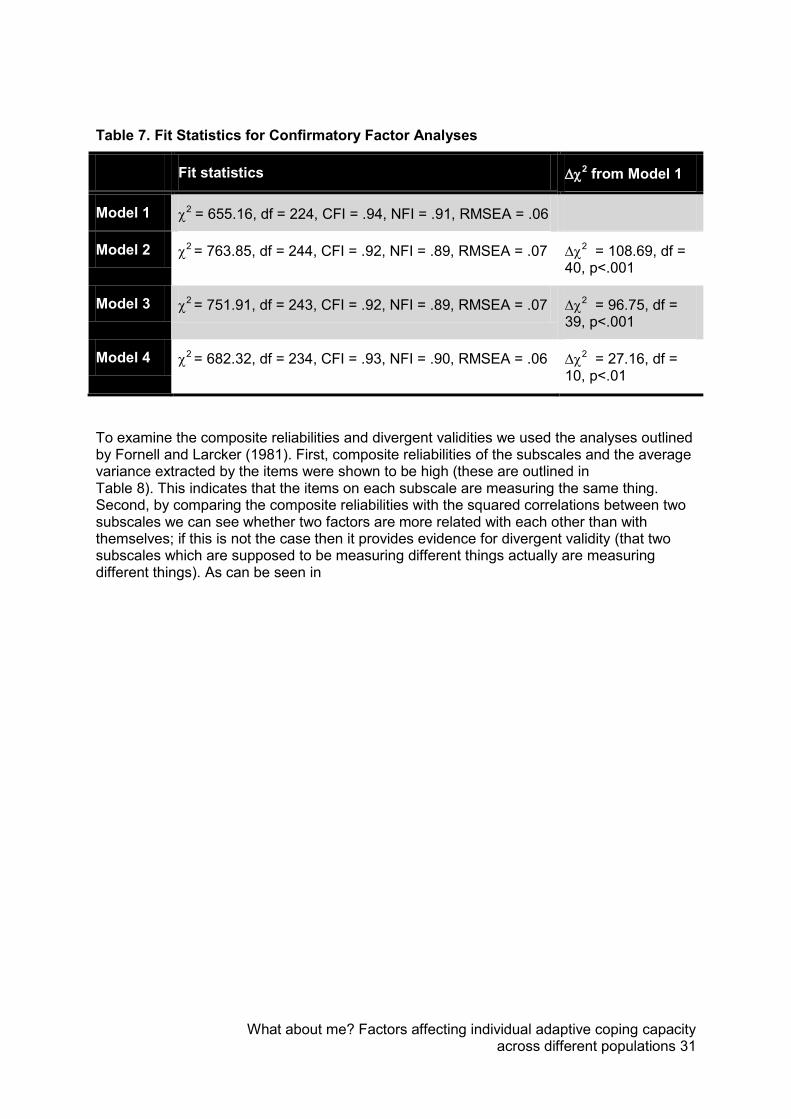
What about me? Factors affecting individual adaptive coping capacity across different populations 31
Table 7. Fit Statistics for Confirmatory Factor Analyses
Fit statistics 2 from Model 1
Model 1 2= 655.16, df = 224, CFI = .94, NFI = .91, RMSEA = .06
Model 2 2 = 763.85, df = 244, CFI = .92, NFI = .89, RMSEA = .07
2 = 108.69, df = 40, p<.001
Model 3 2 = 751.91, df = 243, CFI = .92, NFI = .89, RMSEA = .07
2 = 96.75, df = 39, p<.001
Model 4 2 = 682.32, df = 234, CFI = .93, NFI = .90, RMSEA = .06
2 = 27.16, df = 10, p<.01
To examine the composite reliabilities and divergent validities we used the analyses outlined by Fornell and Larcker (1981). First, composite reliabilities of the subscales and the average variance extracted by the items were shown to be high (these are outlined in Table 8). This indicates that the items on each subscale are measuring the same thing. Second, by comparing the composite reliabilities with the squared correlations between two subscales we can see whether two factors are more related with each other than with themselves; if this is not the case then it provides evidence for divergent validity (that two subscales which are supposed to be measuring different things actually are measuring different things). As can be seen in
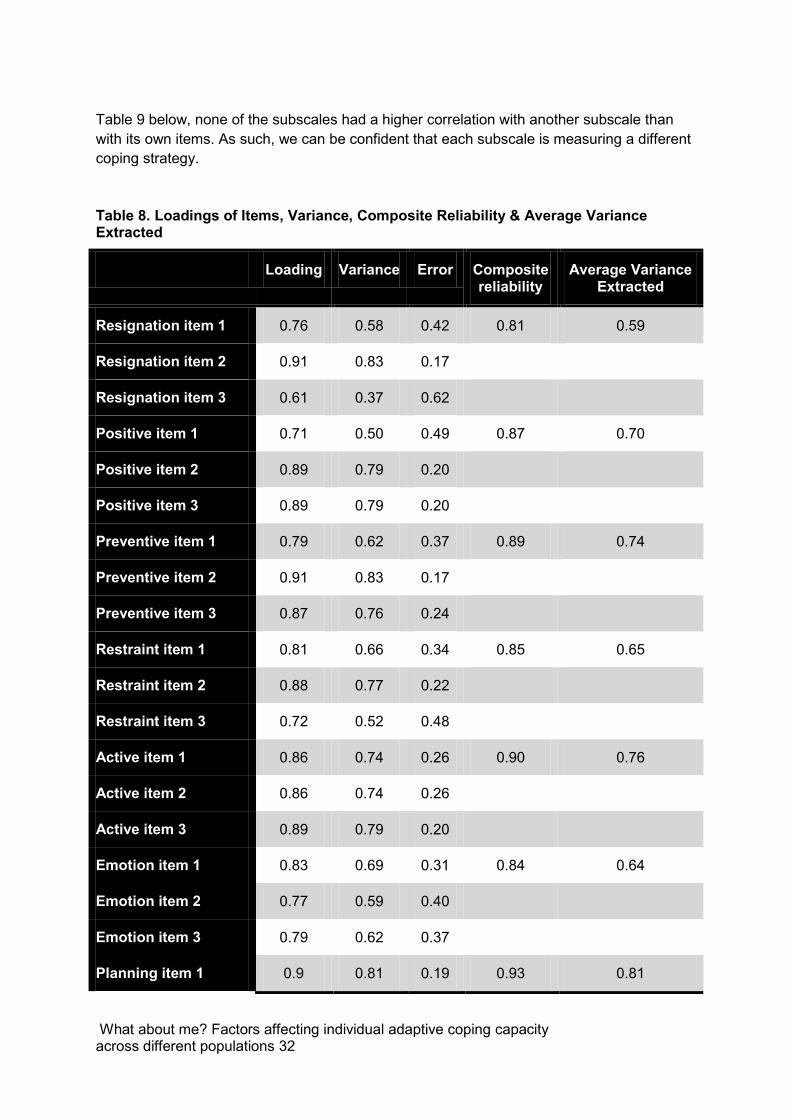
What about me? Factors affecting individual adaptive coping capacity across different populations 32
Table 9 below, none of the subscales had a higher correlation with another subscale than with its own items. As such, we can be confident that each subscale is measuring a different coping strategy.
Table 8. Loadings of Items, Variance, Composite Reliability & Average Variance Extracted
Loading Variance Error Composite reliability
Average Variance Extracted
Resignation item 1 0.76 0.58 0.42 0.81 0.59
Resignation item 2 0.91 0.83 0.17
Resignation item 3 0.61 0.37 0.62
Positive item 1 0.71 0.50 0.49 0.87 0.70
Positive item 2 0.89 0.79 0.20
Positive item 3 0.89 0.79 0.20
Preventive item 1 0.79 0.62 0.37 0.89 0.74
Preventive item 2 0.91 0.83 0.17
Preventive item 3 0.87 0.76 0.24
Restraint item 1 0.81 0.66 0.34 0.85 0.65
Restraint item 2 0.88 0.77 0.22
Restraint item 3 0.72 0.52 0.48
Active item 1 0.86 0.74 0.26 0.90 0.76
Active item 2 0.86 0.74 0.26
Active item 3 0.89 0.79 0.20
Emotion item 1 0.83 0.69 0.31 0.84 0.64
Emotion item 2 0.77 0.59 0.40
Emotion item 3 0.79 0.62 0.37
Planning item 1 0.9 0.81 0.19 0.93 0.81
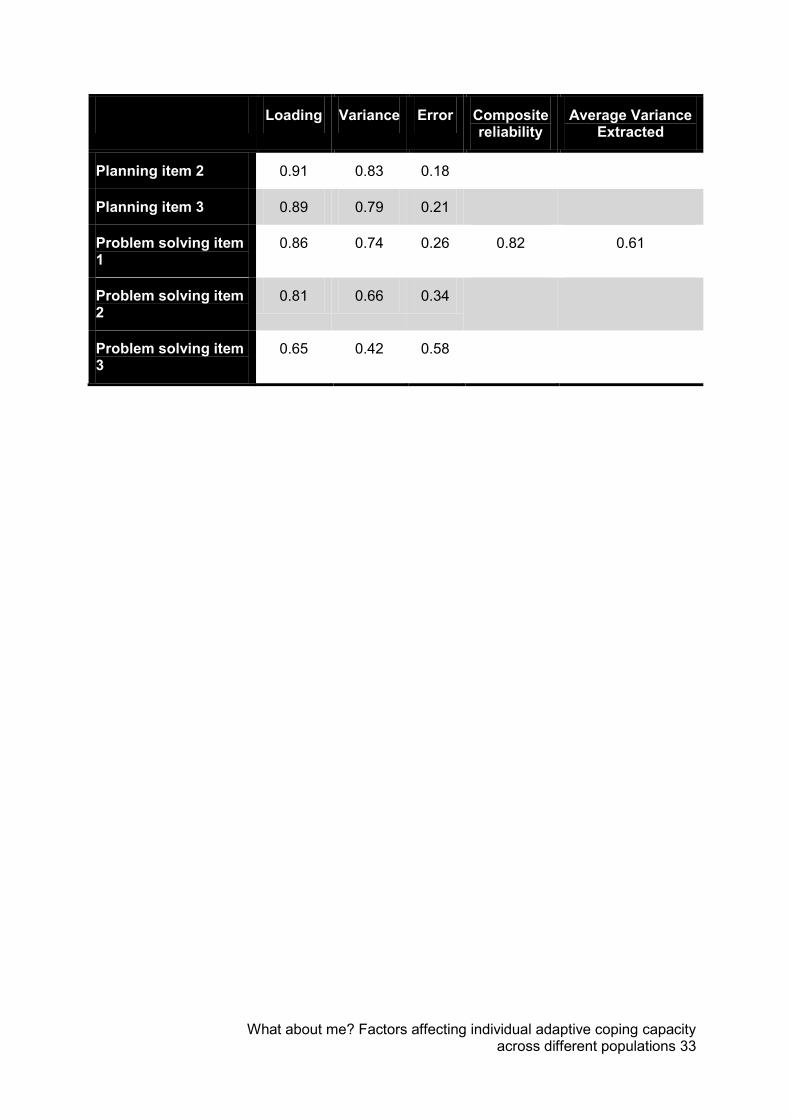
What about me? Factors affecting individual adaptive coping capacity across different populations 33
Loading Variance Error Composite reliability
Average Variance Extracted
Planning item 2 0.91 0.83 0.18
Planning item 3 0.89 0.79 0.21
Problem solving item 1
0.86 0.74 0.26 0.82 0.61
Problem solving item 2
0.81 0.66 0.34
Problem solving item 3
0.65 0.42 0.58
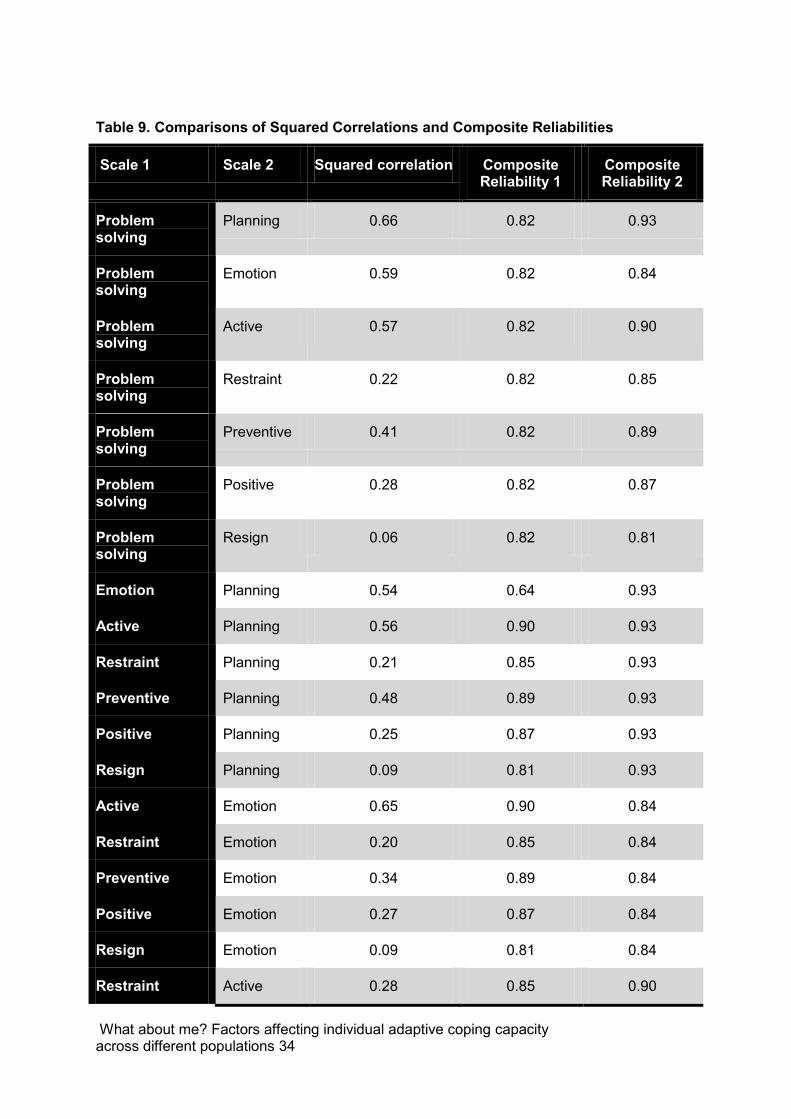
What about me? Factors affecting individual adaptive coping capacity across different populations 34
Table 9. Comparisons of Squared Correlations and Composite Reliabilities
Scale 1 Scale 2 Squared correlation Composite Reliability 1
Composite Reliability 2
Problem solving
Planning 0.66 0.82 0.93
Problem solving
Emotion 0.59 0.82 0.84
Problem solving
Active 0.57 0.82 0.90
Problem solving
Restraint 0.22 0.82 0.85
Problem solving
Preventive 0.41 0.82 0.89
Problem solving
Positive 0.28 0.82 0.87
Problem solving
Resign 0.06 0.82 0.81
Emotion Planning 0.54 0.64 0.93
Active Planning 0.56 0.90 0.93
Restraint Planning 0.21 0.85 0.93
Preventive Planning 0.48 0.89 0.93
Positive Planning 0.25 0.87 0.93
Resign Planning 0.09 0.81 0.93
Active Emotion 0.65 0.90 0.84
Restraint Emotion 0.20 0.85 0.84
Preventive Emotion 0.34 0.89 0.84
Positive Emotion 0.27 0.87 0.84
Resign Emotion 0.09 0.81 0.84
Restraint Active 0.28 0.85 0.90
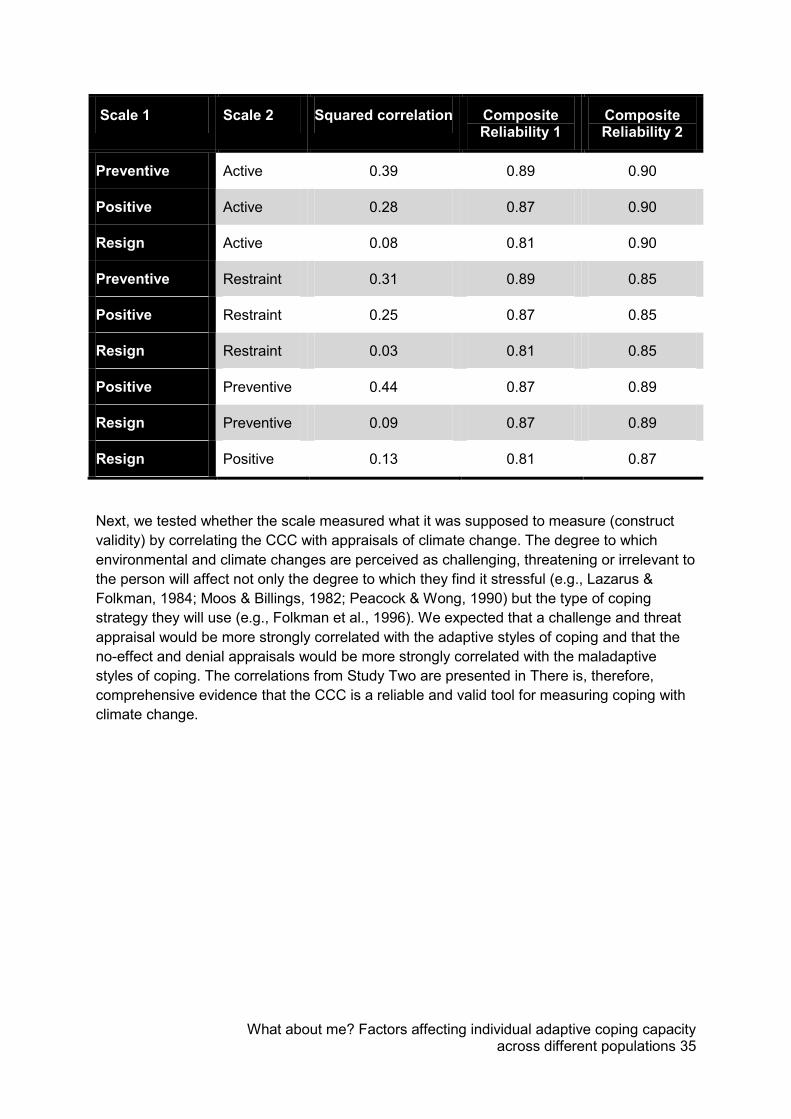
What about me? Factors affecting individual adaptive coping capacity across different populations 35
Scale 1 Scale 2 Squared correlation Composite Reliability 1
Composite Reliability 2
Preventive Active 0.39 0.89 0.90
Positive Active 0.28 0.87 0.90
Resign Active 0.08 0.81 0.90
Preventive Restraint 0.31 0.89 0.85
Positive Restraint 0.25 0.87 0.85
Resign Restraint 0.03 0.81 0.85
Positive Preventive 0.44 0.87 0.89
Resign Preventive 0.09 0.87 0.89
Resign Positive 0.13 0.81 0.87
Next, we tested whether the scale measured what it was supposed to measure (construct validity) by correlating the CCC with appraisals of climate change. The degree to which environmental and climate changes are perceived as challenging, threatening or irrelevant to the person will affect not only the degree to which they find it stressful (e.g., Lazarus & Folkman, 1984; Moos & Billings, 1982; Peacock & Wong, 1990) but the type of coping strategy they will use (e.g., Folkman et al., 1996). We expected that a challenge and threat appraisal would be more strongly correlated with the adaptive styles of coping and that the no-effect and denial appraisals would be more strongly correlated with the maladaptive styles of coping. The correlations from Study Two are presented in There is, therefore, comprehensive evidence that the CCC is a reliable and valid tool for measuring coping with climate change.
What about me? Factors affecting individual adaptive coping capacity across different populations 36
Table 10. As can be seen, our hypotheses were generally supported: active coping styles were generally associated with challenge and threat appraisals; maladaptive coping, and in particular resignation, were positively associated with no-effect and denial appraisals and negatively associated with challenge and threat appraisals.
There is, therefore, comprehensive evidence that the CCC is a reliable and valid tool for measuring coping with climate change.
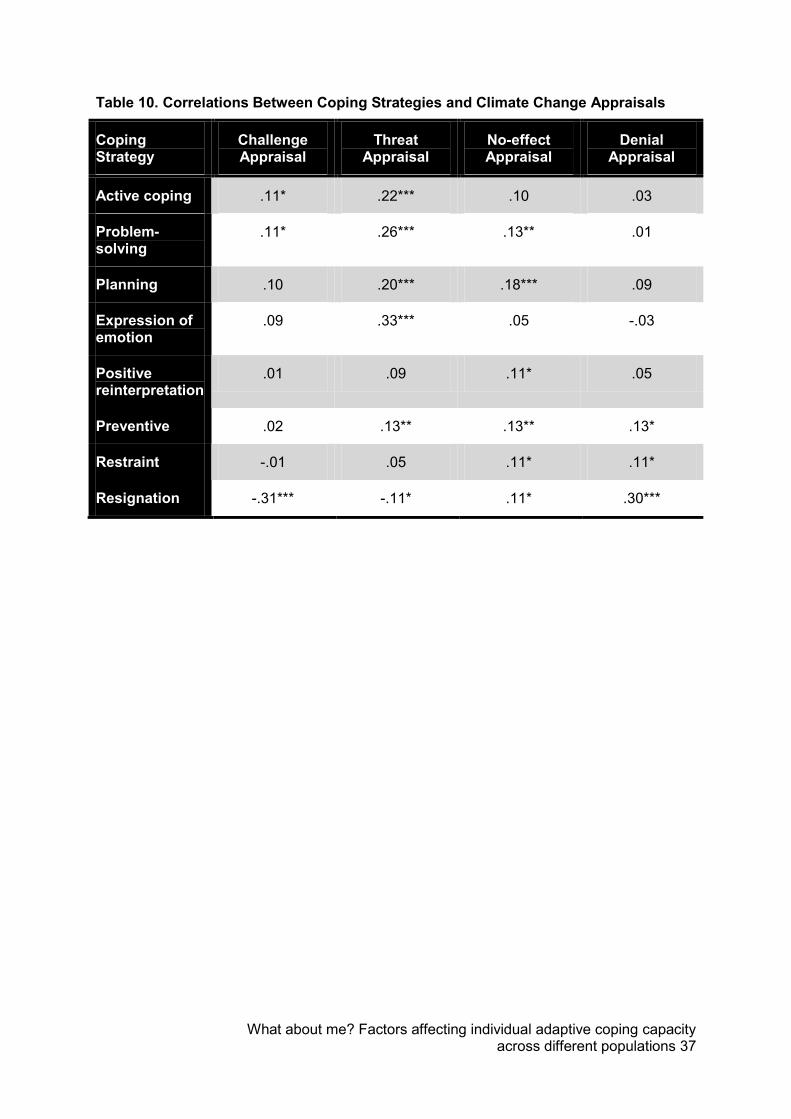
What about me? Factors affecting individual adaptive coping capacity across different populations 37
Table 10. Correlations Between Coping Strategies and Climate Change Appraisals
Coping Strategy
Challenge Appraisal
Threat Appraisal
No-effect Appraisal
Denial Appraisal
Active coping .11* .22*** .10 .03
Problem-solving
.11* .26*** .13** .01
Planning .10 .20*** .18*** .09
Expression of emotion
.09 .33*** .05 -.03
Positive reinterpretation
.01 .09 .11* .05
Preventive .02 .13** .13** .13*
Restraint -.01 .05 .11* .11*
Resignation -.31*** -.11* .11* .30***
What about me? Factors affecting individual adaptive coping capacity across different populations 38
3.3 Study One – How do the goals of agricultural workers affect their adaptive behaviour?
This study was led by the UWA Business School team, namely Jon Heath, Kerrie Unsworth and Illy McNeill. This study examined and explored the range and variety of goals and valued held by agricultural workers and regional community members affect their judgement and decision making processes.
It appears that for farmers, both conventional and sustainable/organic, the goals they believe are important and the conflict or congruence of their survival goals with adaptation goals have a strong effect on their behaviour. When adaptive behaviour is seen as helping or congruent with these goals (whether they be financial, environmental, publicity, or some other) they engage in adaptive behaviour. However, if the behaviour is seen as conflicting with or not seen as helpful to achieving the goal then the adaptive behaviour is less likely to be taken up. Farmers over time have shown an impressive ability to adapt to the changing weather patterns; however, through all of these factors, available financial capital plays a vital role in any decisions relating to the adoption of any new farming practices. This is one factor that appears to be holding many farmers back from their ability to adapt as more efficient and environmentally sustainable practices become known. For many, the desire is there, but sadly, the (financial) ability to act is not. .
3.3.1 Sample Face-to-face interviews were conducted with a range of farmers initially in Western Australia with further phone interviews taking place with farmers all across Australia. Both conventional and organic farmers were recruited for the study. These interviews were then transcribed for further analysis.
1) Panel discussion in Kojonup, WA: Ten farmers operating on a variety of mixed cropping and livestock farms. All farmers in the panel discussion were owner/operators of their respective farms and had no more than 10 employees.
2) Face-to-face and phone interviews: These were conducted over the space of 6 months with operators of 50 different farms all around Australia. Selection criteria and eligibility was fairly open with Interviewees during this period needed only be over 18 years of age and either managed or owned the farm, were currently working on a farm, or had recently retired from farming. Retirees were included as they provided an insight into why some farmers gave up working on their farm. The most challenging part of the sample was the fact very low percentage response rate from cold-calling farmers. For example, in Queensland the response rate for phone interviewing was only 1.5%.
3.3.2 Procedure
The procedure for all interviews followed a written guideline with interview questions to direct and start the conversation, but free-flowing discussion of farming methods and concerns was encouraged. Interviews ranged from 10-90 minutes with the average interview taking around 30-40 minutes. Specifically questions were asked about employment goals, values, farming
What about me? Factors affecting individual adaptive coping capacity across different populations 39
practices, weather patterns (e.g., rainfall, floods, drought, bushfires, etc.) and about farmers’ decisions and the drivers that lead them to switch into and engage in more environmentally sustainable farming, as well as what factors held them back from alternative farming practices.
3.3.3 Terminology What became apparent during the interview process was that it was at times difficult to classify farmers as ‘organic’, ‘sustainable’ or ‘conventional’ as most farmers operate on a spectrum regarding the number and extent of sustainable farming practices that they engage in. For the purposes of this report, we will use the two terms ‘organic’ and ‘conventional’. ‘Organic’ farmers refers to those who currently hold some form of organic farming certification from one of the various state or national agencies, as well as those who strongly identify with and follow, organic or sustainable farming practices. ‘Conventional’ farmers refer to all other farmers.
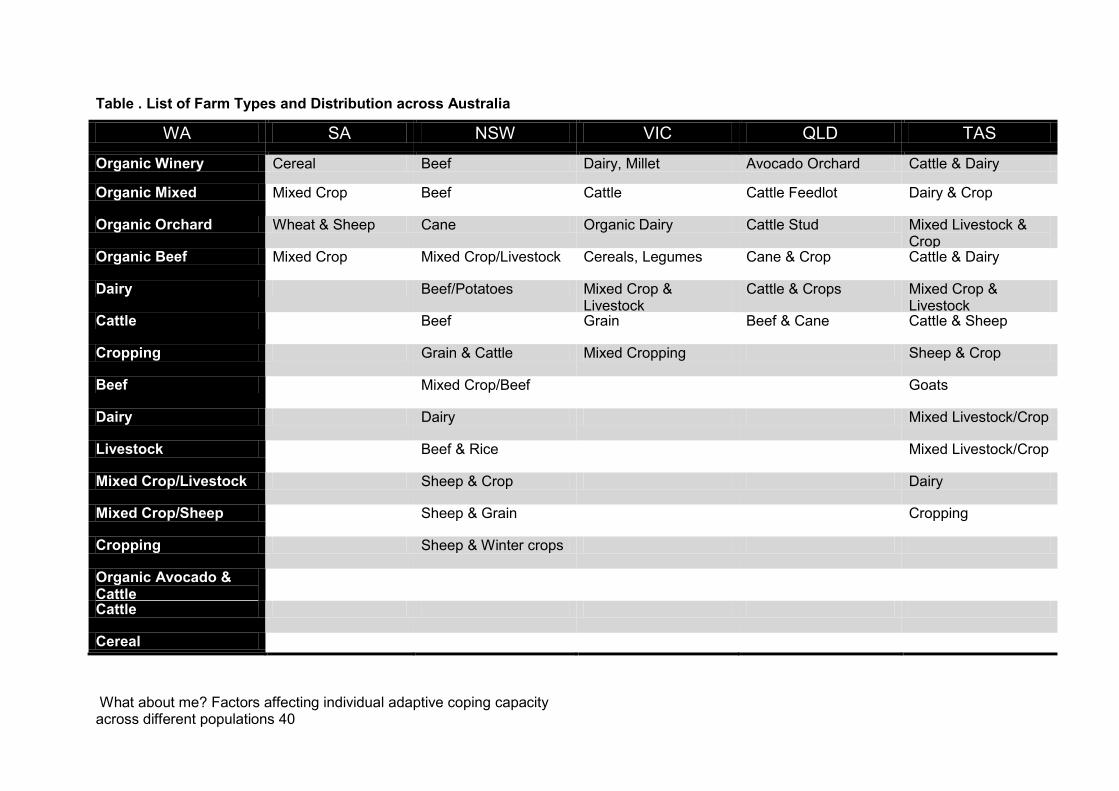
What about me? Factors affecting individual adaptive coping capacity across different populations 40
Table . List of Farm Types and Distribution across Australia
WA SA NSW VIC QLD TAS
Organic Winery Cereal Beef Dairy, Millet Avocado Orchard Cattle & Dairy
Organic Mixed Mixed Crop Beef Cattle Cattle Feedlot Dairy & Crop
Organic Orchard Wheat & Sheep Cane Organic Dairy Cattle Stud Mixed Livestock & Crop
Organic Beef Mixed Crop Mixed Crop/Livestock Cereals, Legumes Cane & Crop Cattle & Dairy
Dairy Beef/Potatoes Mixed Crop & Livestock
Cattle & Crops Mixed Crop & Livestock
Cattle Beef Grain Beef & Cane Cattle & Sheep
Cropping Grain & Cattle Mixed Cropping Sheep & Crop
Beef Mixed Crop/Beef Goats
Dairy Dairy Mixed Livestock/Crop
Livestock Beef & Rice Mixed Livestock/Crop
Mixed Crop/Livestock Sheep & Crop Dairy
Mixed Crop/Sheep Sheep & Grain Cropping
Cropping Sheep & Winter crops
Organic Avocado & Cattle
Cattle
Cereal
What about me? Factors affecting individual adaptive coping capacity across different populations 41
3.3.4 Why adapt to sustainable farming? Farmers were asked about their motivations for and engaging with or moving towards more sustainable farming practices. With either self-identified organic or certified organic farmers, this was closely tied in with their personal goals. These personal goals were of a more holistic view that integrated ideology of the environment, self and work such that these should occur in unison with each other, rather than operating as competing goals.
We didn’t intend to go organic from the beginning, but we firmly believe in the principles of permaculture and so we set the vineyard up with those principles – sustainability. So we didn’t plan to irrigate and so we put the vines in and for the first few years we gave them infrequent deep watering and after that they were on their own. They’re thriving on no irrigation whatsoever apart from whatever out of the sky. You have to have a long term vision to do that.
It’s just a matter of how you look at it and whether you want to work with [the land] or whether you want to beat it into submission to do what you want.
It’s a way of producing food without harming the environment… the environment benefits from organic farming, society benefits, environment benefits.
Understandably, this wasn’t always the case with all farmers. For some, the motivation to make the switch to more sustainable and environmentally sound farming came after years of working on the property.
So when we came here we were running the property in what you’d probably call a conventional manner, so – we weren’t set stock. We were shifting stock around a bit between paddocks, but we were using conventional fertilisers, drenches, etc., on the stock, whereas now we run in a biological organic system with holistic management and planned grazing.
However, sustainable farming is not always about the desire to fulfil pro-environmental goals and behaviours. Farmers operating in ‘conventional’ farming were more likely to make the shift to more sustainable practices after realising the financial benefits that also exist as a result reducing the ongoing and ever increasing costs associated with off farm inputs (e.g., fertilizers, pesticides, stock feed, etc.).
It was about becoming less reliant on inputs, because we found that our input costs were getting more and more every year and our returns weren’t necessarily rising, so, in my opinion, input costs are only going to continue to go up...
3.3.5 Concerns with Changing Weather Patterns (Climate Change) Amongst the farming community there is a lot of ongoing concern about the weather and the potential impact this would have on the continued existence of some farms. With many farms operating on a year-to-year and season-to-season mentality for survival of their company and livelihood, the impacts of climate change can be quite concerning.
If we have a couple of bad years with drought, my farm wouldn’t survive.
What about me? Factors affecting individual adaptive coping capacity across different populations 42
Just one season of lost income due to crop damage and I couldn’t afford to stay afloat.
This can lead to feelings of resignation which is a sign of a maladaptive coping response to the problems arising from climate change.
I’ve even asked myself the question, well, is it really worth investing all this time and energy for the long term, because where will we be in another 50 years’ time, if it keeps shifting as it is at the moment?
I don’t know what I can do. I’m almost resigned to not being able to do anything about it.
The problems with rainfall and weather are very noticeable amongst the farming community as this is something that is dealt with on an ongoing basis. Droughts, floods and bushfires are common concerns amongst farmers in Australia and they are very aware of the problems that they face.
We find that there’s a lot less rain now than there has been. So the first couple of years – I was very naïve, and I really thank God for sending lots of thunderstorms, because I wasn’t very knowledgeable about irrigation.
It’s a very poor soil that we have in Western Australia, the poorest in the world. Now one of the lowest rainfalls in the world, and yeah we have to really – we’re going to have to work very hard to produce food from here on in.
That’s certainly one thing we’ve found, is probably what’s impacted us most weather-wise is not necessarily the drop-off in the total rainfall, which is important, but the fact that the autumn breaks are either being you get a false break and it doesn’t keep raining, or they’re just really late. That’s probably had a bigger impact than actually the drop-off in the total rainfall.
Not only the local weather patterns, but global weather patterns and their impact on a global economy and commodity prices also factor in to daily concerns with the farmers we interviewed.
… Our commodity prices are up a lot at the moment due to the weather pattern that the US is going through. Their grain production is down a lot, so it’s forcing our prices up a lot.
What wasn’t discussed, especially by the majority of ‘conventional’ farmers that we interviewed is the link that these local and global weather patterns have with the effects and impact of climate change. The lack of belief in climate change, however, was largely related to the human influence on climate. As farmers, they are very aware of changing climate patterns but as was said:
The climate has always been changing, and it will always continue to change. We can’t control anything of that; just do what we do to survive.
That global warming stuff is just what the greenies say when they want us to do things differently.
What about me? Factors affecting individual adaptive coping capacity across different populations 43
Climate change, even if it’s true, isn’t something we can do anything about.
What was noticeable was, for ‘conventional’ farmers in our sample, it was more about adapting to the current (short-term) state of the climate rather than considering the long-term impacts and benefits. This could be due to what smaller farmers perceived to be about just surviving the next couple of seasons. Two of the key words that stood out when asking these same farmers words they would use to identify themselves (e.g., farmer, husband, provider etc.) were survivor and battler. This ongoing sense of struggle for survival leads to an increased focus on short-term goals and short-term outcomes. Some farmers are unwilling to invest in sustainable practices with long-term delayed benefits when they are unsure of their short-term survival and ability to provide for their family. Studies have shown that negative emotional states bias people toward short-term thinking – a repeatedly chosen preference for an immediate gain despite and overall cost to their long-term goals (which don’t necessarily have to be monetary) (Gray, 1999).
3.3.6 Adapting Practices to Changing Weather Belief in climate change aside, famers have shown the ability to adapt in a variety of ways to stressors and problems that arise on their farm relating to changes in weather. Reduction in rainfall is a common concern in many areas of Australia with large portions of the country undergoing periods of drought and in the past 10 years recording some of the lowest rainfall in recorded history. There are many ways of trying to adapt farming practices to deal with this reduction of rainfall, with some adaptive practices also mitigating against future rainfall and water concerns.
Mulching is also the best way we’ve got of holding water retention back in our paddocks.
Addition of compost into the soil will, over time, ongoingly [sic] improve the water holding capacity of the soil.
We put down the manure and lime and some rock minerals first, and then we put down cardboard, and then we put the woodchip and sawdust on top of that. Over the year, as we go, we’ll be throwing grass and leaves and whatnot onto it. The idea is twofold. One is to cut down on insect infestation. The other one is to conserve social moisture.
With reduced rainfall, you don’t squander your resource, which is your water supply. So whatever you have, you’ve got to make it last. Now, what my plan is, if you need to conserve the soil by reducing evaporation, once it’s been put out under the trees.
One farmer, when confronted with the realization that there could be an issue with continued reduction in rainfall in a certain region even decided to move to an area where the continuing effects of climate change would not be as severe – adaptation through relocation.
We were on a property... and we were looking for a cattle property in the medium to high rainfall zone. Prices at the time meant we couldn’t get the acreage that we wanted in the higher rainfall area, so we looked more towards the fringe of the
What about me? Factors affecting individual adaptive coping capacity across different populations 44
higher rainfall area. So, yeah, Boyup Brook, from that point of view, was attractive at that point.
3.3.7 Promoting Sustainable Farming and Becoming ‘Organic’
The decision to receive organic certification faced a number of obstacles from farmers. The process can be very time consuming, and smaller farms with a local consumer base appear to have a tendency (where possible) to opt for openness and transparency with regards to farming practices so as to reduce the need to pass these costs on to the consumer.
Well that’s why here we have people come and sit on the veranda, have a cup of coffee in the farm, stay and see what we do, you know? They’re part of the growing process. They see how we rotate, graze cattle and move cattle every 48 hours and what goes on because the credibility is in coming here and seeing it growing yourself, not in some bogus you know airy fairy organic statement that means nothing.
For larger operations and when claims of sustainability cannot be so obviously displayed, that is when the consumer appears to push for the organic certification.
So people were coming in for that particularly and then we found ourselves saying to people, “there are no preservatives in this”, but we had no proof… It was actually consumer driven that we got certified organic. Because we had a vineyard that we use the same stable practices in that, we turned the weeds in, we used minimal interventions or inputs, the side effect was we were growing organic fruit.
However, there were negative perceptions of organic industry and the obstacles that needed to be overcome; such as the continuing cost of being registered and audited, which organic certification should be sought, and how the public views organic certifications.
We won’t go organic because organic has no meaning or it has no holding within the community. Organic’s just been bastardised and there’s seven different standards of organics or something within New South Wales and no one has any faith to a quality in it as it did once years ago.
So I thought we should go certified organic and [my husband] was like, he’d rather stick a needle in his eyes because of the – he felt that you had to jump through flaming hoops and it would be hard.
3.3.8 Differences between Organic and Conventional Farmers’ Goals During the panel interviews, it became quite apparent amongst the ‘conventional’ farmers that the line between sustainable farmers and ‘conventional’ farmers was not always clear-cut. As new farming methods are tested and news of the benefits spreads, a lot of these methods are adopted by all farmers. Sustainable practices such as crop rotation are readily used by all farmers and some water saving practices are thought of as common sense farming, rather than sustainable farming or being environmentally friendly.
I don’t think of it as being environmentally friendly or more sustainable, it’s just a method of farming that I know works well so I’m going to do it.
What about me? Factors affecting individual adaptive coping capacity across different populations 45
The main differences that have become apparent, also tie in closely with individuals’ goals and motivations for choosing one particular farming method over another. ‘Conventional’ farmers’ motivation for engaging in more environmentally sustainable farming and pro-environmental behaviour was much more likely when a financial benefit could also be easily recognised. As mentioned earlier with regards to reducing the input associated costs
It was about becoming less reliant on inputs, because we found that our input costs were getting more and more every year...
This even extended to some of the sustainable educational programs being offered at a state/national level.
I did that course because I knew at the end of it the government was going to give me the money to buy a new water tower for the farm.
The general view of organic or sustainable farmers was that the two main goals – financial and environmental – were linked to a higher-order value of sustainability. This meant that these goals were congruous, working in harmony to achieve the desired outcome. The majority of these farms operated on a principle and philosophy of sustainability and minimizing the destructive impact on the environment and maximise the health aspects of organic farming
We do this because this is the right thing for people’s health and it’s been reflected in our product so that’s where our niche in the market is just purely grass fed with no – grain has chemicals and all sort of things put on it to stop it rotting in silos and things and that actually affects people and health as we’ve seen in our own kids. .
We firmly believe in the principles of permaculture and so we set the vineyard up with those principles – sustainability.
3.3.9 Factors Influencing the Ability to Adapt
One of the biggest problems that a lot of farmers are facing isn’t necessarily a failure in desire to adapt and try a different way of farming, but rather the inability to put these desires into action. The financial risk involved in taking a chance that might not pay off, as well as not being financially secure enough to wait for the longer-term return. As mentioned earlier some farms would go under with only one more bad year/season.
It's [environmental sustainability] extremely important to all of us but it has to be financially sustainable for farmers to embrace it fully.
You can do things without spending a lot of money to try things in some ways but some things you've got to spend money and commit a bit of time to do it and you can do that when you're a little bit more cashed up than other times, that's right.
Some people are doing a mulching as a way of conserving moisture and improving their soil health. But yeah, we haven't been able to afford machinery to do that, so we're not doing it.
The other factor is some farmers clearly and understandably prioritise people/jobs over the environment – not surprisingly, when it comes to a decision about keeping a farm afloat or
What about me? Factors affecting individual adaptive coping capacity across different populations 46
caring for the long-term health of the environment, it is in this context that they can be seen to be viewed as two separate goals in competition.
The environment - it's all very well the environment, but people are more important really. You can't - if you're not going to have any farmers looking after the land, who's going to look after it, the government? They can't run out of light in the dark night, like they're just hopeless.
The long-term viability of farming in general is an issue that many farmers are quite aware of and the problems associated with an ageing workforce. Many farmers are over 50 with no-one interested in carrying on the family farm and with their own thoughts moving torwards retirement. This quote below aptly sums up the view of a vast number of primary producers
I think the biggest threat in this area, is the lack of viability of farming. Just about every farm that is in my area is owned and run by a person of my age. So at some stage in the next 10 years, there will be a big stack of farms sitting here with nobody to run them because just about all the children of the farmers that are here, have left and either gone to the city or gone to the mines.
I think the average age of dairy farmers now is about 60 and there’s no sons stopping home because you know, they just don’t want to be - their pay’s three feeds a day and a bed, you know. You can go north and earn $200,000 to $300,000 a year driving a truck or something.
3.3.10 Strengths, Limitations and Summary of Findings from Study One
This study focused on one group of Australians, namely farmers. We used an inductive, qualitative approach as we would have been unable to obtain a large enough sample size for statistical analyses. Furthermore, we wanted to explore these issues in detail and gather rich data that are able to include the complexity of adaptation for farmers. Of course, results from interviews may be subject to bias from those interpreting and analysing the results. We therefore conducted reliability analyses and had three different people coding the data to reduce such biases. In summary, our findings show that:
For farmers, both conventional and sustainable/organic, the goals they believe are important and the conflict or congruence of their survival goals with adaptation goals have a strong effect on their behaviour.
When adaptive behaviour is seen as helping or congruent with these goals (whether they be financial, environmental, publicity, or some other) they engage in adaptive behaviour. However, if the behaviour is seen as conflicting with or not seen as helpful to achieving the goal then the adaptive behaviour is less likely to be taken up.
Farmers over time have shown an impressive ability to adapt to the changing weather patterns; however, through all of these factors, available financial capital plays a vital role in any decisions relating to the adoption of any new farming practices.

What about me? Factors affecting individual adaptive coping capacity across different populations 47
3.4 Study Two: How are goals and goal structures related to adaptive behaviour?
This study was led by the team at the UWA Business School, namely Kerrie Unsworth, Jon Heath and Illy McNeill. The study was designed to cover a number of aims:
1. Provide an initial assessment of the CCC tool. 2. Examine the effect of goals (ranging from long-term goals such as identities and
values to short-term, day-to-day goals) on coping and adaptive behaviour. 3. Examine the effect of goal connectedness on adaptive behaviour. By goal
connectedness, we mean the degree to which a specific goal helps to achieve a person’s other goals – for example, whether a person perceives that reducing his or her carbon footprint helps them to achieve their other important goals of being a good friend, being healthy and being a good citizen.
4. Determine the degree to which goal connectedness can be changed through making the environmental goals salient.
This study showed that a person does not have to be a “greenie” to engage in adaptive behaviours. Instead, what matters is that the behaviour helps them to achieve their goals, whether they are environmental goals or other more hedonistic or individualistic goals. The study also provides evidence for the usefulness of the coping tool and shows how adaptive coping leads to adaptive behaviours.
3.4.1 Sample Four hundred and ninety-one students participated in the experimental survey, with complete
responses from 400 students. The students were first and second-year undergraduates who were enrolled in the Organisational Behaviour unit at UWA. They were predominantly from the Bachelor of Commerce, however a number of Engineering, Law, and Arts students were also enrolled in that unit.
3.4.2 Experimental Design The study had three conditions. The first was a control condition which simply presented the questions without any additional information. Thirty-five percent of participants were randomly assigned to this condition. The second was the “salience” condition. In this condition, the participants were made aware that we were particularly interested in how their green goals related to their other goals – 36% of participants were randomly assigned to this condition. The third condition was a “creation” condition. In this condition, we encouraged participants to identify how their environmental tasks (e.g., re-using their water bottle, using public transport) could help them achieve a wide range of their other goals. Twenty-nine percent of participants were randomly assigned to this condition.
What about me? Factors affecting individual adaptive coping capacity across different populations 48
3.4.3 Measures In this study, we measured:
1. Individual’s personal goal structure o We developed four different levels of goals: values, identities, long-term
project goals, and day-to-day task goals. For each of these levels of goals, participants were asked to choose between 2 and 7 (from a large list of potential goals) that were relevant to them and to rank them in terms of their importance to that particular individual. The rankings provided a measure of the goal importance.
The list of potential values came from a validated scale (Schwartz, 1992, 1994) and included: Helpful, honest, forgiving; Daring, a varied life, an exciting life; Pleasure, enjoying life, self-indulgent; Creativity, curious, freedom; Equality, world at peace, social justice; Successful, capable, ambitious; Clean, national & family security, social order; Social power, authority, wealth; Politeness, honouring parents & elders, obedient; Devout, accepting portion in life, humble; Protecting the environment
The list of potential identities has been built up over the last few years conducting studies with students. The possible identities that participants could choose from included: Student; Friend; Athlete; Healthy person; Shy person; Daughter or son; Artist; Leader; High achiever; Church or religious group member; Employee; Member of a field or discipline (e.g., engineer, accountant); Member of a University Club; Partner (boyfriend/girlfriend); Politically-aware person; Party animal; Good citizen; Environmentally-friendly person; Professional; Popular; Community or community group member; Trend-setter.
Similarly, the list of potential project goals had also been built over the last few years. The possible choices for this sample were: Getting good grades; Working on assignments; Volunteering; Reading; Learning about things outside of university; Earning money; Be involved in extracurricular activities; Be involved in sporting activities; Art; Friends; Becoming a professional; Passing my units; Look after my family; Lead a group or team; Look after the environment; Organise club or group activities; Compete in activities.
Finally, the list of day-to-day tasks for this sample included: University work at uni; Family commitments; Social commitments; Working on assignments; Sporting commitments; Studying; Chores; Work; Environmental behaviours (e.g., refilling water bottles, being energy efficient); Community or club commitments; Preparation for university units.
o The goals that were chosen by the participant then populated the next page. They were placed on the page such that the values were at the top and the day-to-day tasks were on the bottom. Participants were asked to draw lines between the goals to indicate whether the lower-order goal helped (or was detrimental to) the higher-order goal. Participants could choose: strongly helpful, helpful, unrelated, detrimental, very detrimental.
What about me? Factors affecting individual adaptive coping capacity across different populations 49
2. Climate change appraisal
o Participants were asked to rate the extent to which the following statements were true of them (on a 5-point scale from “Not at all” to “A great deal”)
Climate change is a challenge that can be overcome Climate change is a threat to me and my way of life Climate change will not affect me or my loved ones I do not believe in climate change
o To try to avoid participants in the control condition realising that the study was about adaptation to climate change, we included two other sets of appraisal questions: Employment appraisal (getting a job after university); and Grades appraisal (getting good grades).
3. Climate change coping (CCC)
o Participants were asked, “You might have noticed that Perth has been experiencing reduced rainfall and increased temperatures. We would like to know how you have been dealing with these changes in the weather.” We then asked 24 questions to be answered on a 7-point scale designed to assess eight coping strategies:
Direct action Planning Problem-solving and information-seeking Preventive coping Expression of emotion Positive reinterpretation and growth Restraint Resignation
4. Reser’s climate change coping
o We included Reser’s climate change coping scale to assess the CCC tool. Reser’s scale asks, “The following questions are concerned with your reaction and response to climate change. Please indicate the extent to which you agree with the following statements.” There were eight coping strategies measured by this scale:
Active coping Avoidance Denial Emotional support Emotional venting Instrumental support Positive thinking Rational thinking
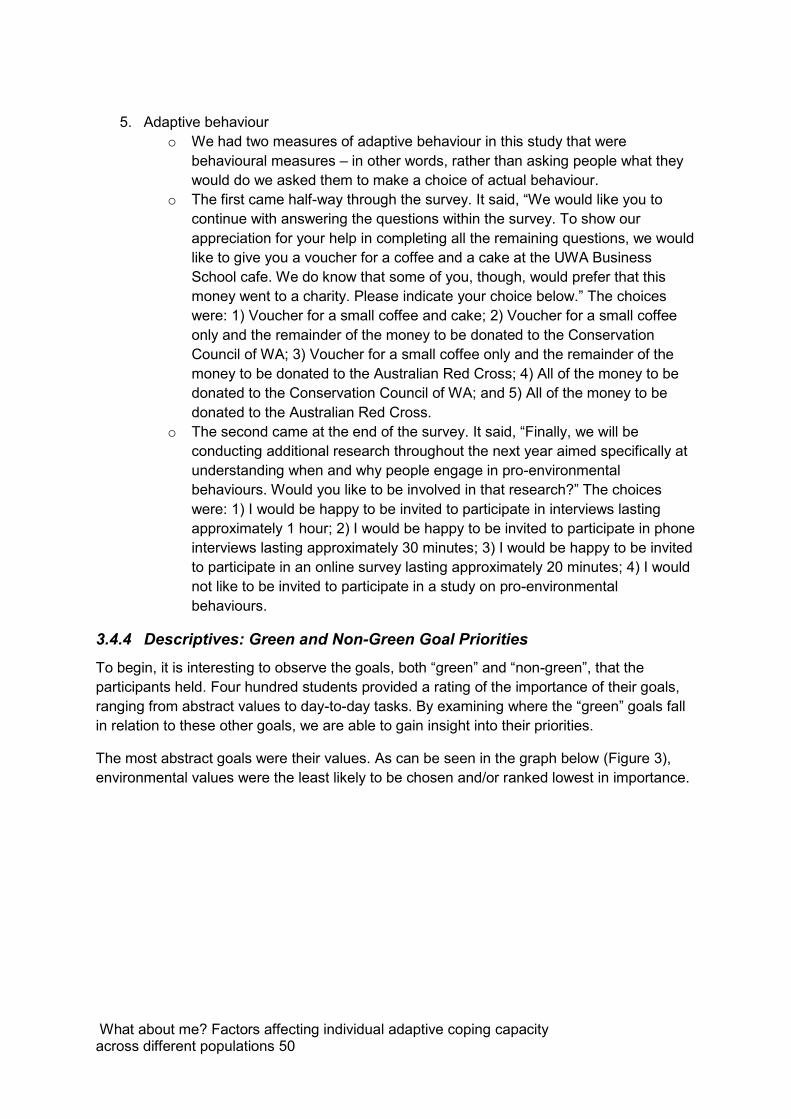
What about me? Factors affecting individual adaptive coping capacity across different populations 50
5. Adaptive behaviour
o We had two measures of adaptive behaviour in this study that were behavioural measures – in other words, rather than asking people what they would do we asked them to make a choice of actual behaviour.
o The first came half-way through the survey. It said, “We would like you to continue with answering the questions within the survey. To show our appreciation for your help in completing all the remaining questions, we would like to give you a voucher for a coffee and a cake at the UWA Business School cafe. We do know that some of you, though, would prefer that this money went to a charity. Please indicate your choice below.” The choices were: 1) Voucher for a small coffee and cake; 2) Voucher for a small coffee only and the remainder of the money to be donated to the Conservation Council of WA; 3) Voucher for a small coffee only and the remainder of the money to be donated to the Australian Red Cross; 4) All of the money to be donated to the Conservation Council of WA; and 5) All of the money to be donated to the Australian Red Cross.
o The second came at the end of the survey. It said, “Finally, we will be conducting additional research throughout the next year aimed specifically at understanding when and why people engage in pro-environmental behaviours. Would you like to be involved in that research?” The choices were: 1) I would be happy to be invited to participate in interviews lasting approximately 1 hour; 2) I would be happy to be invited to participate in phone interviews lasting approximately 30 minutes; 3) I would be happy to be invited to participate in an online survey lasting approximately 20 minutes; 4) I would not like to be invited to participate in a study on pro-environmental behaviours.
3.4.4 Descriptives: Green and Non-Green Goal Priorities
To begin, it is interesting to observe the goals, both “green” and “non-green”, that the participants held. Four hundred students provided a rating of the importance of their goals, ranging from abstract values to day-to-day tasks. By examining where the “green” goals fall in relation to these other goals, we are able to gain insight into their priorities.
The most abstract goals were their values. As can be seen in the graph below (Figure 3), environmental values were the least likely to be chosen and/or ranked lowest in importance.
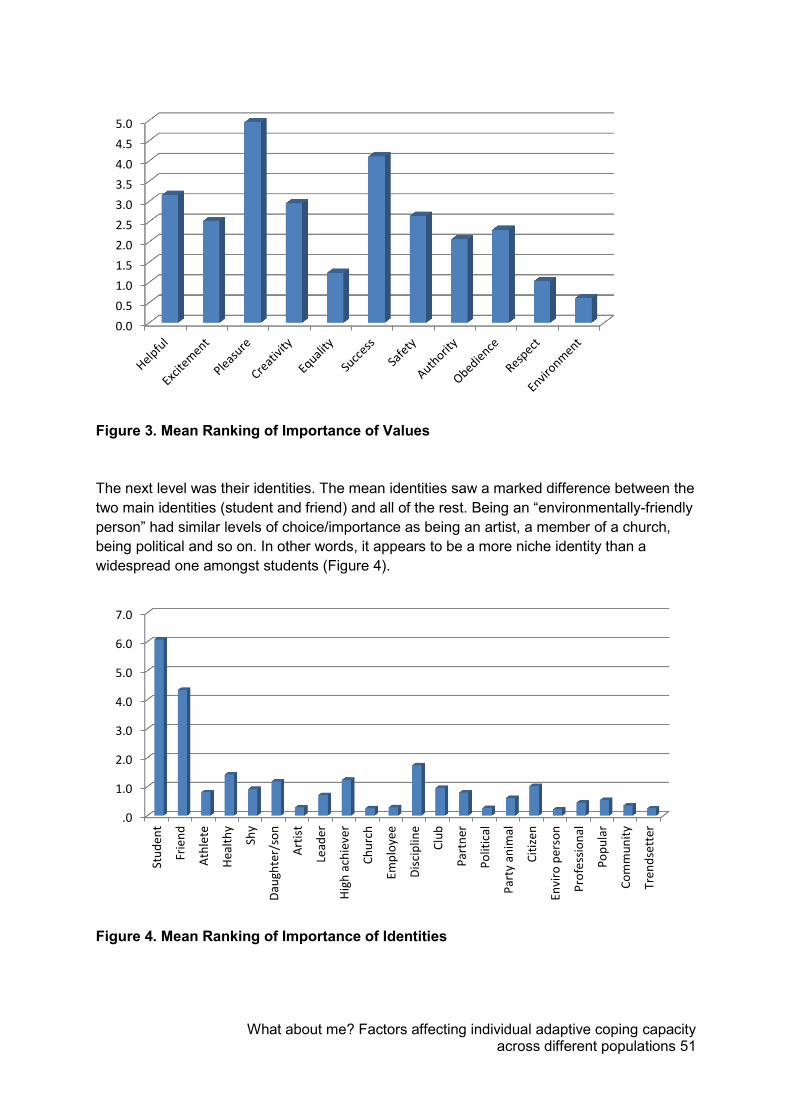
What about me? Factors affecting individual adaptive coping capacity across different populations 51
Figure 3. Mean Ranking of Importance of Values
The next level was their identities. The mean identities saw a marked difference between the two main identities (student and friend) and all of the rest. Being an “environmentally-friendly person” had similar levels of choice/importance as being an artist, a member of a church, being political and so on. In other words, it appears to be a more niche identity than a widespread one amongst students (Figure 4).
Figure 4. Mean Ranking of Importance of Identities
0.0
0.5
1.0
1.5
2.0
2.5
3.0
3.5
4.0
4.5
5.0
.0
1.0
2.0
3.0
4.0
5.0
6.0
7.0
Stu
den
t
Frie
nd
Ath
lete
Hea
lth
y
Shy
Dau
ghte
r/so
n
Art
ist
Lead
er
Hig
h a
chie
ver
Ch
urc
h
Emp
loye
e
Dis
cip
line
Clu
b
Par
tner
Po
litic
al
Par
ty a
nim
al
Cit
izen
Envi
ro p
erso
n
Pro
fess
ion
al
Po
pu
lar
Co
mm
un
ity
Tren
dse
tter
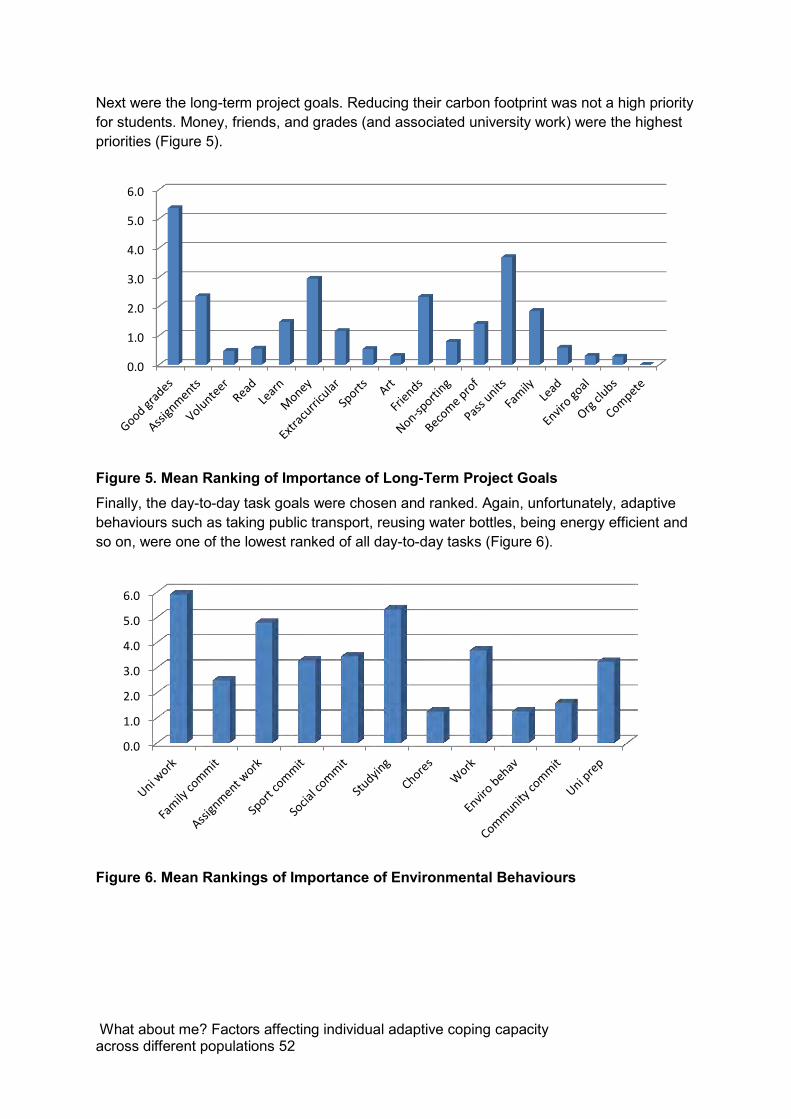
What about me? Factors affecting individual adaptive coping capacity across different populations 52
Next were the long-term project goals. Reducing their carbon footprint was not a high priority for students. Money, friends, and grades (and associated university work) were the highest priorities (Figure 5).
Figure 5. Mean Ranking of Importance of Long-Term Project Goals
Finally, the day-to-day task goals were chosen and ranked. Again, unfortunately, adaptive behaviours such as taking public transport, reusing water bottles, being energy efficient and so on, were one of the lowest ranked of all day-to-day tasks (Figure 6).
Figure 6. Mean Rankings of Importance of Environmental Behaviours
0.0
1.0
2.0
3.0
4.0
5.0
6.0
0.0
1.0
2.0
3.0
4.0
5.0
6.0
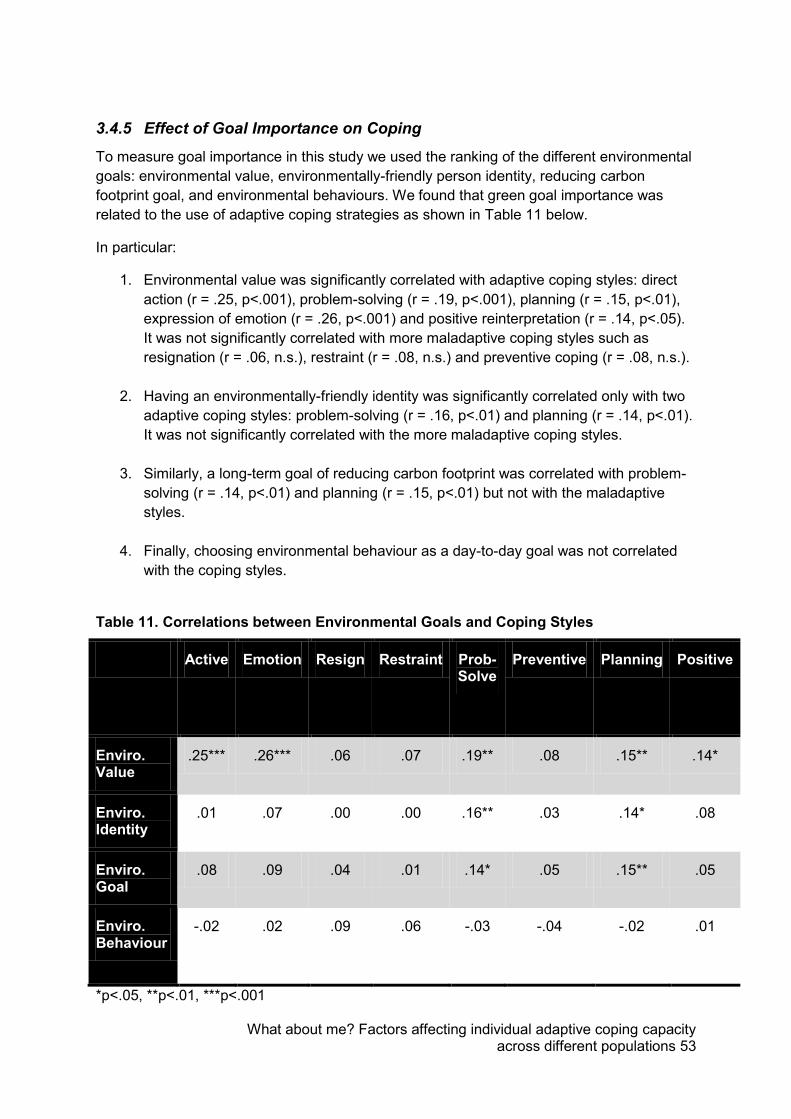
What about me? Factors affecting individual adaptive coping capacity across different populations 53
3.4.5 Effect of Goal Importance on Coping
To measure goal importance in this study we used the ranking of the different environmental goals: environmental value, environmentally-friendly person identity, reducing carbon footprint goal, and environmental behaviours. We found that green goal importance was related to the use of adaptive coping strategies as shown in Table 11 below.
In particular:
1. Environmental value was significantly correlated with adaptive coping styles: direct action (r = .25, p<.001), problem-solving (r = .19, p<.001), planning (r = .15, p<.01), expression of emotion (r = .26, p<.001) and positive reinterpretation (r = .14, p<.05). It was not significantly correlated with more maladaptive coping styles such as resignation (r = .06, n.s.), restraint (r = .08, n.s.) and preventive coping (r = .08, n.s.).
2. Having an environmentally-friendly identity was significantly correlated only with two adaptive coping styles: problem-solving (r = .16, p<.01) and planning (r = .14, p<.01). It was not significantly correlated with the more maladaptive coping styles.
3. Similarly, a long-term goal of reducing carbon footprint was correlated with problem-solving (r = .14, p<.01) and planning (r = .15, p<.01) but not with the maladaptive styles.
4. Finally, choosing environmental behaviour as a day-to-day goal was not correlated with the coping styles.
Table 11. Correlations between Environmental Goals and Coping Styles
Active Emotion Resign Restraint Prob-Solve
Preventive Planning Positive
Enviro. Value
.25*** .26*** .06 .07 .19** .08 .15** .14*
Enviro. Identity
.01 .07 .00 .00 .16** .03 .14* .08
Enviro. Goal
.08 .09 .04 .01 .14* .05 .15** .05
Enviro. Behaviour
-.02 .02 .09 .06 -.03 -.04 -.02 .01
*p<.05, **p<.01, ***p<.001
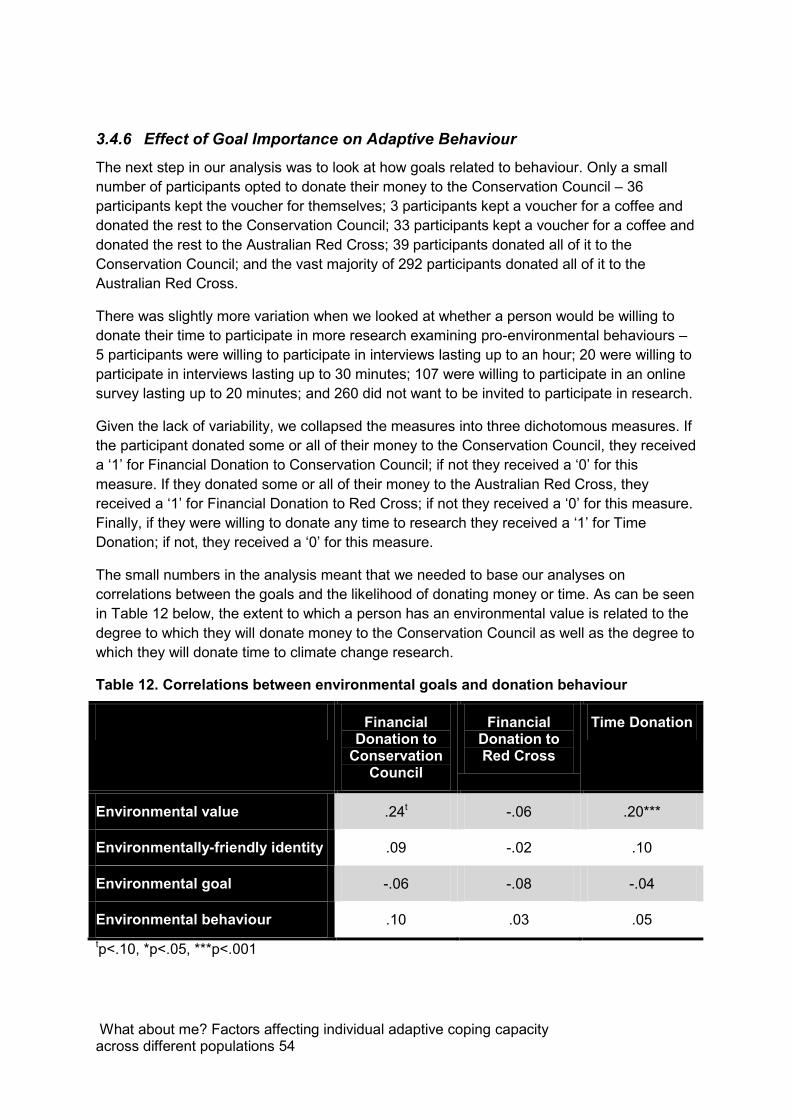
What about me? Factors affecting individual adaptive coping capacity across different populations 54
3.4.6 Effect of Goal Importance on Adaptive Behaviour
The next step in our analysis was to look at how goals related to behaviour. Only a small number of participants opted to donate their money to the Conservation Council – 36 participants kept the voucher for themselves; 3 participants kept a voucher for a coffee and donated the rest to the Conservation Council; 33 participants kept a voucher for a coffee and donated the rest to the Australian Red Cross; 39 participants donated all of it to the Conservation Council; and the vast majority of 292 participants donated all of it to the Australian Red Cross.
There was slightly more variation when we looked at whether a person would be willing to donate their time to participate in more research examining pro-environmental behaviours – 5 participants were willing to participate in interviews lasting up to an hour; 20 were willing to participate in interviews lasting up to 30 minutes; 107 were willing to participate in an online survey lasting up to 20 minutes; and 260 did not want to be invited to participate in research.
Given the lack of variability, we collapsed the measures into three dichotomous measures. If the participant donated some or all of their money to the Conservation Council, they received a ‘1’ for Financial Donation to Conservation Council; if not they received a ‘0’ for this measure. If they donated some or all of their money to the Australian Red Cross, they received a ‘1’ for Financial Donation to Red Cross; if not they received a ‘0’ for this measure. Finally, if they were willing to donate any time to research they received a ‘1’ for Time Donation; if not, they received a ‘0’ for this measure.
The small numbers in the analysis meant that we needed to base our analyses on correlations between the goals and the likelihood of donating money or time. As can be seen in Table 12 below, the extent to which a person has an environmental value is related to the degree to which they will donate money to the Conservation Council as well as the degree to which they will donate time to climate change research.
Table 12. Correlations between environmental goals and donation behaviour
Financial Donation to
Conservation Council
Financial Donation to Red Cross
Time Donation
Environmental value .24t -.06 .20***
Environmentally-friendly identity .09 -.02 .10
Environmental goal -.06 -.08 -.04
Environmental behaviour .10 .03 .05 tp<.10, *p<.05, ***p<.001
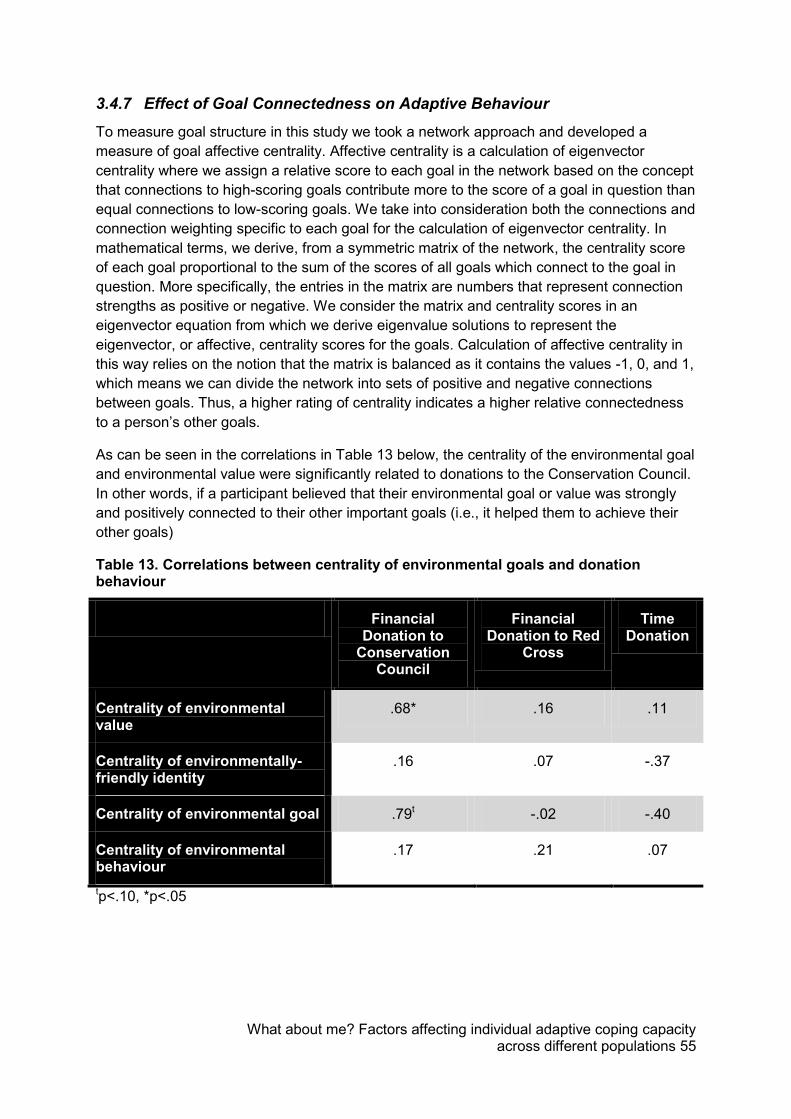
What about me? Factors affecting individual adaptive coping capacity across different populations 55
3.4.7 Effect of Goal Connectedness on Adaptive Behaviour To measure goal structure in this study we took a network approach and developed a measure of goal affective centrality. Affective centrality is a calculation of eigenvector centrality where we assign a relative score to each goal in the network based on the concept that connections to high-scoring goals contribute more to the score of a goal in question than equal connections to low-scoring goals. We take into consideration both the connections and connection weighting specific to each goal for the calculation of eigenvector centrality. In mathematical terms, we derive, from a symmetric matrix of the network, the centrality score of each goal proportional to the sum of the scores of all goals which connect to the goal in question. More specifically, the entries in the matrix are numbers that represent connection strengths as positive or negative. We consider the matrix and centrality scores in an eigenvector equation from which we derive eigenvalue solutions to represent the eigenvector, or affective, centrality scores for the goals. Calculation of affective centrality in this way relies on the notion that the matrix is balanced as it contains the values -1, 0, and 1, which means we can divide the network into sets of positive and negative connections between goals. Thus, a higher rating of centrality indicates a higher relative connectedness to a person’s other goals.
As can be seen in the correlations in Table 13 below, the centrality of the environmental goal and environmental value were significantly related to donations to the Conservation Council. In other words, if a participant believed that their environmental goal or value was strongly and positively connected to their other important goals (i.e., it helped them to achieve their other goals)
Table 13. Correlations between centrality of environmental goals and donation behaviour
Financial Donation to
Conservation Council
Financial Donation to Red
Cross
Time Donation
Centrality of environmental value
.68* .16 .11
Centrality of environmentally-friendly identity
.16 .07 -.37
Centrality of environmental goal .79t -.02 -.40
Centrality of environmental behaviour
.17 .21 .07
tp<.10, *p<.05
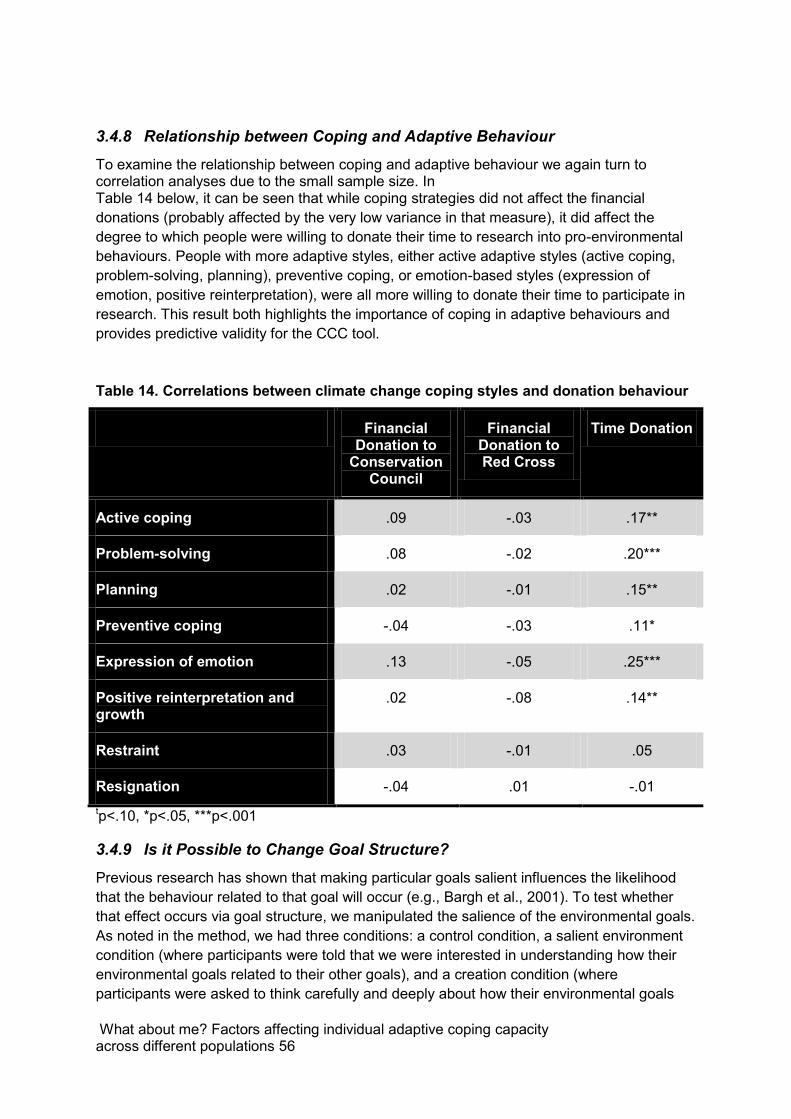
What about me? Factors affecting individual adaptive coping capacity across different populations 56
3.4.8 Relationship between Coping and Adaptive Behaviour To examine the relationship between coping and adaptive behaviour we again turn to correlation analyses due to the small sample size. In Table 14 below, it can be seen that while coping strategies did not affect the financial donations (probably affected by the very low variance in that measure), it did affect the degree to which people were willing to donate their time to research into pro-environmental behaviours. People with more adaptive styles, either active adaptive styles (active coping, problem-solving, planning), preventive coping, or emotion-based styles (expression of emotion, positive reinterpretation), were all more willing to donate their time to participate in research. This result both highlights the importance of coping in adaptive behaviours and provides predictive validity for the CCC tool.
Table 14. Correlations between climate change coping styles and donation behaviour
Financial Donation to
Conservation Council
Financial Donation to Red Cross
Time Donation
Active coping .09 -.03 .17**
Problem-solving .08 -.02 .20***
Planning .02 -.01 .15**
Preventive coping -.04 -.03 .11*
Expression of emotion .13 -.05 .25***
Positive reinterpretation and growth
.02 -.08 .14**
Restraint .03 -.01 .05
Resignation -.04 .01 -.01 tp<.10, *p<.05, ***p<.001
3.4.9 Is it Possible to Change Goal Structure? Previous research has shown that making particular goals salient influences the likelihood that the behaviour related to that goal will occur (e.g., Bargh et al., 2001). To test whether that effect occurs via goal structure, we manipulated the salience of the environmental goals. As noted in the method, we had three conditions: a control condition, a salient environment condition (where participants were told that we were interested in understanding how their environmental goals related to their other goals), and a creation condition (where participants were asked to think carefully and deeply about how their environmental goals
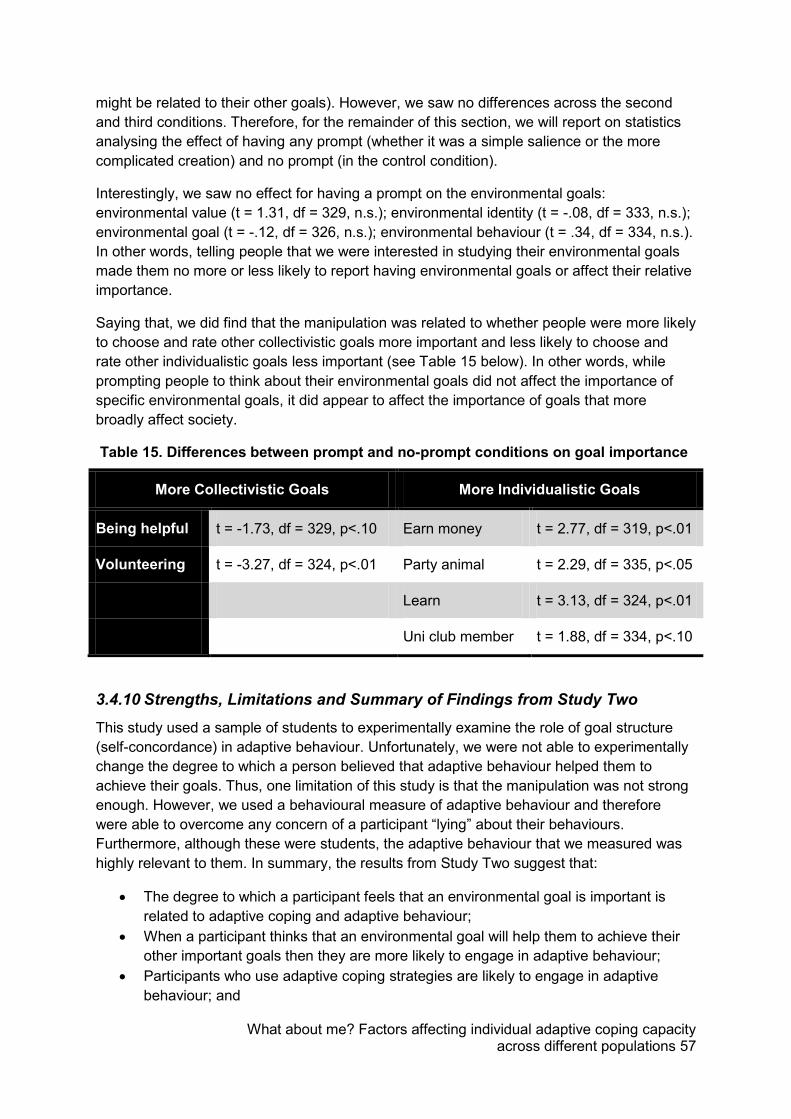
What about me? Factors affecting individual adaptive coping capacity across different populations 57
might be related to their other goals). However, we saw no differences across the second and third conditions. Therefore, for the remainder of this section, we will report on statistics analysing the effect of having any prompt (whether it was a simple salience or the more complicated creation) and no prompt (in the control condition).
Interestingly, we saw no effect for having a prompt on the environmental goals: environmental value (t = 1.31, df = 329, n.s.); environmental identity (t = -.08, df = 333, n.s.); environmental goal (t = -.12, df = 326, n.s.); environmental behaviour (t = .34, df = 334, n.s.). In other words, telling people that we were interested in studying their environmental goals made them no more or less likely to report having environmental goals or affect their relative importance.
Saying that, we did find that the manipulation was related to whether people were more likely to choose and rate other collectivistic goals more important and less likely to choose and rate other individualistic goals less important (see Table 15 below). In other words, while prompting people to think about their environmental goals did not affect the importance of specific environmental goals, it did appear to affect the importance of goals that more broadly affect society.
Table 15. Differences between prompt and no-prompt conditions on goal importance
More Collectivistic Goals More Individualistic Goals
Being helpful t = -1.73, df = 329, p<.10 Earn money t = 2.77, df = 319, p<.01
Volunteering t = -3.27, df = 324, p<.01 Party animal t = 2.29, df = 335, p<.05
Learn t = 3.13, df = 324, p<.01
Uni club member t = 1.88, df = 334, p<.10
3.4.10 Strengths, Limitations and Summary of Findings from Study Two This study used a sample of students to experimentally examine the role of goal structure (self-concordance) in adaptive behaviour. Unfortunately, we were not able to experimentally change the degree to which a person believed that adaptive behaviour helped them to achieve their goals. Thus, one limitation of this study is that the manipulation was not strong enough. However, we used a behavioural measure of adaptive behaviour and therefore were able to overcome any concern of a participant “lying” about their behaviours. Furthermore, although these were students, the adaptive behaviour that we measured was highly relevant to them. In summary, the results from Study Two suggest that:
The degree to which a participant feels that an environmental goal is important is related to adaptive coping and adaptive behaviour;
When a participant thinks that an environmental goal will help them to achieve their other important goals then they are more likely to engage in adaptive behaviour;
Participants who use adaptive coping strategies are likely to engage in adaptive behaviour; and
What about me? Factors affecting individual adaptive coping capacity across different populations 58
Prompting participants to think about their environmental goals does not make them more likely to rate those goals as important; however, they are more likely to rate collectivistic goals as important and individualistic goals as less important.
What about me? Factors affecting individual adaptive coping capacity across different populations 59
3.5 Study Three – How do goals, coping and beliefs affect adaptive behaviours?
This study was led by the UWA Business School team of Kerrie Unsworth, Jon Heath and Illy McNeill. The aim of this study was to assess the effects of goals, individual differences and coping on adaptive behaviour across a broader sample.
In support of our hypotheses, we found in this study that people who had goals to help the environment and who coped adaptively were likely to engage in adaptive behaviour. On top of this, though, people who did not have environmental goals but who felt that the behaviour could help them to achieve their other goals also engaged in adaptive behaviour. In other words, they did not have to be a “greenie” but just needed to think that the behaviour was useful to them. This finding is surprising as many might suggest that only those who care about the environment would engage in adaptive behaviour. This means that we can increase adaptive behaviour for all people (not just “preaching to the converted”) by showing how these behaviours help to achieve other goals.
3.5.1 Sample We used a qualified research panel organisation, Qualtrics, to obtain the sample for this research which was conducted across 2 time points, a month apart. Five hundred and twenty-eight participants across Australia took part in the first wave of data collection (260 males and 266 females, Mage = 45.57, SD = 16.13). The second wave of data collection received 305 complete responses (148 males and 157 females, Mage = 47.35, SD = 15.62).
The demographics in the second wave of data collection quite closely matched the demographics from the first wave indicating that the completing the first survey in full did not “turn off” a particular population group. Combining all data across both waves of data collection, we were able to match 303 responses across the 2 time periods (57.4% response rate in time two).
3.5.2 Measures
Goal importance o We measured goal importance by asking the participants how important each
of the following goals was to them personally, on a 5-point scale from “Not at all important” to “Very important”.
o The goals were identified to cover biospheric, egoistic and altruistic goals (Stern, 2000) as well as other motives that have been identified as prompting pro-environmental behaviour (De Young, 2000).
o The goals were: Financial goal (e.g., saving money, creating wealth) Frugality goal (e.g., avoiding waste) Not standing out from the crowd – doing what others do
What about me? Factors affecting individual adaptive coping capacity across different populations 60
Being helpful to others Protecting the environment Participating in changing the world Social justice Fulfilling requirements, obligations or regulations Being a good citizen Looking after our children’s future Living an easy and convenient life Dealing with climate change
Goal connectedness
o In this study, we were unable to use the goal hierarchy software that we used in Study Two to capture the overall goal structure. Instead, we measured goal connectedness by asking the participants the degree to which they perceived that each type of behaviour would help them achieve specific goals (financial goal, frugality goal, environmental goal, not standing out from the crowd, being helpful to others, participating in changing the world, social justice, fulfilling requirements and obligations, being a good citizen, looking after our children’s future, living an easy and convenient life, and dealing with climate change). We then calculated a weighted sum of these ratings by multiplying the helpfulness rating with their rating of the personal importance of each goal (see above) to create a measure of overall connectedness.
Climate Change Coping (CCC) o Participants were asked, “We are interested in how people are dealing with
the current changes to weather that Australia is experiencing (e.g., reduced rainfall, increasing temperatures and increasing ‘extreme’ weather events such as breaking temperature records, droughts, bushfires, and floods). There are different ways to deal with these problems. This questionnaire asks you to indicate what you generally think, do, and feel when you experience stress arising out of these changes. Obviously different issues bring out somewhat different responses, but think about how true the following statements are for you when dealing with the issue of these weather changes.” We then asked 24 questions to be answered on a 7-point scale designed to assess eight coping strategies:
Direct action Planning Problem-solving and information-seeking Preventive coping Expression of emotion Positive reinterpretation and growth Restraint Resignation
Further information about the development of this CCC scale can be in the results section.
What about me? Factors affecting individual adaptive coping capacity across different populations 61
Optimism o We used the Life Orientation Test (LOT) to assess individual differences in
generalized optimism versus pessimism. This measure, and its successor the LOT-R (Scheier, Carver, & Bridges, 1994), have been used in a good deal of research on the behavioural, affective, and health consequences of this personality variable (see Carver, Scheier, & Segerstrom, 2010 for a recent review).
o The LOT-R measured optimism on a 5-point Likert scale anchored by 1 = “I disagree a lot” to 5 = “I agree a lot”.
Core Self-Evaluation Scale (CSES)
o Core self-evaluation (CSE) represents the fundamental appraisals individuals make about their self-worth and capabilities. We measured this using the core self-evaluation scale (CSES) (Judge, Erez, Bono, & Thoresen, 2003).
o The Core Self Evaluation Scale is a 12-item measure on a 5-point Likert scale ranging from ‘Strongly Disagree’ to ‘Strongly Agree’. It includes questions such as “When I try, I generally succeed” and “I am filled with doubts about my competence”
Emotional Stability (ES)
o We measured emotional stability using the subscale from Saucier’s Big-7 personality inventory (Saucier & Goldberg, 1998), a slight reclassification of the original Big-5 personality inventory (Costa & McCrae, 1992).
o Participants were asked to assess a range of 10 statements (e.g., ‘I am relaxed most of the time’) on a 5-point scale from “Very Inaccurate” to “Very Accurate” how accurately these statements described themselves.
Positive and Negative Affect Schedule (PANAS)
o This scale consists of a number of words (e.g., interested, upset, enthusiastic, hostile, nervous, etc.) that describe different feelings and emotions (Watson, Clark, & Tellegen, 1988).
o Participants were asked to indicate to what extent they had felt this way over the previous week on a 5-point Likert scale ranging from ‘Very slightly or not at all’ to ‘extremely’
Free Market Ideology o The Free Market Scale contains 5-items and measures a person’s degree of
support for free-market economic policy: the extent to which a person believes that governments should avoid attempts to regulate and control the market place, and that in doing so, the ‘invisible hand’ of the market will ensure that issues of equality, fairness, and environmental concerns are taken care of. It’s synonymous with a right wing conservative political ideology, but not exclusively so. For example, in the UK the Labour Party under Tony Blair embraced aspects of Free Market ideology, as did the Democrat party in the USA under Bill Clinton.
What about me? Factors affecting individual adaptive coping capacity across different populations 62
o The Support for the Free-Market System Scale (Heath & Gifford, 2006) measures their degree of support for free-market ideology. An example item is “The preservation of the free market system is more important than localized environmental concerns”.
Climate Change Beliefs
o We used the CSIRO measures of climate change beliefs (Leviston & Walker, 2011). The first question asked participants to choose which of the following statements best describes your general attitude towards climate change. The statements were:
I do not believe in climate change I do not know whether climate change is happening or not I believe that climate change is happening but it’s just a natural
fluctuation in Earth’s temperatures I believe that climate change is happening and humans are
contributing to it o We also asked the follow-up question: How much do you think humans
contribute to/cause climate change? (as a percent of overall climate change). Participants were asked to move a slider along to represent their belief about human contribution from 0% to 100%.
Our dependent variables in this study were:
Support for policies o To measure adaptive capacity, we assessed the degree to which people
supported policies which could be implemented by State or Federal governments. Participants were asked the extent to which they agreed with each of the policies on a 5-point scale from “Strongly disagree” to “Strongly agree”.
o The policies were: Putting a price on carbon Regulating a move to greener fuels and lower-emissions energy even
if that means higher fuel prices Stronger regulation of companies and their carbon emissions More incentives for taxpayers to reduce their energy and water use More punishments for taxpayers who do not reduce their energy and
water use Funding research into producing lower-emissions products Regulating the building of houses to increase energy efficiency Mandating smarter meter installation (at home owner’s expense) More punishments for companies who do not reduce their energy and
water use.
Adaptive behaviour
The General Ecological Behaviours scale (GEB) (Kaiser, 1998; Kaiser et al., 2003; Kaiser & Wilson, 2000, 2004) was used to capture a wide range of adaptive behaviours. These covered different categories including transportation, recycling and waste, energy efficiency, activism and so on. The scale has proven to have strong reliability and validity in previous
What about me? Factors affecting individual adaptive coping capacity across different populations 63
studies .(Kaiser et al., 2003; Kaiser & Wilson, 2004) The items are have already been discussed in the overview and displayed in detail in
What about me? Factors affecting individual adaptive coping capacity across different populations 64
o Table 2 above. o This was a 50-item scale with a 5-point Likert response for 40 frequency
based actions (e.g., ‘I drive in such a way as to keep my fuel consumption as low as possible’), and a simple yes/no response to discrete behaviour such as “I own solar panels”. Reverse coding applied to 21 items within the measure.
Petition-signing
o As a second way of measuring individuals adaptive behaviour, we asked respondents whether they would like to be involved in one, both or none of the 2 petitions on the following:
1) Transitioning Australia to 100% renewable energy; 2) Scrapping the carbon tax
o These petitions were created using the appropriate wording and rhetoric that you would find for each of the particular viewpoints. Participants were told “You can decide how much your level of involvement is by:”
a) not signing the petition; b) signing the petition and having the standard text provided; c) signing the petition and altering the text to make the message more
personal to you; or d) Signing the petition and writing your own personal message
attached to your petition.
The survey also included some control variables.
Political orientation o We asked participants what their most dominant political orientation was. The
options were: Labour party Liberal party Nationals party Greens party Independent
Demographics
o We measured gender, age, number of children (and, if 0, whether they wanted children in the future or not), and postcode.
3.5.3 Descriptives: Green and Non-Green Goals, Beliefs, Coping Strategies & Behaviours
As can be seen in Figure 7 below, nearly half the sample surveyed believed that climate change was happening and that humans are contributing to it. However there was also a nearly a third of the sample who believed that climate change was occurring naturally. In other words, the sample appeared to be polarised not between whether climate change was occurring or not, but the degree to which it was anthropogenic. This is similar to the findings from the CSIRO 2011 report which found that 46.5% of people felt that humans were contributing to climate change and 42.2% thought it was naturally occurring (Leviston & Walker, 2011). When asked how much they believed humans were contributing to climate
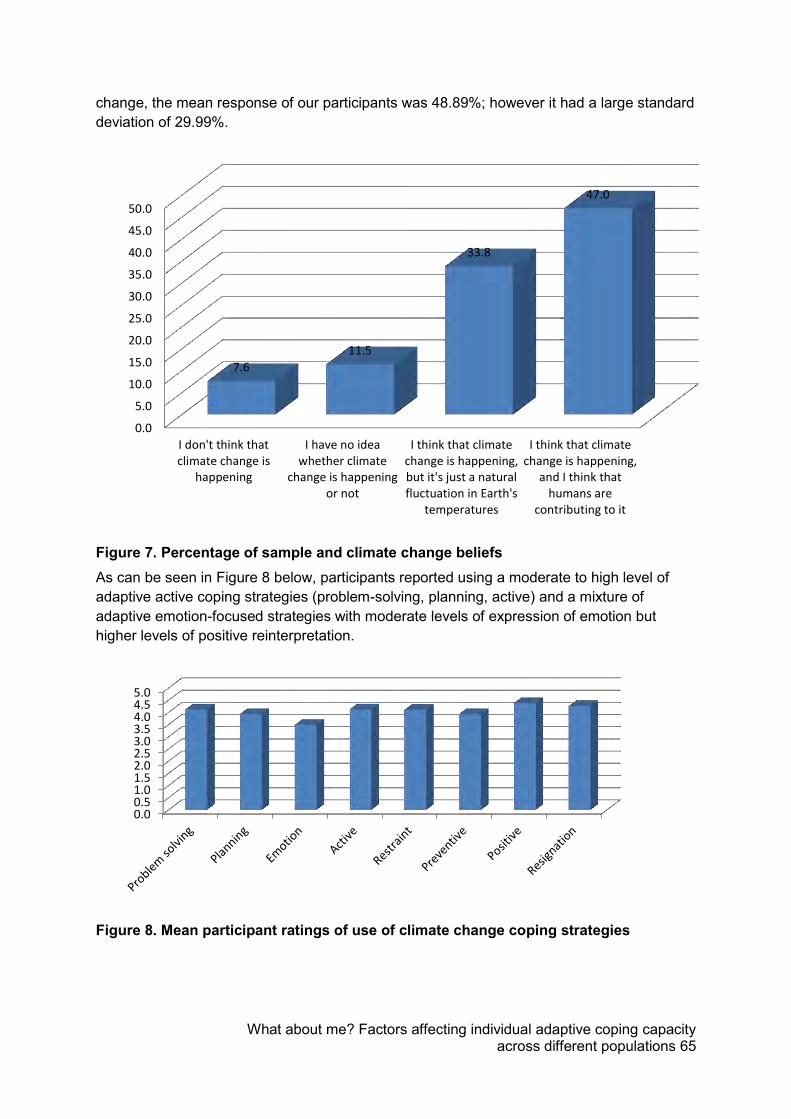
What about me? Factors affecting individual adaptive coping capacity across different populations 65
change, the mean response of our participants was 48.89%; however it had a large standard deviation of 29.99%.
Figure 7. Percentage of sample and climate change beliefs
As can be seen in Figure 8 below, participants reported using a moderate to high level of adaptive active coping strategies (problem-solving, planning, active) and a mixture of adaptive emotion-focused strategies with moderate levels of expression of emotion but higher levels of positive reinterpretation.
Figure 8. Mean participant ratings of use of climate change coping strategies
0.0
5.0
10.0
15.0
20.0
25.0
30.0
35.0
40.0
45.0
50.0
I don't think thatclimate change is
happening
I have no ideawhether climate
change is happeningor not
I think that climatechange is happening,but it's just a naturalfluctuation in Earth's
temperatures
I think that climatechange is happening,
and I think thathumans are
contributing to it
7.6
11.5
33.8
47.0
0.00.51.01.52.02.53.03.54.04.55.0
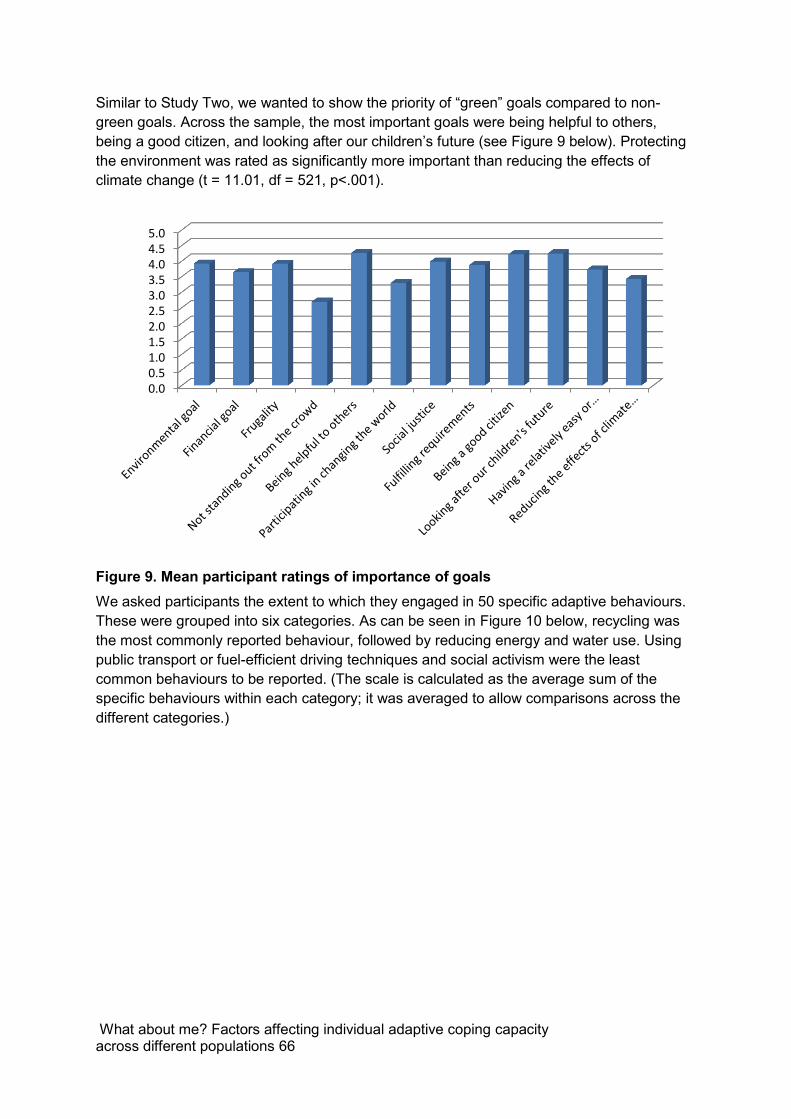
What about me? Factors affecting individual adaptive coping capacity across different populations 66
Similar to Study Two, we wanted to show the priority of “green” goals compared to non-green goals. Across the sample, the most important goals were being helpful to others, being a good citizen, and looking after our children’s future (see Figure 9 below). Protecting the environment was rated as significantly more important than reducing the effects of climate change (t = 11.01, df = 521, p<.001).
Figure 9. Mean participant ratings of importance of goals
We asked participants the extent to which they engaged in 50 specific adaptive behaviours. These were grouped into six categories. As can be seen in Figure 10 below, recycling was the most commonly reported behaviour, followed by reducing energy and water use. Using public transport or fuel-efficient driving techniques and social activism were the least common behaviours to be reported. (The scale is calculated as the average sum of the specific behaviours within each category; it was averaged to allow comparisons across the different categories.)
0.00.51.01.52.02.53.03.54.04.55.0
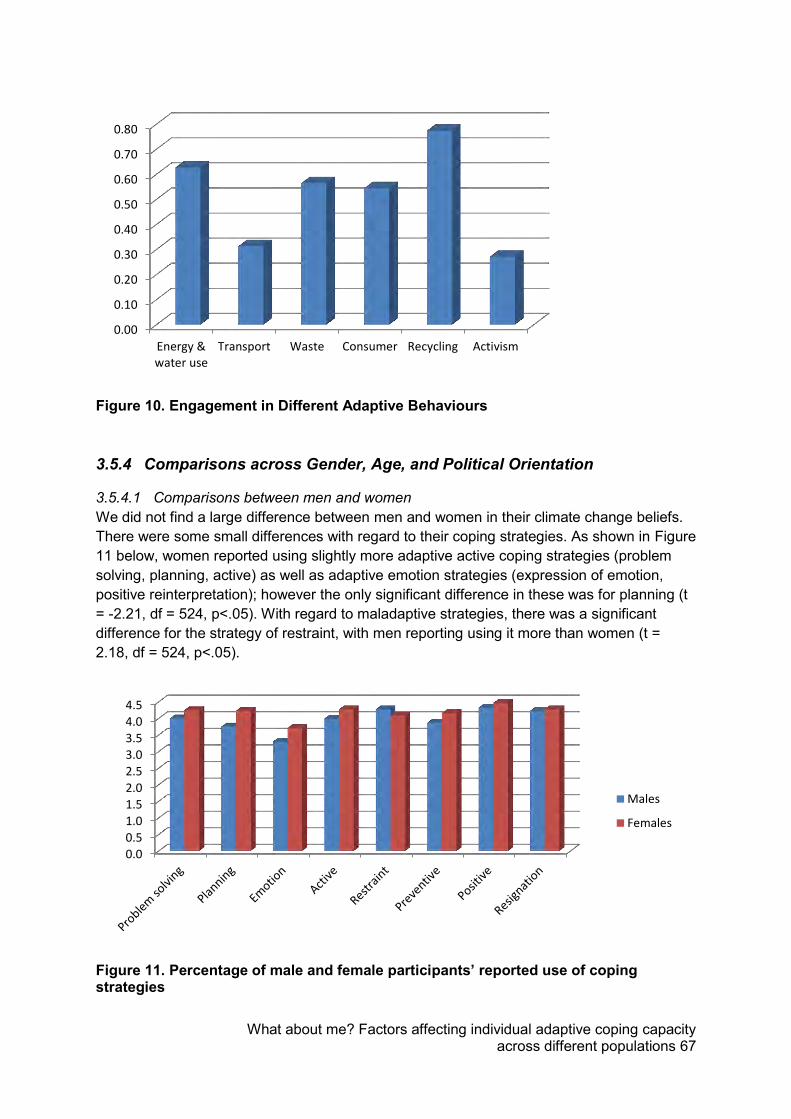
What about me? Factors affecting individual adaptive coping capacity across different populations 67
Figure 10. Engagement in Different Adaptive Behaviours
3.5.4 Comparisons across Gender, Age, and Political Orientation
3.5.4.1 Comparisons between men and women We did not find a large difference between men and women in their climate change beliefs. There were some small differences with regard to their coping strategies. As shown in Figure 11 below, women reported using slightly more adaptive active coping strategies (problem solving, planning, active) as well as adaptive emotion strategies (expression of emotion, positive reinterpretation); however the only significant difference in these was for planning (t = -2.21, df = 524, p<.05). With regard to maladaptive strategies, there was a significant difference for the strategy of restraint, with men reporting using it more than women (t = 2.18, df = 524, p<.05).
Figure 11. Percentage of male and female participants’ reported use of coping strategies
0.00
0.10
0.20
0.30
0.40
0.50
0.60
0.70
0.80
Energy &water use
Transport Waste Consumer Recycling Activism
0.00.5
1.0
1.5
2.0
2.5
3.0
3.54.0
4.5
Males
Females
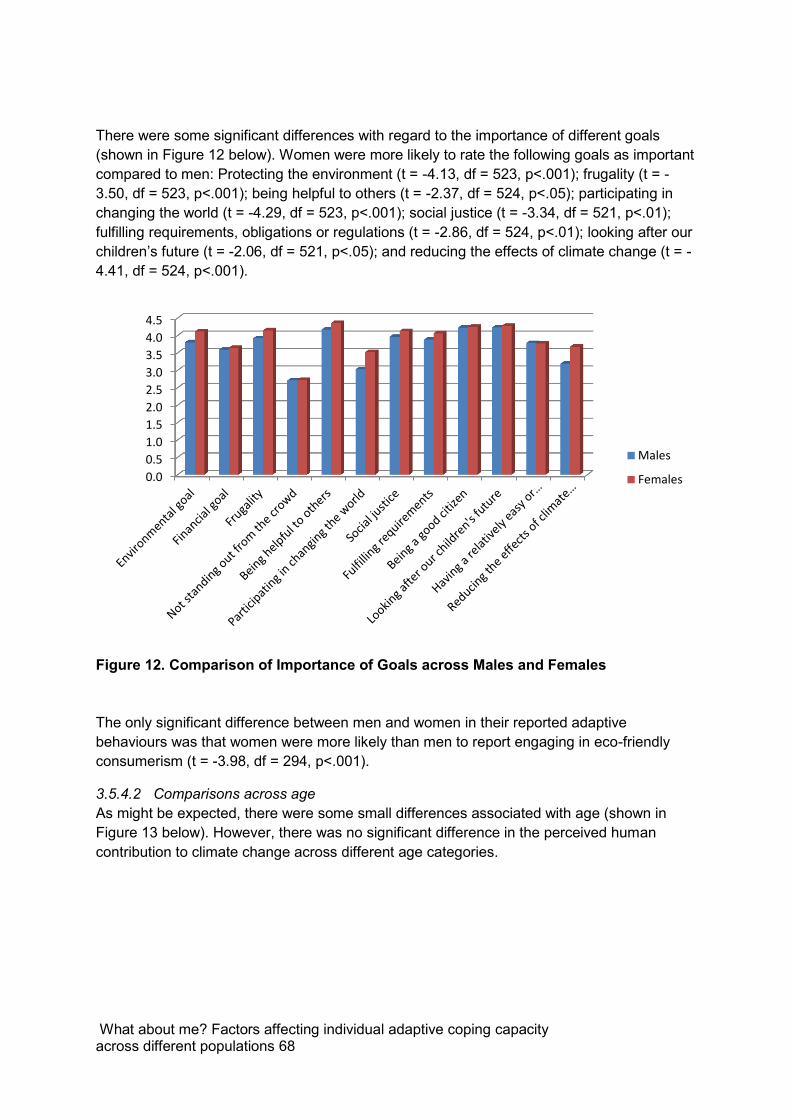
What about me? Factors affecting individual adaptive coping capacity across different populations 68
There were some significant differences with regard to the importance of different goals (shown in Figure 12 below). Women were more likely to rate the following goals as important compared to men: Protecting the environment (t = -4.13, df = 523, p<.001); frugality (t = -3.50, df = 523, p<.001); being helpful to others (t = -2.37, df = 524, p<.05); participating in changing the world (t = -4.29, df = 523, p<.001); social justice (t = -3.34, df = 521, p<.01); fulfilling requirements, obligations or regulations (t = -2.86, df = 524, p<.01); looking after our children’s future (t = -2.06, df = 521, p<.05); and reducing the effects of climate change (t = -4.41, df = 524, p<.001).
Figure 12. Comparison of Importance of Goals across Males and Females
The only significant difference between men and women in their reported adaptive behaviours was that women were more likely than men to report engaging in eco-friendly consumerism (t = -3.98, df = 294, p<.001).
3.5.4.2 Comparisons across age As might be expected, there were some small differences associated with age (shown in Figure 13 below). However, there was no significant difference in the perceived human contribution to climate change across different age categories.
0.0
0.5
1.0
1.5
2.0
2.5
3.0
3.5
4.0
4.5
Males
Females
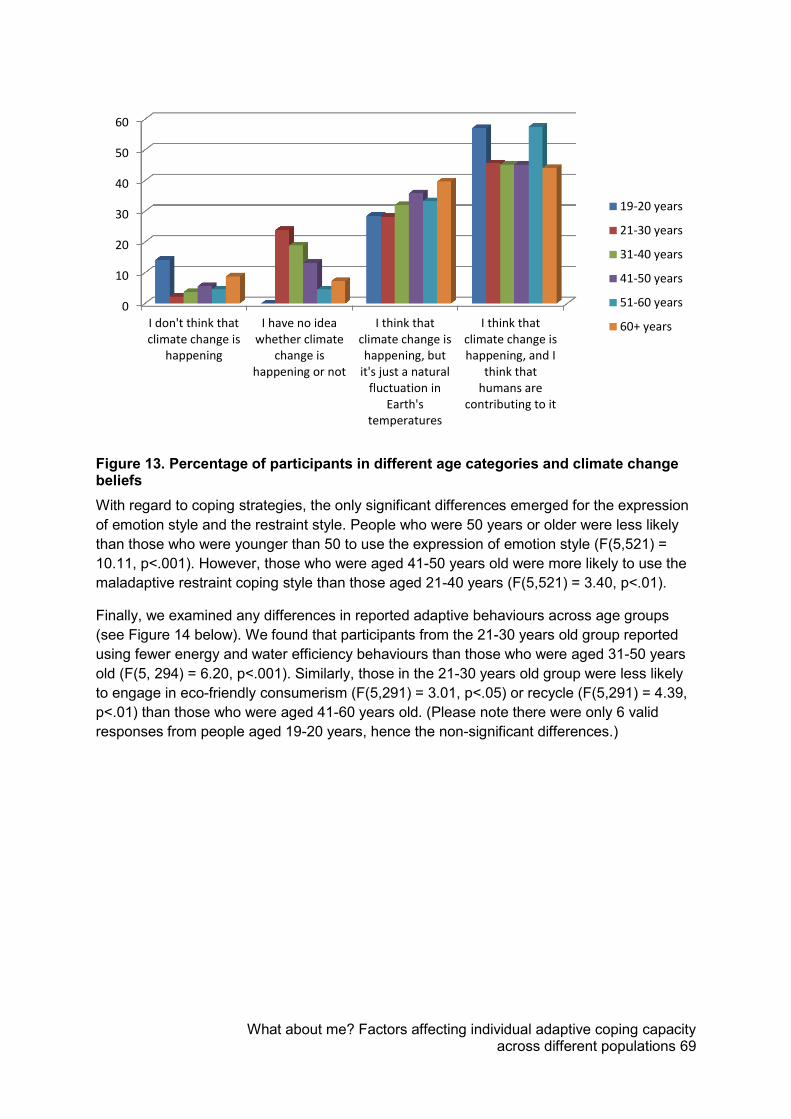
What about me? Factors affecting individual adaptive coping capacity across different populations 69
Figure 13. Percentage of participants in different age categories and climate change beliefs
With regard to coping strategies, the only significant differences emerged for the expression of emotion style and the restraint style. People who were 50 years or older were less likely than those who were younger than 50 to use the expression of emotion style (F(5,521) = 10.11, p<.001). However, those who were aged 41-50 years old were more likely to use the maladaptive restraint coping style than those aged 21-40 years (F(5,521) = 3.40, p<.01).
Finally, we examined any differences in reported adaptive behaviours across age groups (see Figure 14 below). We found that participants from the 21-30 years old group reported using fewer energy and water efficiency behaviours than those who were aged 31-50 years old (F(5, 294) = 6.20, p<.001). Similarly, those in the 21-30 years old group were less likely to engage in eco-friendly consumerism (F(5,291) = 3.01, p<.05) or recycle (F(5,291) = 4.39, p<.01) than those who were aged 41-60 years old. (Please note there were only 6 valid responses from people aged 19-20 years, hence the non-significant differences.)
0
10
20
30
40
50
60
I don't think thatclimate change is
happening
I have no ideawhether climate
change ishappening or not
I think thatclimate change ishappening, but
it's just a naturalfluctuation in
Earth'stemperatures
I think thatclimate change ishappening, and I
think thathumans are
contributing to it
19-20 years
21-30 years
31-40 years
41-50 years
51-60 years
60+ years
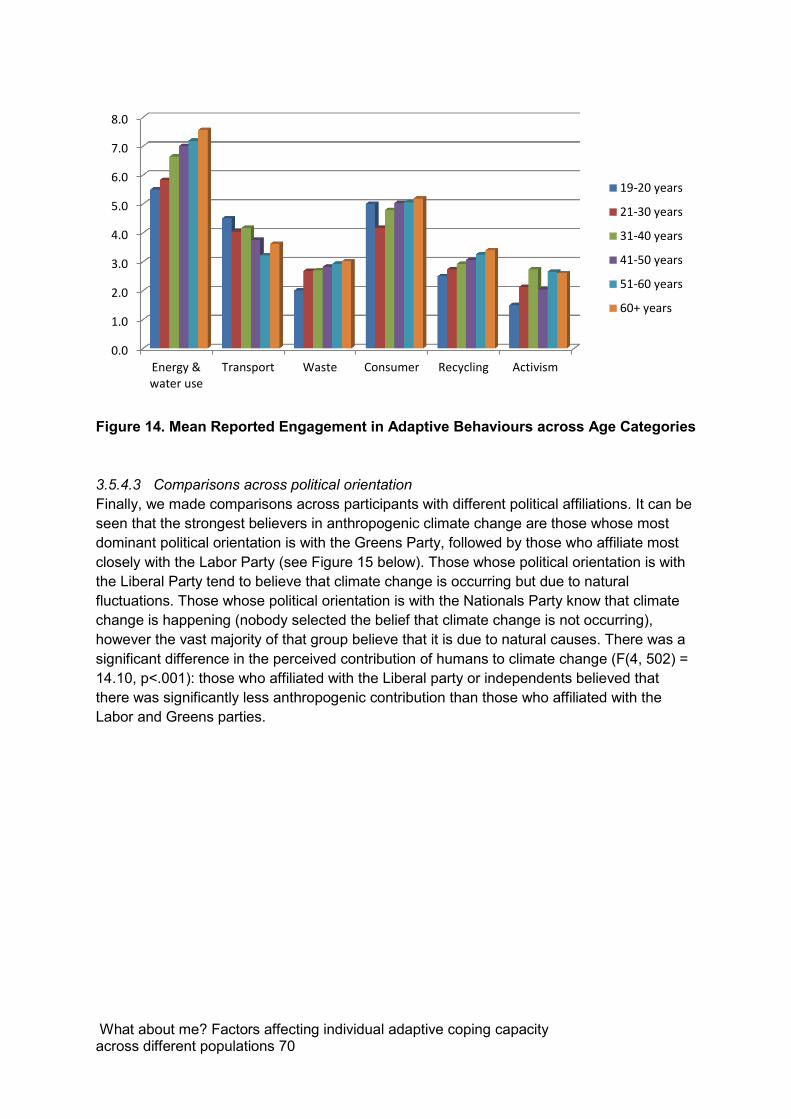
What about me? Factors affecting individual adaptive coping capacity across different populations 70
Figure 14. Mean Reported Engagement in Adaptive Behaviours across Age Categories
3.5.4.3 Comparisons across political orientation Finally, we made comparisons across participants with different political affiliations. It can be seen that the strongest believers in anthropogenic climate change are those whose most dominant political orientation is with the Greens Party, followed by those who affiliate most closely with the Labor Party (see Figure 15 below). Those whose political orientation is with the Liberal Party tend to believe that climate change is occurring but due to natural fluctuations. Those whose political orientation is with the Nationals Party know that climate change is happening (nobody selected the belief that climate change is not occurring), however the vast majority of that group believe that it is due to natural causes. There was a significant difference in the perceived contribution of humans to climate change (F(4, 502) = 14.10, p<.001): those who affiliated with the Liberal party or independents believed that there was significantly less anthropogenic contribution than those who affiliated with the Labor and Greens parties.
0.0
1.0
2.0
3.0
4.0
5.0
6.0
7.0
8.0
Energy &water use
Transport Waste Consumer Recycling Activism
19-20 years
21-30 years
31-40 years
41-50 years
51-60 years
60+ years
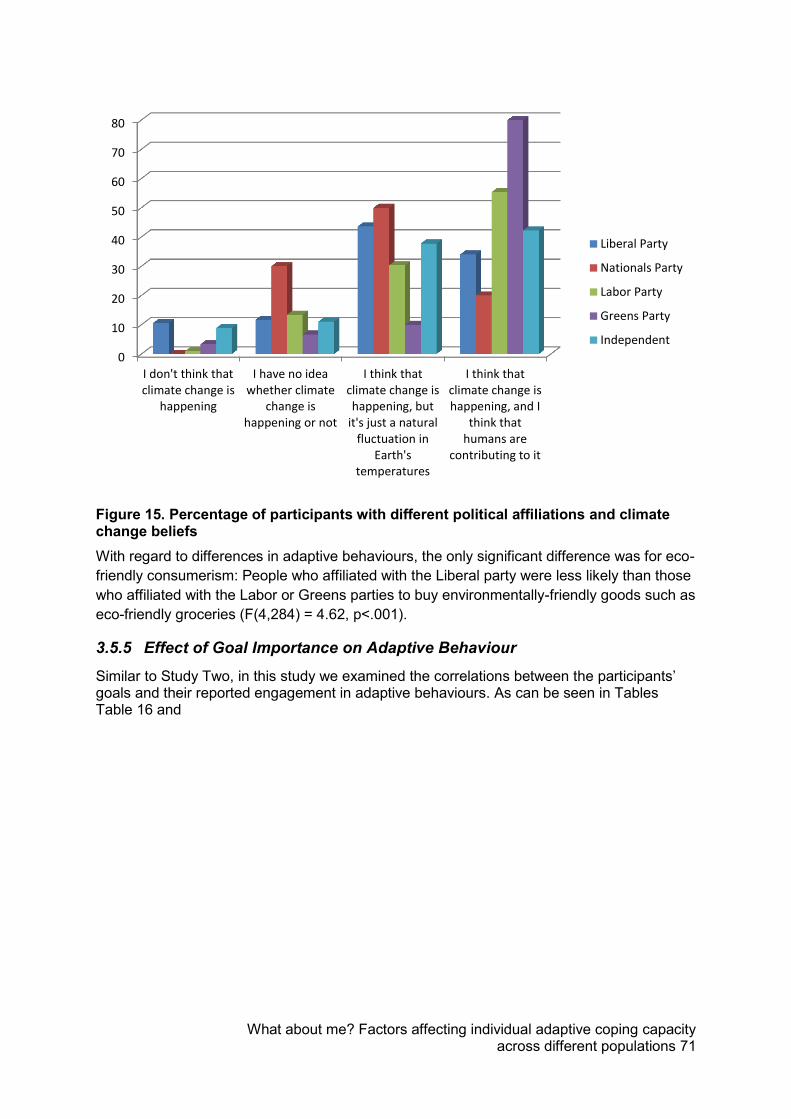
What about me? Factors affecting individual adaptive coping capacity across different populations 71
Figure 15. Percentage of participants with different political affiliations and climate change beliefs
With regard to differences in adaptive behaviours, the only significant difference was for eco-friendly consumerism: People who affiliated with the Liberal party were less likely than those who affiliated with the Labor or Greens parties to buy environmentally-friendly goods such as eco-friendly groceries (F(4,284) = 4.62, p<.001).
3.5.5 Effect of Goal Importance on Adaptive Behaviour
Similar to Study Two, in this study we examined the correlations between the participants’ goals and their reported engagement in adaptive behaviours. As can be seen in Tables Table 16 and
0
10
20
30
40
50
60
70
80
I don't think thatclimate change is
happening
I have no ideawhether climate
change ishappening or not
I think thatclimate change ishappening, but
it's just a naturalfluctuation in
Earth'stemperatures
I think thatclimate change ishappening, and I
think thathumans are
contributing to it
Liberal Party
Nationals Party
Labor Party
Greens Party
Independent
What about me? Factors affecting individual adaptive coping capacity across different populations 72
Table 17 below, although the environmental value and goals were correlated with the behaviours, other goals were correlated with adaptive behaviours as well. These correlations provide us with an insight into the reasons why people might be engaging in different types of adaptive behaviours. In summary, the correlations show that:
There are relationships between “normalised” adaptive behaviours such as recycling and energy/water efficiency and environmental values and goals (environmental value, protecting the environment, frugality), as well as hedonistic goals (pleasure, creativity) and societal goals (being helpful, social justice and being a good citizen).
Interestingly, both recycling and energy/water efficiency were not correlated with a goal of reducing the effects of climate change. It could be that these are so embedded in everyday life that they are not seen as relevant to climate change any more.
Difficult behaviours, such as reducing waste and social activism, were most strongly related to societal and environmental goals – environmental value, equality, protecting the environment, changing the world, social justice, looking after our children’s future, and reducing the effects of climate change.
Some of the adaptive behaviours had negative relationships. In other words... o Participants with a successful/ambitious value were less likely to report
engaging in recycling behaviours; o Participants with a social power and wealth value were less likely to report
engaging in energy and water efficiency, reducing waste, eco-friendly consumerism, recycling and activism;
o Participants with a normative goal (not wanting to stand out from the crowd) were less likely to report engaging in energy and water efficiency, eco-friendly consumerism and recycling; and
o Participants with an ease or convenience goal were less likely to report using environmentally-friendly modes of transport, or engaging in eco-friendly consumerism and social activism.
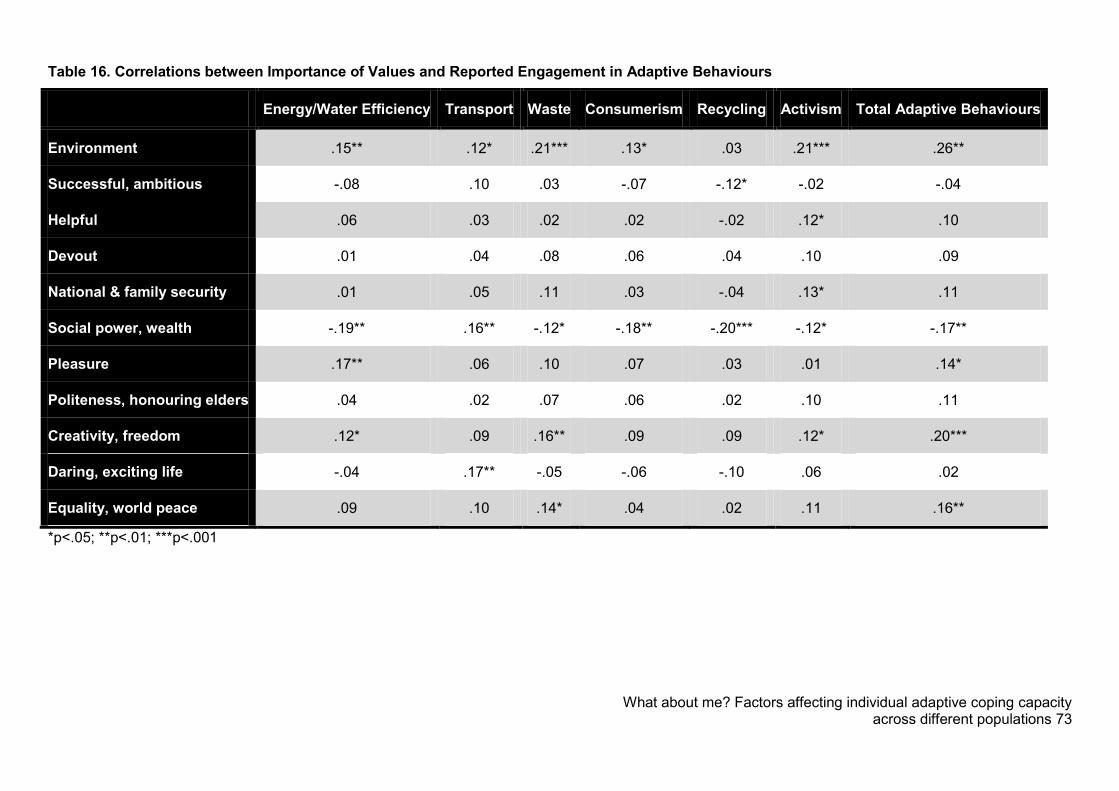
What about me? Factors affecting individual adaptive coping capacity across different populations 73
Table 16. Correlations between Importance of Values and Reported Engagement in Adaptive Behaviours
Energy/Water Efficiency Transport Waste Consumerism Recycling Activism Total Adaptive Behaviours
Environment .15** .12* .21*** .13* .03 .21*** .26**
Successful, ambitious -.08 .10 .03 -.07 -.12* -.02 -.04
Helpful .06 .03 .02 .02 -.02 .12* .10
Devout .01 .04 .08 .06 .04 .10 .09
National & family security .01 .05 .11 .03 -.04 .13* .11
Social power, wealth -.19** .16** -.12* -.18** -.20*** -.12* -.17**
Pleasure .17** .06 .10 .07 .03 .01 .14*
Politeness, honouring elders .04 .02 .07 .06 .02 .10 .11
Creativity, freedom .12* .09 .16** .09 .09 .12* .20***
Daring, exciting life -.04 .17** -.05 -.06 -.10 .06 .02
Equality, world peace .09 .10 .14* .04 .02 .11 .16**
*p<.05; **p<.01; ***p<.001
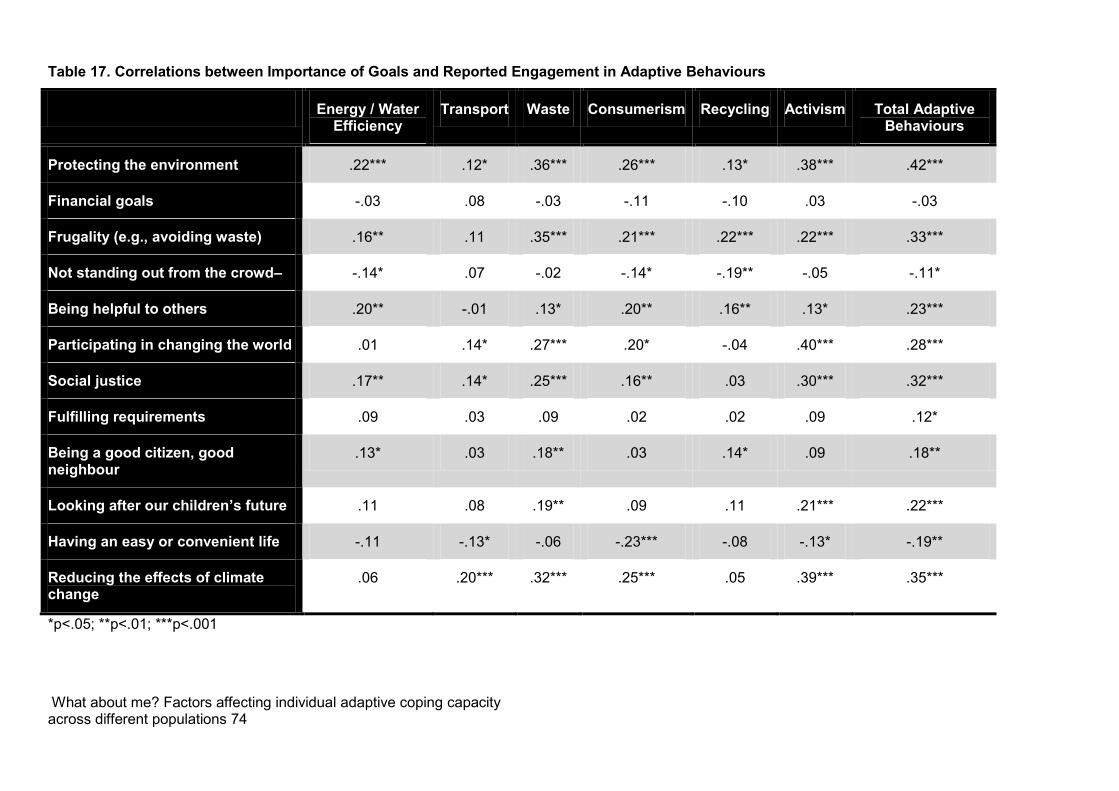
What about me? Factors affecting individual adaptive coping capacity across different populations 74
Table 17. Correlations between Importance of Goals and Reported Engagement in Adaptive Behaviours
Energy / Water Efficiency
Transport Waste Consumerism Recycling Activism Total Adaptive Behaviours
Protecting the environment .22*** .12* .36*** .26*** .13* .38*** .42***
Financial goals -.03 .08 -.03 -.11 -.10 .03 -.03
Frugality (e.g., avoiding waste) .16** .11 .35*** .21*** .22*** .22*** .33***
Not standing out from the crowd– -.14* .07 -.02 -.14* -.19** -.05 -.11*
Being helpful to others .20** -.01 .13* .20** .16** .13* .23***
Participating in changing the world .01 .14* .27*** .20* -.04 .40*** .28***
Social justice .17** .14* .25*** .16** .03 .30*** .32***
Fulfilling requirements .09 .03 .09 .02 .02 .09 .12*
Being a good citizen, good neighbour
.13* .03 .18** .03 .14* .09 .18**
Looking after our children’s future .11 .08 .19** .09 .11 .21*** .22***
Having an easy or convenient life -.11 -.13* -.06 -.23*** -.08 -.13* -.19**
Reducing the effects of climate change
.06 .20*** .32*** .25*** .05 .39*** .35***
*p<.05; **p<.01; ***p<.001
What about me? Factors affecting individual adaptive coping capacity across different populations 75
3.5.6 Hypothesis Testing: Relationships between Individual Differences, Goals, Coping and Adaptive Behaviours
In general, this study set out to examine how individual differences (such as core self-evaluation and free-market ideology), goals (such as environmental goals), goal structure, coping and appraisals affected adaptive behaviours. To examine our overall models, we used path analyses tested via structural equation modelling to identify both the fit of the model to the data and the significance of the loading of the individual constructs.
We examined three different adaptive behaviours covering both individual actions and societal actions, namely support for governmental policies.
The first was self-reported adaptive behaviours. For these analyses, we used the sum of the self-reported engagement across the six different types of behaviours.
The second was a more behavioural measure of adaptive behaviour: At the end of the survey we asked people if they were willing to sign a petition to go to the Federal Environment Minister to increase renewable energy. They were given four possible responses with increasing effort required (1 – I am not interesting in signing this petition; 2 – I would like to sign the petition and use the standard text provided; 3 – I would like to sign the petition and either alter or add to the standard text to personalize the message (see below); 4 – I would like to sign the petition and write my own personal message on this issue (see below)), before moving on to actually completing the petition. In this way, we hoped to avoid both common method bias and social desirability biases.
The final set of questions focused on support for policies. We asked participants the degree to which they agreed with the following policies (on a 5-point scale): Putting a price on carbon; Regulating a move to greener fuels and lower-emissions energy; Stronger regulation of companies and their carbon emissions; More incentives for taxpayers to reduce their energy and water use; More punishments for taxpayers who do not reduce their energy and water use; Funding research in producing lower-emissions products; Regulating the building of houses to improve efficiency; Mandating smart-meter installation (at home owner’s expense); More punishments for companies who do not reduce their emissions. We calculated an overall support for policy measure by adding up the participants’ responses to each of these items.
We hypothesised that, in general, there would be three main pathways to the three types of adaptive behaviour.
1. First was the coping with climate change route. In this pathway, an appraisal of threat (climate change is a threat to me and my way of life) would be related to the expression of emotion coping style (because of the threat) and active adaptive coping style (because of the action orientation of the appraisal) and these would be related to adaptive behaviour.
2. The second pathway was through goals. A great deal of research has shown that having an environmental value would be related to adaptive behaviours
What about me? Factors affecting individual adaptive coping capacity across different populations 76
(e.g., Stern, 2000). In addition, however, we believe that it is not only environmental goals that would be important. We hypothesise that as long as the person believes that the adaptive behaviours help them to achieve their important goals (whether they are green or not green) they will engage in the behaviour (goal connectedness). Moreover, we hypothesise that this perception will affect a person’s coping with climate change.
3. The final pathway was the negative pathway that hinders engagement in adaptive behaviours. In this pathway, we propose that a free market ideology will promote a denial appraisal of the situation which will have a negative effect on adaptive behaviours.
In addition to these three pathways, we included measures of positive and negative affect, a measure of capability (core self-evaluation) and political orientation (scored such that a ‘0’ represents an affiliation with the Liberal or National parties and a ‘1’ represents an affiliation with the Labor or Greens parties).
3.5.6.1 Self-reported adaptive behaviours Our first model included the three pathways, positive and negative affect, and core self- evaluation (political affiliation was not included for this dependent variable as it was not politically-related). However, the model did not fit the data at all well (2 = 265.44, df = 25, p<.001; CFI = .78; NFI = .78; RMSEA = .14). When examining the model, the affect variables were not significantly related to the other variables as expected; modification of the model with fewer relationships with positive and negative affect did not significantly improve the fit. Therefore, both positive and negative affect were removed from these analyses.
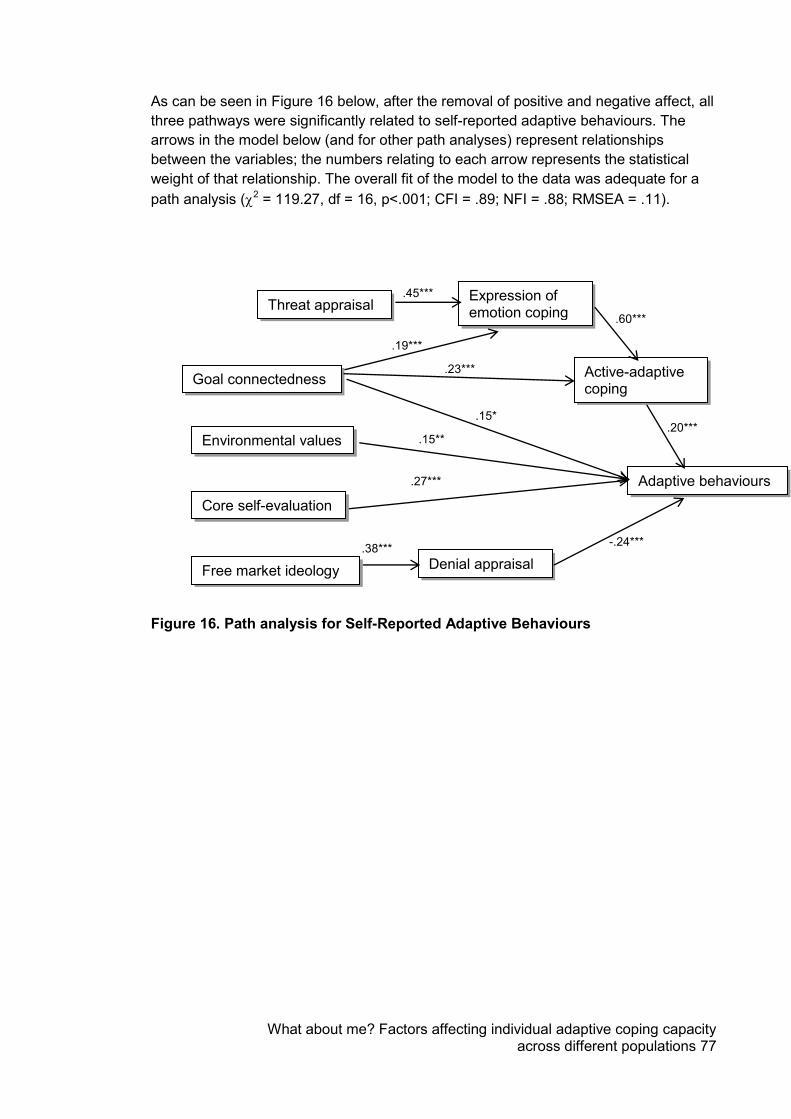
What about me? Factors affecting individual adaptive coping capacity across different populations 77
As can be seen in Figure 16 below, after the removal of positive and negative affect, all three pathways were significantly related to self-reported adaptive behaviours. The arrows in the model below (and for other path analyses) represent relationships between the variables; the numbers relating to each arrow represents the statistical weight of that relationship. The overall fit of the model to the data was adequate for a path analysis (2 = 119.27, df = 16, p<.001; CFI = .89; NFI = .88; RMSEA = .11).
Figure 16. Path analysis for Self-Reported Adaptive Behaviours
.23***
.19***
-.24*** .38***
.27***
.15**
.15* .20***
.60***
.45*** Threat appraisal Expression of
emotion coping
Active-adaptive coping
Adaptive behaviours
Goal connectedness
Environmental values
Core self-evaluation
Free market ideology Denial appraisal
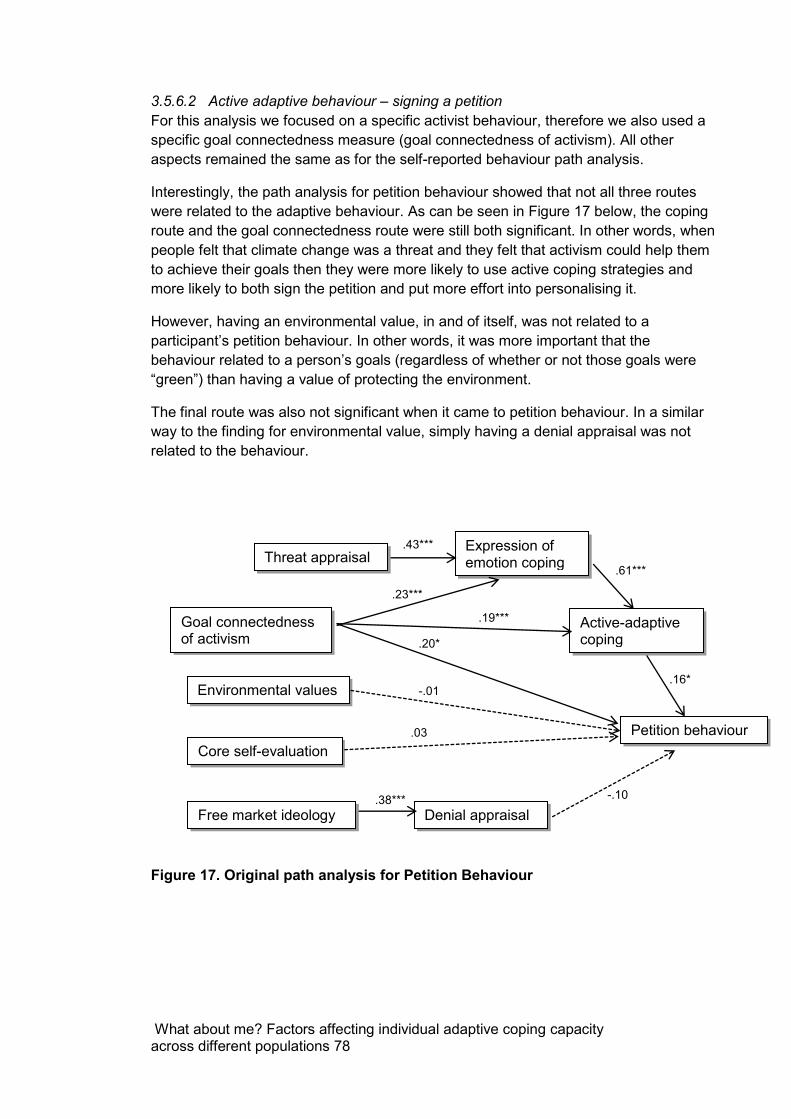
What about me? Factors affecting individual adaptive coping capacity across different populations 78
3.5.6.2 Active adaptive behaviour – signing a petition For this analysis we focused on a specific activist behaviour, therefore we also used a specific goal connectedness measure (goal connectedness of activism). All other aspects remained the same as for the self-reported behaviour path analysis.
Interestingly, the path analysis for petition behaviour showed that not all three routes were related to the adaptive behaviour. As can be seen in Figure 17 below, the coping route and the goal connectedness route were still both significant. In other words, when people felt that climate change was a threat and they felt that activism could help them to achieve their goals then they were more likely to use active coping strategies and more likely to both sign the petition and put more effort into personalising it.
However, having an environmental value, in and of itself, was not related to a participant’s petition behaviour. In other words, it was more important that the behaviour related to a person’s goals (regardless of whether or not those goals were “green”) than having a value of protecting the environment.
The final route was also not significant when it came to petition behaviour. In a similar way to the finding for environmental value, simply having a denial appraisal was not related to the behaviour.
Figure 17. Original path analysis for Petition Behaviour
.19***
.23***
-.10 .38***
.03
-.01
.20*
.16*
.61***
.43*** Threat appraisal
Expression of emotion coping
Active-adaptive coping
Petition behaviour
Goal connectedness of activism
Environmental values
Core self-evaluation
Free market ideology Denial appraisal
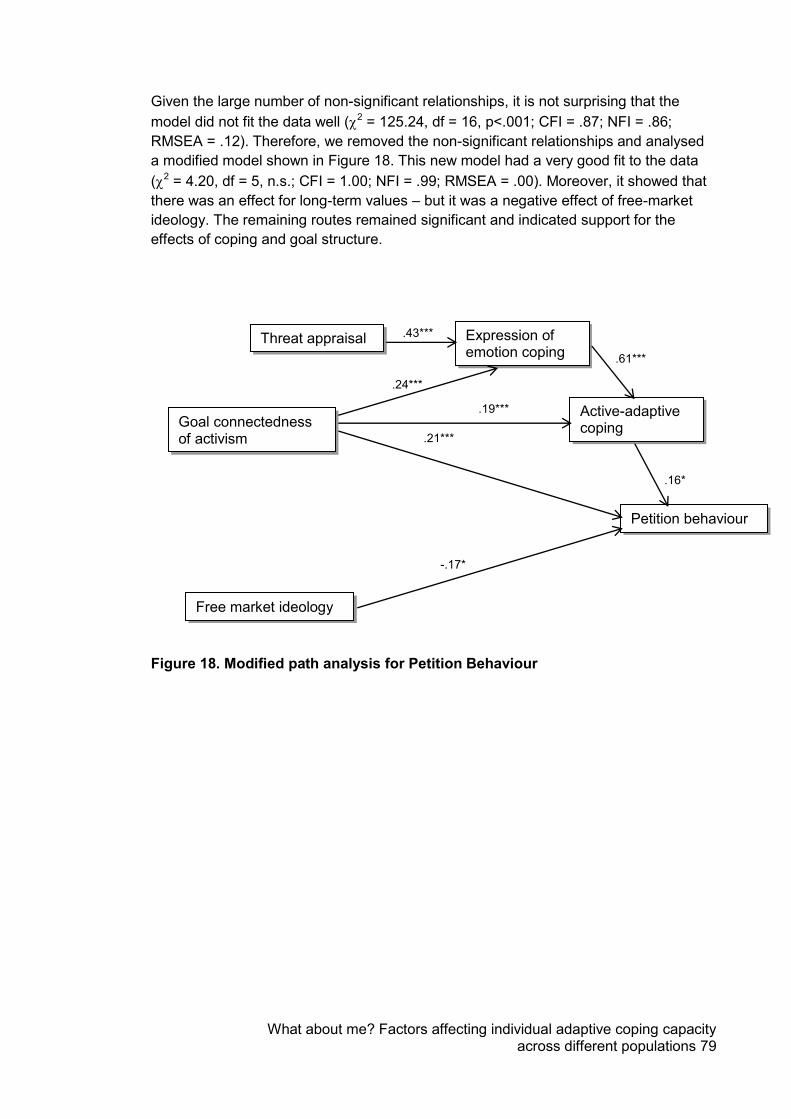
What about me? Factors affecting individual adaptive coping capacity across different populations 79
Given the large number of non-significant relationships, it is not surprising that the model did not fit the data well (2 = 125.24, df = 16, p<.001; CFI = .87; NFI = .86; RMSEA = .12). Therefore, we removed the non-significant relationships and analysed a modified model shown in Figure 18. This new model had a very good fit to the data (2 = 4.20, df = 5, n.s.; CFI = 1.00; NFI = .99; RMSEA = .00). Moreover, it showed that there was an effect for long-term values – but it was a negative effect of free-market ideology. The remaining routes remained significant and indicated support for the effects of coping and goal structure.
Figure 18. Modified path analysis for Petition Behaviour
-.17*
.21***
.16*
.61***
.43*** Threat appraisal Expression of emotion coping
Active-adaptive coping
Petition behaviour
Goal connectedness of activism
Free market ideology
.19***
.24***

What about me? Factors affecting individual adaptive coping capacity across different populations 80
3.5.6.3 Societal adaptive behaviour – support for policies The final path analyses examined support for policies. As this could be influenced by political orientation (regardless of what policies are being discussed) we included that as a control variable. The original path analysis model is presented in Figure 19.
Interestingly, climate change coping was not related to support for policies. These coping strategies are focused on individual action and it appears that they do not translate to broader social action. Having an environmental value also did not translate into support for governmental action. Finally, as hypothesised, free market ideology was related to a denial appraisal which was related, in turn, to disagreement with the proposed policies.
The overall fit of the model to the data was not good (2 = 170.96, df = 19, p<.001; CFI = .86; NFI = .85; RMSEA = .12).
Figure 19. Original path analysis for Policy Support
.23***
.19***
.27***
-.25***
.39***
.09
.03
.32***
.04
.61***
.45*** Threat appraisal Expression of
emotion coping
Active-adaptive coping
Support for policies
Goal connectedness
Environmental values
Core self-evaluation
Free market ideology Denial appraisal
Political orientation
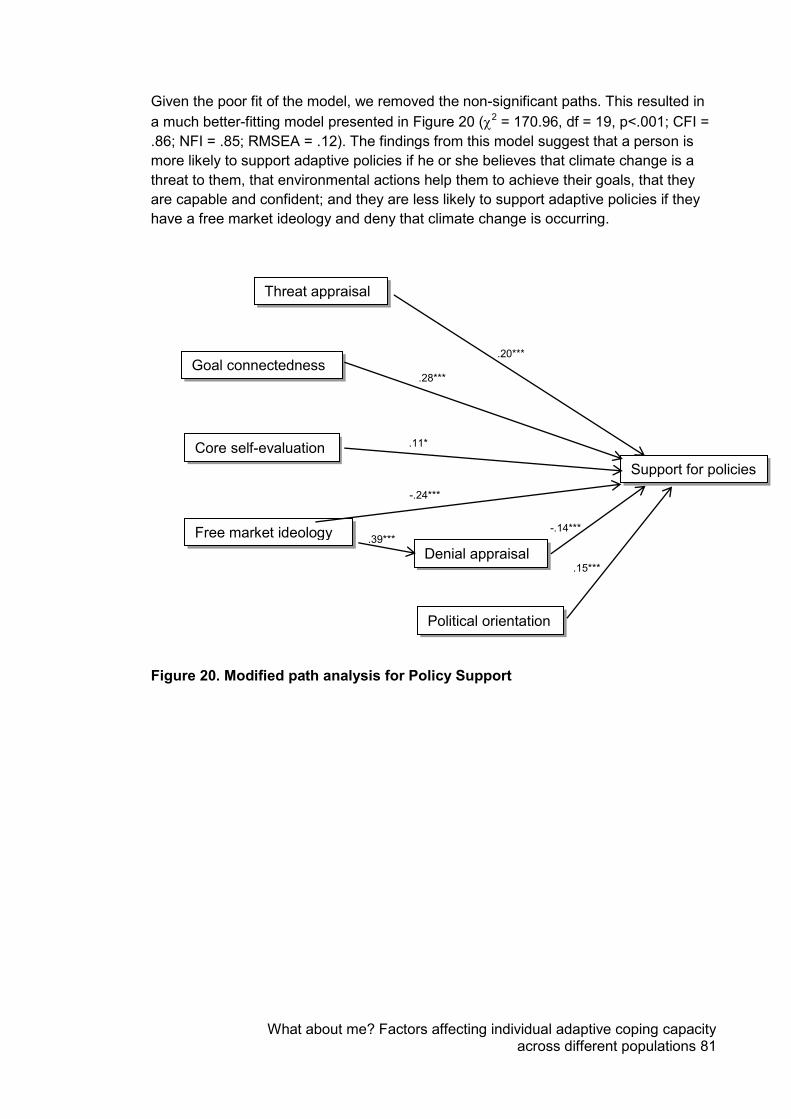
What about me? Factors affecting individual adaptive coping capacity across different populations 81
Given the poor fit of the model, we removed the non-significant paths. This resulted in a much better-fitting model presented in Figure 20 (2 = 170.96, df = 19, p<.001; CFI = .86; NFI = .85; RMSEA = .12). The findings from this model suggest that a person is more likely to support adaptive policies if he or she believes that climate change is a threat to them, that environmental actions help them to achieve their goals, that they are capable and confident; and they are less likely to support adaptive policies if they have a free market ideology and deny that climate change is occurring.
Figure 20. Modified path analysis for Policy Support
-.24***
.15***
-.14*** .39***
.11*
.28***
.20***
Threat appraisal
Support for policies
Goal connectedness
Core self-evaluation
Free market ideology Denial appraisal
Political orientation
What about me? Factors affecting individual adaptive coping capacity across different populations 82
3.5.7 Strengths, Limitations and Summary of Findings from Study Three In this study, we examined the role of individual differences, goals, goal structure, and coping in influencing adaptive behaviours such as self-reported behaviours, signing a petition and support for adaptive policies. We used a national sample across all age groups and equally split across both male and female. Given the nature of panel samples, it might be that this sample is oriented towards those at a lower income level than is represented across Australia. However, the large number of people sampled means that many biases are likely to be minimised. While we used mostly self-report measures, we separated these in time so that people would not be influenced in their responses by what they had said previously.
The analyses found that:
When a participant holds environmental goals, they are more likely to engage in adaptive behaviours;
However, they are also likely to engage in adaptive behaviours if they have certain hedonistic and societal goals;
Self-reported adaptive behaviours were related to adaptive coping, goal connectedness and environmental goals, and a denial appraisal. In other words, participants were more likely to report engaging in adaptive behaviours if they believed that climate change was a threat and they used appropriate active and adaptive coping strategies; if they believed that protecting the environment was an important goal; if they felt that engaging in adaptive behaviours would help them to achieve their important goals (regardless of whether they are related to climate change or not); and they were less likely to engage in these behaviours if they had a free market ideology and denied that climate change was occurring;
The behavioural measure of adaptive behaviour (signing a petition) was related to coping and goal connectedness. In other words, participants were more likely to sign the adaptive petition if they believed that climate change was a threat and they were using active and adaptive coping strategies; and if they believed that engaging in activist behaviours would help them to achieve their important goals (regardless of whether or not those goals were related to the environment/climate change or not);
Finally, support for policies was related to goal connectedness, threat appraisal and denial appraisal. In other words, participants were more likely to support adaptive policies when they believed that climate change was a threat and they felt that adaptive behaviours would help them to achieve their important goals (regardless of whether or not those goals were related to the environment/climate change or not); they were less likely to support adaptive policies when they believed that climate change was not happening.
What about me? Factors affecting individual adaptive coping capacity across different populations 83
3.6 Study Four – How do political orientation and goals affect adaptation and can we manipulate those?
This study was led by the UWA Business School team of Kerrie Unsworth, Jon Heath and Illy McNeill. It was designed to achieve a number of aims: 1) Further investigate the potential for changing an individual’s goal structure; 2) Identify whether beliefs and attitudes change when their political affiliation is made salient; and 3) Replicate the findings from Studies Two and Three on the relationships between goal importance, goal connectedness and adaptive behaviour using a national sample of working adults. This study was partly funded by NCCARF and partly funded by UWA.
This study replicated the findings from the previous two studies regarding the importance of goal connectedness in increasing adaptive behaviour, rather than just preaching to the converted.
In addition, however, we also tested an adjunct question to the role of adaptation. Notably, this study showed that when people started thinking about politics, their perception about how much humans contributed to climate change dropped significantly. Moreover, people who affiliated with Labor or Greens parties who had medium levels of cognitive complexity decreased their support for a policy on putting a price on carbon when they thought about politics. These findings are important for communicating climate change science and policies as we move towards adaptation.
3.6.1 Sample
Six hundred and one people participated in our online study. Participants were recruited from an accredited survey panel organisation and were screened to ensure that they had not completed a similar survey in the last four weeks and were Australian working adults over the age of 18. We deleted any responses that were not complete or indicated an inappropriate response (such as selecting the same response across every question). This left us with 581 participants. Of those, 51.8% were female and most had a TAFE/trade qualification or higher level of education (8.5% year 10; 22% year 12; 37.5% TAFE/trade; 23.5% Bachelor degree; 6.4% Masters degree; 2.1% PhD). The mean age was 46.46 years old with a standard deviation of 15.32 years. Political orientation was spread across the four major parties and independents: 37.5% affiliated with the Labor Party; 30.4% with the Liberal Party; 3.8% with the National Party; 14.6% with the Greens Party; and 13.7% with independents.
3.6.2 Experimental Design This study was a 2 (environmental goal salience vs. control) x 2 (political salience vs. control) design. The first manipulation was similar to that of Study Two where we
What about me? Factors affecting individual adaptive coping capacity across different populations 84
attempted to change an individual’s goal structure. In this study, we had two rather than three conditions: a control condition where no information was provided and an experimental condition. In the experimental condition, when participants were asked to rate the degree to which a specific set of behaviours (e.g., recycling) were helpful to achieving a list of goals they were asked to “think carefully about how helpful these behaviours might be. Think creatively and deeply – the relationships might not be obvious. For example, you might initially think that “cycling to work” is not helpful to you being a good citizen, but upon reflection you might realise that it helps your neighbours by not creating traffic on the streets.” Due to the failure of the manipulation in Study Two to increase the connectedness of the environmental values, identities and goals, in this study we reminded participants at the start of each question (i.e., helpfulness for each behaviour) to ensure the manipulation was as strong as possible.
The second manipulation was designed to raise the salience of a participant’s political orientation. It was based on research from social psychology (Mirisola, Sibley, Boca, & Duckitt, 2007; Reynolds, Turner, Haslam, & Ryan, 2001). In our study we had two conditions. In the control condition, we did not include any salience manipulation. In the experimental condition, we asked participants, “In this study we are interested in the opinions of different people concerning climate change. In particular, the aim of this section is to make comparisons between those who support the Liberal or Nationals parties, and those who support the Labor or Green parties. First, we are interested in what characteristics describe people who support the Liberal or Nationals parties compared to people who support the Labor or Green parties. What are three words that characterise people who support the Liberal or National parties? What are three words that characterise people who support the Labor or Green parties? If you had to choose, who would you say you supported most?”
3.6.3 Measures A number of measures used for this study were also used in Study Three.
Goal importance o Similar to Study Three we measured goal importance by asking the
participants how important each of the following goals was to them personally, on a 5-point scale from “Not at all important” to “Very important”.
o The goals were: Financial goal (e.g., saving money, creating wealth) Frugality goal (e.g., avoiding waste) Not standing out from the crowd – doing what others do Being helpful to others Protecting the environment Participating in changing the world Social justice Fulfilling requirements, obligations or regulations Being a good citizen Looking after our children’s future Living an easy and convenient life Dealing with climate change
What about me? Factors affecting individual adaptive coping capacity across different populations 85
Goal structure
o Similar to Study Three we measured goal structure by asking the participants the degree to which they perceived that each type of behaviour would help them achieve specific goals (financial goal, frugality goal, environmental goal, not standing out from the crowd, being helpful to others, participating in changing the world, social justice, fulfilling requirements and obligations, being a good citizen, looking after our children’s future, living an easy and convenient life, and dealing with climate change). We then calculated a weighted sum of these ratings by multiplying the helpfulness rating with their rating of personal importance of each goal to create a measure of overall connectedness.
We measured some individual differences.
Cognitive complexity o We used the Bieri and colleagues (1966) approach to measuring
cognitive complexity which is based on the premise that individuals perceive their social environment using a different number of dimensions (Bieri et al., 1966; Kelly, 1955). We asked participants to rate 10 people that they knew in different roles (e.g., their mother, someone in authority) on 10 different dimensions (e.g., outgoing/shy, irresponsible/responsible). The degree to which those ratings were similar within the role indicated lower levels of cognitive complexity. We used the alternative approach to measurement that took into account not only identical scores but also “near misses” as this has been shown to have higher validity than simply assessing identical scores (Woehr, Miller, & Lane, 1998). Thus, high scores on the measure represent low cognitive complexity and low scores on the measure represent high cognitive complexity.
Climate change beliefs o Similar to Studies Three and Ten, we used the CSIRO measures of
climate change beliefs (Leviston & Walker, 2011). The first question asked participants to choose which of the following statements best describes your general attitude towards climate change. The statements were:
I do not believe in climate change I do not know whether climate change is happening or not I believe that climate change is happening but it’s just a natural
fluctuation in Earth’s temperatures I believe that climate change is happening and humans are
contributing to it o We also asked the follow-up question: How much do you think humans
contribute to/cause climate change? (as a percent of overall climate
What about me? Factors affecting individual adaptive coping capacity across different populations 86
change). Participants were asked to move a slider along to represent their belief about human contribution from 0% to 100%.
Our dependent variables in this study included both adaptive behaviour and adaptive capacity.
Adaptive behaviour intentions o We used the CSIRO scale of adaptive behaviours (Leviston & Walker,
2011). We modified the items slightly to assess the degree to which participants intended to engage in the behaviours in the next few weeks and months rather than in the past. We did this in order to capture any effect of the manipulation on future behaviour.
o Participants were asked to rate their intentions on a 5-point scale from “Not at all” to “A great deal”. The behaviours were:
Walk/cycle/take public transport Use or buy environmentally-friendly cleaning products Use or switch to appliances that are environmentally-friendly Where possible, buy products that are made locally Contact a government member about climate change Reduce the amount of gas and/or electricity I use around the
house Take part in a political campaign about an environmental issue Reduce the amount of water I use around the house and garden Turn lights off around the house Try to fix things rather than replace them Continue to have or switch to Green Power Electricity
Support for policies
o Similar to Study Three, to measure adaptive capacity, we assessed the degree to which people supported policies which could be implemented by State or Federal governments. Participants were asked the extent to which they agreed with each of the policies on a 5-point scale from “Strongly disagree” to “Strongly agree”.
o The policies were: Putting a price on carbon Regulating a move to greener fuels and lower-emissions energy
even if that means higher fuel prices Stronger regulation of companies and their carbon emissions More incentives for taxpayers to reduce their energy and water
use More punishments for taxpayers who do not reduce their energy
and water use Funding research into producing lower-emissions products Regulating the building of houses to increase energy efficiency Mandating smarter meter installation (at home owner’s expense) More punishments for companies who do not reduce their
energy and water use
What about me? Factors affecting individual adaptive coping capacity across different populations 87
Finally, we included some control variables.
Pro-environmental social desirability o To control for any biases due to self-deception, we included a measure
of social desirability. o We took the three strongest loading items from the two self-deception
subscales of the Environmental Social Desirability scale (Ewert & Galloway, 2009). Participants were asked to rate how well the items described them from 1 “Does not describe me at all” to 4 “Describes me very well”. There was also a “Not applicable” option. The items were:
My behaviour is consistent with my beliefs about environmental issues.
I know what actions I should take regarding how best to protect the environment.
I am always honest with myself about how I really feel about the environment.
I try to cover up mistakes I make in conversations about environmental issues.
I feel resentful when I don’t get my own way in a discussion about environmental issues.
It bothers me if people dislike me because of my views about the environment.
Political orientation o We asked participants what their most dominant political orientation
was. The options were: Labor party Liberal party Nationals party Greens party Independent
Demographics o We measured gender, age, number of children (and, if 0, whether they
wanted children in the future or not), postcode, and highest level of education.
What about me? Factors affecting individual adaptive coping capacity across different populations 88
3.6.4 Descriptives: Green & Non-Green Goals, Beliefs & Adaptive Behaviours
Similar to Studies Two and Three, we are able to provide some descriptive data about the participants’ goals, beliefs and behaviours. Compared with Study Three, in this sample of 578 working adults across Australia, we found that there was a slightly greater percentage of participants who believed in anthropogenic climate change and fewer who did not know whether climate change was happening as shown in Figure 21 below (however, it should be noted that this question was asked after a manipulation and therefore might not indicate a true reflection of the population).
Figure 21. Percentage of Participants with Different Climate Change Beliefs
0
10
20
30
40
50
60
I don't think thatclimate change is
happening
I have no ideawhether climate
change ishappening or not
I think that climatechange is
happening, but it'sjust a naturalfluctuation in
Earth'stemperatures
I think that climatechange is
happening, and Ithink that humansare contributing to
it
7.6 6.9
32.2
53.3
What about me? Factors affecting individual adaptive coping capacity across different populations 89
The importance of the different goals was similar to that of the previous study, with relatively high levels of importance being placed on protecting the environment but less importance being placed on reducing the effects of climate change (Figure 22).
Figure 22. Participants’ Rating of Goal Importance
Participants were asked their agreement with a range of policies and their responses are collated below (however, again, this question was asked after a manipulation and therefore may not indicate a true reflection of the population) (Figure 23).
Figure 23. Mean Ratings of Support for Policies
2.0
2.5
3.0
3.5
4.0
4.5
.0
.51.01.52.02.53.03.54.04.5
What about me? Factors affecting individual adaptive coping capacity across different populations 90
Next, we made comparisons across participants’ political orientation. Figures Figure 24 andFigure 25 below illustrate some of these differences. There were significant differences between participants who affiliated more with Labor or the Greens parties and those who affiliated more with Liberal or Nationals parties on anthropogenic contribution to climate change (F(4,568) = 25.51, p<.001), environmental goal importance (F(4, 568) = 12.11, p<.001), climate change goal importance (F(4, 568) = 15.22, p<.001), goal connectedness of adaptive behaviours (F(4, 568) = 4.79, p<.01), and intention to engage in adaptive behaviours (F(4, 568) = 6.90, p<.001).
Figure 24. Goal Connectedness of Categories of Adaptive Behaviours across Political Orientation
Figure 25. Self-Reported Intentions to Engage in Adaptive Behaviours across Political Orientation
0
50
100
150
200
250
300
Labor
Liberal
National
Greens
Independent
28
29
30
31
32
33
34
35
36
37
38
Adaptive Behaviours
Labor
Liberal
National
Greens
Independent
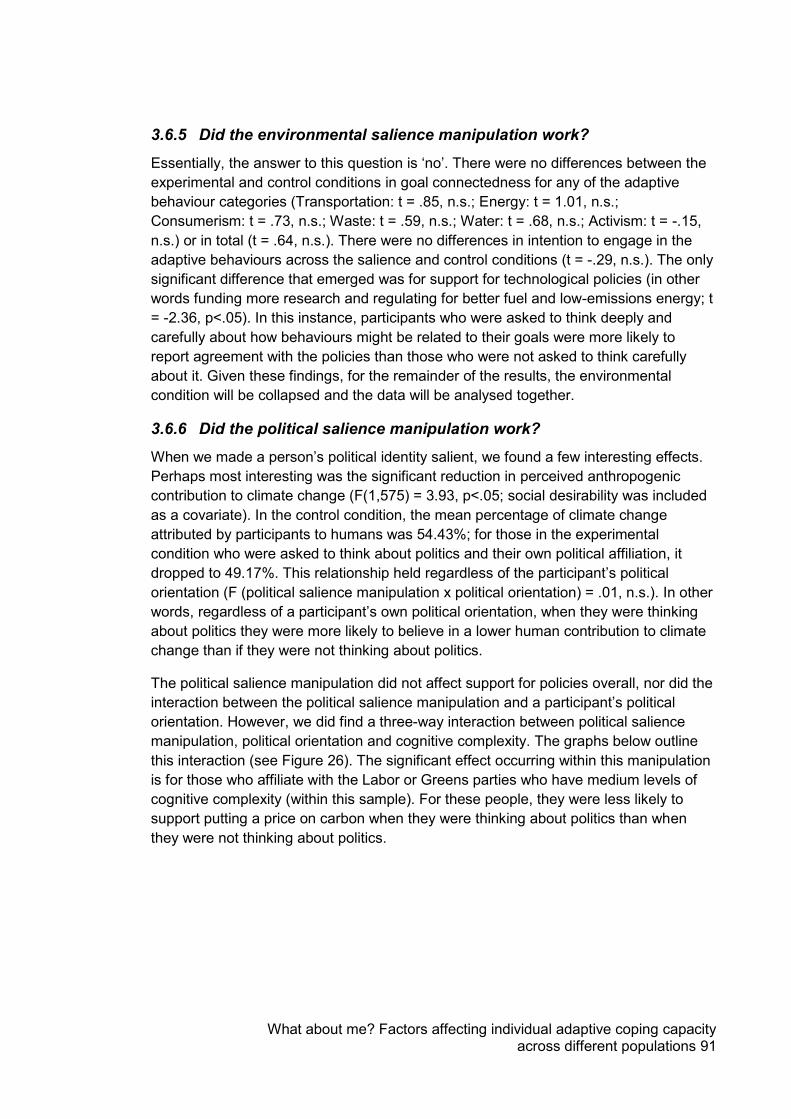
What about me? Factors affecting individual adaptive coping capacity across different populations 91
3.6.5 Did the environmental salience manipulation work?
Essentially, the answer to this question is ‘no’. There were no differences between the experimental and control conditions in goal connectedness for any of the adaptive behaviour categories (Transportation: t = .85, n.s.; Energy: t = 1.01, n.s.; Consumerism: t = .73, n.s.; Waste: t = .59, n.s.; Water: t = .68, n.s.; Activism: t = -.15, n.s.) or in total (t = .64, n.s.). There were no differences in intention to engage in the adaptive behaviours across the salience and control conditions (t = -.29, n.s.). The only significant difference that emerged was for support for technological policies (in other words funding more research and regulating for better fuel and low-emissions energy; t = -2.36, p<.05). In this instance, participants who were asked to think deeply and carefully about how behaviours might be related to their goals were more likely to report agreement with the policies than those who were not asked to think carefully about it. Given these findings, for the remainder of the results, the environmental condition will be collapsed and the data will be analysed together.
3.6.6 Did the political salience manipulation work? When we made a person’s political identity salient, we found a few interesting effects. Perhaps most interesting was the significant reduction in perceived anthropogenic contribution to climate change (F(1,575) = 3.93, p<.05; social desirability was included as a covariate). In the control condition, the mean percentage of climate change attributed by participants to humans was 54.43%; for those in the experimental condition who were asked to think about politics and their own political affiliation, it dropped to 49.17%. This relationship held regardless of the participant’s political orientation (F (political salience manipulation x political orientation) = .01, n.s.). In other words, regardless of a participant’s own political orientation, when they were thinking about politics they were more likely to believe in a lower human contribution to climate change than if they were not thinking about politics.
The political salience manipulation did not affect support for policies overall, nor did the interaction between the political salience manipulation and a participant’s political orientation. However, we did find a three-way interaction between political salience manipulation, political orientation and cognitive complexity. The graphs below outline this interaction (see Figure 26). The significant effect occurring within this manipulation is for those who affiliate with the Labor or Greens parties who have medium levels of cognitive complexity (within this sample). For these people, they were less likely to support putting a price on carbon when they were thinking about politics than when they were not thinking about politics.
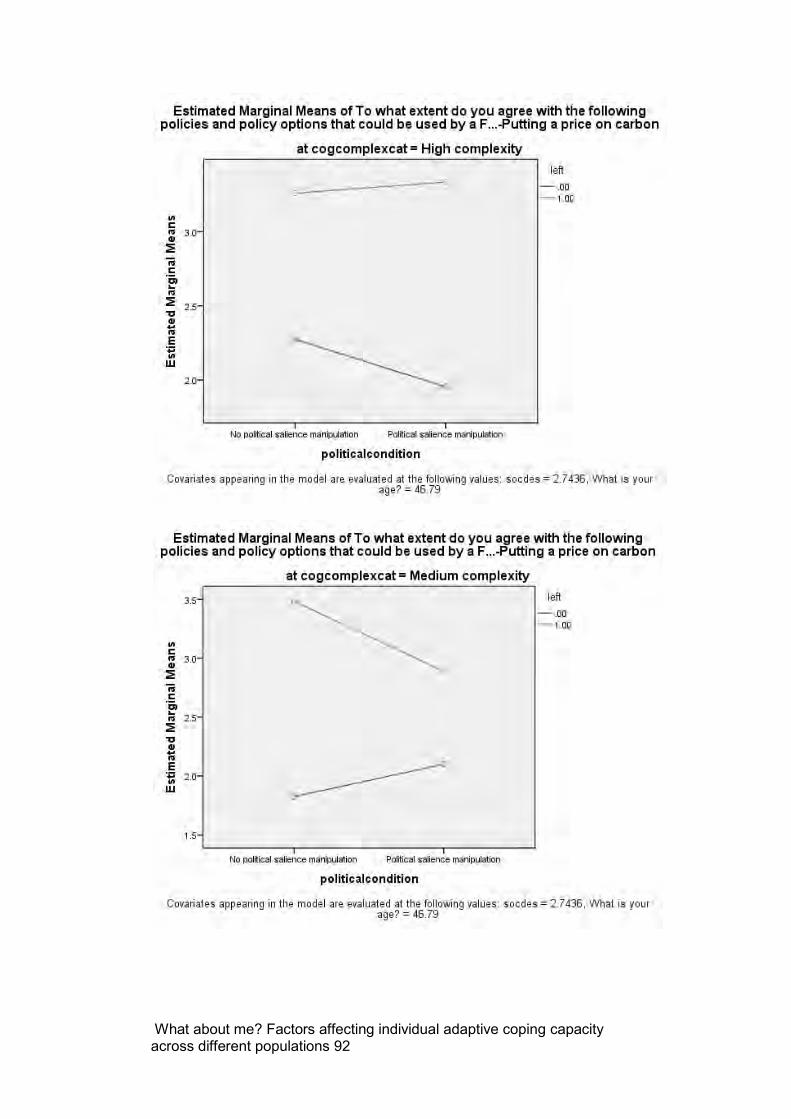
What about me? Factors affecting individual adaptive coping capacity across different populations 92
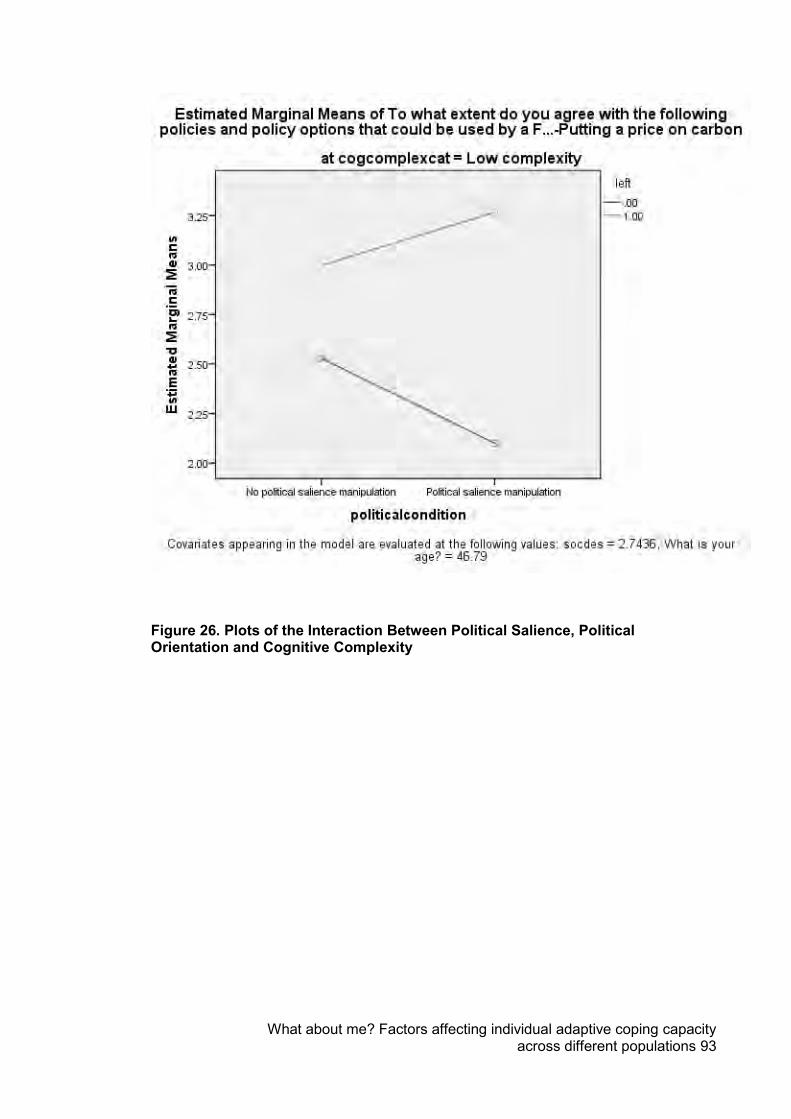
What about me? Factors affecting individual adaptive coping capacity across different populations 93
Figure 26. Plots of the Interaction Between Political Salience, Political Orientation and Cognitive Complexity
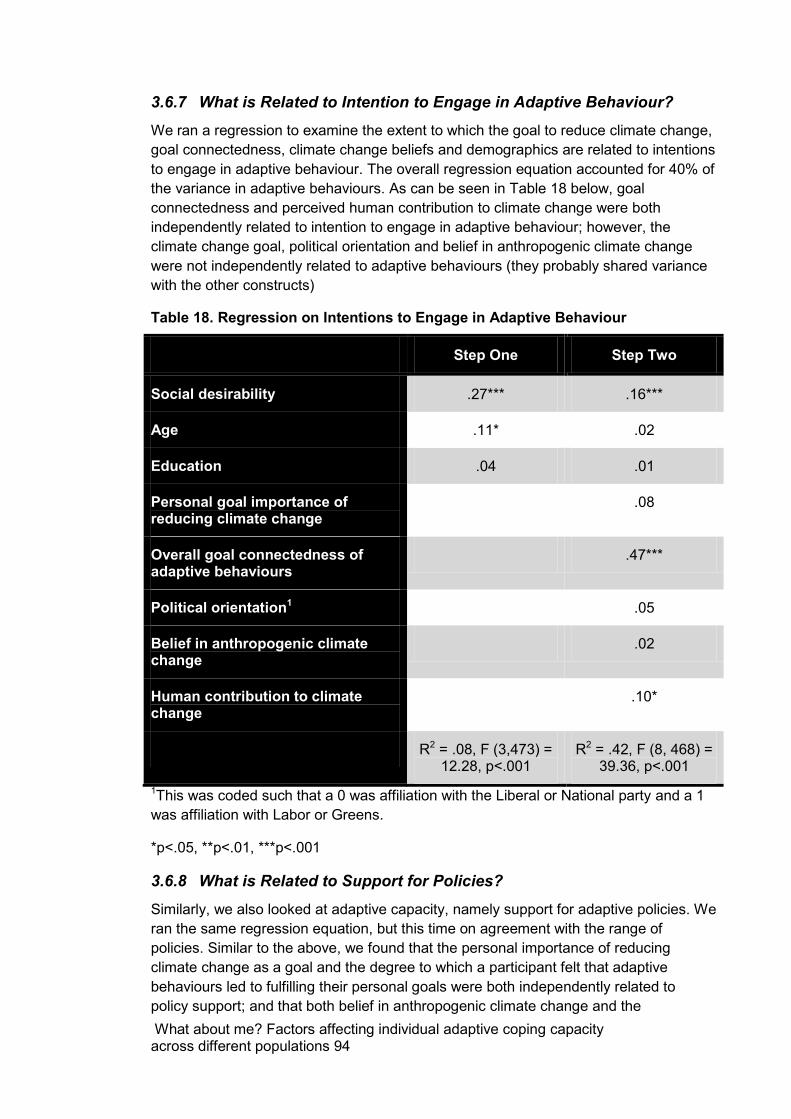
What about me? Factors affecting individual adaptive coping capacity across different populations 94
3.6.7 What is Related to Intention to Engage in Adaptive Behaviour? We ran a regression to examine the extent to which the goal to reduce climate change, goal connectedness, climate change beliefs and demographics are related to intentions to engage in adaptive behaviour. The overall regression equation accounted for 40% of the variance in adaptive behaviours. As can be seen in Table 18 below, goal connectedness and perceived human contribution to climate change were both independently related to intention to engage in adaptive behaviour; however, the climate change goal, political orientation and belief in anthropogenic climate change were not independently related to adaptive behaviours (they probably shared variance with the other constructs)
Table 18. Regression on Intentions to Engage in Adaptive Behaviour
Step One Step Two
Social desirability .27*** .16***
Age .11* .02
Education .04 .01
Personal goal importance of reducing climate change
.08
Overall goal connectedness of adaptive behaviours
.47***
Political orientation1 .05
Belief in anthropogenic climate change
.02
Human contribution to climate change
.10*
R2 = .08, F (3,473) = 12.28, p<.001
R2 = .42, F (8, 468) = 39.36, p<.001
1This was coded such that a 0 was affiliation with the Liberal or National party and a 1 was affiliation with Labor or Greens.
*p<.05, **p<.01, ***p<.001
3.6.8 What is Related to Support for Policies?
Similarly, we also looked at adaptive capacity, namely support for adaptive policies. We ran the same regression equation, but this time on agreement with the range of policies. Similar to the above, we found that the personal importance of reducing climate change as a goal and the degree to which a participant felt that adaptive behaviours led to fulfilling their personal goals were both independently related to policy support; and that both belief in anthropogenic climate change and the
What about me? Factors affecting individual adaptive coping capacity across different populations 95
percentage that humans are believed to contribute to climate change also both significantly and independently affect support for policies (see Table 19 below).
Table 19. Regression on Support for Policies
Step One Step Two
Social desirability .12** .03
Age .10* .11**
Education .08 .03
Personal goal importance of reducing climate change
.18***
Overall goal connectedness of adaptive behaviours
.10*
Political orientation1 .10*
Belief in anthropogenic climate change
.18***
Human contribution to climate change
.28***
R2 = .08, F (3,473) = 3.87, p<.01
R2 = .42, F (8, 468) = 42.09, p<.001
1This was coded such that a 0 was affiliation with the Liberal or National party and a 1 was affiliation with Labor or Greens.
*p<.05, **p<.01, ***p<.001
3.6.9 Strengths, Limitations and Summary of Findings from Study Four This study used an experimental design and a large, national sample to study the effect of goal connectedness, politics and cognitive complexity on adaptive behaviour. Again, unfortunately the goal connectedness manipulation did not work and a limitation of this study is the weakness of the manipulation relative to the stability of goal structure. Nonetheless, we experimentally manipulated awareness of politics and found significant changes. Another strength of this study was the spread of the sample across political orientations and education levels.
In summary, the results from Study Four suggest that:
It is difficult to manipulate the participants’ environmental goal connectedness;
What about me? Factors affecting individual adaptive coping capacity across different populations 96
When participants thought about politics, their perception of the human contribution to climate change dropped significantly;
Participants of medium cognitive complexity who affiliate with the Labor or Greens parties significantly decreased their support for a policy on putting a price on carbon when they thought about politics;
Participants were more likely to intend to engage in adaptive behaviours if they believed that those behaviours will help them to achieve their important goals (regardless of whether or not those goals are related to the environment/climate change or not), and believed there is a greater human contribution to climate change;
Participants were more likely to support policies if: o Reducing climate change was an important goal for them, o They believed that engaging in the behaviours would help them to
achieve their important goals, o They affiliated with the Labor or Greens parties, o They believed in anthropogenic climate change, and o They believed there is a greater human contribution to climate change.
What about me? Factors affecting individual adaptive coping capacity across different populations 97
3.7 Study Five – Does a commitment or progress orientation towards an environmental goal affect adaptive behaviour?
This study was led by the UWA Business School team, namely Illy McNeill, Kerrie Unsworth and Jon Heath. In addition, Phebe Ng Szw Hwei worked on this project as a partial requirement for the degree of Bachelor of Science with Honours in Psychology at the University of Western Australia. This study was funded only partially by NCCARF and predominantly by UWA.
The study was designed to examine whether goal-related behaviour (the goal being environmental sustainability) is influenced by whether people interpret the amount of goal-related behaviour they have recently completed in terms of progress towards that goal or in terms of commitment towards that goal, and what the role of task difficulty of the upcoming goal related behaviour would be. It did so in a controlled laboratory setting.
This study is important as it examines the different ways in which people view their adaptive achievements and the knock-on effects that that has. Although we did not find the expected result, it was a necessary first step in exploring the role that progress and commitment orientation may play in adaptive behaviours. Future studies will explore whether we can influence the way in which people view their adaptive achievements in other ways
3.7.1 Sample One hundred and thirty seven first-year Undergraduate Psychology students from the University of Western Australia (28 males and 109 females, Mage = 19.29, SD = 6.29) participated in the study. In order to ensure at least a mildly present green goal, participants were selected on the basis of a pre-screening procedure in which we measured the extent to which they had a green goal. This was done by using a 9-point (1= very strongly disagree, 9 = very strongly agree) Likert scale that measured the extent to which they agreed with three statements such as “I try to live in an environmentally sustainable manner.” Only those who had a slight to strong environmental sustainability goal (an average score between 6 and 8) were invited to sign up for the study on the school’s psychology website.
3.7.2 Experimental design The participants were randomly assigned to a 2 (Recent green behaviours performed: more than average vs. less than average) x 2 (Interpretation of recent behaviours: commitment vs. progress) x 2 (Current behaviour’s task difficulty: easy vs. difficult) between-subjects experimental design.
In this study we experimentally manipulated:
1. Recent green behaviours. o In order to manipulate the perceived amount of adaptive behaviours
already completed, participants were first asked to complete an

What about me? Factors affecting individual adaptive coping capacity across different populations 98
environmental sustainability questionnaire, and then received feedback regarding their past green behaviours in relation to the average UWA student. The environmental sustainability questionnaire measured the extent that the individual had engaged in an environmentally sustainable manner for the past two weeks. The questionnaire asked participants to answer 22 items such as “Over the past two weeks, how often do you recycle plastic?” on a 5-point (1= not at all or 0% of the time, 5 = all the time or 100% of the time) Likert scale1.
o Upon completion of the questionnaire, each participant received graphical feedback that showed either that he or she had behaved in a ‘greener’ manner (Figure 27) or less ‘green’ manner (Figure 28) than the average UWA student. In order to ensure the feedback was believable, those scoring in the upper quartile of the environmental sustainability questionnaire (mean score greater than 3.5) were presented with the “greener than average UWA student” feedback condition. Those who scored in the lower quartile (mean score less than 2.5) were automatically assigned to the “less green than average UWA student” feedback condition2. All remaining participants were randomly presented with one type of feedback or the other.
Figure 27. Recent green behaviours manipulation: Positive (greener than average) feedback condition
1 The environmental sustainability questionnaire was piloted amongst 67 Undergraduate students. The questionnaire initially consisted of 25 items, however, three items were removed to improve the Cronbach’s alpha level from .65 to .70. Thus, the remaining 22 items were included in the final environmental sustainability questionnaire. 2 Both the upper quadrant and the lower quadrant cut-off scores were based on the distribution of scores in the pilot data.
0
1
2
3
4
5
6
7
8
Participant UWA students
Gre
en
be
hav
iou
r sc
ore
s
What about me? Factors affecting individual adaptive coping capacity across different populations 99
Figure 28. Recent green behaviours manipulation: Negative (less green than average) feedback condition.
o In order to check if the recent behaviours manipulation had the intended
effects on participants’ goal pursuit, participants were asked “What type of score did you receive on the CSIRO Sustainable Living Questionnaire?” Participants had to pick one of the three given choices – “My score was better than the average UWA student score”, “My score was worse than the average UWA student score” or “My score was the same as the average UWA student score.
2. Behaviour interpretations manipulation.
o In order to manipulate participants’ behaviour interpretations, participants were asked to translate the received feedback into a rating of their level of commitment or progress to their green goal by indicating on a 5-point (1 = strongly disagree, 5 = strongly agree) Likert scale the extent to which they agreed with the statement “I am very committed to the aim to behave in an environmentally sustainable manner” (in commitment condition) or “I have made a lot of progress towards the aim to behave in an environmentally sustainable manner” (in progress condition). Fishbach and Dhar (2005) used a similar method to manipulate how participants interpreted past goal-related behaviours.
o To check whether the manipulation worked, participants were asked, “What was the statement about that you were asked to judge just after getting your score?” Participants were then asked to choose one of the three choices – “The statement was about what my score meant for my commitment to behaving in an environmentally sustainable manner.”, “The statement was about what my score meant for my progress
0
1
2
3
4
5
6
7
8
Participant UWA students
Gre
en
be
hav
iou
r sc
ore
s
What about me? Factors affecting individual adaptive coping capacity across different populations 100
towards behaving in an environmentally sustainable manner” or “I don’t remember”.
3. Task difficulty.
o The task difficulty manipulation was embedded in the main dependent variable, namely the amount of money donated to a green charity.
Based on analysing these manipulation checks, 40 participants were removed from the data set because they did not correctly recall the interpretation manipulation (22 participants could not remember which behaviour interpretation they received and the other 18 participants incorrectly recalled their behaviour interpretation). This resulted in 97 participants remaining in the data set that were included in the analysis.
There were two conditions of the dependent variable that measured adaptive behaviour in this study, one easy condition and one difficult condition.
Donation adaptive behaviour. o To measure the main dependent variable, namely the extent to which
participants would pursue a green goal, each individual was given the opportunity to donate money to charity. First, participants were told that they would receive an extra $5 for participating in this study. They were then given the opportunity to donate (all or part of) the $5 to the UWA Green initiative program, the Wheelchair Sports WA association, or a combination of both. They were also given the opportunity to tick a box that indicated they wanted to keep the money themselves. The UWA Green initiative program is an organisation that promotes environmentally sustainable behaviours within the university. Amount of money donated to this charity formed the main dependent variable of this study. The Wheelchair Sports WA was used as a control charity and does not have any relation to behaving in an environmentally friendly manner. The control charity was included to determine the extent to which the manipulations motivated participants to pursue a green goal (specific) rather than pursuing a general goal of generosity.
Donation difficulty manipulation.
o In order to manipulate task difficulty, participants in the difficult donation condition were told that if they wanted to donate, they would be required to go to another room on a different floor to make their donations, thus increasing the effort to donate. Those in the easy donation condition were told that if they wanted to donate, they could make their donations directly to the experimenter in the same room.
Finally, we also included two sets of control variables:
Demographic variables. o Among various extrinsic moderating variables, age and gender have
been identified as two variables that influence donation behaviours. According to Cialdini et al. (1987), helpfulness is considered a more important part of the socialisation process for females in society than for
What about me? Factors affecting individual adaptive coping capacity across different populations 101
males, thus females tend to donate more often. In relation to age, past literature has demonstrated that people’s attitudes towards charitable giving changed over time such that people tend to give more often as their age increases (Cialdini et al., 1987). Hence, it was important to be able to control for these variables in relation to donation behaviours.
Green goal importance. o Participants had to complete a goal importance questionnaire, which
consists of 12 goals such as “stay healthy” and “live in an environmentally sustainable manner”. They were asked to rate how important each goal is to them on a 9-point (1 = not important at all, 9= very important) Likert scale. Since goal importance is related to goal pursuit (Fishbach et al., 2011), the answer to the “live in an environmentally sustainable manner” item allowed the researchers to control for individual’s green goal importance in relation to donation behaviours.
3.7.3 Procedure Upon arrival in the lab, each participant was seated in front of a computer located in a cubicle room. An information sheet was provided and a written consent was obtained from each participant before they commenced the experiment. They were also asked to fill out several demographics questions on the computer before starting the tasks, and were given the opportunity to ask any questions they might have. They were allowed to begin as soon as the experimenter left the room.
First, they were asked to complete the goal importance questionnaire. Next, participants were asked to fill out the environmental sustainability questionnaire and were given feedback regarding their environmentally sustainable behaviours. Each individual was then asked to interpret this feedback in terms of either perceived commitment or progress towards the goal of behaving in an environmentally sustainable manner. Next, participants were asked to fill out several filler tasks. Finally, they were told that they would be given an extra $5 for participating in this study in addition to their credit point and received either the easy or difficult donation condition information. They were given the opportunity to donate (all or part of it) to either the UWA green initiative program, Wheelchair Sports WA association, a combination of both, or to keep all of it. More specific, they were asked to fill out how much, if anything, they wanted to donate to each charity on a form and to drop the donation form in a box that was located outside of the testing cubicle. They then completed the manipulation checks. Finally, each participant was given an open-ended questionnaire to complete which asked them about the assumed purpose of the experiment and they were again asked to drop it in the same box located outside the room. Upon completion of the experiment, they were debriefed about the whole experiment, including the manipulations. Before the experimenter dismissed the participants, they had to sign a form to indicate that they have indeed received $5 and that they were donating the amount that they had indicated on the donation form.
What about me? Factors affecting individual adaptive coping capacity across different populations 102
3.7.4 Preliminary analyses Prior to testing the hypotheses, a series of bivariate correlations were calculated to examine if the control variables had any influence on participants’ donation behaviours. Table 20 presents the bivariate correlations between gender, age, and green goal importance scores on the one hand and the amount of money donated to the green charity versus the wheelchair charity on the other. The only significant correlation at the p ≤ .05 was between importance of the green goal and money donated, with greater goal importance relating to larger donations being made to the green charity. Therefore, this variable was controlled for in all further analyses.
Table 20. Correlations between and Descriptives of Control Variables and the Amount of Money Donated to the Green Charity
Descriptives Correlations
Mean SD 1 2 3 4
1. Gender (0=f, 1=m) NA NA -
2. Age 19.22 6.13 .07 -
3. Green goal importance 6.46 1.10 -.13 .16 -
4. Donation green charity 1.67 1.55 .12 .09 .20* -
5. Donation wheelchair 2.88 1.72 -.06 -.05 -.10 -.64***
*p<.05, ***p<.001
3.7.5 Hypotheses Testing To test the hypotheses, a Univariate GLM with recent green behaviours, past behaviour interpretation, and donation difficulty as independent fixed factors, green goal importance as a covariate, and the amount of money donated to the green charity as the dependent variable was conducted. Results showed that the covariate of goal importance had a significant effect on the amount of money donated to the green charity, F (1, 88) = 5.44, p < .05. In other words, when a participant chose an environmental goal and felt that it was important to them, they were more likely to donate money to the green charity.
There were no significant main effects for recent green behaviours (F (1, 88) = 1.12, p = .29), for past behaviour interpretations (F (1, 88) = 2.16, p = .15), or for donation difficulty (F (1, 88) = 1.95, p = .17). The two-way interaction effect between recent green behaviours and past behaviour interpretation was not significant either (F (1, 88) < .01, p = .98). Thus, it did not matter whether or not people interpreted their behaviour as either progress or commitment; it did not affect their donation behaviour. Neither of the other two-way interactions were significant either, both F’s (1, 88) < 2.13, p’s > .15. Finally, the three-way interaction effect between recent green behaviours, past behaviour interpretations, and donation difficulty on the amount of money donated to the green charity was not significant, F (1,88) = .05, p = .83. In sum this means that
What about me? Factors affecting individual adaptive coping capacity across different populations 103
interpreting past behaviour in terms of progress versus commitment, believing you have done more or less than the average person, and donating being easy or difficult had no influence on the amount of money people donated.
Figures Figure 29 andFigure 30 show the means (circles) and the 95% confidence intervals of the means (lines) for the 8 tested conditions, with the easy donation conditions in Figure 29 and the difficult donation conditions in Figure 30.
Figure 29. The means and 95% CI’s for ‘Past Behaviour Interpretations and ‘Recent Green Behaviour’ in the ‘Easy Donation’ condition
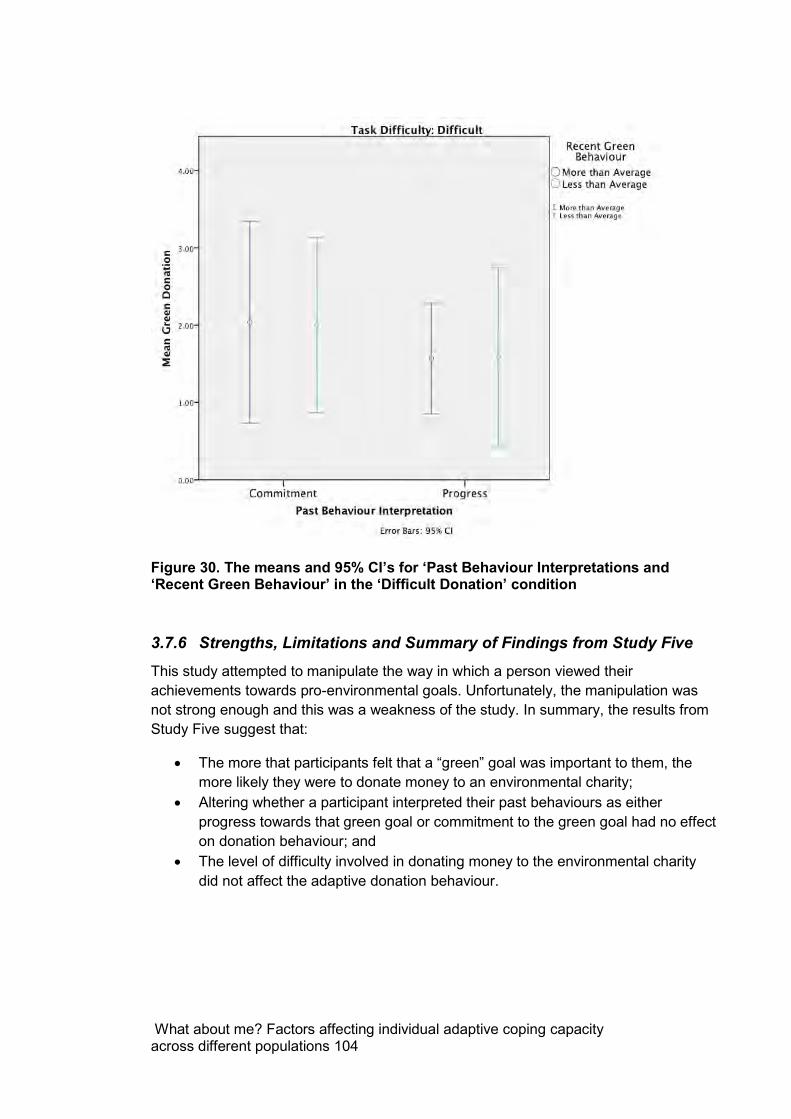
What about me? Factors affecting individual adaptive coping capacity across different populations 104
Figure 30. The means and 95% CI’s for ‘Past Behaviour Interpretations and ‘Recent Green Behaviour’ in the ‘Difficult Donation’ condition
3.7.6 Strengths, Limitations and Summary of Findings from Study Five
This study attempted to manipulate the way in which a person viewed their achievements towards pro-environmental goals. Unfortunately, the manipulation was not strong enough and this was a weakness of the study. In summary, the results from Study Five suggest that:
The more that participants felt that a “green” goal was important to them, the more likely they were to donate money to an environmental charity;
Altering whether a participant interpreted their past behaviours as either progress towards that green goal or commitment to the green goal had no effect on donation behaviour; and
The level of difficulty involved in donating money to the environmental charity did not affect the adaptive donation behaviour.

What about me? Factors affecting individual adaptive coping capacity across different populations 105
3.8 Study Six – How does top management support and organisational culture affect workplace adaptive behaviour?
This study was conducted by the team at Griffith University and University of Queensland, namely Sally Russell, Kelly Fielding and Alice Evans. In itself, it consisted of three steps: (A) pilot study of top management support and organisational culture; (B) pledge conducted at Mater Health Services; and (C) interviews with staff who participated in the pledge at Mater Health Services.
Past research has shown that making a pledge (or ‘commitment’) is an effective way of increasing engagement in various types of adaptive behaviour (e.g., energy conservation, recycling), and that pledging often results in long-term behaviour change (Abrahamse, Steg, Vlek, & Rothengatter, 2005; De Young, 1993; Lehman & Geller, 2004; Osbaldiston & Schott, 2012; Schultz, Oskamp, & Mainieri, 1995; Steg & Vlek, 2009). Pledging is also inexpensive and simple compared to other interventions (e.g., incentives). Study Six aimed to measure and evaluate the effectiveness of a Sustainability Pledge for workplace adaptive behaviour.
This study showed that people will engage in environmentally sustainable behaviours when they are easy to do and when they are perceived to have an impact. Employees also said that support from top management in the organisation and colleagues were important for encouraging people to be more sustainable in the workplace. These findings are consistent with the existing literature but they highlight the central role that management needs to play in efforts to promote organisational sustainability and climate change adaptation.
3.8.1 Step 1: Pilot Study – Top Management Support and Organisational Culture
3.8.1.1 Aim & Design This first step of the study aimed to pilot test the manipulations of the independent variables (top management support and organisational culture) in the context of a hypothetical pledge. Top management support is defined as the extent to which top management is supportive of workplace pro-environmental behaviour (Banerjee, Iyer, & Kashnap, 2003). Organisational culture (also known as internal environmental orientation) is defined as the degree to which environmental issues are considered in the goals, values, and day-to-day operation of the company (Banerjee et al., 2003).
It was a 2 x 2 independent groups, repeated measures design. The independent variables were top management support (2 levels: present, absent) and organisational culture (2 levels: present, absent). The dependent variables included environmental identity, environmental attitude, self-efficacy, positive emotion, negative emotion, pledge behaviour (number of behaviours pledged to), as well as basic demographic questions.
What about me? Factors affecting individual adaptive coping capacity across different populations 106
3.8.1.2 Sample The final sample consisted of 121 participants, obtained via an independent online panel provider (Qualtrics). Participants were required to be living in Australia, employed, and at least 18 years of age. The number of males and females were roughly equal: 61 males (50.4%), 59 females (48.8%); one participant did not disclose their gender. The average age was 47 years, and ranged from 22 to 75 years. Most were employed full-time (79.3%), with fewer part-time (12.4%), casuals (6.6%), and other (1.7%).
3.8.1.3 Measures & Procedure Participants completed two surveys approximately one week apart throughout January 2012. The first survey measured environmental identity (4-item scale, α = .768), environmental attitude (3-item scale, α = .869), self-efficacy (8-item scale, α = .905), positive emotion (8-item scale, α = .922), and negative emotion (8-item scale, .928). The second survey included the same measures again, with the addition of manipulations of the independent variables, the pledge, and manipulation checks for the independent variables. In order to manipulate top management support and organisational culture, participants were required to read through a hypothetical email to staff of a health care organisation, in which employees were invited to partake in a pledge. All four versions of the email contained basic information about the pledge, including what it involves, what it aims to achieve, and how to make a pledge. Depending on which condition the participant had been randomly allocated to, the email also either (a) contained information about top management support for the pledge, or (b) did not include this information; and either (a) contained information about the pledge being part of a wider organisational culture of environmental sustainability, or (b) did not contain this information. After having received this email, participants were then provided with an opportunity to indicate which (if any) behaviours they would pledge to.
3.8.1.4 Results There was no effect of the manipulations of top management support and organisational culture. There appeared to be no relationship or interaction between pledging behaviour and any of the dependent variables, except for gender (female) and environmental identity.
3.8.2 Step 2: Pledge at Mater Health Services
3.8.2.1 Aim & Design The aim of this step was to implement a pledge in a workplace setting, and to test the effect of top management support and organisational culture on pledging behaviour. The study was a 2 x 2 independent groups, repeated measures design. The independent variables were top management support (2 levels: present, absent) and organisational culture (2 levels: present, absent). The dependent variables included environmental identity, positive emotion, negative emotion, pledge behaviour (number of behaviours pledged to), top management support, organisational culture, pledge performance, as well as basic demographic questions.
What about me? Factors affecting individual adaptive coping capacity across different populations 107
3.8.2.2 Sample A random sample of 752 Mater Health Services staff were invited by email to participate in the pledge. The sample amounted to approximately 10% of all Mater Health Services staff. Fourteen staff responded to the pledge and baseline survey and four staff responded to the follow-up survey, resulting in response rates of 1.9% and 0.5% respectively. Due to the small sample size, demographic data are not presented here, as they may not be representative of Mater Health Services staff.
3.8.2.3 Measures & Procedure In February 2012, participants were invited by email to participate in an online sustainability pledge, two associated surveys, and an interview (all activities were voluntary). As per the pilot study, participants randomly received one of four different versions of the email invitation. All four versions contained basic information about the pledge (what it involves, what it aims to achieve, and how to make a pledge). Depending on which condition the participant had been randomly allocated to, the email also either (a) contained information about top management support for the pledge, or (b) did not include this information; and either (a) contained information about the pledge being part of a wider organisational culture of environmental sustainability, or (b) did not contain this information. After having received this email, participants were then provided with an opportunity to indicate which (if any) behaviours they would pledge to, and were asked to complete questions regarding environmental identity (4-item scale), positive emotion (8-item scale), negative emotion (8-item scale), as well as manipulation checks for top management support (3-item scale) and organisational culture (4-item scale). Approximately one month after completing the pledge and survey, those participants who consented were invited to partake in a follow-up survey. The follow-up survey contained measures of performance on the pledge (i.e., how successful participants were at carrying out their commitment), organisational culture (4-item scale), a qualitative question regarding emotions felt in response to the pledge, as well as basic demographic questions
3.8.2.4 Results In light of the low response rate and sample size, statistical analyses are unable to be conducted. In terms of descriptive statistics, Turning off lights, using refillable water bottles, taking stairs instead of the lift, turning off computers and monitors, and printing on both sides were the most frequently chosen behaviours. Three responses to the open-ended question about other behaviours to pledge to were received. All three of these responses focused on recycling:
“I will recycle paper, plastics and tins when bins are made available to do this”
“I would participate in and encourage recycling efforts should they be introduced”
“Recycle as much paper I use at work as possible”
What about me? Factors affecting individual adaptive coping capacity across different populations 108
Table 21 depicts the frequency at which each of the behaviours was chosen by participants of the pledge in order of most frequently chosen to least frequently chosen.
Turning off lights, using refillable water bottles, taking stairs instead of the lift, turning off computers and monitors, and printing on both sides were the most frequently chosen behaviours. Three responses to the open-ended question about other behaviours to pledge to were received. All three of these responses focused on recycling:
“I will recycle paper, plastics and tins when bins are made available to do this”
“I would participate in and encourage recycling efforts should they be introduced”
“Recycle as much paper I use at work as possible”
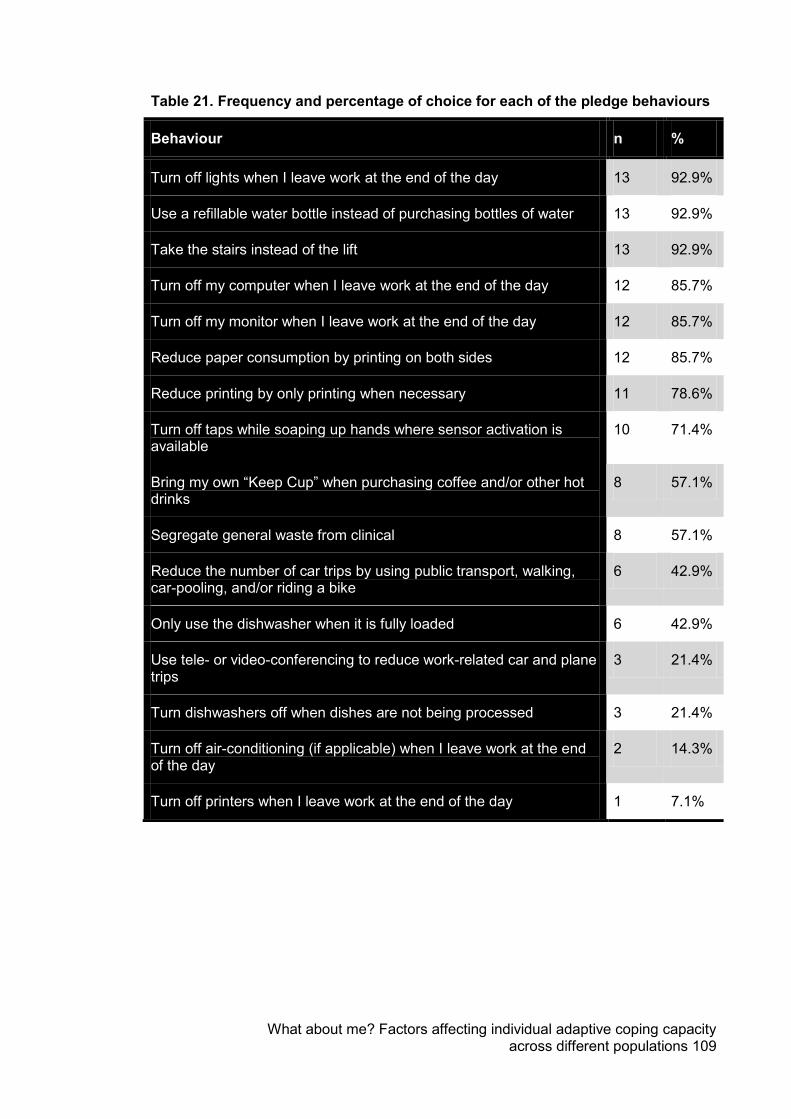
What about me? Factors affecting individual adaptive coping capacity across different populations 109
Table 21. Frequency and percentage of choice for each of the pledge behaviours
Behaviour n %
Turn off lights when I leave work at the end of the day 13 92.9%
Use a refillable water bottle instead of purchasing bottles of water 13 92.9%
Take the stairs instead of the lift 13 92.9%
Turn off my computer when I leave work at the end of the day 12 85.7%
Turn off my monitor when I leave work at the end of the day 12 85.7%
Reduce paper consumption by printing on both sides 12 85.7%
Reduce printing by only printing when necessary 11 78.6%
Turn off taps while soaping up hands where sensor activation is available
10 71.4%
Bring my own “Keep Cup” when purchasing coffee and/or other hot drinks
8 57.1%
Segregate general waste from clinical 8 57.1%
Reduce the number of car trips by using public transport, walking, car-pooling, and/or riding a bike
6 42.9%
Only use the dishwasher when it is fully loaded 6 42.9%
Use tele- or video-conferencing to reduce work-related car and plane trips
3 21.4%
Turn dishwashers off when dishes are not being processed 3 21.4%
Turn off air-conditioning (if applicable) when I leave work at the end of the day
2 14.3%
Turn off printers when I leave work at the end of the day 1 7.1%
What about me? Factors affecting individual adaptive coping capacity across different populations 110
3.8.3 Step 3: Interviews
3.8.3.1 Aim & Design In light of the low response rate to the pledge (Step 2), the aim of this step was to qualitatively explore and examine the factors that helped and hindered participation in the pledge, and the factors that resulted in success or failure at completing the pledge. In order to examine the emotional responses to climate change and pledging behaviour, the study also examined goal relevance, goal congruence, and ascription of blame.
3.8.3.2 Sample The final sample consisted of 5 participants, who had consented to partaking in an interview after having been involved in Step 2.
3.8.3.3 Measures & Procedure Throughout May 2012 participants were interviewed face-to-face by a research assistant. The interviews were recorded and transcribed for analysis. Examples of some of the questions from the interview schedule are as follows:
What motivated you to sign up to the pledge? How did it go? Were you able to carry out your commitment? If yes, what helped you? If not, what factors prevented you? Who or what do you think is the main cause of climate change? Whose responsibility do you think it is to address climate change? When you think about climate change how does it make you feel? Is climate change an important/relevant issue for MHS? To what extent do you think MHS is responsible for climate change? What are the benefits/advantages of MHS taking action on climate change? What are the harms/disadvantages of MHS taking action on climate change?
3.8.3.4 Results Participants reported different motivations for signing up to the pledge. Some reported that they wanted to “feel that I was making a difference in influencing what happened” and providing “peer modelling to my department”. Whereas others reported that it was more of an obligation “I thought… I better do it.”
Others reported that they took part in the pledge because:
“We only get one planet and we’re responsible for it really…if I can assist in any way I [will].”
Many participants reported not remembering what behaviours they pledged to engage in. This led to a suggestion by one participant to allow a print out of the pledged behaviours so that participants can be reminded of what they agreed to do in the coming months.
What about me? Factors affecting individual adaptive coping capacity across different populations 111
“To be honest I don’t remember…you do it online but there’s nothing at the end to go you can print this out or it gets emailed to you so you remember what you did.”
Participants also stated that they had pledged to engage in behaviours that they were already doing as part of their everyday practices, for example:
“I think it was doing things that I was already doing…turn off the computer…maybe some of my transport to and from work…I pretty much always do double sided paper.”
“I actually can’t remember…a lot of things I already did like turning light switches off, turning the computer screen off, recycling…that sort of thing.”
The reasons participants chose particular actions included doing things that were easy to do, and things that would have an impact, for example:
“Because they’re things that I can actually do…things that were practical to do. There might have been ones like taking public transport or cycling to work or things like that and they’re not all that compatible for me to do.”
“Because they were things that I knew I could personally change to reduce my impact.”
“Because I just think it’s something that needs to be done and people should be aware of.”
Most participants reported that they were able to successfully carry out the behaviours that they had pledged to, and that they were now engaging in these behaviours more often than before. For example:
“Oh yeah…maybe I wasn’t doing them all the time so I probably did it more regularly [after the pledge].”
“Yeah…now I just have my little Mater cup…I purchased two additional bins [for paper recycling].”
These factors included support from executive “I could see that there was support from the highest level”, other staff assisting “the staff empty the [recycling] bins everyday”, as well as more intrinsic reasons:
“I had my own sort of intrinsic, wanting to reduce my carbon footprint and environmental footprint.”
“I guess just knowing that I had made that pledge…I had made a commitment so I would like to follow that through.”
Some reported no barriers to engaging in the behaviours that they had pledged to: “no…they’re just basic simple ones that we can [do].” However others reported difficulties due to working with other people in an open plan office, and a lack of facilities to be able to carry out some of the behaviours. For example:
What about me? Factors affecting individual adaptive coping capacity across different populations 112
“Working with other people [in an open plan office]…The other one is paper because we use it a lot…sometimes you do need paper records.”
“…we have a cardboard recycling but we don’t have anything for plastic…it would be good to have something like that.”
During the interviews participants were also asked about their views on climate change. All participants agreed that people are the main cause of climate change:
“Just people in general, like I guess everybody contributes to it.”
“I think people are a cause [of] it…I think humans are having a bigger impact than what would have happened years and years ago.”
“I personally think that we have attributed to [climate change].”
Similarly, most participants agreed that everyone has a responsibility to address climate change, ranging from individuals through to organisations and government. For example:
“I think like everyone but I think there’s different levels…From the top down maybe, blaming the bigger corporations down to individual [people].”
“…there’s no one that’s not making an impact so I think it’s everybody’s duty to try and do something…I think all of us, everybody, companies, businesses, even a little hotel.”
Participants reported a wide range of benefits of taking action on climate change, including research and development “more money [being] put into research and design in solar or wind or water”, preserving the environment for future generations “they’re going to live here…so you’ve got to bear that in mind”, health benefits “having healthier staff and healthy environments…for people to work in”, as well as financial benefits “it [might] end up being cheaper to be more environmentally sustainable than unsustainable”.
In terms of the harms that might occur as a result of taking action on climate change, most people mentioned the costs involved:
“…It does come down to economics – if people are always penalised, I doubt they’re going to make changes…I think economics always outweighs common-sense…I think a lot of people it’s the cost of making a change…people always see that short term [cost].”
“…I think definitely cost…if suddenly their job triples because of oh we want to save a bit of paper or something then yeah that can be bad for business.”
“…there could be financial impacts from it”
“Well it’s not necessarily a profitable thing…”
In addition to cost, most people were also concerned about how they would appear to others by being environmentally friendly:

What about me? Factors affecting individual adaptive coping capacity across different populations 113
“…possible stigma or associations of wanting to be environmentally friendly from the people who don’t believe in climate change.”
“I think people are probably scared of what other people think of them for taking action…[there’s a perception that you’re] a bit of a freak, [or a] tree hugger.”
Differences emerged in terms of how people feel when they think about climate change. Some experienced positive emotions:
“I kind of have a bit of optimism or – realist but an optimist…hopefully there are people working in this area, doing research and I agree with the different ways to change. So I still kind of think there’s enough people with passion to try and look for different ways to halt climate change or influence government or influence use of power…it’s not all doom and gloom.”
“Fairly optimistic at the moment in that…the issue is coming to the forefront which is good and people are starting to think about it.”
However, some experienced negative emotions such as guilt and fear:
“I want my daughter to grow up and still be able to go and catch a fish and things like that. Sometimes you feel a little bit guilty about different things you’ve done and you think ah I shouldn’t have been so wasteful.”
“It’s a bit scary, I think…I’ve seen a massive change in climate myself and can see it…I just think it’s sad that animals are becoming extinct in a time when…we’re supposed to be intelligent human beings and have seen it happen in the past – we shouldn’t be allowing it.”
“It’s terrible. Knowing that we are contributing [to climate change]…that destruction is heartbreaking.”
Most participants indicated that climate change is an important/relevant issue for Mater Health Services:
“Exec are committed…the Mater, I think is very good at culture and communication, I do have great faith in the exec and believe what they say…I do feel like they’re behind and encouraging the changes. So yeah I do feel that they’re…supporting it, they’re doing something.”
“Yes. There’s certainly a commitment to things like promoting the Keep Cups…They’ve looked at waste management across the campus and have done a lot in that area…Obviously in appointing a sustainability manager [is] a commitment in itself from the organisation…And I know they’re doing things that are like way above my head across the road with their cooling towers and this and that and the other thing.”
However some people thought that Mater Health Services is only doing what is required of them by government legislation, for example:
What about me? Factors affecting individual adaptive coping capacity across different populations 114
“I think they’re just out to do whatever they have to do like any business is...I think they’ve changed a whole lot of stuff within it environmentally because [the council said] they had to.”
Most participants indicated that Mater Health Services, like other organisations, is responsible for climate change:
“A bit like any other business, they’ve probably done things that are wasteful and damaging to the environment in the past but at least now they’re more aware of that.”
“The same as everybody else.”
“Oh, like any other business or place – everybody’s responsible for it.”
“…the organisation is the people that are in it. So and my opinion is that people are responsible for things. So we have an equal responsibility, and being such a large organisation of 7,500 people we have 7,500 times the responsibility.”
Participants perceived a number of benefits of Mater Health Services taking action on climate change including brand reputation and image:
“…it’s got a good brand itself but just to retain that brand.”
“Well, I guess to be known as an employer that does care about more than just the bottom line. And showing that they’re taking action.”
“…I think it would be a good recruitment kind of message [to be seen] to be doing something about the environment, internally would have a very good image.”
Competitive advantage and business strategy were also mentioned:
“I think their long term business strategy, if they don’t start doing things then they won’t be as good a business as they could be in the next 20 years. Because for one, everyone else will start doing it so they’ll have to catch up…They’ll be seen as out-dated and their practices will be wrong so people won’t use their services as much.”
Finally, long-term financial benefits were also mentioned:
“There’s the financial benefits, maybe not in the first instance but over a long run.”
“ [there’s a financial benefit] if they did it properly.”
Cost was also discussed as a potential harm/disadvantage of Mater Health Services taking action on climate change, although the long-term financial gain was mentioned repeatedly:
“I think it always comes down to your bottom line…it’s got to pay off for them in the end.”
What about me? Factors affecting individual adaptive coping capacity across different populations 115
“Financial I think would be obviously the main one…I can’t see there being any other harms than financial.”
“The cost mainly…setting staff up and getting things done…everything comes down to the dollar.”
“It might be a minimal financial impact, but that’s probably offset against some of the savings that they’re making in other areas.”
3.8.4 Strengths, Limitations and Summary of Findings from Study Six This study investigated whether pledges were effective ways of increasing adaptive behaviour at an organisation where staff duties are perceived to sometimes conflict with that behaviour. In addition, the study explored the factors that might lead to increased behaviour. Unfortunately, a change in top management in the organisation during the study meant that not enough people participated in the study to conduct statistical analyses. However, interviews afterwards showed the complexity of thought and emotion involved in adaptive behaviour.
The findings from this study showed:
A range of thoughts and emotions are related to engaging in organisational adaptive behaviour.
Ease of use, top management support, stigmatisation, and emotions all played into whether or not a person pledged to increase their behaviour.
What about me? Factors affecting individual adaptive coping capacity across different populations 116
3.9 Study Seven – How do goal congruence, blame, and emotion affect adaptive behaviour and policy support?
Study Seven was conducted by the team at Griffith University and University of Queensland, namely Sally Russell, Kelly Fielding and Alice Evans. Again, it consisted of three steps: (A) pilot study of question wording; (B) pilot study of manipulations of goal congruence and blame; and (C) the main study to test the effect of goal congruence and blame on emotion, pro-environmental behaviour intentions, and policy support.
This study explored whether the alignment or misalignment between organisational values and climate change action had an impact on the experiences of employees. We found that when the organisation’s values were not aligned with adapting to climate change, employees felt disappointed. We also found that certain emotions were significantly related to climate change outcomes: employees who felt more enthusiastic, hopeful but also more worried in relation to climate change reported more intentions to engage in climate adaptive behaviours. Employees who felt more enthusiastic but also more worried and less happy were more supportive of implementing green policies in the workplace.
3.9.1 Step 1: Pilot Study – Question Wording
3.9.1.1 Aim & Design The aim of this step was to examine any differences in participants’ emotional responses to survey questions depending on how the question was worded. Specifically, we wanted to make a comparison between using the words ‘climate change’ and ‘environmental issues’. The latter involved describing the effects of climate change (e.g. sea level rise, increasing temperatures) without actually using the words ‘climate change’. The study was a one-way within-subjects (repeated measures) design. The independent variable was question wording (2 levels: climate change, environmental issues). The dependent variables included emotion, environmental social desirability, as well as basic demographic questions.
3.9.1.2 Sample The final sample consisted of 113 participants. Participants were recruited using three methods: (1) independent online panel provider (i-View); (2) advertisement in ‘Griffith News’ online newsletter; and (3) undergraduate UQ students. There were no significant differences in participants based on recruitment method. There were slightly more females (n = 70, 61.9%) than males (n = 43, 38.1%). The average age was approximately 37 years, and ranged from 19 to 72 years. Most were employed full-time (n = 40, 49.4%), with fewer part-time (n = 19, 23.5%), casuals (n = 11, 13.6%), self-employed (n = 9, 11.1%), and other (n = 2, 2.5%). Most participants resided in metropolitan areas (n = 80, 70.8%), with fewer residing in regional (n = 16, 14.2%) and rural areas (n = 14, 12.4%).
What about me? Factors affecting individual adaptive coping capacity across different populations 117
3.9.1.3 Measures & Procedure The survey was conducted in September 2012. Participants completed an online survey, asking for their emotional response to climate change and environmental issues. The presentation of survey questions was counterbalanced, so that approximately half were asked about climate change first and the remaining half were asked about environmental issues first. In between these two blocks of questions participants completed a filler task to prevent carry-over effects. The filler task was Ewert and Galloway’s (2009) environmental social desirability scale (24 items).
3.9.1.4 Results A paired-samples t-test was conducted to test the effect of question wording of the CCC (climate change vs. environmental issues) on positive emotion experienced. There was no significant effect of question wording on positive emotion experienced, t(110) = 1.038, p = .301.
A paired-samples t-test was conducted to test the effect of question wording (climate change vs. environmental issues) on negative emotion experienced. There was no significant effect of question wording on negative emotion experienced, t(111) = -1.777, p = .078.
However, in terms of the discrete emotions there was one significant effect. A paired-samples t-test revealed that participants were significantly more unhappy about environmental issues compared to climate change, t(107) = -2.493, p = .014
A paired-samples t-test was conducted to test if there was a significant difference in the amount of positive and negative emotions experienced in response to climate change. There was a significant difference, such that more negative emotions (M = 2.65) were experienced in response to climate change compared to positive emotions (M = 1.82), t(111) = -5.816, p < .001.
A paired-samples t-test was conducted to test if there was a significant difference in the amount of positive and negative emotions experienced in response to environmental issues. There was a significant difference, such that more negative emotions (M = 2.76) were experienced in response to environmental issues compared to positive emotions (M = 1.76), t(110) = -7.644, p < .001.
The general conclusion from these results is that the use of the words ‘climate change’ in surveys does not result in any emotional reactions different to those that are aroused in response to the words ‘environmental issues’, and therefore the words ‘climate change’ were used in subsequent studies.
3.9.2 Step 2: Pilot Study – Goal Congruence and Blame
3.9.2.1 Aim & Design The aim of this step was to pilot test the scenarios and manipulations of goal congruence and blame, to determine their suitability for use in Step 3 (the main study). The study was a 2 x 2 independent groups design. The independent variables were goal congruence (2 levels: congruent, incongruent) and blame (2 levels: internal,
What about me? Factors affecting individual adaptive coping capacity across different populations 118
external). The dependent variables were manipulation checks of goal congruence and blame, as well as basic demographic questions.
3.9.2.2 Sample The final sample consisted of 80 participants, recruited via an independent online panel provider (i-View). There were more males (n = 52, 65%) than females (n = 28, 35%). The average age was approximately 47 years, and ranged from 21 to 74 years. Most were employed full-time (n = 53, 66.3%), with fewer part-time (n = 13, 16.3%), casuals (n = 4, 5.0%), self-employed (n = 3, 3.8%), and other (n = 1, 1.3%). Most participants resided in metropolitan areas (n = 60, 75%), with fewer residing in regional (n = 13, 16.3%) and rural areas (n = 7, 8.8%). In terms of political preferences, most were either labor (n = 34, 42.5%) or liberal (n = 26, 32.5%) supporters.
3.9.2.3 Measures & Procedure Participants were asked to imagine that they were employed by a fictitious health care organisation, and were randomly assigned to receive one of four scenarios. The scenarios contained information about the organisation’s mission and values, as well as the participant’s role within the organisation. The scenarios stated that the organisation’s mission was either (a) congruent; or (b) incongruent with climate change policies and initiatives, and that the organisation was either (a) not a main contributor to greenhouse gas emissions; or (b) a main contributor to greenhouse gas emissions. Participants were then asked to indicate their perceptions of blame and goal congruence in relation to the health care organisation.
3.9.2.4 Results A two-way mixed between-within groups analysis of variance was conducted to determine if the information provided in the scenarios was effective at communicating the manipulation of blame (internal vs. external) and congruence (congruent vs. incongruent). The manipulation successfully communicated the information without an overlap across the two attributions: The main effect of congruence was significant, such that participants who received information stating that climate change policies and initiatives are consistent with the organisation’s mission and values were more likely to report that the Board and executive believe that climate change policies and initiatives are consistent with the organisation’s mission and values, F(1, 76) = 35.928, p < .001. Crucially, the main effect of blame was not significant, F(1, 76) = .560, p = .456, nor was the interaction between congruence and blame, F(1, 76) = .520, p = .473.
A two-way mixed between-within groups analysis of variance was conducted to determine if the information provided in the scenarios was effective at communicating the manipulation of blame (internal vs. external) and congruence (congruent vs. incongruent). The main effect of blame was significant, such that participants who received information stating that the organisation is not one of the main contributors to greenhouse gas emissions were more likely to report that the organisation is not one of the main contributors to greenhouse gas emissions, F(1, 76) = 17.128, p < .001. Crucially, the main effect of congruence was not significant, F(1, 76) = 1.209, p = .275, nor was the interaction between congruence and blame, F(1, 76) = 2.548, p = .115.
In summary, these findings mean that the scenarios and manipulations of goal congruence and blame were effective, and therefore could be used in Study 7C.
What about me? Factors affecting individual adaptive coping capacity across different populations 119
3.9.3 Step 3: Main Study – Goal Congruence and Blame
3.9.3.1 Aim & Design The aim of this step was to apply and test Lazarus’ Cognitive-Motivational-Relational theory of emotion in the context of climate change adaptation in the workplace. The study was a 2 x 2 independent groups design. The independent variables were goal congruence (2 levels: congruent, incongruent) and blame (2 levels: internal, external). The dependent variables were coping, positive emotion, negative emotion, pro-environmental behaviour intentions, policy support, organisational culture, top management support, environmental social desirability, manipulation checks of goal congruence and blame, as well as basic demographic questions.
3.9.3.2 Sample The final sample consisted of 320 participants, recruited via an independent online panel provider (i-View). The number of males and females were roughly equal: 151 males (47.5%) and 167 females (52.5%). The average age was 44 years, and ranged from 19 to 75 years. Most were employed full-time (n = 155, 65.4%), with fewer part-time (n = 57, 24.1%), casuals (n = 19, 8.0%), and self-employed (n = 6, 2.5%). Most participants resided in metropolitan areas (n = 197, 61.8%), with fewer residing in regional (n = 88, 27.6%) and rural areas (n = 34, 10.7%). In terms of political preferences, most were either labor (n = 101, 31.8%) or liberal (n = 113, 35.5%) supporters.
3.9.3.3 Measures & Procedure Participants were asked to imagine that they were employed by a fictitious health care organisation, and were randomly assigned to receive one of four scenarios. The scenarios contained information about the organisation’s mission and values, as well as the participant’s role within the organisation. The scenarios stated that the organisation’s mission was either (a) congruent; or (b) incongruent with climate change policies and initiatives, and that the organisation was either (a) not a main contributor to greenhouse gas emissions; or (b) a main contributor to greenhouse gas emissions. Participants’ responses to questions about positive emotion (8-item scale, α = .918), negative emotion (8-item scale, α = .926), adaptive behaviour intentions (3-item scale, α = .887), policy support (13-item scale, α = .954), top management support (3-item scale, α = .954), organisational culture (4-item scale, α = .950), coping (24-item scale, which consisted of eight subscales), environmental social desirability (18-item scale, which consisted of three subscales), as well as basic demographics questions. Manipulation checks of goal congruence and blame were also included.
3.9.3.4 Results A two-way mixed between-within groups analysis of variance was conducted to determine if the information provided in the scenarios was effective at communicating the manipulation of blame (internal vs. external) and congruence (congruent vs. incongruent). The congruence information was effectively communicated in the scenario: The main effect of congruence was significant, such that participants who received information stating that climate change policies and initiatives are consistent with the organisation’s mission and values were more likely to report that the Board and executive believe that climate change policies and initiatives are consistent with
What about me? Factors affecting individual adaptive coping capacity across different populations 120
the organisation’s mission and values, F(1, 316) = 118.709, p < .001. Crucially, the main effect of blame was not significant, F(1, 316) = 1.820, p = .178, nor was the interaction between congruence and blame, F(1, 316) = .455, p = .500. In other words, telling participants about the consistency between the organisation’s goals and climate change did not. This result was expected, since the manipulation of goal congruence had already been successfully demonstrated in Study 7B.
A two-way mixed between-within groups analysis of variance was conducted to determine if the information provided in the scenarios was effective at communicating the manipulation of blame (internal vs. external) and congruence (congruent vs. incongruent). The main effect of blame was significant, such that participants who received information stating that the organisation is not one of the main contributors to greenhouse gas emissions were more likely to report that the organisation is not one of the main contributors to greenhouse gas emissions, F(1, 316) = 61.993, p < .001. Crucially, the main effect of congruence was not significant, F(1, 316) = .367, p = .550, nor was the interaction between congruence and blame, F(1, 316) = .016, p = .898. This result was also to be expected, since the manipulation of blame had already been successfully demonstrated in Study 7B.
The effect of goal congruence and blame on discrete emotions was examined in a series of 2 x 2 ANOVAs. The only significant effect was a main effect of goal congruence on disappointment, such that participants felt more disappointed when congruence was low (i.e. incongruent), F(1, 313) = 5.189, p = .023.
The effect of goal congruence and blame on adaptive behaviour intentions was examined by conducting a 2 x 2 ANOVA. There was a main effect of congruence, such that when congruence was high (i.e. consistent), employees were more likely to report intentions to engage in adaptive behaviour, F(1, 312) = 7.315, p = .007.
The effect of goal congruence and blame on coping was examined by conducting a series of 2 x 2 ANOVAs. A main effect of blame was found, such that when blame was attributed to internal sources, preventative coping was more prevalent, F(1, 316) = 4.204, p = .041.
A standard multiple regression analysis was conducted to determine the effects of congruence, blame, and discrete emotion on adaptive behaviour intentions. The overall regression analyses revealed that 25.3% of the variance in adaptive behaviour intentions can be explained by age, gender, congruence, blame, and discrete emotions, and this result was found to be significant, R = .549, R2
adj = .253, F(20, 291) = 6.269, p < .001. A standard multiple regression analysis was also conducted to determine the effects of congruence, blame, and discrete emotion on support for workplace pro-environmental policies. The overall regression analyses revealed that 16.7% of the variance in support for workplace adaptive policies can be explained by age, gender, congruence, blame, and discrete emotions, and this result was found to be significant, R = .469, R2
adj = .167, F(20, 292) = 4.122, p < .001.
In terms of the effect of discrete emotions on adaptive behaviour intentions and support for workplace pro-environmental policies, multiple regression results showed that participants who experienced more enthusiasm (sr2 = .108, ß = .187, t = 2.208, p =
What about me? Factors affecting individual adaptive coping capacity across different populations 121
.028), hope (sr2 = .152, ß = .243, t = 3.102, p = .002), and worry (sr2 = .166, ß = .240, t = 3.392, p = .001) in relation to climate change had more intentions to engage in adaptive behaviour in the workplace. The emotions of enthusiasm (sr2 = .126, ß = .218, t = 2.444, p = .015) and worry (sr2 = .177, ß = .256, t = 3.429, p = .001) were also important in determining organisational policy support, in addition to (lack of) happiness (sr2 = -.132, ß = -.232, t = -2.552, p = .011) and (lack of) embarrassment (sr2 = -.133, ß = -.199, t = -2.582, p = .010).
3.9.4 Strengths, Limitations and Summary of Findings from Study Seven This study experimentally tested whether the way in which they perceived the organisation’s response to climate change affected their adaptive behaviour. The experimental manipulations were a key strength of this study as they show that people change their reactions depending upon their changed perceptions. The national sample is assumed to be representative however it might be that they are at the lower end of the salary spectrum given their inclusion in a panel survey. To summarise the key findings:
The manipulations of goal congruence and blame were effective. Participants felt more disappointed when the organisation’s mission and values
were incongruent with climate change policies and initiatives (compared to when they were congruent).
Congruence between the organisation’s mission and climate change adaptation policies was high resulted in more intentions to engage adaptive behaviour.
When blame for climate change was attributed to the organisation, preventive coping was more prevalent.
Participants who felt enthusiasm, worry, and hope in relation to climate change reported more intentions to engage in adaptive behaviour.
Participants who felt enthusiasm, worry, (lack of) happiness, and (lack of) embarrassment in relation to climate change were more supportive of adaptive green policies in the workplace.
What about me? Factors affecting individual adaptive coping capacity across different populations 122
3.10 Study Eight – Executive interviews This study was led by the team at Griffith University and University of Queensland, namely Sally Russell, Kelly Fielding and Alice Evans.
Because Studies 6 and 7 suggested that top management support for sustainability is key to promoting these types of policies in the workplace, we conducted interviews with senior executives and board members of a large health care facility.
This study found that there were quite divergent views among the executives and board members: some thought that it was enough to be compliant with current and future climate change regulations whereas others thought that the organisation should be proactive and ‘do the right thing’ by acting in line with the organisation’s values. Some thought that sustainability and climate change responsiveness are currently embodied within the organisation’s values whereas others thought that sustainability was secondary to and potentially in competition with the central values of patient care. Executive and Board interviewees identified that there was a high level of staff support for adaptive actions but that any new initiatives needed to be sensitive to time scarcity and cost.
3.10.1 Aim & Design To conduct a qualitative study to gain an understanding of environmental sustainability from the perspective of MHS management.
3.10.2 Sample Semi-structured one-on-one interviews were conducted with 11 senior executives and four board members to identify organisational facilitators and barriers for the adoption of environmentally friendly practices at MHS.
3.10.3 Measures & Procedure Throughout August and September 2010, face-to-face interviews were conducted with MHS senior executive staff. The interviews were conducted face-to-face by a senior researcher. The interviews were recorded and transcribed for analysis. Examples of the questions from the interview schedule are as follows:
In your division, what kinds of things can be done to make MHS more environmentally sustainable?
From a management perspective what would make it easy or difficult to implement these practices?
In your division/area what do you think are the key priorities for achieving environmental sustainability?
How compatible are MHS’ values and culture with the idea of environmental sustainability?
How important do you think it is for MHS to make an effort to improve its environmental sustainability?
What about me? Factors affecting individual adaptive coping capacity across different populations 123
3.10.4 Results Mater Health Services (MHS) executives and board members cited energy, waste and water as the three key priority areas for improving environmental sustainability at MHS. Energy in particular was seen as a key area of focus now and in the future. Most participants noted that the organisation was progressing well and work was underway to improve efficiencies in waste and water. There was evidence of divergent perspectives about environmental sustainability across the Executive and Board members who were interviewed.
Although all interviewees identified the cost of environmental sustainability initiatives as a major factor, some cited cost as a significant barrier while others identified the potential for sustainability initiatives to reduce costs. Compliance with current and future regulations was also seen as a key driver for investment in environmental initiatives but some interviewees perceived that the organisation’s responsibility was to be compliant, whereas others suggested that MHS would achieve compliance by ‘doing the right thing’ and acting in accordance with the organisation’s values.
Divergence was also evident in discussion of the role of values, with some interviewees suggesting that sustainability is embodied within current values whereas other participants reported that sustainability was secondary to MHS values and potentially in competition with values of patient care. Executive and Board interviewees identified that there was a high level of staff support for environmental sustainability but that any new initiatives needed to be sensitive to time scarcity.
3.10.5 Strengths, Limitations and Summary of Findings from Study Eight
This study focused on executives in one organisation. This provided rich but narrow data that may not be able to be generalised to other organisations. The richness of the data, though, offsets that limitation. The complexity involved with organisational adaptation to climate change was evident in the responses. A summary of the findings suggests a number of dichotomies amongst the participants:
Some thought that it was enough to be compliant with current and future climate change regulations whereas others thought that the organisation should be proactive and ‘do the right thing’ by acting in line with the organisation’s values.
Some thought that sustainability and climate change responsiveness are currently embodied within the organisation’s values whereas others thought that sustainability was secondary to and potentially in competition with the central values of patient care.
Overall, however, executive and Board interviewees identified that there was a high level of staff support for adaptive actions but that any new initiatives needed to be sensitive to time scarcity and cost
What about me? Factors affecting individual adaptive coping capacity across different populations 124
3.11 Study Nine – Can norming information and message framing affect climate change beliefs regardless of their ideology?
This study was led by the UWA Psychology team of Stephan Lewandowsky and Mark Hurlstone.
The founding premise is that acceptance of climate science amongst the general public is a basic requirement for any attempt to adapt to climate change. The most significant barrier to acceptance of climate science is a person’s ideology or cultural worldview. Notably, it has been shown that support for a laissez-faire free-market ideology predicts the rejection of climate science and reduced willingness to support climate change mitigation initiatives (Heath & Gifford, 2006; McRight & Dunlap, 2010). The purpose of this study was to explore ways by which a person’s willingness to support CO2
emission reduction might be facilitated irrespective of their world views. Specifically, we examined whether providing people with social norming information placing Australia as one of the world’s worst CO2 emitters increases the amount by which people are willing to reduce Australia’s CO2 emissions. Additionally, we explored whether this willingness is enhanced when the personal cost incurred by committing to CO2
emission reduction is framed as a foregone-gain, rather than as an opportunity-cost.
Of critical interest is whether any positive effects of the social norming and message framing manipulations on willingness to support CO2 emission reduction are significant after controlling for people’s degree of support for free-market ideology.
This study revealed that endorsement of free-market economics is associated with reduced willingness to support Australia reducing its C02 emissions. However, it also revealed that—irrespective of degree of support for the free-market—people are willing to commit to greater extents of C02 emission cuts when the costs of doing so are framed as a foregone-gain (e.g., Australian average national income, per person, will increase between now and 2020 by $5,900 without emission cuts, compared to $5000 with a 10% cut in emissions), as opposed to an opportunity-cost (e.g., reducing emissions by 10% will cost on average $900, per person, in 2020). These results suggest that efforts to increase people’s willingness to support Australia participating in C02 emission cuts will be more successful when the costs of reducing emissions are conveyed as a reduction in future income.
What about me? Factors affecting individual adaptive coping capacity across different populations 125
3.11.1 Sample One hundred and twenty participants (80 females and 40 males; mean age = 19.73; SD = 5.28) were recruited from the campus community at the University of Western Australia.
3.11.2 Design & procedure Participants were randomly allocated to one of three social norming conditions:
(1) Control: participants were given information about Australia’s CO2 emissions (based on International Energy Agency estimates of CO2 per kWh), with no comparative data;
(2) Average-Norming: participants were given (true) social norming information placing Australia’s emissions significantly above the world average;
(3) Rank-Norming: participants were given (true) social norming information placing Australia as the 5th worst polluting nation in the world (out of 140).
Participants were subsequently asked about their willingness to commit to different extents of CO2 emission cuts—ranging from 0% to 50% in 5% increments—in one of two cost framing conditions:
(1) Opportunity-Cost: average Australian national income ‘decreases’ from the baseline levels expected for 2020, in the presence of emission cuts;
(2) Foregone-Gain: average Australian national income ‘increases’ from current levels to 2020, but not by as much as in the absence of emission cuts.
Note that those two statements represent identical data but in two different frames.
Participants then completed the Support for the Free-Market System Scale (Heath & Gifford, 2006) measuring their degree of support for free-market ideology.
3.11.3 Results In this study, we found that support for free-market ideology was significantly negatively correlated with the amount by which people were willing to reduce CO2 emissions (r = -.45).
Figure 31 shows the mean emission cuts as a function of the social norming and message framing manipulations. These data were subjected to a 3 (Social Norming: Control vs. Average-Norming vs. Rank-Norming) x 2 (Framing: Opportunity Cost vs. Foregone-Gain) Analysis of Covariance (ANCOVA), with support for free-market ideology included as a covariate. As anticipated, the analysis revealed a reliable effect of support for the free-market, F(1, 113) = 33.188, p < .001. After controlling for this effect, there was a reliable main effect of Framing, F(1, 113) = 8.786, p < .01, with mean emission cuts being higher in the Foregone-Gain condition than in the Opportunity-Cost condition. Neither the main effect of Social Norming nor
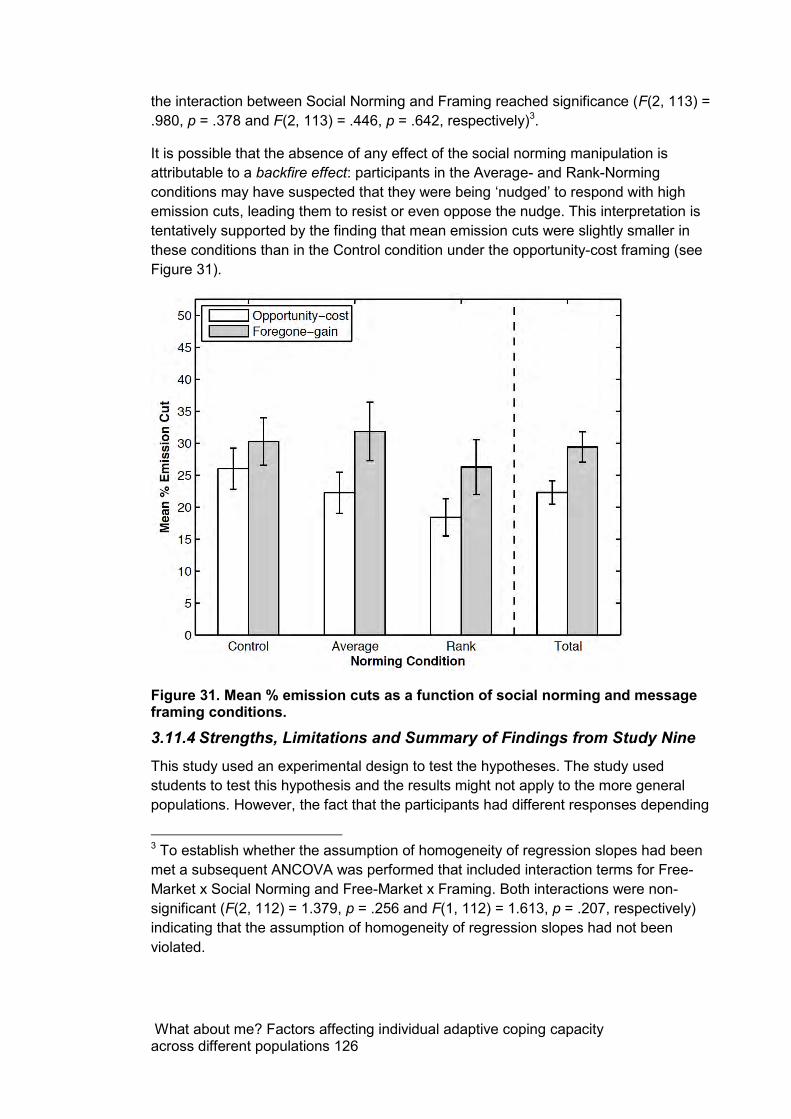
What about me? Factors affecting individual adaptive coping capacity across different populations 126
the interaction between Social Norming and Framing reached significance (F(2, 113) = .980, p = .378 and F(2, 113) = .446, p = .642, respectively)3.
It is possible that the absence of any effect of the social norming manipulation is attributable to a backfire effect: participants in the Average- and Rank-Norming conditions may have suspected that they were being ‘nudged’ to respond with high emission cuts, leading them to resist or even oppose the nudge. This interpretation is tentatively supported by the finding that mean emission cuts were slightly smaller in these conditions than in the Control condition under the opportunity-cost framing (see Figure 31).
Figure 31. Mean % emission cuts as a function of social norming and message framing conditions.
3.11.4 Strengths, Limitations and Summary of Findings from Study Nine
This study used an experimental design to test the hypotheses. The study used students to test this hypothesis and the results might not apply to the more general populations. However, the fact that the participants had different responses depending
3 To establish whether the assumption of homogeneity of regression slopes had been met a subsequent ANCOVA was performed that included interaction terms for Free-Market x Social Norming and Free-Market x Framing. Both interactions were non-significant (F(2, 112) = 1.379, p = .256 and F(1, 112) = 1.613, p = .207, respectively) indicating that the assumption of homogeneity of regression slopes had not been violated.
What about me? Factors affecting individual adaptive coping capacity across different populations 127
upon the message that they read is a key strength of the study. In essence, the study found that:
Endorsement of free-market economics is associated with reduced willingness to support Australia reducing its C02 emissions.
But, irrespective of degree of support for the free-market, people are willing to commit to greater extents of C02 emission cuts when the costs of doing so are framed as a foregone-gain (e.g., Australian average national income, per person, will increase between now and 2020 by $5,900 without emission cuts, compared to $5000 with a 10% cut in emissions), as opposed to an opportunity-cost (e.g., reducing emissions by 10% will cost on average $900, per person, in 2020).
What about me? Factors affecting individual adaptive coping capacity across different populations 128
3.12 Study Ten – Are people’s beliefs in consensus of climate change accurate, does this affect adaptive behaviour and can it be changed?
This study was conducted by the UWA Psychology team of Carmen Lawrence and Mark Hurlstone. It is a partial replication and extension of a survey of Australian attitudes towards climate change conducted by Leviston and Walker (2011; CSIRO). These authors discovered that people who deny that climate change is happening or are uncertain whether climate change is happening or not dramatically over-estimated the percentage of people in the general population who share their belief about climate change—a so called false-consensus effect. By contrast, people who believe that climate change is happening—either due to natural temperature variation or the activities of humans—showed a tendency to underestimate the percentage of people in the population who share their belief about climate change—a so called false-uniqueness effect. The primary aim of this study was to replicate the false-consensus and false-uniqueness effects observed by Leviston and Walker (2011) and to examine the impact of providing accurate normative feedback about the real distribution of climate change beliefs in the population on people’s attitudes towards climate change and their pro-environmental intentions / behaviours.
This study demonstrated that some people’s beliefs about climate change might be shaped by misperceptions about the beliefs of others. For instance, people who deny that climate change is occurring over-estimate the percentage of people in the Australian population who share their belief. If we can correct such misperceptions by giving people accurate normative feedback about the real distribution of climate change beliefs it should make people more willing to believe that humans are causing climate change. Such an outcome would identify normative feedback as a viable mechanism for promoting greater acceptance of human-induced climate change in the Australian population.
3.12.1 Sample One hundred and eighty four people (107 females, 76 males; Mean age = 54.28, SD = 16.59) were recruited by randomly selecting households from a Western Australia telephone directory.
3.12.2 Design & Procedure The study employed a 2 (Feedback: No-Feedback vs. With-Feedback) x 2 (Time: Time-One vs. Time-Two) mixed-participants design. Feedback was a between-participants factor, whereas Time was a within-participants factor. Participants were randomly assigned to the No-Feedback and With-Feedback conditions.
What about me? Factors affecting individual adaptive coping capacity across different populations 129
The survey was conducted via one-on-one telephone interviews. In the Time-One version of the survey, people were initially asked about their beliefs about climate change. Specifically, people were asked to indicate which of the following four statements—taken from Leviston and Walker (2011)—best represents their belief about climate change: (1) I don’t think that climate change is happening (Deny); (2) I have no idea whether climate change is happening or not (Don’t know); (3) I think that climate change is happening, but it’s just a natural fluctuation in Earth’s temperatures (Happening-Natural); (4) I think that climate change is happening, and I think that humans are largely causing it (Happening-Human). People were then asked to estimate the percentage of people in the Australian population who hold the four different beliefs about climate change. Respondents then completed a pro-environmental behaviours questionnaire which measured the extent to which they engage in various green actions, before completing the Free-Market System Scale (Heath & Gifford, 2006) which measures an individual’s degree of support for a laissez faire free-market ideology. At the end of the survey, people were asked whether they would be willing to take part in the follow-up survey at a later date.
After a lag of approximately one month, those respondents who had expressed a willingness to take part in the Time-Two version of the survey were contacted. Participants in the With-Feedback condition were initially given information about the actual percentage of people in the Australian population who hold the four different beliefs about climate change. This feedback was based on the actual percentage of people falling into the four climate change belief categories in the study of Leviston and Walker (2011). By contrast, participants in the No-Feedback group received no information about the climate change beliefs of others. All participants were then asked to indicate once more which of the four climate change belief statements best represents their view about climate change before again completing the pro-environmental behaviours questionnaire. The survey concluded with a social comparison questionnaire, which measured the extent to which people compare their own beliefs and actions with those of others.
3.12.3 Beliefs about climate change Figure 32. Climate change beliefs for Time One : Actual climate change beliefs (A); Actual and estimated climate change beliefs (B); Estimated climate change beliefs as a function of belief (C); and Actual climate change beliefs as a function of free-market ideologyA shows the actual percentage of respondents who hold the four different beliefs about climate change. Echoing the findings of Leviston and Walker (2011), only a minority of respondents denied that climate change is happening or were unsure whether climate change is happening or not (4% of respondents in both cases). The majority of respondents believed that climate change is happening, with a higher percentage (57% of respondents) attributing it largely to the activities of humans than to natural fluctuation in Earth’s temperatures (35% of respondents). This latter result contrasts with the findings of Leviston and Walker (2011) who found that an approximately equal percentage of people held the latter two beliefs about climate change (~44% for both belief groups).
What about me? Factors affecting individual adaptive coping capacity across different populations 130
Figure 32. Climate change beliefs for Time One : Actual climate change beliefs (A); Actual and estimated climate change beliefs (B); Estimated climate change beliefs as a function of belief (C); and Actual climate change beliefs as a function of free-market ideologyB plots the same data as in Figure 32. Climate change beliefs for Time One : Actual climate change beliefs (A); Actual and estimated climate change beliefs (B); Estimated climate change beliefs as a function of belief (C); and Actual climate change beliefs as a function of free-market ideologyA in conjunction with respondents estimates of the percentage of people in the population that hold the four different climate change beliefs. Consistent with Leviston and Walker (2011), on average people over-estimated the percentage of people falling into the ‘deny’ (estimated mean = 15% vs. actual mean = 4%; t(158) = 9.85, p < .001) and ‘don’t know’ (estimated mean = 15% vs. actual mean = 4%; t(158) = 9.2691, p < .001) climate change belief categories, but under-estimated the percentage of people falling into the ‘happening-human’ climate change belief category (estimated mean = 45% vs. actual mean = 57%; t(158) = 10.545, p < .001). However, whilst Leviston and Walker (2011) also observed a tendency for people to underestimate the percentage of people falling into the ‘happening-natural’ climate change belief category, on average respondents in the current study were accurate in estimating the actual percentage of people holding this belief (estimated mean = 35% vs. actual mean = 35%; t(158) =1.7788, p > .05).
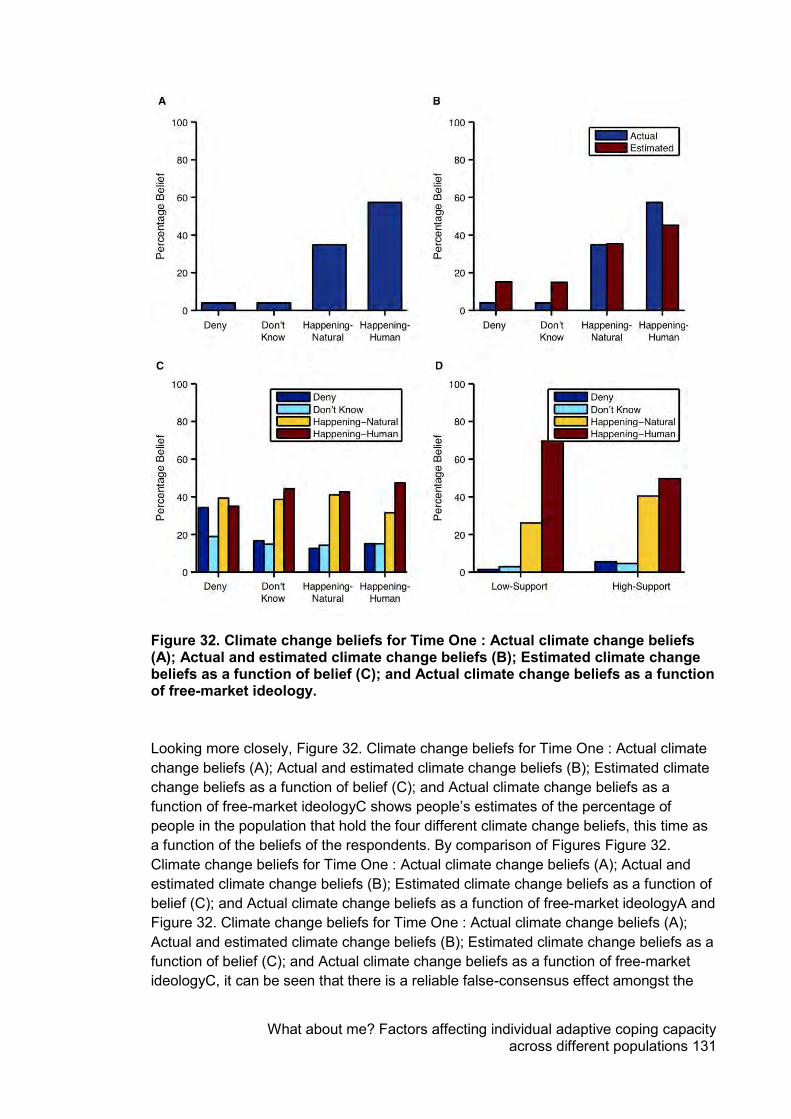
What about me? Factors affecting individual adaptive coping capacity across different populations 131
Figure 32. Climate change beliefs for Time One : Actual climate change beliefs (A); Actual and estimated climate change beliefs (B); Estimated climate change beliefs as a function of belief (C); and Actual climate change beliefs as a function of free-market ideology.
Looking more closely, Figure 32. Climate change beliefs for Time One : Actual climate change beliefs (A); Actual and estimated climate change beliefs (B); Estimated climate change beliefs as a function of belief (C); and Actual climate change beliefs as a function of free-market ideologyC shows people’s estimates of the percentage of people in the population that hold the four different climate change beliefs, this time as a function of the beliefs of the respondents. By comparison of Figures Figure 32. Climate change beliefs for Time One : Actual climate change beliefs (A); Actual and estimated climate change beliefs (B); Estimated climate change beliefs as a function of belief (C); and Actual climate change beliefs as a function of free-market ideologyA and Figure 32. Climate change beliefs for Time One : Actual climate change beliefs (A); Actual and estimated climate change beliefs (B); Estimated climate change beliefs as a function of belief (C); and Actual climate change beliefs as a function of free-market ideologyC, it can be seen that there is a reliable false-consensus effect amongst the
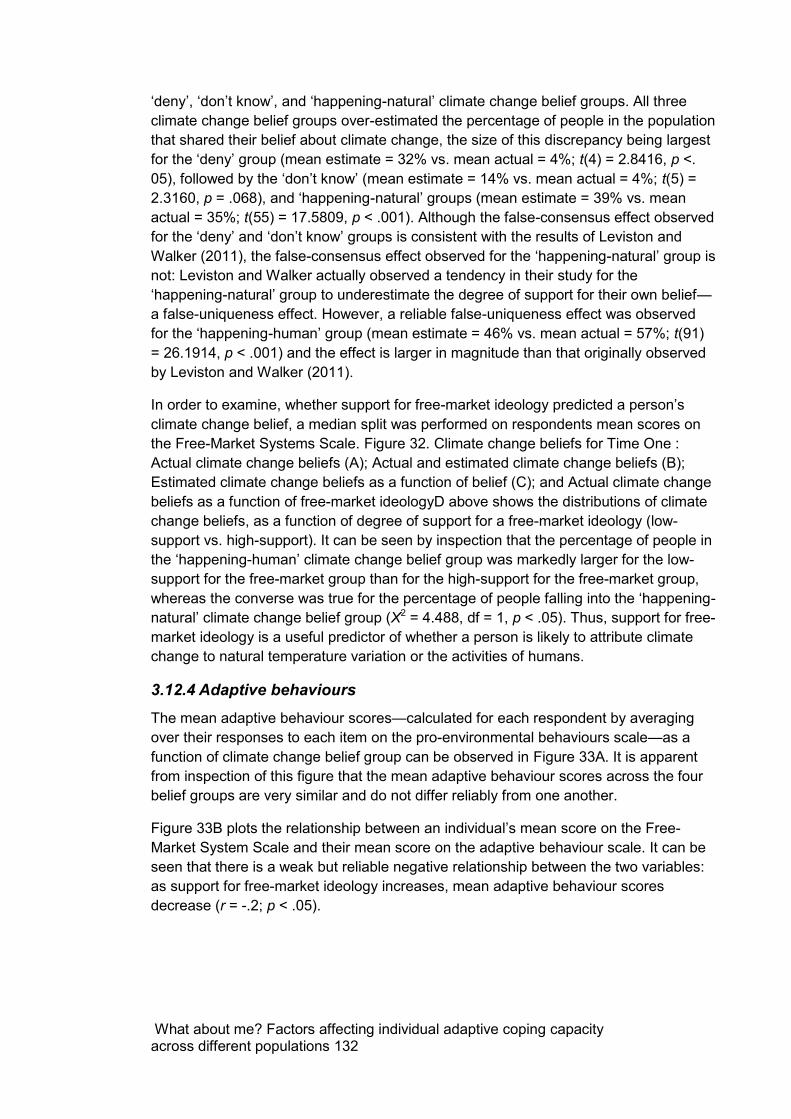
What about me? Factors affecting individual adaptive coping capacity across different populations 132
‘deny’, ‘don’t know’, and ‘happening-natural’ climate change belief groups. All three climate change belief groups over-estimated the percentage of people in the population that shared their belief about climate change, the size of this discrepancy being largest for the ‘deny’ group (mean estimate = 32% vs. mean actual = 4%; t(4) = 2.8416, p <. 05), followed by the ‘don’t know’ (mean estimate = 14% vs. mean actual = 4%; t(5) = 2.3160, p = .068), and ‘happening-natural’ groups (mean estimate = 39% vs. mean actual = 35%; t(55) = 17.5809, p < .001). Although the false-consensus effect observed for the ‘deny’ and ‘don’t know’ groups is consistent with the results of Leviston and Walker (2011), the false-consensus effect observed for the ‘happening-natural’ group is not: Leviston and Walker actually observed a tendency in their study for the ‘happening-natural’ group to underestimate the degree of support for their own belief—a false-uniqueness effect. However, a reliable false-uniqueness effect was observed for the ‘happening-human’ group (mean estimate = 46% vs. mean actual = 57%; t(91) = 26.1914, p < .001) and the effect is larger in magnitude than that originally observed by Leviston and Walker (2011).
In order to examine, whether support for free-market ideology predicted a person’s climate change belief, a median split was performed on respondents mean scores on the Free-Market Systems Scale. Figure 32. Climate change beliefs for Time One : Actual climate change beliefs (A); Actual and estimated climate change beliefs (B); Estimated climate change beliefs as a function of belief (C); and Actual climate change beliefs as a function of free-market ideologyD above shows the distributions of climate change beliefs, as a function of degree of support for a free-market ideology (low-support vs. high-support). It can be seen by inspection that the percentage of people in the ‘happening-human’ climate change belief group was markedly larger for the low-support for the free-market group than for the high-support for the free-market group, whereas the converse was true for the percentage of people falling into the ‘happening-natural’ climate change belief group (X2 = 4.488, df = 1, p < .05). Thus, support for free-market ideology is a useful predictor of whether a person is likely to attribute climate change to natural temperature variation or the activities of humans.
3.12.4 Adaptive behaviours The mean adaptive behaviour scores—calculated for each respondent by averaging over their responses to each item on the pro-environmental behaviours scale—as a function of climate change belief group can be observed in Figure 33A. It is apparent from inspection of this figure that the mean adaptive behaviour scores across the four belief groups are very similar and do not differ reliably from one another.
Figure 33B plots the relationship between an individual’s mean score on the Free-Market System Scale and their mean score on the adaptive behaviour scale. It can be seen that there is a weak but reliable negative relationship between the two variables: as support for free-market ideology increases, mean adaptive behaviour scores decrease (r = -.2; p < .05).
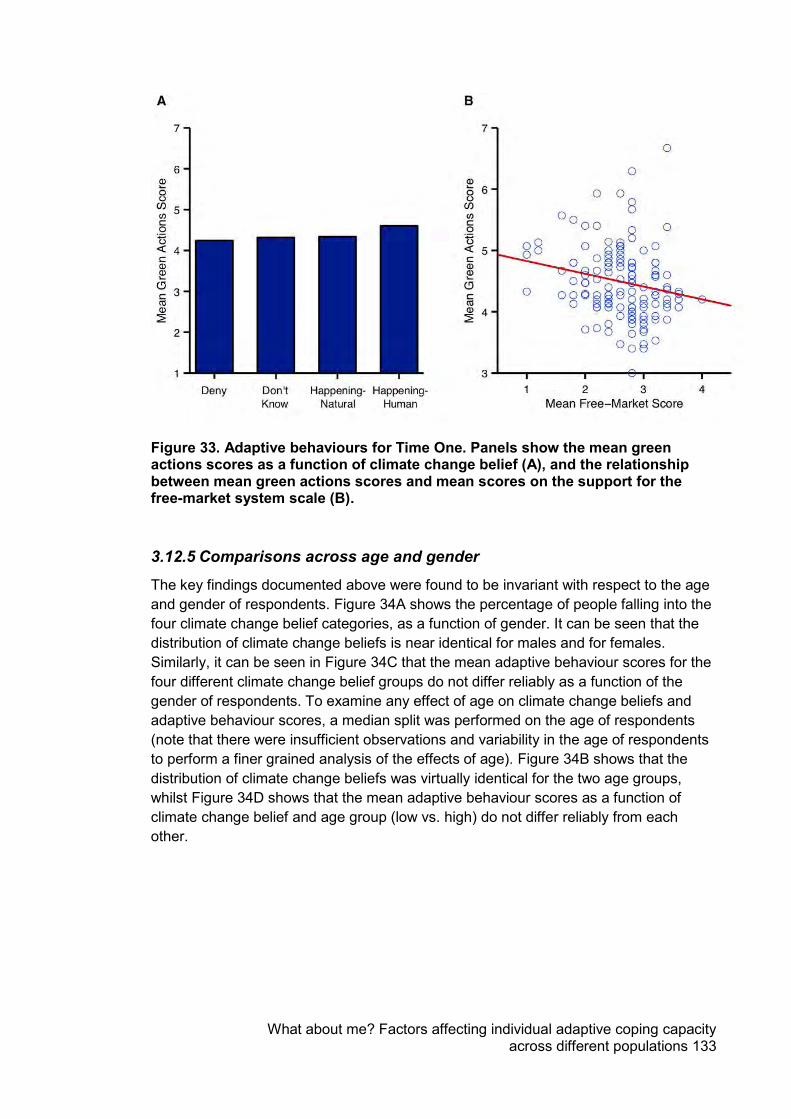
What about me? Factors affecting individual adaptive coping capacity across different populations 133
Figure 33. Adaptive behaviours for Time One. Panels show the mean green actions scores as a function of climate change belief (A), and the relationship between mean green actions scores and mean scores on the support for the free-market system scale (B).
3.12.5 Comparisons across age and gender
The key findings documented above were found to be invariant with respect to the age and gender of respondents. Figure 34A shows the percentage of people falling into the four climate change belief categories, as a function of gender. It can be seen that the distribution of climate change beliefs is near identical for males and for females. Similarly, it can be seen in Figure 34C that the mean adaptive behaviour scores for the four different climate change belief groups do not differ reliably as a function of the gender of respondents. To examine any effect of age on climate change beliefs and adaptive behaviour scores, a median split was performed on the age of respondents (note that there were insufficient observations and variability in the age of respondents to perform a finer grained analysis of the effects of age). Figure 34B shows that the distribution of climate change beliefs was virtually identical for the two age groups, whilst Figure 34D shows that the mean adaptive behaviour scores as a function of climate change belief and age group (low vs. high) do not differ reliably from each other.

What about me? Factors affecting individual adaptive coping capacity across different populations 134
Figure 34. Climate change beliefs and adaptive behaviours—as a function of age and gender. Panels show the distribution of climate change beliefs as a function of gender (A), the distribution of climate change belie beliefs as a function of age group (B), mean green actions scores as a function of climate change belief and gender (C), and mean green actions scores as a function of climate change belief and age group (D).
3.12.6 Strengths, Limitations and Summary of Results from Study Ten This study used a truly representative sample within WA through a phone-call interview design. This is a key strength of this sample. Of course, not all those called were involved accepted the invitation to interview and thus it may be that there is a self-selection bias in the sample. The study found that
When asked about how the population viewed climate change, people overestimated the degree to which others shared their views. Those who denied climate change, didn’t know whether climate change was happening or not, or thought that climate change was happening due to natural fluctuations all thought that more people in the population thought the same as them, when compared to the actual number of people who hold those beliefs. They believe
What about me? Factors affecting individual adaptive coping capacity across different populations 135
that there is a greater consensus on their belief (“false consensus”) than reality shows.
In contrast, those who believe that humans are contributing to climate change believe that fewer people in the population hold the same belief, compared to the actual number. They believe that they are more unique (“false uniqueness”) than reality shows.
Adaptive behaviours did not appear to differ across people with different climate change beliefs but they did differ across those with different level of free market ideologies
What about me? Factors affecting individual adaptive coping capacity across different populations 136
4. DISCUSSION
Our team of researchers from both Psychology and Business disciplines across four universities conducted 10 studies over the last 15 months. These studies were designed to both replicate each other and extend the research questions in a variety of ways. Overall, our research questions were:
1. How can we measure the way an individual copes with climate change? 2. What makes a person adapt to climate change? In particular, how do goals and
ideologies, goal structures, climate change beliefs, emotions and political orientations affect adaptive capacity and adaptive behaviour?
3. What can we do to influence a person’s adaptation? In particular: Can we alter a person’s goal structure?; Does thinking about politics affect their adaptation? Does a pledge help them to adapt?; and Does message framing affect their adaptation?
In answering these questions we used a variety of methodologies including interviews, surveys, survey experiments and face-to-face experiments. There was a high level of rigour involved in each of these methodologies ensuring internal validity of the data. This programme of research represents one of the largest and most integrated attempts to understand some of the psychological drivers of individual-level adaptation.
4.1 Can we measure coping with climate change? Previously, to our knowledge only one published measure of coping with climate change existed in the psychology and environmental psychology literatures (Homburg et al., 2007) and that scale was plagued with problems. We used the most recent advances in our understanding of coping more generally to develop an alternative scale. Across three studies we found that our newly developed CCC tool was both reliable and valid. It displayed good psychometric properties and, importantly, it predicted behaviour: Adaptive coping strategies were related to adaptive behaviour. Moreover, there were no differences in emotional reactions to the scale regardless of whether we used the more conservative term “environmental changes” or the more technically correct term “climate change”. In short, we believe that our results show evidence in support of the CCC as a way of measuring coping with climate change.
4.2 What makes a person adapt to climate change? 4.2.1 Adaptive capacity
We measured adaptive capacity in two forms: individual coping with climate change and support for adaptive policies implemented at the State or Federal Government level or within organisations. Building on the coping literature, we hypothesised that cognitive appraisal, goals and goal structure would be related to coping. Our results supported these hypotheses: We found that perceiving climate change as a threat to oneself and one’s way of life, the importance of “green”, environmental goals, and the degree to which people believed that adaptive behaviours could help achieve their important goals were positively associated with adaptive coping strategies.
What about me? Factors affecting individual adaptive coping capacity across different populations 137
The second form of adaptive capacity that we examined was support for policies, originating in both government and organisations. Once again we found that a threat appraisal, climate change or environmental goal, and goal connectedness were related to adaptive capacity. However, in addition to these, there were a number of other factors that were specifically related to policy support, namely political affiliation, perceived human contribution to climate change, (lack of) denying that climate change exists, and a number of emotions (enthusiasm, worry, (lack of) happiness, and (lack of) embarrassment).
The importance of a threat, rather than a challenge, appraisal to adaptive capacity was interesting. In much of the mainstream coping literature, a challenge appraisal (that a situation contains an issue to be addressed, but one which can be addressed) is traditionally seen as the most likely to lead to active coping attempts while a threat appraisal more often leads to passive or emotion-focused coping strategies (McCrae, 1984; N. Skinner & Brewer, 2002). In the case of climate change, however, it appears as though a threat appraisal is necessary. This also aligns with our findings that a “worry” emotion was associated with policy support. It could be that adaptive capacity to deal with climate change, because of the global nature of the problem and far-off consequences, requires a stronger sense of necessity to overcome inertia.
Goals were also relevant to adaptive capacity, in the form of both coping and policy support. For both of these forms, a person who rated “green” goals as more important was more likely to use adaptive coping strategies and support for policies than a person who rated them as less important. This is in line with theorising and research by Stern and colleagues who show that having biospheric values (that is, environmental values) is related to pro-environmental behaviours (e.g., Black et al., 1985; Stern, 2000, 2011). Interestingly, the degree of convergence between “green” goals and goals of the core business emerged in interviews with hospital executives – with a variety of opinions on the actual level of convergence within the hospital.
However, importantly, we found that it was not just these environmental and climate change goals that were key to adaptive capacity. The degree to which adaptive behaviours were perceived to help a person achieve their other important goals was independently related to both adaptive coping and policy support. Therefore, to some extent it does not matter if a person does not rate ‘protecting the environment’ and ‘reducing the effects of climate change’ as particularly important, as long as they view the adaptive behaviours as helpful to achieving their other goals.
Climate change beliefs and political affiliation were related to policy support. Those who believed in anthropogenic climate change (or conversely, who did not have a denial appraisal of climate change) were more likely to support adaptive policies. People who believed that there was a greater human contribution to climate change were also more likely to support policies to a greater extent than people who believed in a lesser contribution. Interestingly, political affiliation, while related to climate change and contribution beliefs, was also independently related to policy support. This might indicate an overall support for the government or policies above and beyond beliefs about climate change.
What about me? Factors affecting individual adaptive coping capacity across different populations 138
Finally, emotions were important for adaptive capacity. The key emotions were being enthusiastic, worried, unhappy and unembarrassed. These four emotions together draw a picture of a state of uneasy active capacity – a person who wants to make things happen because they don’t like the situation as it stands and is able to make it happen through their enthusiasm and lack of embarrassment.
4.2.2 Adaptive behaviour
Based on a range of psychological literature, we hypothesised that adaptive behaviour would be related to goals, goal connectedness, adaptive coping, beliefs about climate change (including denial), and emotions. We found support for each of these relationships.
Similar to adaptive capacity, environmental and/or climate change goals were related to a variety of measures of adaptive behaviour including self-reported behaviour, signing a petition, and donating time and money to an environmental charity. Again, this is not surprising and corresponds with the psychological literature.
What is more surprising, however, is again the range of goals to which adaptive behaviour was related. Hedonistic and societal goals were also related to adaptive behaviour. For example, in the sample of farmers that we interviewed, we found that adaptive behaviours and sustainable practices were being adopted by those who had survival and financial goals; not just those who had environmental goals. De Young (2000) also identified a wider range of motives behind pro-environmental behaviour but it has not been widely examined. We find support for this broader range of motives.
Furthermore, we again find that as long as a person believes that the behaviour helps them to achieve their own important goals, then it does not matter whether or not their goals are environmental or not. This means that people with more hedonistic or individualistic goals might also be influenced to engage in adaptive behaviours, if they can be convinced that the behaviour helps them to achieve those goals. With regard to farmers, this finding is particularly relevant to those who run ‘conventional’ farms. Those working on organic and/or sustainable farms will nearly always see a connection between adaptive behaviours and practices and their goals. However, those who work on conventional farms may sometimes see a connection (if the adaptive behaviour helps them to survive financially) but sometimes that connection might have to be made more clearly to them.
Another important relationship was between adaptive behaviour and adaptive coping. As we hoped, coping strategies acted as a form of adaptive capacity for ongoing individual adaptation. While personal coping was not related to the more societal variation of adaptive capacity (namely policy support), it was related to both self-reported and behavioural measures of adaptive behaviour.
Climate change beliefs were also related to adaptive behaviour, most notably the self-reported behaviours. An appraisal of the situation that denies climate change, beliefs in anthropogenic and non-anthropogenic, and the perceived degree of human contribution to climate change all affected self-reported adaptive behaviours. A well-known and well-validated construct in psychology is expectancy: that a person will be more motivated to act if they feel they can make a difference. The corollary here is that
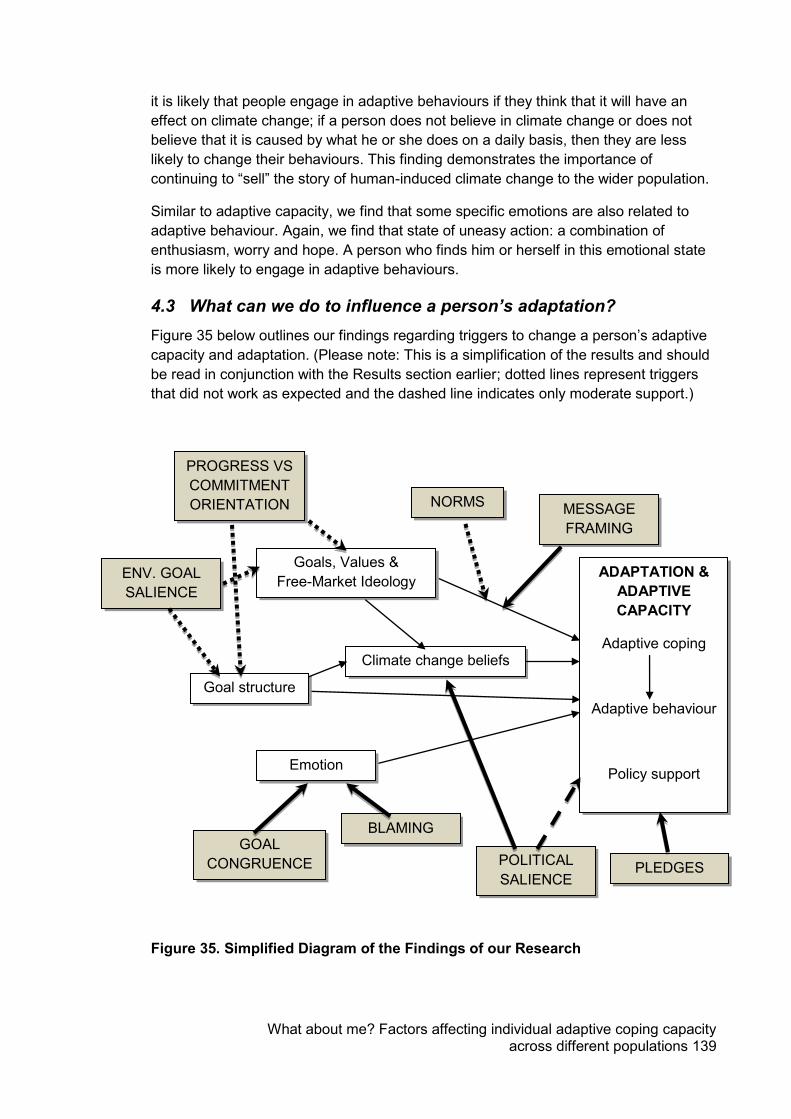
What about me? Factors affecting individual adaptive coping capacity across different populations 139
it is likely that people engage in adaptive behaviours if they think that it will have an effect on climate change; if a person does not believe in climate change or does not believe that it is caused by what he or she does on a daily basis, then they are less likely to change their behaviours. This finding demonstrates the importance of continuing to “sell” the story of human-induced climate change to the wider population.
Similar to adaptive capacity, we find that some specific emotions are also related to adaptive behaviour. Again, we find that state of uneasy action: a combination of enthusiasm, worry and hope. A person who finds him or herself in this emotional state is more likely to engage in adaptive behaviours.
4.3 What can we do to influence a person’s adaptation? Figure 35 below outlines our findings regarding triggers to change a person’s adaptive capacity and adaptation. (Please note: This is a simplification of the results and should be read in conjunction with the Results section earlier; dotted lines represent triggers that did not work as expected and the dashed line indicates only moderate support.)
Figure 35. Simplified Diagram of the Findings of our Research
ADAPTATION & ADAPTIVE CAPACITY
Adaptive coping
Adaptive behaviour
Policy support
Goals, Values & Free-Market Ideology
Goal structure
Climate change beliefs
Emotion
NORMS MESSAGE FRAMING
ENV. GOAL SALIENCE
PROGRESS VS COMMITMENT ORIENTATION
GOAL CONGRUENCE
BLAMING
POLITICAL SALIENCE
PLEDGES
What about me? Factors affecting individual adaptive coping capacity across different populations 140
A number of organisations are attempting to influence their employees’ behaviour through pledges. Our results suggest that such an approach seems to have some support from those interviewed but there also appear to be implementation issues which might negate these effects – for example, the need to provide reminders through a print-out of the pledge. Nevertheless, the sample is too small to draw any definitive conclusions and more research is necessary to understand the effectiveness of pledges.
Unfortunately, the goal structure of environmental goals appears difficult to change. Across three studies we found no significant differences in different manipulations of goal structure. The most encouraging were the findings from Study Two that found that when prompted to think about their own environmental goals, participants were more likely to rank collectivistic goals as more important and individualistic goals as less important. Although this does not relate directly to adaptation to climate change, it could be that these broader societal goals may affect societal adaptation to climate change. More research is needed to both replicate and further investigate these findings.
The effect of political salience was unexpected and interesting. Although we predicted that people’s climate change beliefs and policy support would change in line with their political identity, we actually found that the change occurred regardless of political orientation. In general, people who thought about politics and their own political orientation believed that there was a smaller human contribution to climate change than people who were not thinking about politics. Participants were randomly allocated to these groups and the numbers were large, therefore it is unlikely that this is a statistical artefact. Instead, it appears that politics and the messages coming out of the political arena may be influencing climate change views.
The lack of support for changing a person’s interpretation of their behaviour as related to either their progress towards or commitment to their “green” goal was surprising. However, besides the small sample size in this study (which decreased the statistical power to find a significant effect), there are a number of possible explanations for the non-significant findings. First, it could be that our interpretation manipulation was not strong enough. Indeed, 40 people (29%) had to be screened out as a result of failing to remember what they had read only 10 minutes earlier. In addition, past studies have asked participants to translate their agreement with the ‘commitment’ or ‘progress’ statement into intentions to pursue the focal goal. The current study, however, did not have such a translation and it might be that this is a key element to help people move from a thought to a behaviour. Related to this is that the time interval between interpreting past behaviour and translating this into goal pursuit might also influence whether or not these processes have an effect. In the current study, participants completed several filler tasks between interpreting their past behaviour and indicating whether or not they would like to donate money to the green charity; in past studies they have occurred sequentially. Although our research is more similar to “real life” it could be that this time interval reduces the likelihood of translating thoughts into behaviour (Ajzen & Madden, 1986).
The results of our research do however have implications for the communication of climate change adaptation policies. People often erroneously assume that reducing
What about me? Factors affecting individual adaptive coping capacity across different populations 141
CO2 emissions will result in income falling from current levels rendering them less willing to support a climate change adaptation initiative (Hatfield-Dodds & Morrison, 2010). Framing the costs of reducing CO2 emissions in terms of a decrease in future gain—rather than as an opportunity-cost—should counteract this tendency, thereby rendering people more willing to commit to climate change initiatives, irrespective of their worldview.
Finally, we must also take into account a person’s other goals when attempting to intervene. Part-funded by this grant was a theoretical journal article by Unsworth, Dmitrieva and Adriasola (in press). In this article, we argue that interventions to change behaviour to become more pro-environmental and adaptive are often not as effective as they possibly could be. We suggest firstly that the adaptive behaviour proposed by the intervention must be connected to a person’s other goals – this is in line with the empirical findings from the research outlined in this report. However, we argue that this is not the only necessary component for a new adaptive behaviour to be continued in the long-term. It must also not be in conflict with a person’s other goals. For example, if you are trying to increase public transport use, then a person is likely to take a bus to the workplace if their work is under control and they are not trying to reach particular work goals; however, as soon as a work goal becomes the priority, then the adaptive behaviour goal becomes “forgotten” and the person will take the quickest route to achieving their work goal (probably driving to work).
4.4 Comparisons across Population Groups One of the aims of our work was to examine these psychological drivers in different population groups, particularly vulnerable employee populations. Interestingly, we found that goal conflict and goal congruence was important for hospital employees, hospital executives and farmers. When there was goal conflict, then people not only felt disappointed, they also were less likely to engage in adaptive practices. They felt that adaptation would leave them vulnerable for meeting their core goals of viability and/or patient care. Finding a match between the adaptive behaviour and the core goals of the organisation (or farm) appears to be crucial in increasing adaptation in these vulnerable employee populations.
More broadly, we found few differences across men and women and, those differences that did emerge for age often disappeared when we accounted for their political orientation. However, we will be collecting survey data from a national sample that includes information for all of the variables outlined in this report; this survey should offer some more information about comparisons across population groups. This broader examination will also allow us to combine more data with postcodes such that we will be able to analyse any differences across regions within Australia.
What about me? Factors affecting individual adaptive coping capacity across different populations 142
4.5 Key Implications In summary, the key implications from our research to date are:
1. The importance of goal connectedness, not just “green” goals and values 2. The importance of coping 3. The importance of emotions 4. The importance of free market ideology and denial 5. The importance of climate change beliefs 6. The importance of message framing
What about me? Factors affecting individual adaptive coping capacity across different populations 143
5. GAPS AND FUTURE RESEARCH DIRECTIONS
In many of our studies, we were exploring new areas and new triggers to alter perceptions of climate change, adaptive capacity and adaptive behaviour. With such a high degree of novelty also comes a high risk. While we found many interesting findings, we also found some non-significant effects that create more questions to answer.
From the results of the political salience manipulation, it appears that the “environment” and “climate change” are highly politicised. It could be that the non-significant effects for the environmental salience manipulation in Studies Two, Three and Four were due to this politicisation and participants might have been reacting against the “push” towards thinking about environmental goals. Future research should focus on broader social goals that could be connected to adaptive behaviour and determine whether they are more easily changed. Similarly, in Study Nine, there was preliminary evidence that participants were reacting negatively to being nudged towards a climate change adaptive stance. Further research that includes a more subtle nudge (or more hidden amongst other topics) would be useful.
Given the promise identified by the literature for manipulating progress and commitment orientations, it would be useful to explore this further. Future research could try to make the interpretation of past behaviour more salient, perhaps by asking multiple questions about commitment versus progress (compared to only one in the current study). Second, because the likelihood of performing an intended behaviour increases with stronger intentions, one of the ways to allow people to act on their intention is to make that particular intention more salient (Sheeran et al., 2005). Future research should therefore also include a translation into explicit intentions to pursue the focal goal, thereby forming a bridge between the commitment and progress interpretations of past behaviour and future goal pursuit.
The findings regarding the political salience manipulation were particularly intriguing and deserve much greater attention. Future research that explores possible reasons for the finding such as disengagement from or frustration with politics, or political media influences, should be conducted.
Future research should also explore more systematically the effects of providing consensus information. Lewandowsky and colleagues (in press) recently found that providing people with information about the scientific consensus increases their acceptance of the science significantly. This effect occurs even for people whose ideology would otherwise predispose them towards rejection of the science. The reasons for that effect are not entirely understood, but because this effect is one of the few ways in which acceptance may be able to enhanced, it will be important to systematically explore the underlying reasons.
Furthermore, exploring how messages may be tailored is also a possible area of future research that emanates from our findings here. For example, does framing the risks associated with climate change and the benefits associated with emission reduction in a way that harmonizes with a person’s cultural values minimize the effect of free-
What about me? Factors affecting individual adaptive coping capacity across different populations 144
market ideology on climate change coping? For example, people who embrace a free-market ideology may be more likely to commit to emission reduction if the risks of failing to do so are couched not in terms of potential damages to the environment, but instead in terms of damages to business caused by the continued use of rapidly depleting, finitely-limited, natural energy resources. Similarly, such individuals may be more willing to commit to emission reduction if the benefits of doing so are framed not in terms of environmental gains, but in terms of increased financial opportunities in the market place fostered by the urgent need for alternative energy resources to sustain economic growth.
In everyday behaviour the range of psychological motives, influences and interactions with situations is extremely broad and complex. We believe that this will also be the case for adaptive capacity and adaptive behaviour. Therefore, the possible areas for future research that apply psychological and organisational theories to individual adaptation is vast. Our research is simply one step in that area.
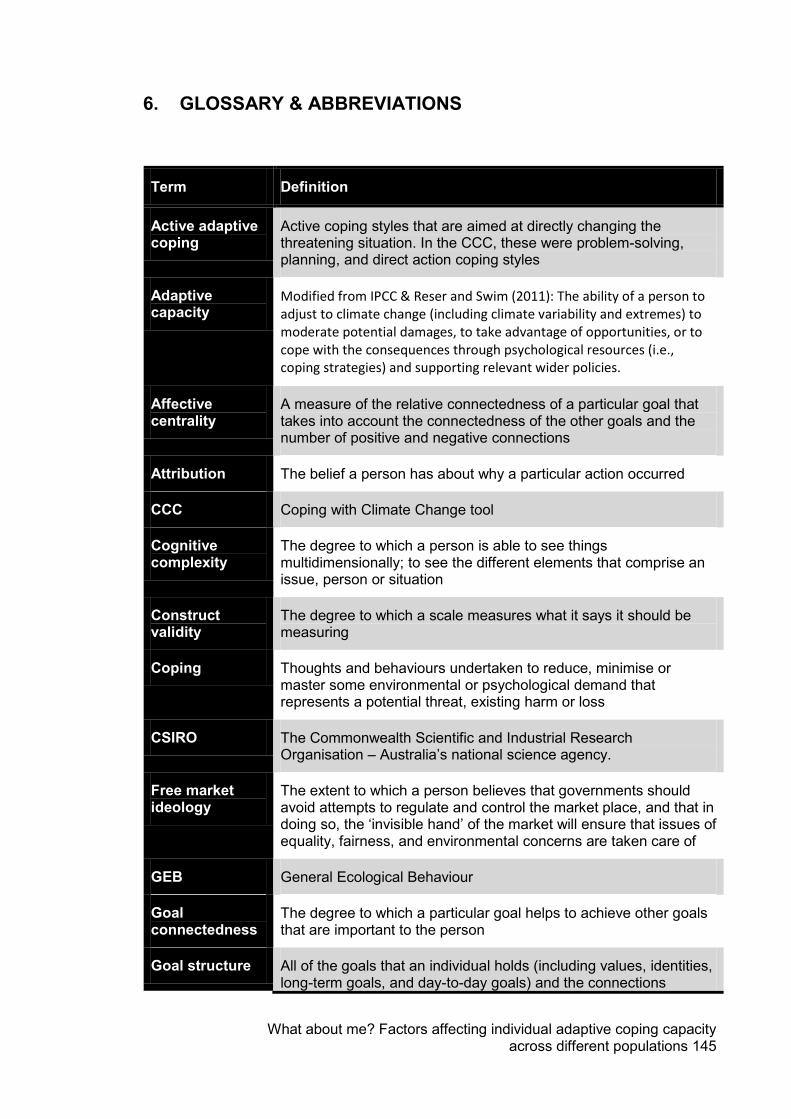
What about me? Factors affecting individual adaptive coping capacity across different populations 145
6. GLOSSARY & ABBREVIATIONS
Term Definition
Active adaptive coping
Active coping styles that are aimed at directly changing the threatening situation. In the CCC, these were problem-solving, planning, and direct action coping styles
Adaptive capacity
Modified from IPCC & Reser and Swim (2011): The ability of a person to adjust to climate change (including climate variability and extremes) to moderate potential damages, to take advantage of opportunities, or to cope with the consequences through psychological resources (i.e., coping strategies) and supporting relevant wider policies.
Affective centrality
A measure of the relative connectedness of a particular goal that takes into account the connectedness of the other goals and the number of positive and negative connections
Attribution The belief a person has about why a particular action occurred
CCC Coping with Climate Change tool
Cognitive complexity
The degree to which a person is able to see things multidimensionally; to see the different elements that comprise an issue, person or situation
Construct validity
The degree to which a scale measures what it says it should be measuring
Coping Thoughts and behaviours undertaken to reduce, minimise or master some environmental or psychological demand that represents a potential threat, existing harm or loss
CSIRO The Commonwealth Scientific and Industrial Research Organisation – Australia’s national science agency.
Free market ideology
The extent to which a person believes that governments should avoid attempts to regulate and control the market place, and that in doing so, the ‘invisible hand’ of the market will ensure that issues of equality, fairness, and environmental concerns are taken care of
GEB General Ecological Behaviour
Goal connectedness
The degree to which a particular goal helps to achieve other goals that are important to the person
Goal structure All of the goals that an individual holds (including values, identities, long-term goals, and day-to-day goals) and the connections
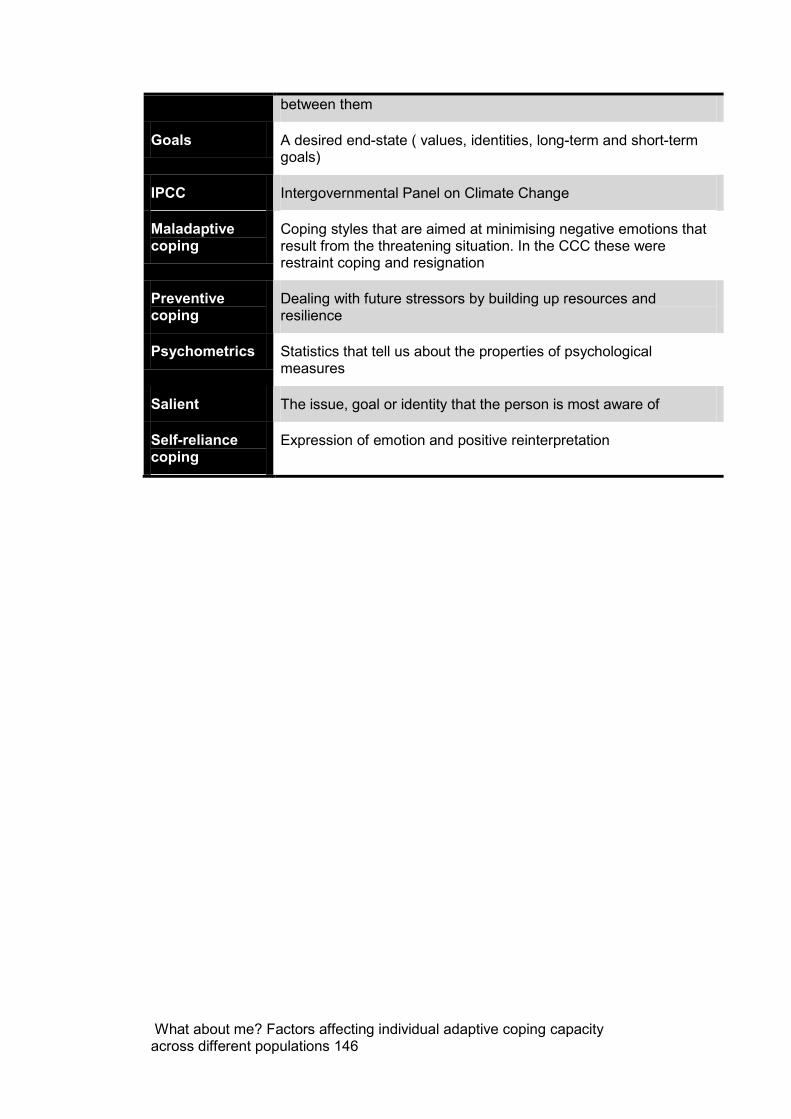
What about me? Factors affecting individual adaptive coping capacity across different populations 146
between them
Goals A desired end-state ( values, identities, long-term and short-term goals)
IPCC Intergovernmental Panel on Climate Change
Maladaptive coping
Coping styles that are aimed at minimising negative emotions that result from the threatening situation. In the CCC these were restraint coping and resignation
Preventive coping
Dealing with future stressors by building up resources and resilience
Psychometrics Statistics that tell us about the properties of psychological measures
Salient The issue, goal or identity that the person is most aware of
Self-reliance coping
Expression of emotion and positive reinterpretation
What about me? Factors affecting individual adaptive coping capacity across different populations 147
REFERENCES
Aarts, H., Custers, R., & Marien, H. (2008). Preparing and motivating behavior outside
of awareness. Science, 319, 1639. Abrahamse, W., Steg, L., Vlek, C., & Rothengatter, T. (2005). A review of intervention
studies aimed at household energy conservation. Journal of Environmental Psychology, 25(3).
Adriasola, E., & Unsworth, K. L. (2011). Leadership's effect on motivation: The effect of self-concordance and goal hierarchy. Paper presented at the Industrial Organisational Psychology Conference, Brisbane.
Adriasola, E., Unsworth, K. L., & Day, D. V. (2012). Goal self-concordance: Understanding its effects through a new conceptualisation and task differentiation. Paper presented at the Academy of Management Conference, Boston, USA.
Aitken, C. K., McMahon, T. A., Wearing, A. J., & Finlayson, B. L. (2004). Residential water use: Predicting and reducing consumption. Journal of Applied Social Psychology, 24(2), 136-158.
Ajzen, I., & Madden, T. J. (1986). Prediction of goal-directed behavior: Attitudes, intentions and perceived behavioral control. Journal of Experimental Social Psychology, 22, 453-474.
Artur, L., & Hilhorst, D. (2012). Everyday realities of climate change adaptation in Mozambique. Global Environment Change, 22(2), 529-536.
Austin, J. T., & Vancouver, J. B. (1996). Goal constructs in psychology: Structure, process and content. Psychological Bulletin, 120, 338-375.
Banerjee, S. B., Iyer, E. S., & Kashnap, R. K. (2003). Corporate environmentalism: Antecedents and influence of industry type. Journal of Marketing, 67(2), 106-122.
Bargh, J. A., Gollwitzer, P. M., Lee-Chai, A., Barndollar, K., & Trotschel, R. (2001). The automated will: Nonconscious activation and pursuit of behavioral goals. Journal of Personality and Social Psychology, 81(6), 1014-1027.
Bieri, J., Atkins, A. L., Briar, S., Leaman, R. L., Miller, H., & Tripodi, T. (1966). Clinical and social judgment. New York: Wiley.
Black, J. S., Stern, P. C., & Elworth, J. T. (1985). Personal and contextual influences on household energy adaptations. Journal of Applied Psychology, 70, 3-21.
Bryan, E., Ringler, C., Okoba, B., Roncoli, C., Silvestri, C., & Herrero, M. (2013). Adapting agriculture to climate change in Kenya: Household strategise and determinants. Journal of Environmental Management, 114, 26-35.
Carver, C. S., Scheier, M. F., & Segerstrom, S. C. (2010). Optimism. Clinical Psychology Review, 30, 879-889.
Carver, C. S., Scheier, M. F., & Weintraub, J. K. (1989). Assessing coping strategies: A theoretically based approach. Journal of Personality and Social Psychology, 56(2), 267-283.
De Young, R. (1993). Changing behavior and making it stick: The conceptualization and management of conservation behavior. Environment and Behavior, 25(4), 485-505.
De Young, R. (2000). Expanding and evaluating motives for environmentally responsible behavior. Journal of Social Issues, 56(3), 509-526.
Duhachek, A. (2005). Framework of responses to stressful consumption episodes. Journal of Consumer Research, 32(1), 41-53.
Ewert, A., & Galloway, G. (2009). Socially desirable responding in an environmental context: Development of a domain specific scale. Environmental Education Research, 15(1), 55-70.
What about me? Factors affecting individual adaptive coping capacity across different populations 148
Fineman, S. (1996). Emotional subtexts in corporate greening. Organization Studies, 17(3), 153-166.
Fineman, S. (1997). Constructing the green manager. British Journal of Management, 8(1), 31-38.
Fischer, A., & Glenk, K. (2011). One model fits all? On the moderating role of emotional engagement and confusion in the elicitation of preferences for climate change adaptation policies. Ecological Economics, in press.
Fishbach, A., Shah, J. Y., & Kruglanski, A. W. (2004). Emotional transfer in goal systems. Journal of Experimental Social Psychology, 40, 723-738.
Fishbach, A., Zhang, Y., & Koo, M. (2009). The dynamics of self-regulation. European Review of Social Psychology, 20, 315-344.
Fornell, C., & Larcker, D. F. (1981). Evaluating structural equation models with unobservable variables and measurement error. Journal of Marketing Research, 18(1), 39-50.
Fredrickson, B. L. (2001). The role of positive emotions in positive psychology: The broaden-and-build theory of positive emotions. American Psychologist, 56, 218-226.
Gardner, J., Dowd, A.-M., Mason, C. M., & Ashworth, P. (2009). A framework for stakeholder engagement on climate adaptation CSIRO Climate Adaptation Flagship Working Paper.
Gifford, R. (2011). The dragons of inaction: Psychological barriers that limit climate change mitigation and adaptation. American Psychologist, 66(4), 290-302.
Greenglass, E. R., & Fiksenbaum, L. (2009). Proactive coping, positive affect and well-being: Testing for mediation using path analysis. European Psychologist, 14(1), 29-39.
Greenglass, E. R., Schwarzer, R., Jakubiec, D., Fiksenbaum, L., & Taubert, S. (1999). The proactive coping inventory (PCI): A multidimensional research instrument. Paper presented at the 20th International Conference of the Stress and Anxiety Research Society, Cracow, Poland.
Grothmann, T., & Patt, A. (2005). Adaptive capacity and human cognition: The process of individual adaptation to climate change. Global Environment Change, 15, 199-213.
Hatfield-Dodds, S., & Morrison, M. (2010). Confusing opportunity costs, losses and foregone gains: Assessing the effect of communication bias on support for climate change policy in the United States and Australia The CCEP working paper (Vol. 9.10).
Heath, Y., & Gifford, R. (2006). Free-market ideology and environmental degradation: The case of beliefs in global climate change. Environment and Behavior, 38(1), 48-71.
Hisali, E., Birungi, P., & Buyinza, F. (2011). Adaptation to climate change in Uganda: Evidence from micro-level data. Global Environment Change, 21(4), 1245-1261.
Hogg, M. A., & Terry, D. J. (2000). Social identity and self-categorization processes in organizational contexts. Academy of Management Review, 25(1), 121-140.
Homburg, A., Stolberg, A., & Wagner, U. (2007). Coping with global environmental problems: Development and first validation of scales. Environment and Behavior, 39(6), 754-778.
Howard, J. (2008). Climate change mitigation and adaptation: What's the difference and how do they relate to each other? Retrieved 18 Mar 2013, 2013, from www.climatechangeecon.org
Huq, S., & Grubb, M. (2003). Scientific assessment of the inter-relationships of mitigation and adaptation. In IPCC (Ed.), Scoping Paper for the IPCC 4th Assessment Report.
IPCC. (2007a). Climate change 2007: Synthesis report. Summary for policy makers. IPCC. (2007b). Fourth Assessment Report: Climate Change 2007.
What about me? Factors affecting individual adaptive coping capacity across different populations 149
Judge, T. A., Erez, A., Bono, J. E., & Thoresen, C. E. (2003). The core self-evaluations scale: Development of a measure. Personnel Psychology, 56, 303-331.
Kaiser, F. G. (1998). A general measure of ecological behavior. Journal of Applied Social Psychology, 28(5), 395-422.
Kaiser, F. G., Doka, G., Hofstetter, P., & Ranney, M. A. (2003). Ecological behavior and its environmental consequences: A life-cycle assessment of a self-report measure. Journal of Environmental Psychology, 23, 11-20.
Kaiser, F. G., & Wilson, M. (2000). Assessing people's general ecological behavior: A cross-cultural measure. Journal of Applied Social Psychology, 30(5), 952-978.
Kaiser, F. G., & Wilson, M. (2004). Goal-directed conservation behavior: The specific composition of a general performance. Personality and Individual Differences, 36, 1531-1544.
Kals, E., Schumacher, D., & Montado, L. (1999). Emotional affinity toward nature as a basis to protect nature. Environment and Behavior, 31(2), 178-202.
Kelly, G. A. (1955). The psychology of personal constructs. New York: Norton. Lazarus, R. S. (1966). Psychological stress and the coping process. New York:
McGraw-Hill. Lazarus, R. S. (1991a). Emotion and adaptation. New York: Oxford University Press. Lazarus, R. S. (1991b). Progress on a cognitive-motivational-relational theory of
emotion. American Psychologist, 46(8), 819-834. Lazarus, R. S., & Folkman, S. (1984). Stress, appraisal and coping. New York:
Springer. Lazarus, R. S., & Folkman, S. (1991). Stress, appraisal and coping. New York:
Springer. Lehman, P. K., & Geller, E. S. (2004). Behavior analysis and environmental protection:
Accomplishments and potential for more. Behavior and Social Issues, 13, 13-32.
Levenson, R. W. (1994). Human emotions: A functional view. In P. Ekman & R. Davidson (Eds.), The Nature of Emotion: Fundamental Questions (pp. 123-126). New York: University Press.
Leviston, Z., & Walker, I. (2011). Second annual survey of Australian attitudes to climate change: Interim Report Social and Behaviour Sciences Research Group: CSIRO.
Lewandowsky, S., Gignac, G. E., & Vaughan, S. (in press). The pivotal role of perceived scientific consensus in acceptance of science. Nature: Climate Change.
Lord, K. R. (1994). Motivating recycling behavior: A quasiexperimental investigation of message and source strategies. Psychology & Marketing, 11(4), 341-358.
Lubell, M. (2002). Environmental activism as collective action. Environment and Behavior, 34(4), 431-454.
McCrae, R. R. (1984). Situational determinants of coping responses: Loss, threat and challenge. Journal of Personality and Social Psychology, 46(4), 919-928.
Mirisola, A., Sibley, C. G., Boca, S., & Duckitt, J. (2007). On the ideological consistency between right-wing authoritarianism and social dominance orientation. Personality and Individual Differences, 43(7), 1851-1862.
Osbaldiston, R., & Schott, J. P. (2012). Environmental sustainability and behavioral science: Meta-analysis of proenvironmental behavior experiments. Environment and Behavior, 44, 257-299.
Pratt, M. G., & Dutton, J. E. (2000). Owning up or opting out: The role of emotions and identities in issue ownership. In N. M. Ashkanasy, C. E. J. Hartel & W. J. Zerbe (Eds.), Emotions in the workplace: Research, theory and practice (pp. 103-129). Westport: Quorum Books.
What about me? Factors affecting individual adaptive coping capacity across different populations 150
Reser, J. P., Bradley, G., & Ellul, M. (2012). Coping with climate change: Bringing psychological adaptation in from the cold. In B. Molinelli & V. Grimaldo (Eds.), Handbook of the psychology of coping: New research: Nova Publishers.
Reser, J. P., & Swim, J. K. (2011). Adapting to and coping with the threat and impacts of climate change. American Psychologist, 66(4), 277-289.
Reynolds, K. J., Turner, J. C., Haslam, S. A., & Ryan, M. K. (2001). The role of personality and group factors in explaining prejudice. Journal of Experimental Social Psychology, 37, 427-424.
Saucier, G., & Goldberg, L. R. (1998). What is beyond the big five? Journal of Personality, 66(4), 495-524.
Scheier, M. F., Carver, C. S., & Bridges, M. W. (1994). Distinguishing optimism from neuroticism (and trait anxiet, self-mastery, and self-esteem): A reevaluation of the Life Orientation Test.
Schultz, P. W., Nolan, J. M., Cialdini, R. B., Goldstein, N. J., & Griskevicius, V. (2007). The constructive, destructive and reconstructive power of social norms. Psychological Science, 18, 429-434.
Schultz, P. W., Oskamp, S., & Mainieri, T. (1995). Who recycles and when? A review of personal and situational factors. Journal of Environmental Psychology, 15, 105-121.
Schultz, P. W., & Zelezny, L. (2003). Reframing environmental messages to be congruent with American values. Human Ecology Review, 10, 126-136.
Schwartz, S. H. (1992). Universals in the content and structure of values: Theoretical advances and empirical tests in 20 countries. In M. Zanna (Ed.), Advances in experimental social psychology (Vol. 25, pp. 1-65)). Orlando: Academic.
Schwartz, S. H. (1994). Are There Universal Aspects in the Structure and Contents of Human Values? Journal of Social Issues, 50(4), 19-45.
Shantz, A., & Latham, G. P. (2009). An exploratory field experiment of the effect of subconscious and conscious goals on employee performance. Organizational Behavior and Human Decision Processes, 109, 9-17.
Skinner, E. A., Edge, K., Altman, J., & Sherwood, H. (2003). Searching for the structure of coping: A review and critique of category systms for classifying ways of coping. Psychological Bulletin, 129(2), 216-269.
Skinner, N., & Brewer, N. (2002). The dynamics of threat and challenge appraisals prior to stressful achievement events. Journal of Personality and Social Psychology, 83(3), 678-692.
Smith, T. F., Lynam, T., & Preston, B. L. (2010). Towards enhancing adaptive capacity for climate change response in South East Queensland. Australasian Journal of Disaster and Trauma Studies, 2010(1).
Steg , L., & Vlek, C. (2009). Encouraging pro-environmental behavior: An integrative review and research agenda. Journal of Environmental Psychology, 29, 309-317.
Stern, P. C. (2000). Toward a coherent theory of environmentally significant behavior. Journal of Social Issues, 56(3), 407-424.
Stern, P. C. (2011). Contributions of psychology to limiting climate change. American Psychologist, 66(4), 303-314.
Stern, P. C., & Dietz, T. (1994). The Value Basis of Environmental Concern. Journal of Social Issues, 50(3), 65-84.
Turner, J. C., Oakes, P. J., Haslam, S. A., & McGarty, C. (1994). Self and collective: Cognition and social context. Personality and Social Psychology Bulletin, 20(5), 454-463.
Unsworth, K. L., Adriasola, E., Johnston-Billings, A., Dmitrieva, A., & Hodkiewicz, M. R. (2011). Goal hierarchy: Improving asset data quality by improving motivation. Reliability Engineering and System Safety, 96, 1474-1481.
What about me? Factors affecting individual adaptive coping capacity across different populations 151
Unsworth, K. L., Dmitrieva, A., & Adriasola, E. (in press). Changing behavior: Increasing the effectiveness of workplace interventions in creating pro-environmental behavior change. Journal of Organizational Behavior.
Watson, D., Clark, L. A., & Tellegen, A. (1988). Development and validation of brief measures of positive and negative affect. Journal of Personality and Social Psychology, 54(6), 1063-1070.
Weaver, D. (2011). Can sustainable tourism survive climate change? Journal of Sustainable Tourism, 19(1), 5-15.
Winn, M., Kirchgeorg, M., Griffiths, A., Linnenluecke, M. K., & Gunther, E. (2011). Impacts from climate change on organizations: A conceptual foundation. Business Strategy and the Environment, 20(3), 157-173.
Woehr, D. J., Miller, M. J., & Lane, J. A. S. (1998). The development and evaluation of a computer-administered measure of cognitive complexity. Personality and Individual Differences, 25(6), 1037-1049.
i For those interested in research which has been conducted we direct you to recent examples such as work at local levels looking at farmers in Kenya (2013) or farmers in Uganda (Hisali, Birungi, & Buyinza, 2011), on responses to flooding in Mozambique (2012) or in Scotland (Fischer & Glenk, 2011). More broadly, other work has considered the psychological and behavioural factors in adaptation and we direct the interested reader to this work (Black, Stern, & Elworth, 1985; Gardner, Dowd, Mason, & Ashworth, 2009; Gifford, 2011; Reser, Bradley, & Ellul, 2012; Reser & Swim, 2011).