WHA Corporation PCL - SET
48
Opportunity Day FY2017 Result WHA Corporation PCL Your Ultimate Solution Partner
Transcript of WHA Corporation PCL - SET
Opportunity Day
FY2017 Result
WHA Corporation PCL
Your Ultimate Solution Partner
Disclaimers WHA Group
The information contained in this presentation is for information purposes only and does not constitute an offer or invitation to sell or the solicitation of an offer or invitation to purchase or subscribe for share in WHA Corporation Public Company Limited (“WHA” and shares in WHA, “shares”) in any jurisdiction nor should it or any part of it form the basis of, or be relied upon in any connection with, any contract or commitment whatsoever. In addition, this presentation contains projections and forward-looking statements that reflect the Company's current views with respect to future events and financial performance. These views are based on a number of estimates and current assumptions which are subject to business, economic and competitive uncertainties and contingencies as well as various risks and these may change over time and in many cases are outside the control of the Company and its directors. You are cautioned not to place undue reliance on these forward looking statements, which are based on the current view of the management of the Company on future events. No assurance can be given that future events will occur, that projections will be achieved, or that the Company's assumptions are correct. The Company does not assume any responsibility to amend, modify or revise any forward-looking statements, on the basis of any subsequent developments, information or events, or otherwise. These statements can be recognized by the use of words such as “expects,” “plans,” “will,” “estimates,” “projects,” or words of similar meaning. Such forward-looking statements are not guarantees of future performance and actual results may differ from those forecast and projected or in the forward-looking statements as a result of various factors and assumptions.
2
Agenda
II. Summary of Operating Performance - 2017
IV. Financial Performance - 2017
Appendix
3
I. WHA Group Overview
III. Business and Financing Plan - 2018
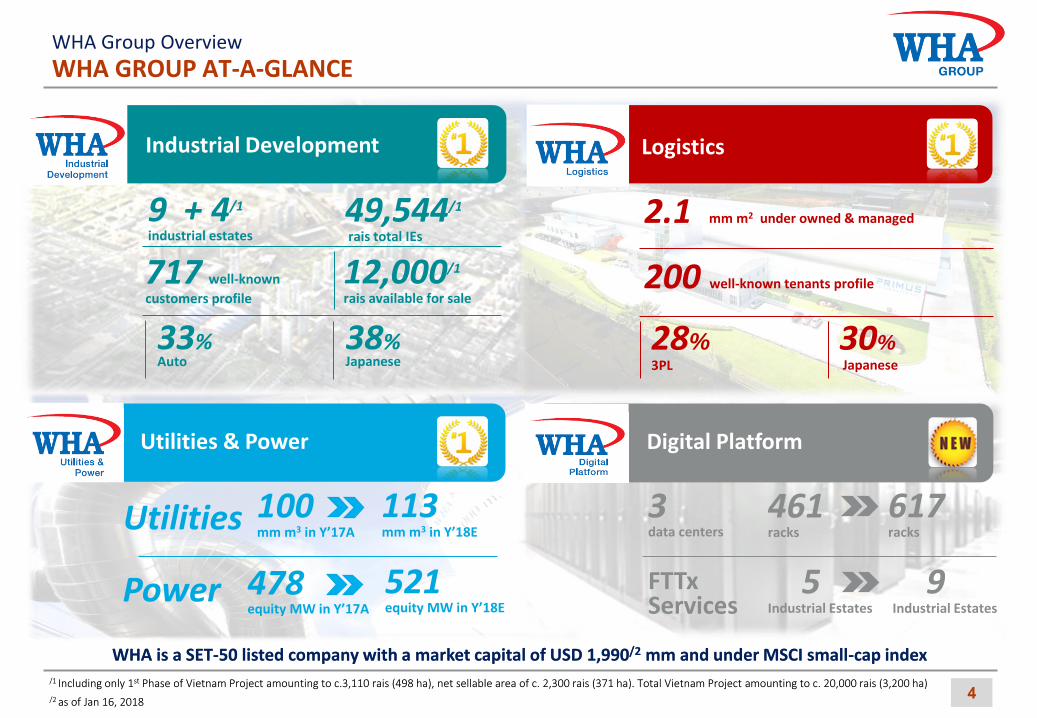
WHA GROUP AT-A-GLANCE WHA Group Overview
/1 Including only 1st Phase of Vietnam Project amounting to c.3,110 rais (498 ha), net sellable area of c. 2,300 rais (371 ha). Total Vietnam Project amounting to c. 20,000 rais (3,200 ha)
/2 as of Jan 16, 2018
WHA is a SET-50 listed company with a market capital of USD 1,990/2 mm and under MSCI small-cap index
4
2.1 mm m2 under owned & managed
200 well‐known tenants profile
28% 3PL
30% Japanese
Logistics
9 + 4/1 industrial estates
717 well‐known
customers profile
33% Auto
38% Japanese
12,000/1
rais available for sale
49,544/1
rais total IEs
Industrial Development
100 mm m3 in Y’17A
478 equity MW in Y’17A
113 mm m3 in Y’18E
521 equity MW in Y’18E
Utilities & Power
3 data centers
FTTx Services
Digital Platform
Utilities
Power
Remark: /1The Utilities & Power business’s operating matrix under WHA level may differ from one shown in WHAUP level as a result of Pre-IPO restructuring, resulting in partial recognition in FY2016 under WHAUP.
461 racks
617 racks
5 Industrial Estates
9 Industrial Estates
5
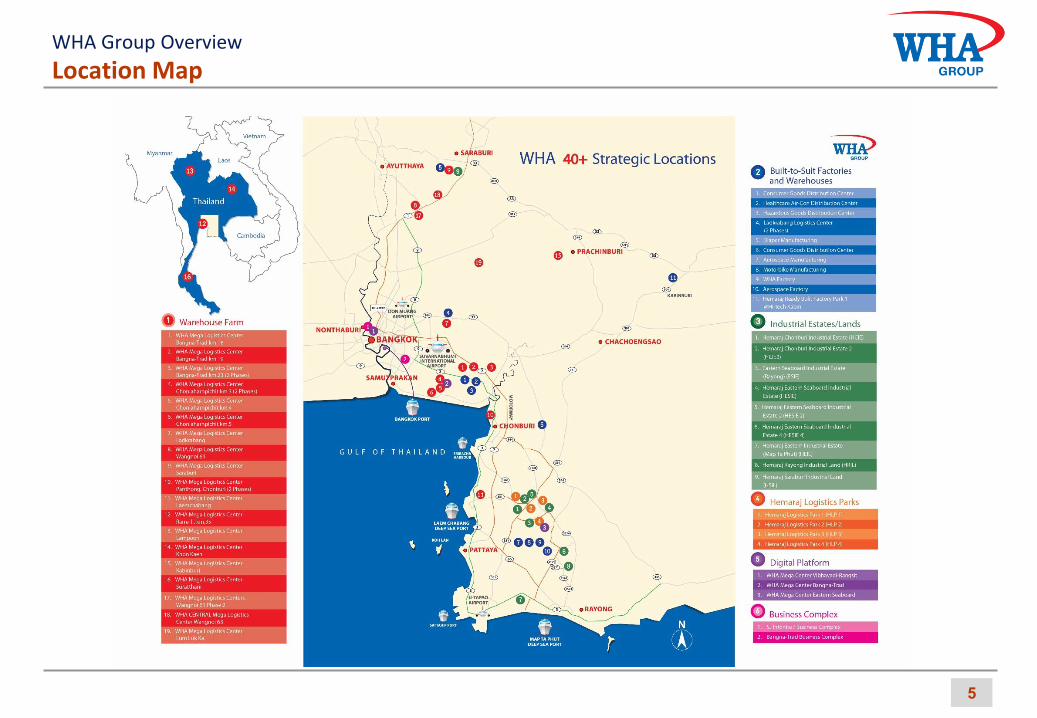
Location Map WHA Group Overview
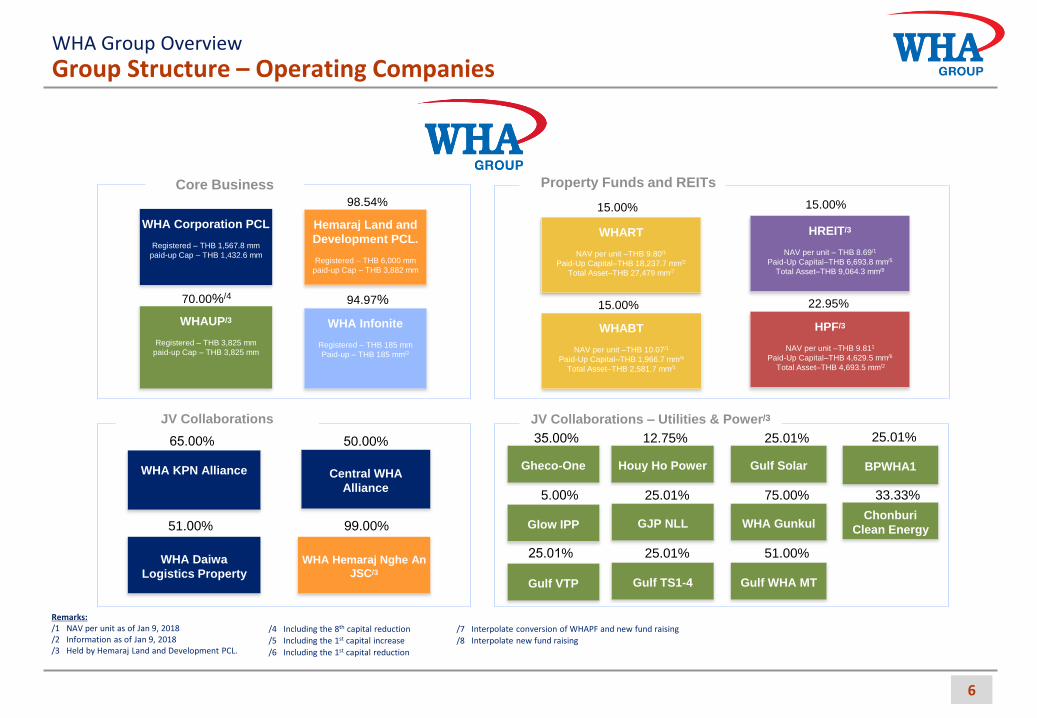
Group Structure – Operating Companies WHA Group Overview
Warehouse
Asia Alliance Registered and
Paid-up
Capital – THB 310
mm
WHA
Alliance Registered and
Paid-up
Capital – THB 260
mm
WHA KPN Alliance
Central WHA
Alliance
PT WHA
International
Indonesia/1
Registered and Paid-up
Capital – US 2.0
mm
WHART
NAV per unit –THB 9.80/1
Paid-Up Capital–THB 18,237.7 mm/2
Total Asset–THB 27,479 mm/7
WHABT
NAV per unit –THB 10.07/1
Paid-Up Capital–THB 1,966.7 mm/4
Total Asset–THB 2,581.7 mm/1
99.9% 99.9% 99.9% 99.9%
15.00%
15.00%
Remarks: /1 NAV per unit as of Jan 9, 2018 /2 Information as of Jan 9, 2018 /3 Held by Hemaraj Land and Development PCL.
WHA Daiwa
Logistics Property
WHA Infonite
Registered – THB 185 mm
Paid-up – THB 185 mm/2
Hemaraj Land and
Development PCL.
Registered – THB 6,000 mm
paid-up Cap – THB 3,882 mm
98.54%
94.97%
Core Business
WHA Corporation PCL
Registered – THB 1,567.8 mm
paid-up Cap – THB 1,432.6 mm
WHAUP/3
Registered – THB 3,825 mm
paid-up Cap – THB 3,825 mm
70.00%/4
Property Funds and REITs
HPF/3
NAV per unit –THB 9.811
Paid-Up Capital–THB 4,629.5 mm/6
Total Asset–THB 4,693.5 mm/2
22.95%
HREIT/3
NAV per unit – THB 8.69/1
Paid-Up Capital–THB 6,693.8 mm/5
Total Asset–THB 9,064.3 mm/8
15.00%
JV Collaborations
Gheco-One
Glow IPP
Houy Ho Power
GJP NLL
Gulf Solar
WHA Gunkul
BPWHA1
JV Collaborations – Utilities & Power/3
65.00% 50.00%
51.00%
35.00%
5.00%
12.75%
25.01%
25.01%
75.00%
25.01%
Chonburi
Clean Energy
33.33%
WHA Hemaraj Nghe An
JSC/3
99.00%
/4 Including the 8th capital reduction
/5 Including the 1st capital increase
/6 Including the 1st capital reduction
6
Total Fund Raised c. THB 39,138 mm
Gulf VTP Gulf TS1-4 Gulf WHA MT
25.01% 25.01% 51.00%
/7 Interpolate conversion of WHAPF and new fund raising
/8 Interpolate new fund raising
7
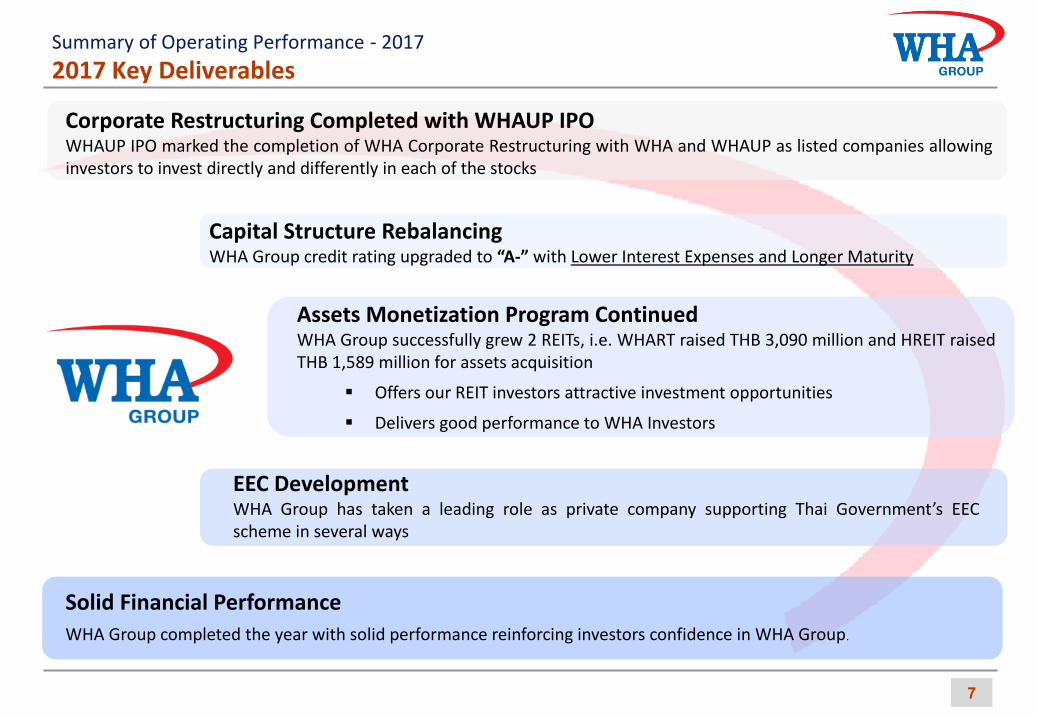
2017 Key Deliverables Summary of Operating Performance - 2017
Corporate Restructuring Completed with WHAUP IPO WHAUP IPO marked the completion of WHA Corporate Restructuring with WHA and WHAUP as listed companies allowing investors to invest directly and differently in each of the stocks
Capital Structure Rebalancing WHA Group credit rating upgraded to “A-” with Lower Interest Expenses and Longer Maturity
Assets Monetization Program Continued WHA Group successfully grew 2 REITs, i.e. WHART raised THB 3,090 million and HREIT raised THB 1,589 million for assets acquisition
Offers our REIT investors attractive investment opportunities
Delivers good performance to WHA Investors
EEC Development WHA Group has taken a leading role as private company supporting Thai Government’s EEC scheme in several ways
Solid Financial Performance
WHA Group completed the year with solid performance reinforcing investors confidence in WHA Group.
8
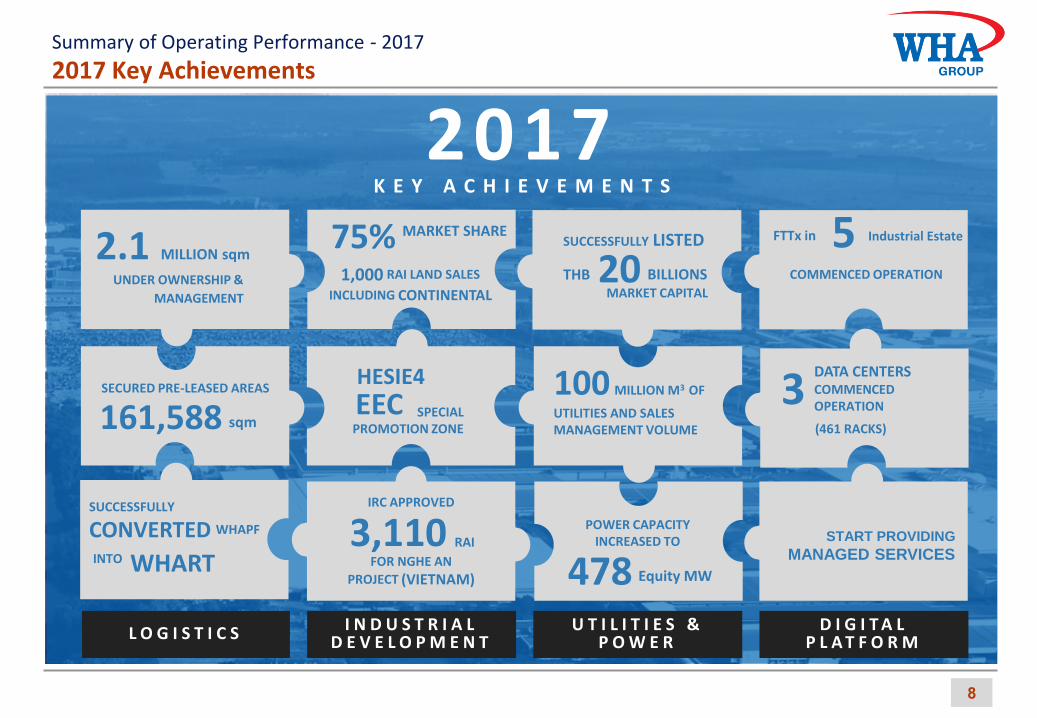
2017 Key Achievements
K E Y A C H I E V E M E N T S
POWER CAPACITY INCREASED TO
478 Equity MW
3 DATA CENTERS COMMENCED OPERATION
(461 RACKS) 161,588 SECURED PRE-LEASED AREAS
sqm
2.1 MILLION sqm
UNDER OWNERSHIP &
MANAGEMENT
5 COMMENCED OPERATION
FTTx in
20 THB BILLIONS MARKET CAPITAL
SUCCESSFULLY LISTED
3,110 IRC APPROVED
FOR NGHE AN
PROJECT (VIETNAM)
RAI
HESIE4
SPECIAL PROMOTION ZONE
EEC 100
MILLION M3 OF
UTILITIES AND SALES MANAGEMENT VOLUME
L O G I S T I C S I N D U S T R I A L D E V E L O P M E N T
U T I L I T I E S & P O W E R
D I G I T A L P L A T F O R M
START PROVIDING
MANAGED SERVICES
75% 1,000 RAI LAND SALES
INCLUDING CONTINENTAL
MARKET SHARE
WHART
SUCCESSFULLY
CONVERTED WHAPF
INTO
2017 Industrial Estate
Summary of Operating Performance - 2017
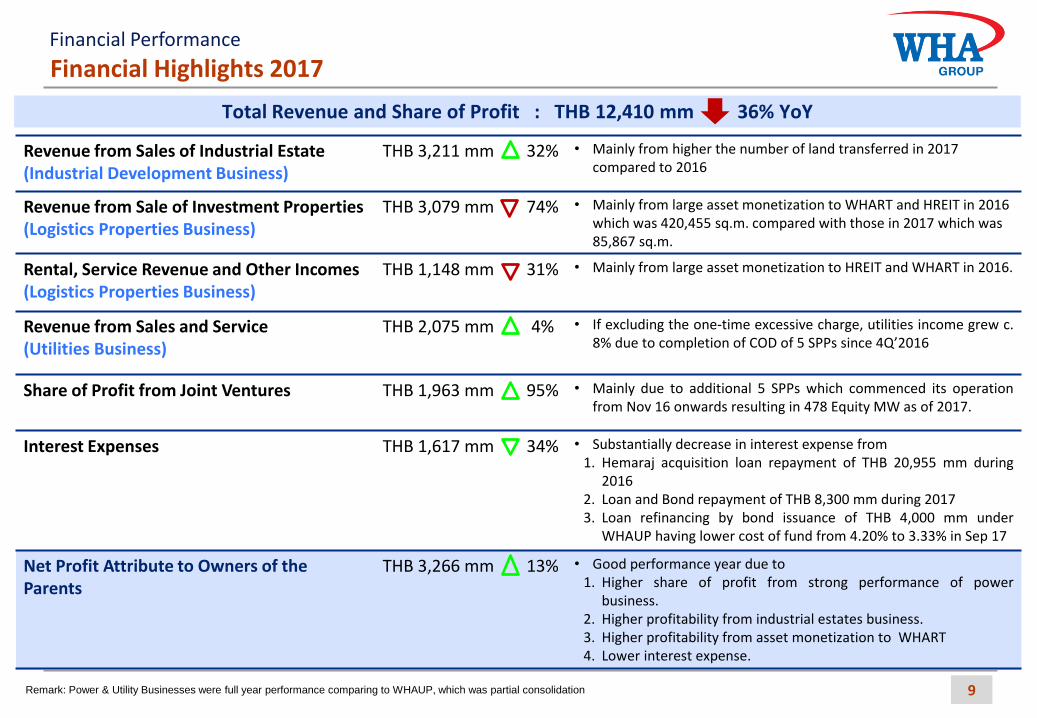
Revenue from Sales of Industrial Estate (Industrial Development Business)
THB 3,211 mm 32% • Mainly from higher the number of land transferred in 2017 compared to 2016
Revenue from Sale of Investment Properties (Logistics Properties Business)
THB 3,079 mm 74%
• Mainly from large asset monetization to WHART and HREIT in 2016 which was 420,455 sq.m. compared with those in 2017 which was 85,867 sq.m.
Rental, Service Revenue and Other Incomes (Logistics Properties Business)
THB 1,148 mm 31% • Mainly from large asset monetization to HREIT and WHART in 2016.
Revenue from Sales and Service (Utilities Business)
THB 2,075 mm 4% • If excluding the one-time excessive charge, utilities income grew c. 8% due to completion of COD of 5 SPPs since 4Q’2016
Share of Profit from Joint Ventures THB 1,963 mm 95% • Mainly due to additional 5 SPPs which commenced its operation from Nov 16 onwards resulting in 478 Equity MW as of 2017.
Interest Expenses THB 1,617 mm 34% • Substantially decrease in interest expense from 1. Hemaraj acquisition loan repayment of THB 20,955 mm during
2016 2. Loan and Bond repayment of THB 8,300 mm during 2017 3. Loan refinancing by bond issuance of THB 4,000 mm under
WHAUP having lower cost of fund from 4.20% to 3.33% in Sep 17
Net Profit Attribute to Owners of the Parents
THB 3,266 mm
13% • Good performance year due to 1. Higher share of profit from strong performance of power
business. 2. Higher profitability from industrial estates business. 3. Higher profitability from asset monetization to WHART 4. Lower interest expense.
Financial Highlights 2017 Financial Performance
Remark: Power & Utility Businesses were full year performance comparing to WHAUP, which was partial consolidation 9
Total Revenue and Share of Profit : THB 12,410 mm 36% YoY
Year Market (rai) Hemaraj (rai) % Market
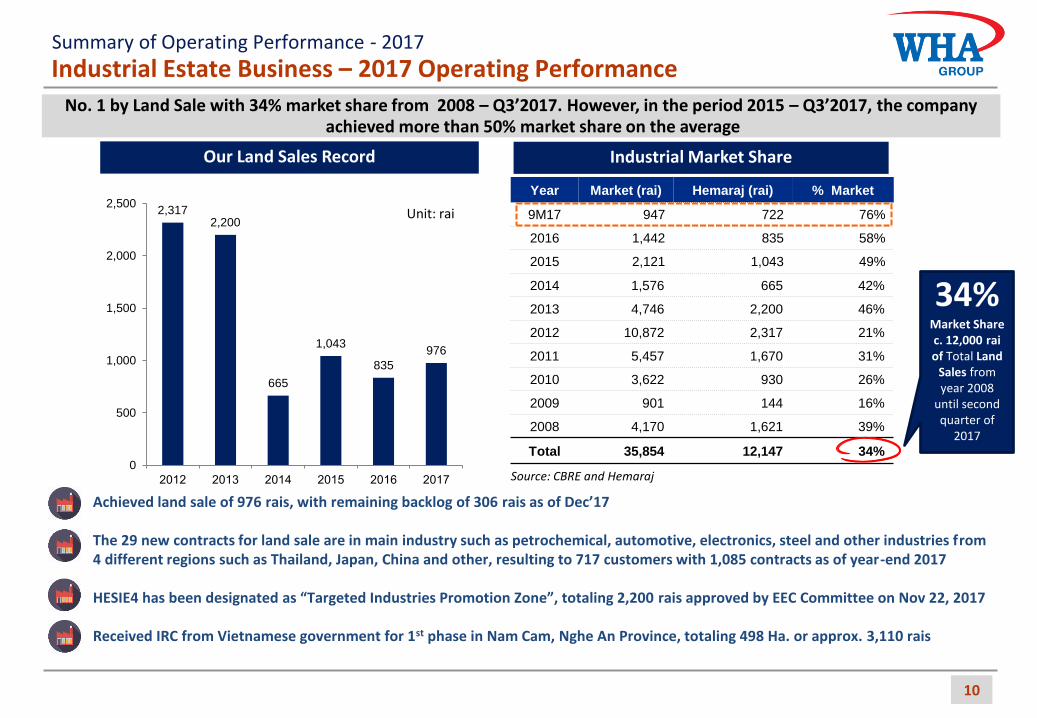
9M17 947 722 76%
2016 1,442 835 58%
2015 2,121 1,043 49%
2014 1,576 665 42%
2013 4,746 2,200 46%
2012 10,872 2,317 21%
2011 5,457 1,670 31%
2010 3,622 930 26%
2009 901 144 16%
2008 4,170 1,621 39%
Total 35,854 12,147 34%
10
Industrial Estate Business – 2017 Operating Performance No. 1 by Land Sale with 34% market share from 2008 – Q3’2017. However, in the period 2015 – Q3’2017, the company
achieved more than 50% market share on the average
Source: CBRE and Hemaraj
Our Land Sales Record
Unit: rai
Industrial Market Share
34% Market Share c. 12,000 rai of Total Land
Sales from year 2008
until second quarter of
2017
Achieved land sale of 976 rais, with remaining backlog of 306 rais as of Dec’17 The 29 new contracts for land sale are in main industry such as petrochemical, automotive, electronics, steel and other industries from
4 different regions such as Thailand, Japan, China and other, resulting to 717 customers with 1,085 contracts as of year-end 2017
HESIE4 has been designated as “Targeted Industries Promotion Zone”, totaling 2,200 rais approved by EEC Committee on Nov 22, 2017
Received IRC from Vietnamese government for 1st phase in Nam Cam, Nghe An Province, totaling 498 Ha. or approx. 3,110 rais
2,317 2,200
665
1,043
835
976
0
500
1,000
1,500
2,000
2,500
2012 2013 2014 2015 2016 2017
Summary of Operating Performance - 2017
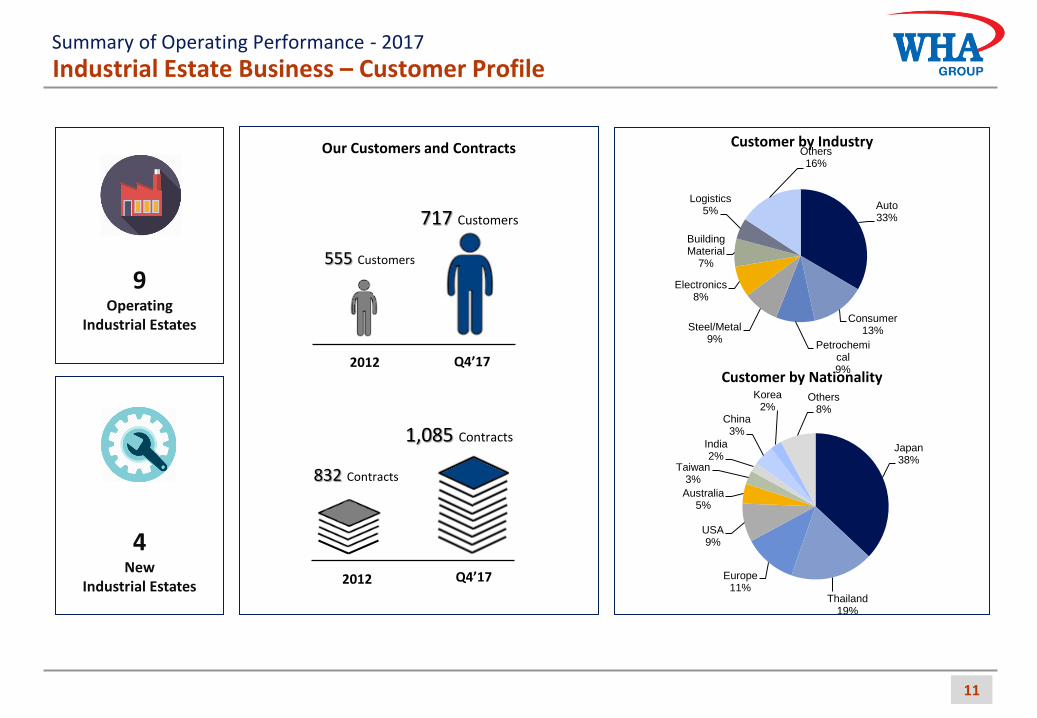
Japan 38%
Thailand 19%
Europe 11%
USA 9%
Australia 5%
Taiwan 3%
India 2%
China 3%
Korea 2%
Others 8%
11
Industrial Estate Business – Customer Profile
Customer by Industry
Customer by Nationality
Our Customers and Contracts
2012
717 Customers
Q4’17
832 Contracts
2012
1,085 Contracts
Q4’17
555 Customers
9 Operating
Industrial Estates
4
New Industrial Estates
Auto 33%
Consumer 13%
Petrochemical 9%
Steel/Metal 9%
Electronics 8%
Building Material
7%
Logistics 5%
Others 16%
Summary of Operating Performance - 2017
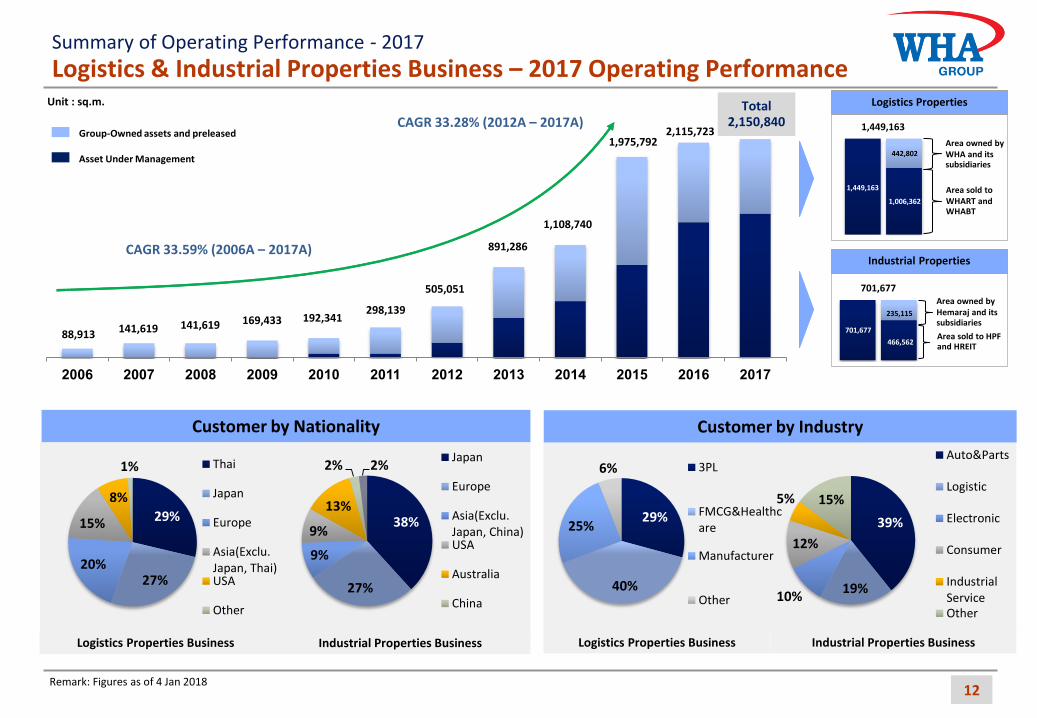
Logistics & Industrial Properties Business – 2017 Operating Performance • Built-to-Suit distribution center and warehouse in prime location to help
customers optimize long-term logistics cost
• Built-to-Suit factory with cross referral of customers from HEMRAJ esp. those in high value sectors e.g. automotive
• Sophisticated Built-to-Suit product e.g. cold storage, multi-temp DC, and E-Commerce DC
• Ready-Built factory and warehouse in IEs and logistic parks
• Geographical expansion e.g. Indonesia and Vietnam
Group-Owned assets and preleased Asset Under Management
12
Area owned by Hemaraj and its subsidiaries
Area sold to HPF and HREIT
Industrial Properties
Area owned by WHA and its subsidiaries
Area sold to WHART and WHABT
Logistics Properties
701,677
235,115
466,562
701,677
1,449,163
1,006,362
442,802
1,449,163
Location • Bangna-Trad
km 18-23 • Ladkrabang • Rama II • Laem Chabang • Lum Luk Ka • Wangnoi
Location • Chonburi • Rayong • Saraburi • Prachin Buri
Area: 2,144 rais Area: 979 rais
2006 2007 2008 2009 2010 2011 2012 2013 2014 2015 2016 2017
88,913 141,619 141,619 169,433
891,286
298,139 192,341
505,051
1,108,740
Total 2,150,840
1,975,792 2,115,723
Unit : sq.m.
CAGR 33.59% (2006A – 2017A)
CAGR 33.28% (2012A – 2017A)
Remark: Figures as of 4 Jan 2018
Summary of Operating Performance - 2017
29%
27% 20%
15%
8%
1% Thai
Japan
Europe
Asia(Exclu.Japan, Thai)USA
Other
29%
40%
25%
6% 3PL
FMCG&Healthcare
Manufacturer
Other
38%
27%
9%
9%
13%
2% 2% Japan
Europe
Asia(Exclu.Japan, China)USA
Australia
China
39%
19% 10%
12%
5% 15%
Auto&Parts
Logistic
Electronic
Consumer
IndustrialServiceOther
Industrial Properties Business Logistics Properties Business
Customer by Nationality Customer by Industry
Industrial Properties Business Logistics Properties Business
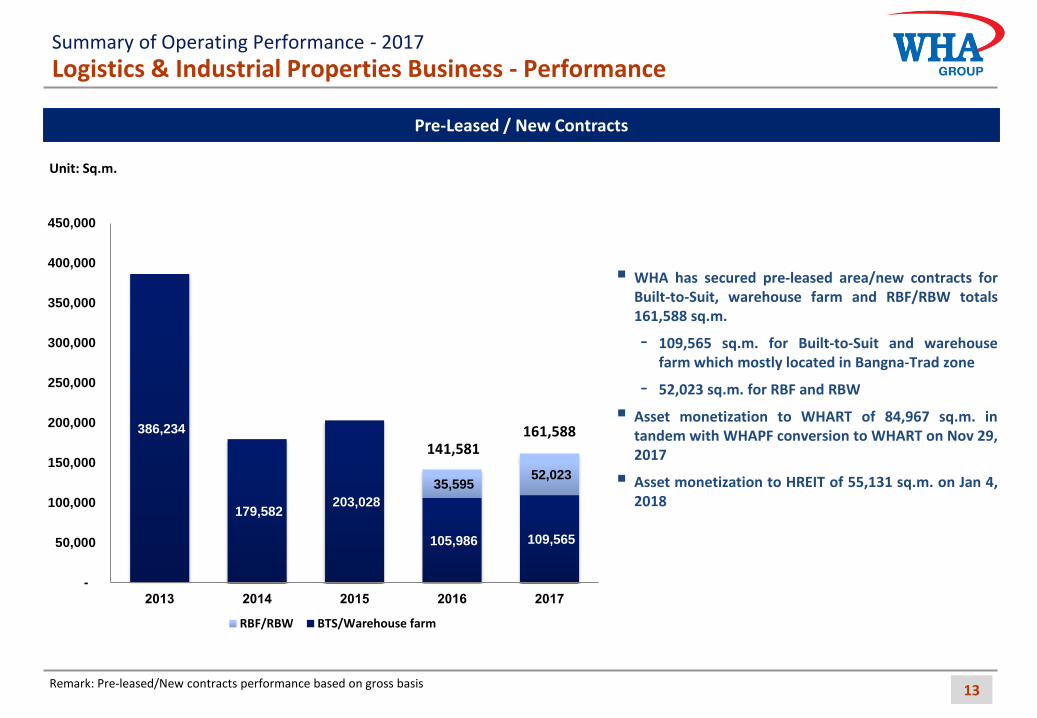
386,234
179,582 203,028
105,986 109,565
35,595 52,023
-
50,000
100,000
150,000
200,000
250,000
300,000
350,000
400,000
450,000
2013 2014 2015 2016 2017
RBF/RBW BTS/Warehouse farm
Logistics & Industrial Properties Business - Performance
13
Unit: Sq.m.
141,581
Pre-Leased / New Contracts
161,588
Remark: Pre-leased/New contracts performance based on gross basis
WHA has secured pre-leased area/new contracts for Built-to-Suit, warehouse farm and RBF/RBW totals 161,588 sq.m.
- 109,565 sq.m. for Built-to-Suit and warehouse farm which mostly located in Bangna-Trad zone
- 52,023 sq.m. for RBF and RBW
Asset monetization to WHART of 84,967 sq.m. in tandem with WHAPF conversion to WHART on Nov 29, 2017
Asset monetization to HREIT of 55,131 sq.m. on Jan 4, 2018
Summary of Operating Performance - 2017
34 39 42 43 46 49
23 22 21 19 17 17
28 29 31 32 33 34
85 90 94 94 96 100
-10
10
30
50
70
90
110
130
150
2012 2013 2014 2015 2016 2017
Industrial Water Raw Water Wastewater
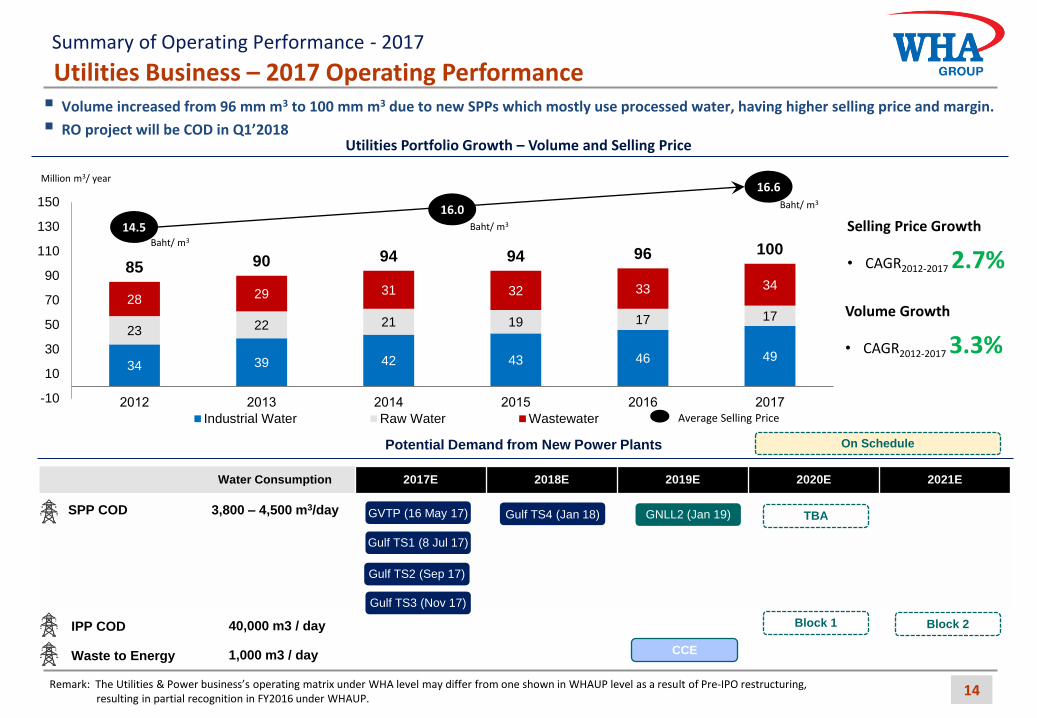
Volume increased from 96 mm m3 to 100 mm m3 due to new SPPs which mostly use processed water, having higher selling price and margin.
RO project will be COD in Q1’2018
Utilities Business – 2017 Operating Performance
14
Utilities Portfolio Growth – Volume and Selling Price
Million m3/ year
14.5
16.6
16.0
Average Selling Price
Baht/ m3
Baht/ m3
Baht/ m3
Selling Price Growth
• CAGR2012-2017 2.7%
Volume Growth
• CAGR2012-2017 3.3%
Remark: The Utilities & Power business’s operating matrix under WHA level may differ from one shown in WHAUP level as a result of Pre-IPO restructuring, resulting in partial recognition in FY2016 under WHAUP.
Potential Demand from New Power Plants
Water Consumption 2017E 2018E 2019E 2020E 2021E
SPP COD 3,800 – 4,500 m3/day
GVTP (16 May 17)
Gulf TS1 (8 Jul 17)
Gulf TS2 (Sep 17)
Gulf TS3 (Nov 17)
Gulf TS4 (Jan 18) GNLL2 (Jan 19) TBA
Block 1 Block 2
On Schedule
CCE Waste to Energy 1,000 m3 / day
IPP COD 40,000 m3 / day
Summary of Operating Performance - 2017
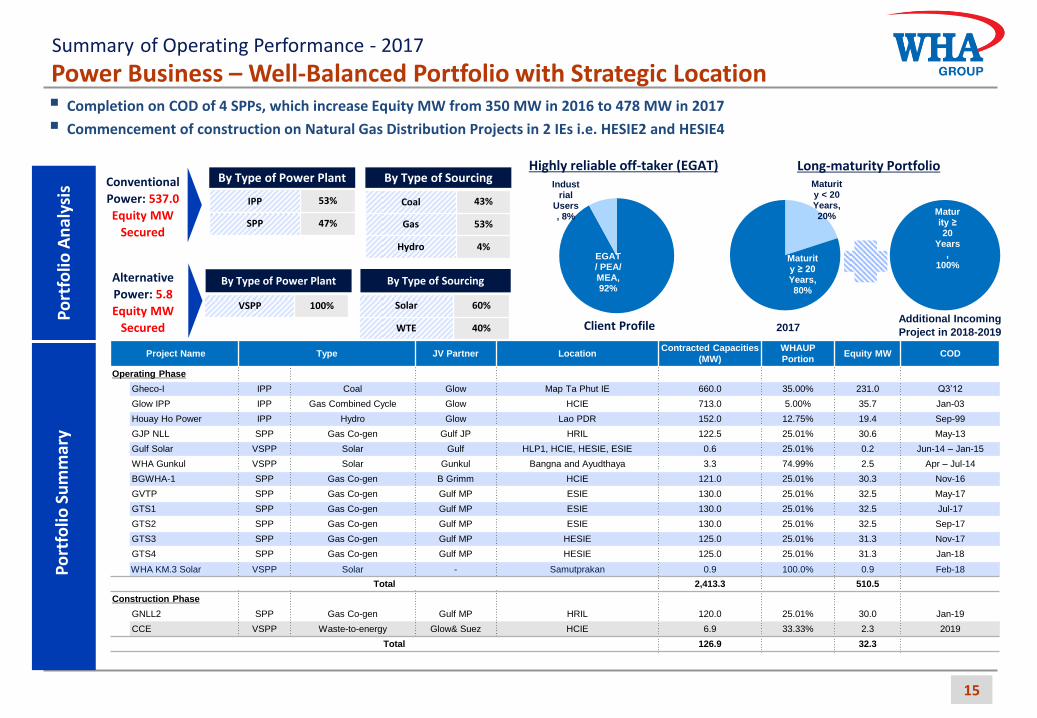
Completion on COD of 4 SPPs, which increase Equity MW from 350 MW in 2016 to 478 MW in 2017
Commencement of construction on Natural Gas Distribution Projects in 2 IEs i.e. HESIE2 and HESIE4
Po
rtfo
lio A
nal
ysis
Power Business – Well-Balanced Portfolio with Strategic Location
15
Po
rtfo
lio A
nal
ysis
IPP 53%
SPP 47%
By Type of Power Plant By Type of Sourcing
Coal 43%
Gas 53%
Hydro 4%
By Type of Power Plant By Type of Sourcing
VSPP 100% Solar 60%
WTE 40%
Conventional
Power: 537.0
Equity MW
Secured
Alternative
Power: 5.8
Equity MW
Secured
Highly reliable off-taker (EGAT)
Client Profile
Long-maturity Portfolio
Po
rtfo
lio S
um
mar
y
Project Name Type JV Partner Location Contracted Capacities
(MW)
WHAUP
Portion Equity MW COD
Operating Phase
Gheco-I IPP Coal Glow Map Ta Phut IE 660.0 35.00% 231.0 Q3’12
Glow IPP IPP Gas Combined Cycle Glow HCIE 713.0 5.00% 35.7 Jan-03
Houay Ho Power IPP Hydro Glow Lao PDR 152.0 12.75% 19.4 Sep-99
GJP NLL SPP Gas Co-gen Gulf JP HRIL 122.5 25.01% 30.6 May-13
Gulf Solar VSPP Solar Gulf HLP1, HCIE, HESIE, ESIE 0.6 25.01% 0.2 Jun-14 – Jan-15
WHA Gunkul VSPP Solar Gunkul Bangna and Ayudthaya 3.3 74.99% 2.5 Apr – Jul-14
BGWHA-1 SPP Gas Co-gen B Grimm HCIE 121.0 25.01% 30.3 Nov-16
GVTP SPP Gas Co-gen Gulf MP ESIE 130.0 25.01% 32.5 May-17
GTS1 SPP Gas Co-gen Gulf MP ESIE 130.0 25.01% 32.5 Jul-17
GTS2 SPP Gas Co-gen Gulf MP ESIE 130.0 25.01% 32.5 Sep-17
GTS3 SPP Gas Co-gen Gulf MP HESIE 125.0 25.01% 31.3 Nov-17
GTS4 SPP Gas Co-gen Gulf MP HESIE 125.0 25.01% 31.3 Jan-18
WHA KM.3 Solar VSPP Solar - Samutprakan 0.9 100.0% 0.9 Feb-18
Total 2,413.3 510.5
Construction Phase
GNLL2 SPP Gas Co-gen Gulf MP HRIL 120.0 25.01% 30.0 Jan-19
CCE VSPP Waste-to-energy Glow& Suez HCIE 6.9 33.33% 2.3 2019
Total 126.9 32.3
EGAT/ PEA/ MEA, 92%
Industrial
Users, 8%
Maturity < 20 Years, 20%
Maturity ≥ 20 Years, 80%
Maturity ≥ 20
Years,
100%
Additional Incoming
Project in 2018-2019 2017
Summary of Operating Performance - 2017
Po
rtfo
lio A
nal
ysis
Digital Platform Business
16
4 Data Center & 2 Cloud Solutions
Establish 4 Data Centers and 2 Cloud Computing as a managed service (IaaS, PaaS, SaaS)
# Data Centers 3 1
# Cloud Solutions 2 -
Location Zone Vibhavadi Bangna-Trad Eastern Seaboard
Bangna-Trad
Shareholding 100% by WHA Join Ventures
Start operation May 2017
Local Loop in 6 Industrial Estates (FTTx)
Implementing Local Loop as a managed service in 6 IEs
# Local Loop 3 New IEs 3 Existing IEs
Rental/Leasing Equipment
Procuring, implementing, maintaining all IT equipment and facilities, i.e. hardware, software, accessories, linkage etc., and Rent/Lease the equipment out to our clients
System Integrators and Data Mining (Big Data)
Designing, training, implementing, bringing together IT component subsystem in providing a comprehensive IT solution for our clients
IT Outsourcing/Business Process Outsourcing (BPO)
A service provider to deliver IT-enabled business process, IT human resources, applications and infrastructure solutions to enhance our clients’ business outcomes.
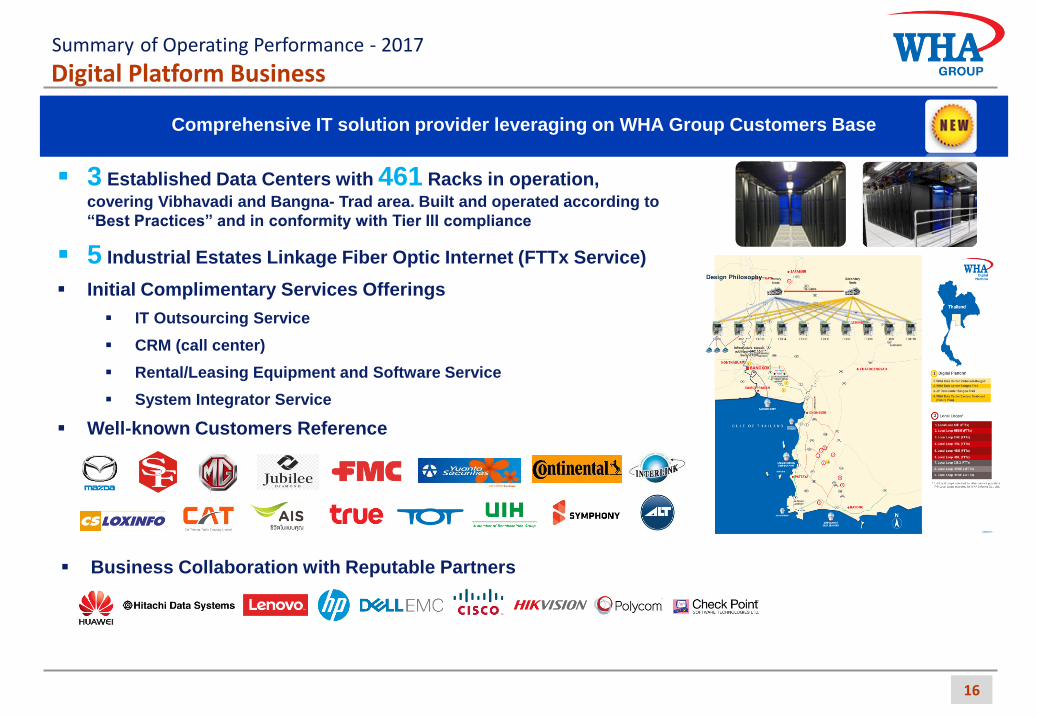
Comprehensive IT solution provider leveraging on WHA Group Customers Base
3 Established Data Centers with 461 Racks in operation, covering Vibhavadi and Bangna- Trad area. Built and operated according to
“Best Practices” and in conformity with Tier III compliance
5 Industrial Estates Linkage Fiber Optic Internet (FTTx Service)
Initial Complimentary Services Offerings
IT Outsourcing Service
CRM (call center)
Rental/Leasing Equipment and Software Service
System Integrator Service
Well-known Customers Reference
3 data centers with 450 racks
3 FTTx Services
new Digital Platform
Business Collaboration with Reputable Partners
Summary of Operating Performance - 2017
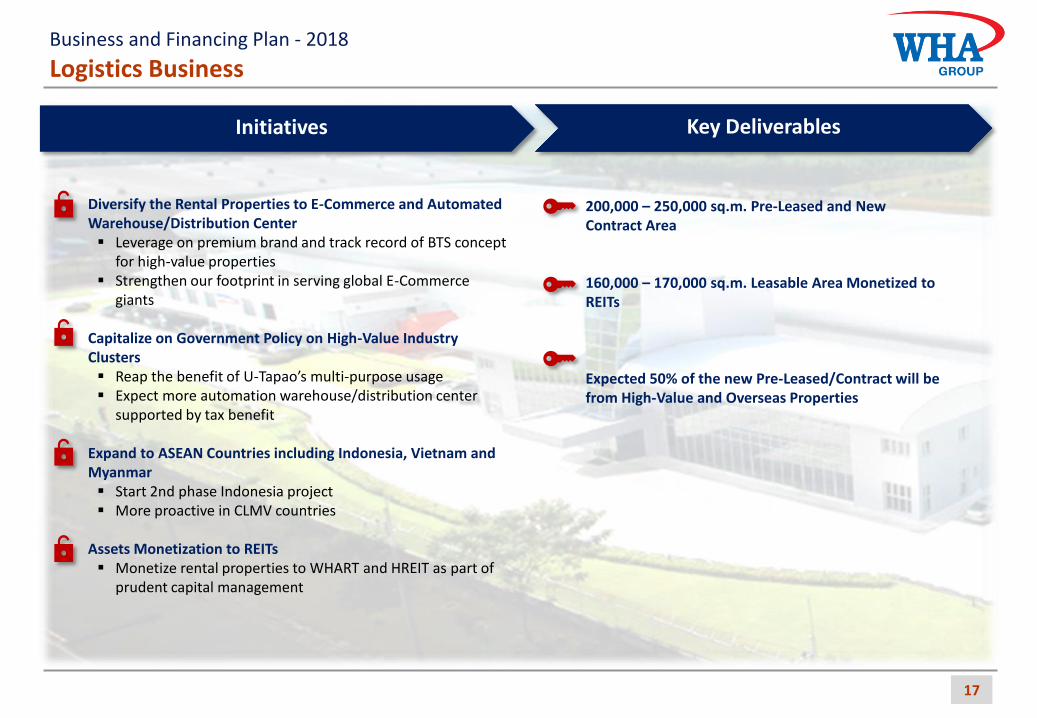
Logistics Business
17
Business and Financing Plan - 2018
200,000 – 250,000 sq.m. Pre-Leased and New Contract Area
160,000 – 170,000 sq.m. Leasable Area Monetized to REITs Expected 50% of the new Pre-Leased/Contract will be from High-Value and Overseas Properties
Diversify the Rental Properties to E-Commerce and Automated Warehouse/Distribution Center Leverage on premium brand and track record of BTS concept
for high-value properties Strengthen our footprint in serving global E-Commerce
giants
Capitalize on Government Policy on High-Value Industry Clusters Reap the benefit of U-Tapao’s multi-purpose usage Expect more automation warehouse/distribution center
supported by tax benefit
Expand to ASEAN Countries including Indonesia, Vietnam and Myanmar Start 2nd phase Indonesia project More proactive in CLMV countries
Assets Monetization to REITs Monetize rental properties to WHART and HREIT as part of
prudent capital management
Initiatives Key Deliverables
Logistics Business - Market Outlook
18
Business and Financing Plan - 2018
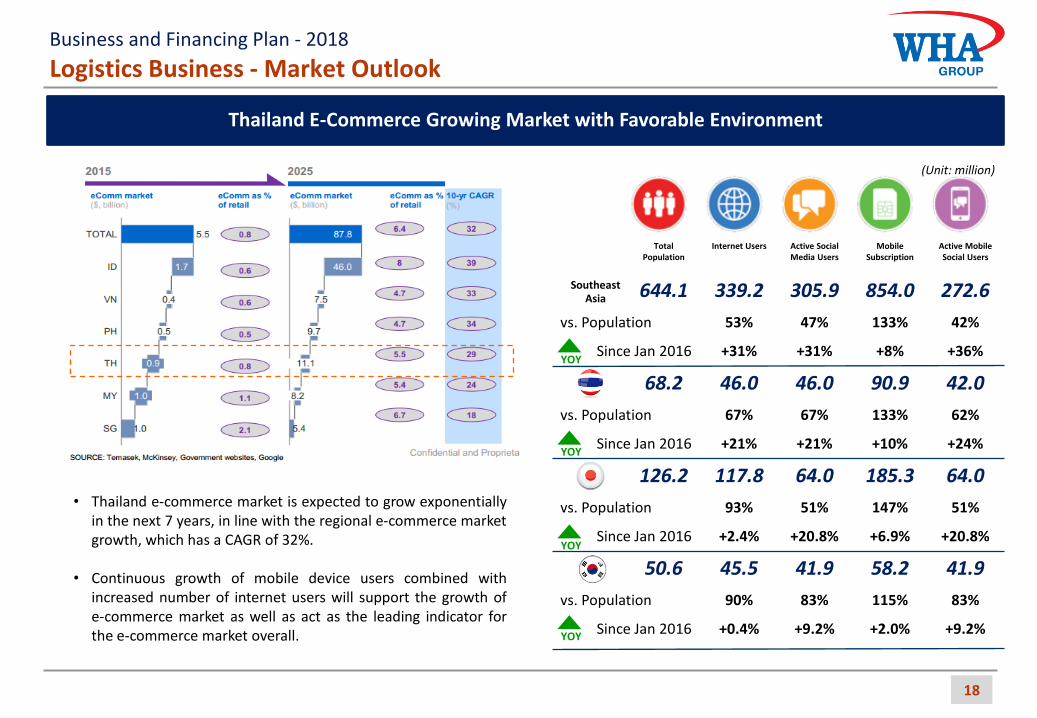
Thailand E-Commerce Growing Market with Favorable Environment Digital outlook in 2017
Total Population
Internet Users Active Social Media Users
Mobile Subscription
Active Mobile Social Users
644.1 339.2 305.9 854.0 272.6
vs. Population 53% 47% 133% 42%
Since Jan 2016 +31% +31% +8% +36%
68.2 46.0 46.0 90.9 42.0
vs. Population 67% 67% 133% 62%
Since Jan 2016 +21% +21% +10% +24%
126.2 117.8 64.0 185.3 64.0
vs. Population 93% 51% 147% 51%
Since Jan 2016 +2.4% +20.8% +6.9% +20.8%
50.6 45.5 41.9 58.2 41.9
vs. Population 90% 83% 115% 83%
Since Jan 2016 +0.4% +9.2% +2.0% +9.2%
(Unit: million)
YOY
YOY
YOY
YOY
Southeast Asia
• Thailand e-commerce market is expected to grow exponentially in the next 7 years, in line with the regional e-commerce market growth, which has a CAGR of 32%.
• Continuous growth of mobile device users combined with
increased number of internet users will support the growth of e-commerce market as well as act as the leading indicator for the e-commerce market overall.
Logistics Business - Market Outlook
19
Business and Financing Plan - 2018
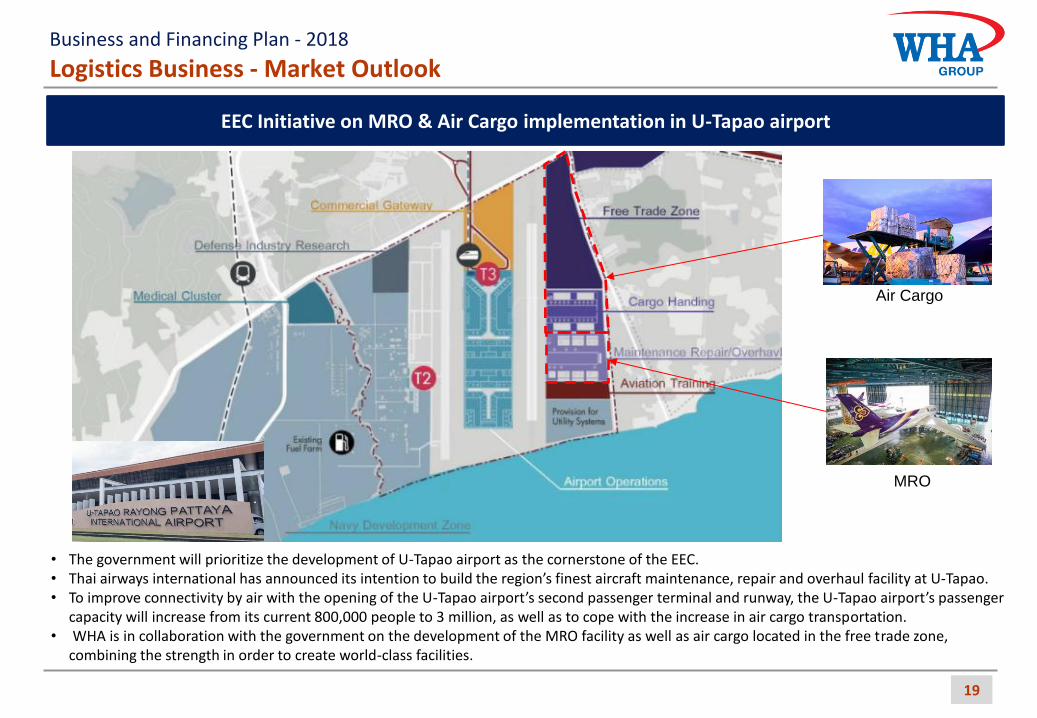
Air Cargo
MRO
EEC Initiative on MRO & Air Cargo implementation in U-Tapao airport
• The government will prioritize the development of U-Tapao airport as the cornerstone of the EEC. • Thai airways international has announced its intention to build the region’s finest aircraft maintenance, repair and overhaul facility at U-Tapao. • To improve connectivity by air with the opening of the U-Tapao airport’s second passenger terminal and runway, the U-Tapao airport’s passenger
capacity will increase from its current 800,000 people to 3 million, as well as to cope with the increase in air cargo transportation. • WHA is in collaboration with the government on the development of the MRO facility as well as air cargo located in the free trade zone,
combining the strength in order to create world-class facilities.
Industrial Estate Business
20
Business and Financing Plan - 2018
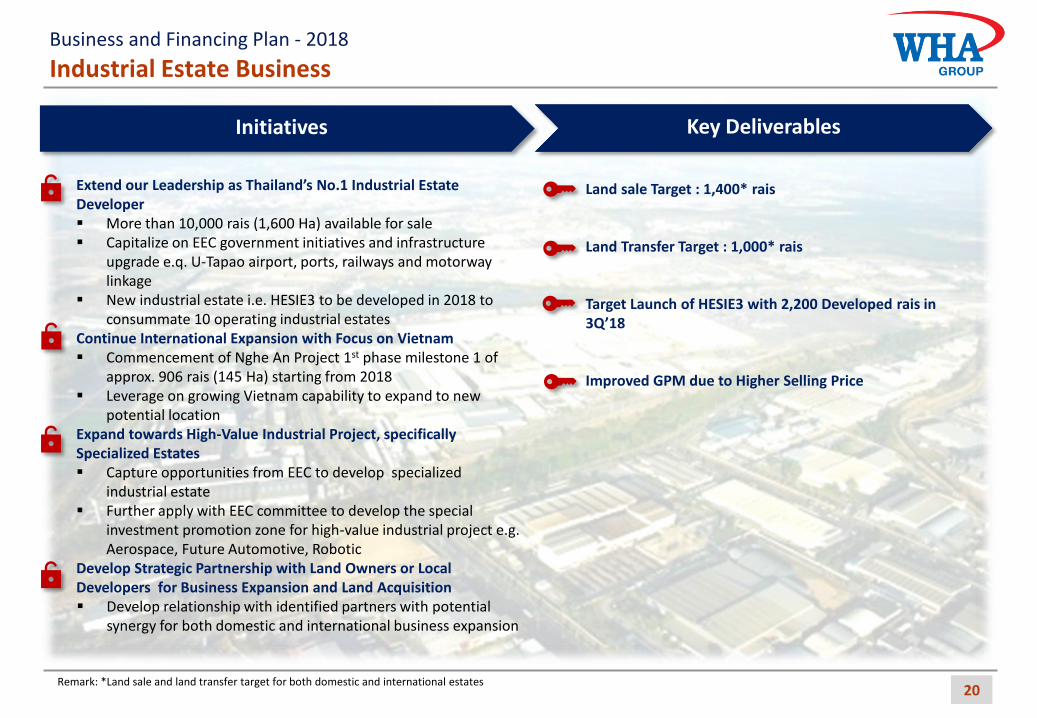
Land sale Target : 1,400* rais Land Transfer Target : 1,000* rais Target Launch of HESIE3 with 2,200 Developed rais in 3Q’18 Improved GPM due to Higher Selling Price
Extend our Leadership as Thailand’s No.1 Industrial Estate Developer More than 10,000 rais (1,600 Ha) available for sale Capitalize on EEC government initiatives and infrastructure
upgrade e.q. U-Tapao airport, ports, railways and motorway linkage
New industrial estate i.e. HESIE3 to be developed in 2018 to consummate 10 operating industrial estates
Continue International Expansion with Focus on Vietnam Commencement of Nghe An Project 1st phase milestone 1 of
approx. 906 rais (145 Ha) starting from 2018 Leverage on growing Vietnam capability to expand to new
potential location Expand towards High-Value Industrial Project, specifically Specialized Estates Capture opportunities from EEC to develop specialized
industrial estate Further apply with EEC committee to develop the special
investment promotion zone for high-value industrial project e.g. Aerospace, Future Automotive, Robotic
Develop Strategic Partnership with Land Owners or Local Developers for Business Expansion and Land Acquisition Develop relationship with identified partners with potential
synergy for both domestic and international business expansion
Initiatives Key Deliverables
Remark: *Land sale and land transfer target for both domestic and international estates
21
Industrial Estate Business - Market Outlook Business and Financing Plan - 2018
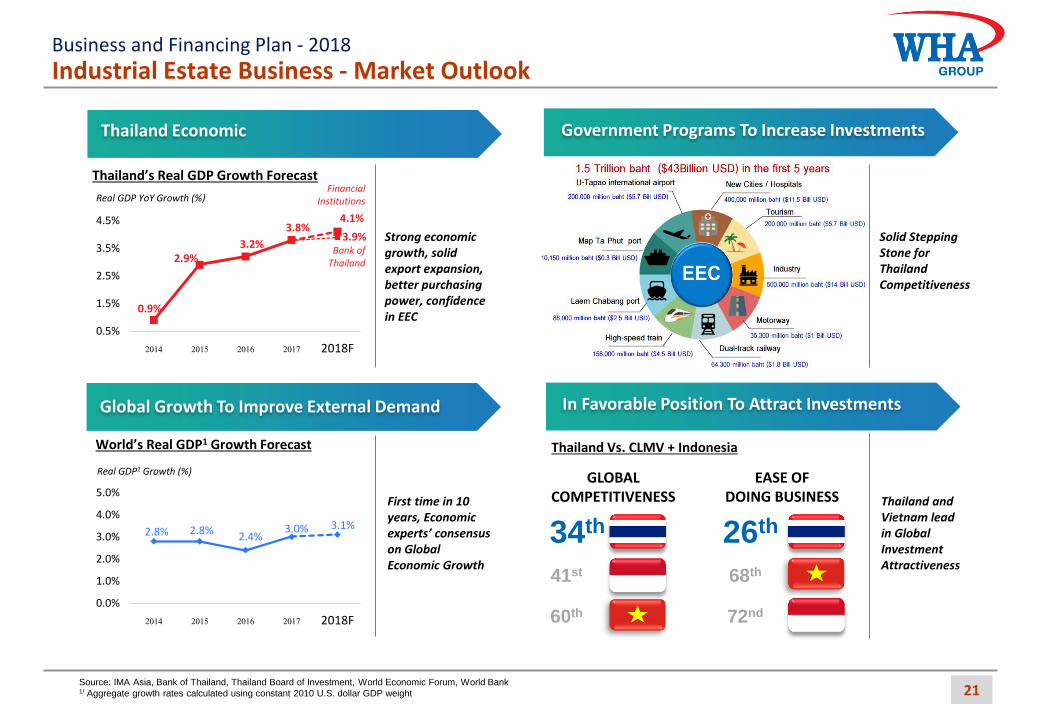
Source: IMA Asia, Bank of Thailand, Thailand Board of Investment, World Economic Forum, World Bank 1/ Aggregate growth rates calculated using constant 2010 U.S. dollar GDP weight
0.9%
2.9% 3.2%
3.8% 3.9%
4.1%
0.5%
1.5%
2.5%
3.5%
4.5%
2014 2015 2016 2017 2018F
Real GDP YoY Growth (%)
In Favorable Position To Attract Investments
2.8% 2.8% 2.4%
3.0% 3.1%
0.0%
1.0%
2.0%
3.0%
4.0%
5.0%
2014 2015 2016 2017 2018F
Global Growth To Improve External Demand
Real GDP1 Growth (%)
World’s Real GDP1 Growth Forecast
Thailand’s Real GDP Growth Forecast
GLOBAL COMPETITIVENESS
EASE OF DOING BUSINESS
Thailand Vs. CLMV + Indonesia
34th
41st
60th
26th
68th
72nd
Thailand Economic Government Programs To Increase Investments
Strong economic growth, solid export expansion, better purchasing power, confidence in EEC
Thailand and Vietnam lead in Global Investment Attractiveness
Solid Stepping Stone for Thailand Competitiveness
Bank of Thailand
Financial Institutions
First time in 10 years, Economic experts’ consensus on Global Economic Growth
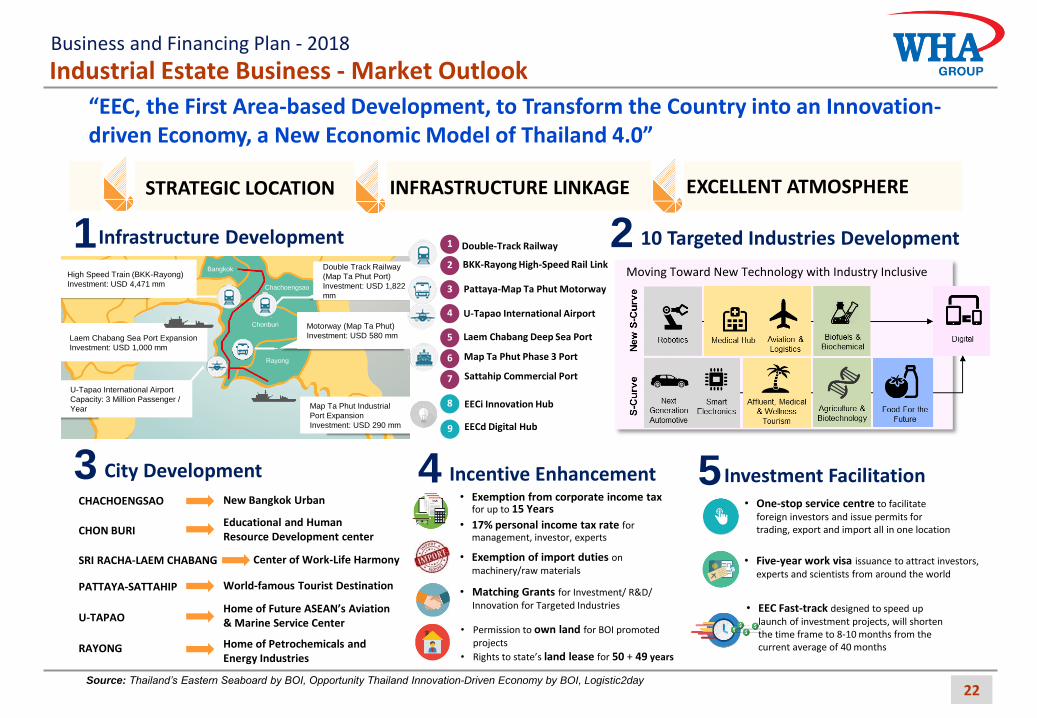
High Speed Train (BKK-Rayong)
Investment: USD 4,471 mm Chachoengsao
Bangkok
Chonburi
Rayong
Double Track Railway
(Map Ta Phut Port)
Investment: USD 1,822
mm
U-Tapao International Airport
Capacity: 3 Million Passenger /
Year
Motorway (Map Ta Phut)
Investment: USD 580 mm
Map Ta Phut Industrial
Port Expansion
Investment: USD 290 mm
Laem Chabang Sea Port Expansion
Investment: USD 1,000 mm
22
Industrial Estate Business - Market Outlook Business and Financing Plan - 2018
“EEC, the First Area-based Development, to Transform the Country into an Innovation-driven Economy, a New Economic Model of Thailand 4.0”
Source: Thailand’s Eastern Seaboard by BOI, Opportunity Thailand Innovation-Driven Economy by BOI, Logistic2day
STRATEGIC LOCATION INFRASTRUCTURE LINKAGE EXCELLENT ATMOSPHERE
Infrastructure Development 10 Targeted Industries Development 1 2 Moving Toward New Technology with Industry Inclusive
U-Tapao International Airport
Laem Chabang Deep Sea Port
Map Ta Phut Phase 3 Port
Double-Track Railway
BKK-Rayong High-Speed Rail Link
1
2
Pattaya-Map Ta Phut Motorway 3
4
5
Sattahip Commercial Port
6
7
EECi Innovation Hub 8
EECd Digital Hub 9
City Development 3 CHACHOENGSAO
CHON BURI
SRI RACHA-LAEM CHABANG
New Bangkok Urban
Educational and Human Resource Development center
Incentive Enhancement 4 Investment Facilitation 5
PATTAYA-SATTAHIP
U-TAPAO
RAYONG
Center of Work-Life Harmony
World-famous Tourist Destination
Home of Future ASEAN’s Aviation & Marine Service Center
Home of Petrochemicals and Energy Industries
• Exemption from corporate income tax for up to 15 Years
• 17% personal income tax rate for management, investor, experts
• Exemption of import duties on machinery/raw materials
• Matching Grants for Investment/ R&D/ Innovation for Targeted Industries
• Permission to own land for BOI promoted projects
• Rights to state’s land lease for 50 + 49 years
• Five-year work visa issuance to attract investors, experts and scientists from around the world
• One-stop service centre to facilitate foreign investors and issue permits for trading, export and import all in one location
• EEC Fast-track designed to speed up launch of investment projects, will shorten the time frame to 8-10 months from the current average of 40 months
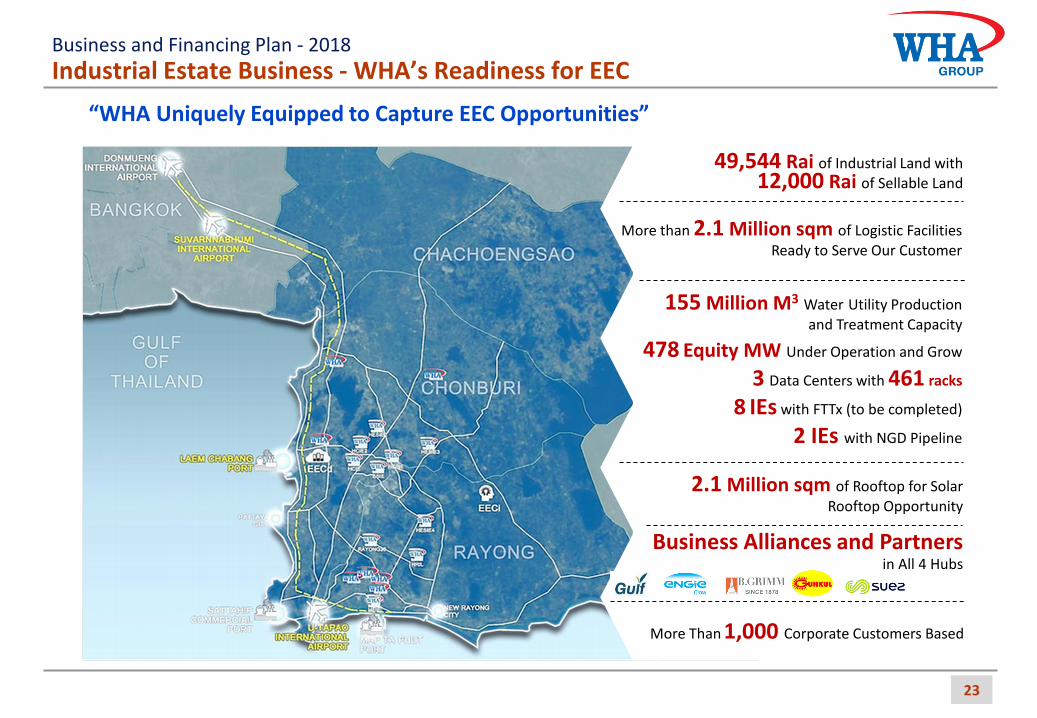
More Than 1,000 Corporate Customers Based
49,544 Rai of Industrial Land with 12,000 Rai of Sellable Land
155 Million M3 Water Utility Production and Treatment Capacity
478 Equity MW Under Operation and Grow
3 Data Centers with 461 racks
8 IEs with FTTx (to be completed)
2 IEs with NGD Pipeline
2.1 Million sqm of Rooftop for Solar Rooftop Opportunity
Business Alliances and Partners in All 4 Hubs
More than 2.1 Million sqm of Logistic Facilities Ready to Serve Our Customer
23
Industrial Estate Business - WHA’s Readiness for EEC Business and Financing Plan - 2018
“WHA Uniquely Equipped to Capture EEC Opportunities”
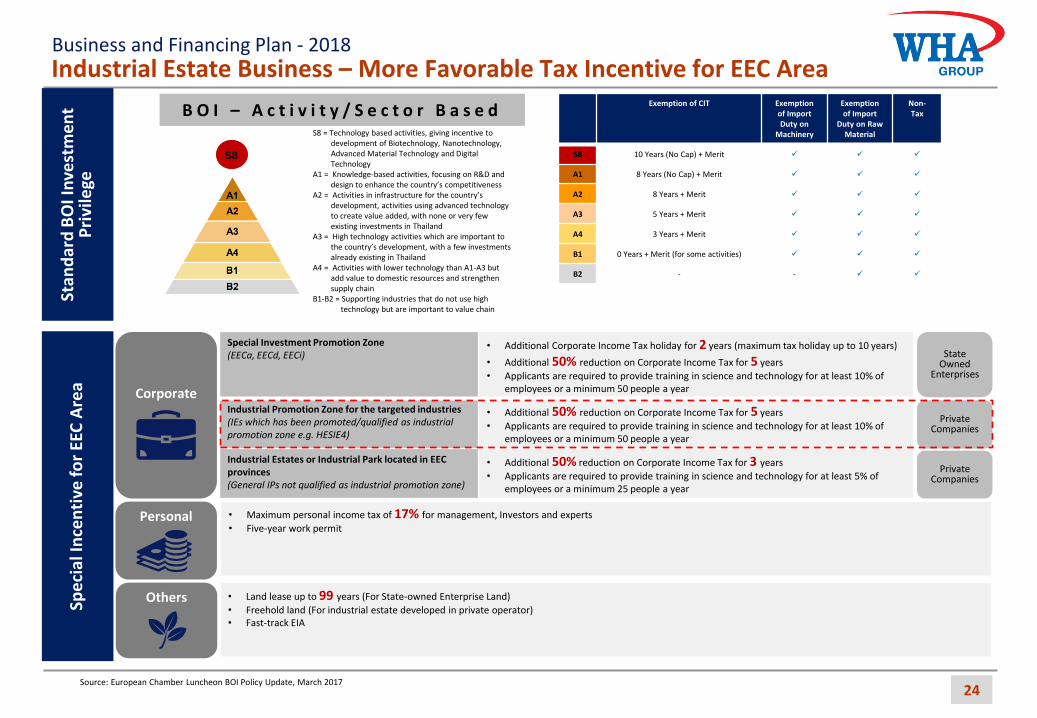
Industrial Estate Business – More Favorable Tax Incentive for EEC Area
24 Source: European Chamber Luncheon BOI Policy Update, March 2017
B O I – A c t i v i t y / S e c t o r B a s e d S8 = Technology based activities, giving incentive to
development of Biotechnology, Nanotechnology, Advanced Material Technology and Digital Technology
A1 = Knowledge-based activities, focusing on R&D and design to enhance the country’s competitiveness
A2 = Activities in infrastructure for the country’s development, activities using advanced technology to create value added, with none or very few existing investments in Thailand
A3 = High technology activities which are important to the country’s development, with a few investments already existing in Thailand
A4 = Activities with lower technology than A1-A3 but add value to domestic resources and strengthen supply chain
B1-B2 = Supporting industries that do not use high technology but are important to value chain
The EEC will receive a super incentive promotion package which goes far beyond the current regulations of the BOI-Act as followings: The exemption for corporate income
taxation (CIT) will be granted up to 15 years instead of the current maximal tax holidays of eight years.
A maximum personal income tax rate of 17% for management, investor, experts.
A five-year business visa, A land lease for 50+49 years, Trade using foreign currencies directly
without having to exchange it into Thai baht,
B O I – A r e a B a s e d
• R&D
• Support academic/research institutes, or technology and human resource development funds
• IP licensing fee
• Advanced Technology Training
• Development of local suppliers
• Product and packaging design
Merit on Competitiveness
Enhancement
Merit on Decentralization
Merit on
Industrial Area
Development
B O I – M e r i t B a s e d
• SEZ (10 Provinces)
• Southern Border (4 Provinces, 4 Districts)
• 20 Provinces with the Lowest per Capita Income
• Industrial Estates/Zones
• Science and Technology Parks
B O I - E E C P a c k a g e
Promote investments in the targeted industries located in EEC provinces
Special Investment Promotion Zone • Additional Corporate Income Tax holiday for 2 years
(maximum tax holiday up to 10 years) • Additional 50% reduction on Corporate Income Tax for 5
years
Industrial Promotion Zone to support targeted industry • Additional 50% reduction on Corporate Income Tax for 5
years
Industrial Estates or Industrial Parks located in 3 EEC provinces • Additional 50% reduction on Corporate Income Tax for 3
years
(As of 22nd November 2017)
E E C A c t
(Expected to become effective in Q12018) Area-based Promote investment that is 3 provinces – Rayong, Chonburi, and Chachoengsao
• Exemption from corporate income tax for up to 15 years (subject to further announcement on required qualifications)
• Exemption of import duties on machinery/raw or essential materials imported for use in production for export/ goods for R&D
• Matching Grants for Investment/ R&D/ Innovation/ Human Resources Development for Targeted Industries
• Permission to own land for BOI promoted projects
• Rights to state’s land lease for 50 years, renewable upon approval for a further 49 years
• 17% personal income tax rate for foreign executives working for regional headquarters or international trading companies, treasury centres, along with regional R&D centres
• One-stop service centre to facilitate foreign investors, provide useful information, and issue permits for trading, export and import all in one location
• Five-year work visa issuance to attract investors, experts and scientists from around the world
Exemption of CIT Exemption of Import Duty on
Machinery
Exemption of Import
Duty on Raw Material
Non-Tax
S8 10 Years (No Cap) + Merit
A1 8 Years (No Cap) + Merit
A2 8 Years + Merit
A3 5 Years + Merit
A4 3 Years + Merit
B1 0 Years + Merit (for some activities)
B2 - -
S8
Business and Financing Plan - 2018 St
and
ard
BO
I In
vest
me
nt
Pri
vile
ge
Spe
cial
Ince
nti
ve fo
r EE
C A
rea
Special Investment Promotion Zone (EECa, EECd, EECi)
• Additional Corporate Income Tax holiday for 2 years (maximum tax holiday up to 10 years)
• Additional 50% reduction on Corporate Income Tax for 5 years
• Applicants are required to provide training in science and technology for at least 10% of employees or a minimum 50 people a year
Industrial Promotion Zone for the targeted industries (IEs which has been promoted/qualified as industrial promotion zone e.g. HESIE4)
• Additional 50% reduction on Corporate Income Tax for 5 years
• Applicants are required to provide training in science and technology for at least 10% of employees or a minimum 50 people a year
Industrial Estates or Industrial Park located in EEC provinces (General IPs not qualified as industrial promotion zone)
• Additional 50% reduction on Corporate Income Tax for 3 years
• Applicants are required to provide training in science and technology for at least 5% of employees or a minimum 25 people a year
State Owned
Enterprises
Private Companies
Private Companies
Corporate
Personal
Others
• Maximum personal income tax of 17% for management, Investors and experts
• Five-year work permit
• Land lease up to 99 years (For State-owned Enterprise Land)
• Freehold land (For industrial estate developed in private operator) • Fast-track EIA
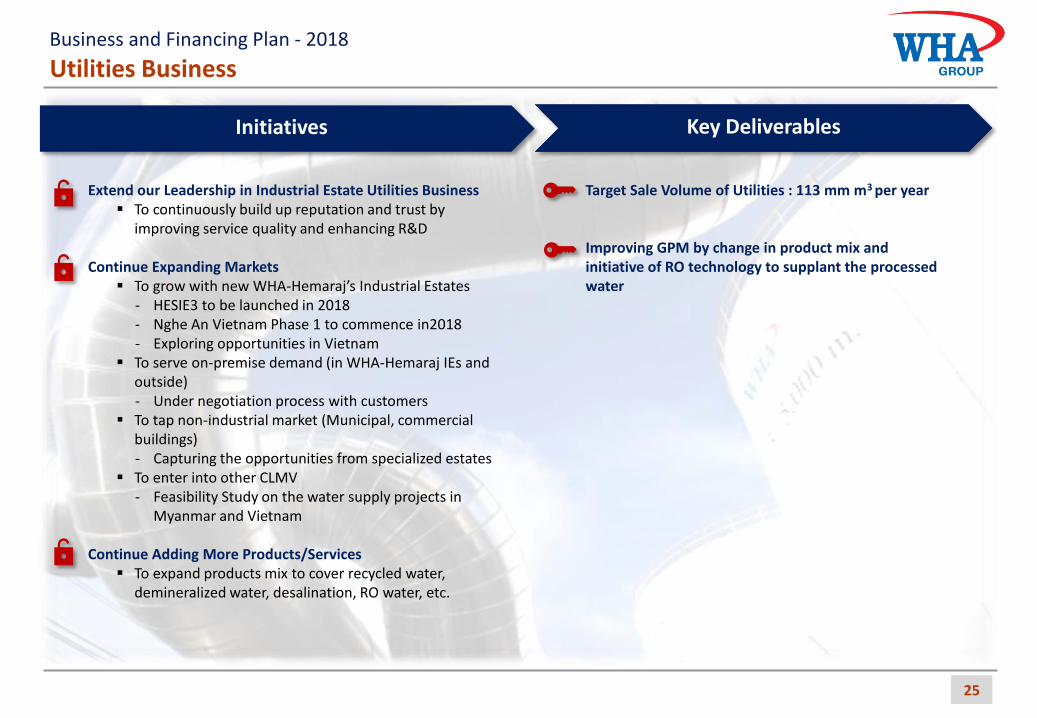
Utilities Business
25
Business and Financing Plan - 2018
Target Sale Volume of Utilities : 113 mm m3 per year Improving GPM by change in product mix and initiative of RO technology to supplant the processed water
Extend our Leadership in Industrial Estate Utilities Business To continuously build up reputation and trust by
improving service quality and enhancing R&D
Continue Expanding Markets To grow with new WHA-Hemaraj’s Industrial Estates
- HESIE3 to be launched in 2018 - Nghe An Vietnam Phase 1 to commence in2018 - Exploring opportunities in Vietnam
To serve on-premise demand (in WHA-Hemaraj IEs and outside) - Under negotiation process with customers
To tap non-industrial market (Municipal, commercial buildings) - Capturing the opportunities from specialized estates
To enter into other CLMV - Feasibility Study on the water supply projects in
Myanmar and Vietnam
Continue Adding More Products/Services To expand products mix to cover recycled water,
demineralized water, desalination, RO water, etc.
Initiatives Key Deliverables
Power Business
26
Business and Financing Plan - 2018
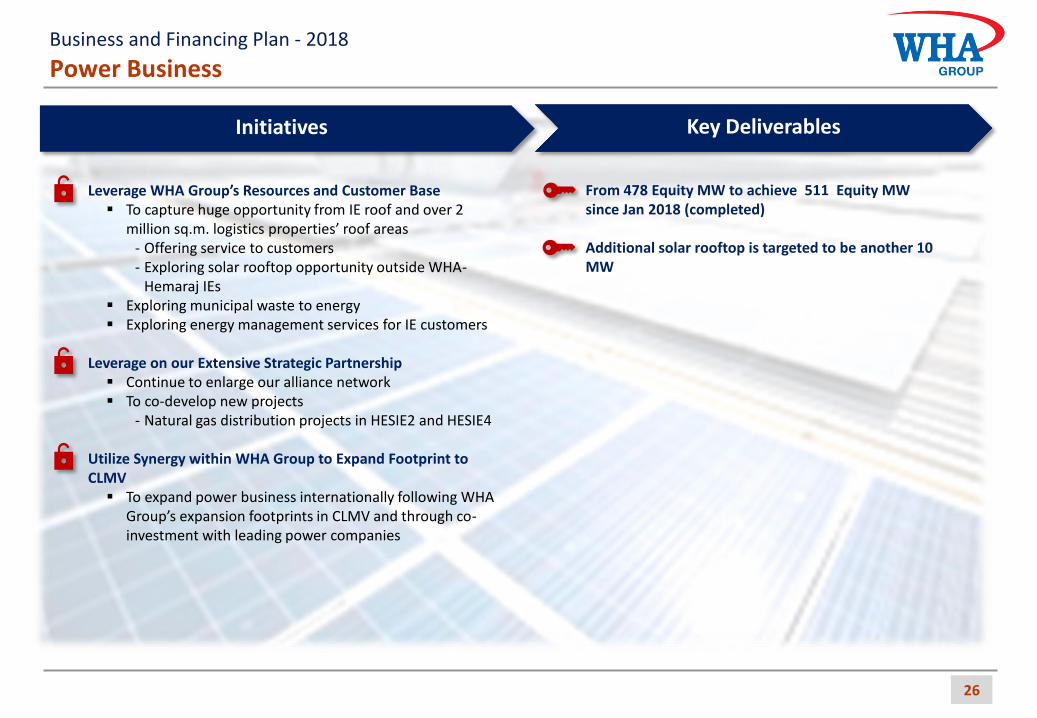
From 478 Equity MW to achieve 511 Equity MW since Jan 2018 (completed) Additional solar rooftop is targeted to be another 10 MW
Leverage WHA Group’s Resources and Customer Base To capture huge opportunity from IE roof and over 2
million sq.m. logistics properties’ roof areas - Offering service to customers - Exploring solar rooftop opportunity outside WHA-
Hemaraj IEs Exploring municipal waste to energy Exploring energy management services for IE customers
Leverage on our Extensive Strategic Partnership Continue to enlarge our alliance network To co-develop new projects
- Natural gas distribution projects in HESIE2 and HESIE4
Utilize Synergy within WHA Group to Expand Footprint to CLMV To expand power business internationally following WHA
Group’s expansion footprints in CLMV and through co-investment with leading power companies
Initiatives Key Deliverables
Digital Platform Business
27
Business and Financing Plan - 2018
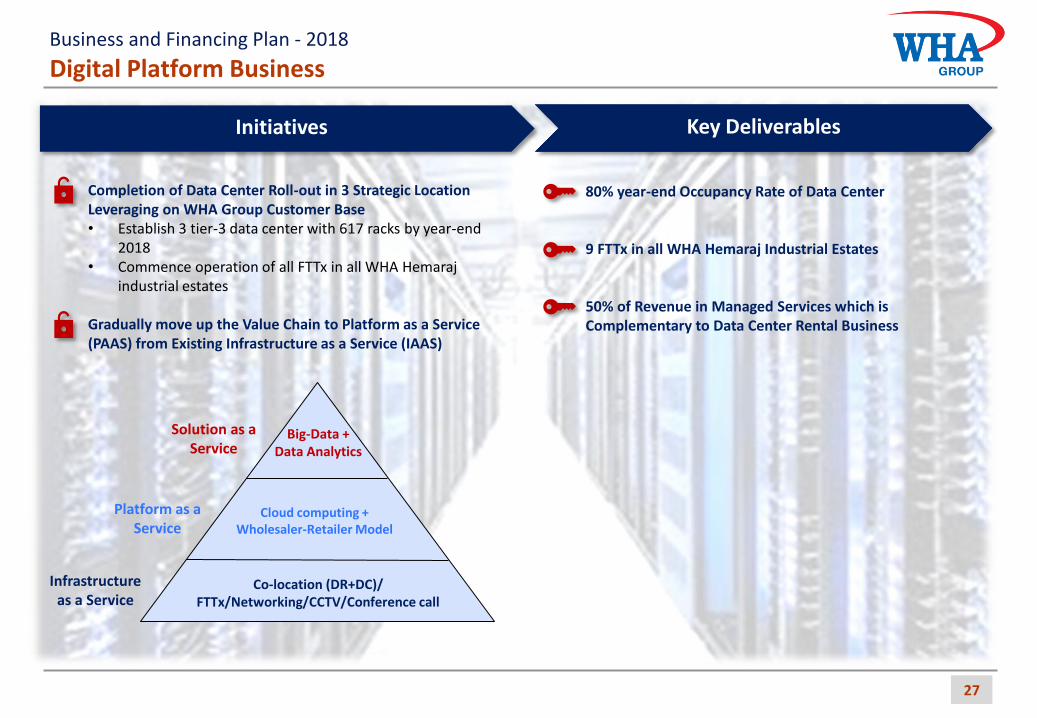
80% year-end Occupancy Rate of Data Center 9 FTTx in all WHA Hemaraj Industrial Estates 50% of Revenue in Managed Services which is Complementary to Data Center Rental Business
Completion of Data Center Roll-out in 3 Strategic Location Leveraging on WHA Group Customer Base • Establish 3 tier-3 data center with 617 racks by year-end
2018 • Commence operation of all FTTx in all WHA Hemaraj
industrial estates Gradually move up the Value Chain to Platform as a Service (PAAS) from Existing Infrastructure as a Service (IAAS)
Initiatives Key Deliverables
Big-Data + Data Analytics
Cloud computing + Wholesaler-Retailer Model
Co-location (DR+DC)/ FTTx/Networking/CCTV/Conference call
Platform as a Service
Infrastructure as a Service
Solution as a Service

Digital Platform Business - Market Outlook
28
Asia-Pacific Data Center Revenue forecast
Note: Forecasted for 2017-2022 Source: Frost & Sullivan analysis
The key theme driving more than 2 digits growth across Asia-Pacific is the strong digital needs of emerging economies with huge populations such as China, India, and Indonesia
Furthermore rising complexities within the IT infrastructure brought about by virtualization and consolidation, coupled with various cost constraints, are encouraging enterprises to look into adopting third-party data center services
Total Data Center Workload by Region This shown Asia Pacific has highest compounding growth comparing with other region because the governments of many Asia-Pacific countries have been able to commit to massive investments to develop the data center industry
Source: Cisco Global Index, 2015-2020
Global Demand for Data Center – Asia’s data center markets are in various stage of growth
Thailand Data Center Market
232 277 330
391 459
535
0
100
200
300
400
500
600
2015 2016 2017F 2018F 2019F 2020F
Valu
e (
US
D m
illio
n) CAGR= 18.19%
Source: International Data Corporation
IDC Thailand estimates that the data center services market — which includes hosting infrastructure services, application management, and network and endpoint outsourcing services is growing at a fast pace at a compound annual growth rate (CAGR) of over 18% from 2015 to 2020
Growth Analysis For Thailand, government’s greater emphasis on technology and IT infrastructure will spark greater demand for data centers in the country. Some of this revolves around the establishing of a digital innovation park with the relevant infrastructure and facilities to cater to a new generation of digital businesses. It is consistent with the graph show that during 2015-2022 Thailand is in the high Growth Stage for this industry
Source: Frost & Sullivan analysis
Thailand Demand for Data Center is in high growth stage
Business and Financing Plan - 2018
2018 Financing Plan
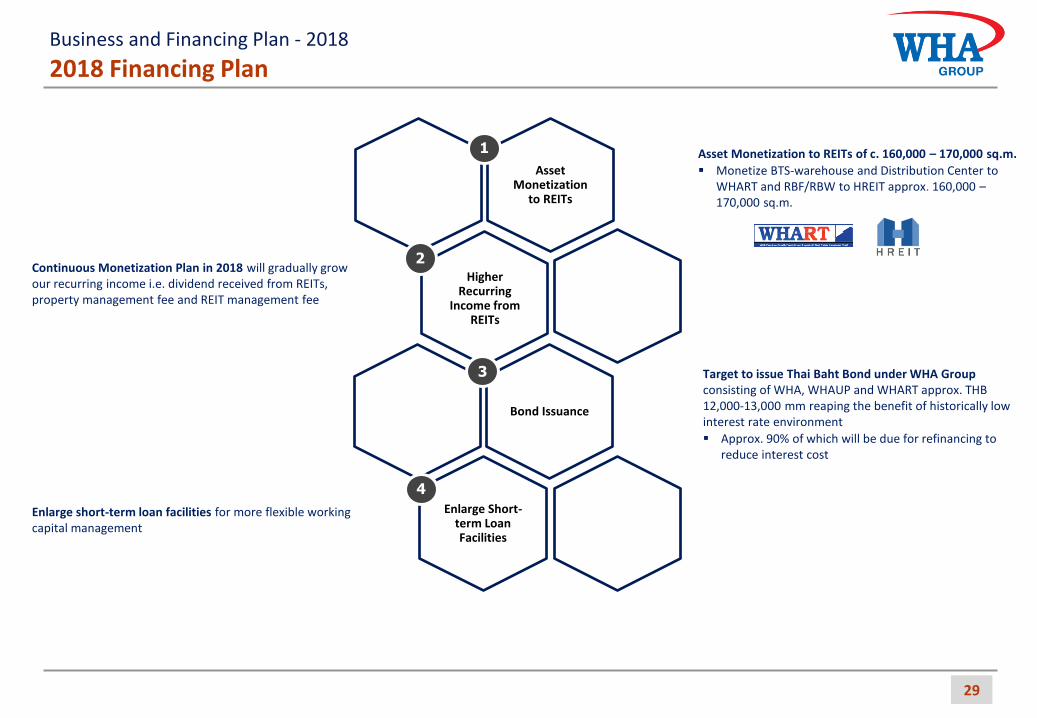
Enlarge short-term loan facilities for more flexible working capital management
Asset Monetization to REITs of c. 160,000 – 170,000 sq.m.
Monetize BTS-warehouse and Distribution Center to WHART and RBF/RBW to HREIT approx. 160,000 – 170,000 sq.m.
Continuous Monetization Plan in 2018 will gradually grow our recurring income i.e. dividend received from REITs, property management fee and REIT management fee
Target to issue Thai Baht Bond under WHA Group consisting of WHA, WHAUP and WHART approx. THB 12,000-13,000 mm reaping the benefit of historically low interest rate environment
Approx. 90% of which will be due for refinancing to reduce interest cost
29
Higher Recurring
Income from REITs
Bond Issuance
Enlarge Short-term Loan Facilities
Asset Monetization
to REITs
1
2
3
4
Business and Financing Plan - 2018
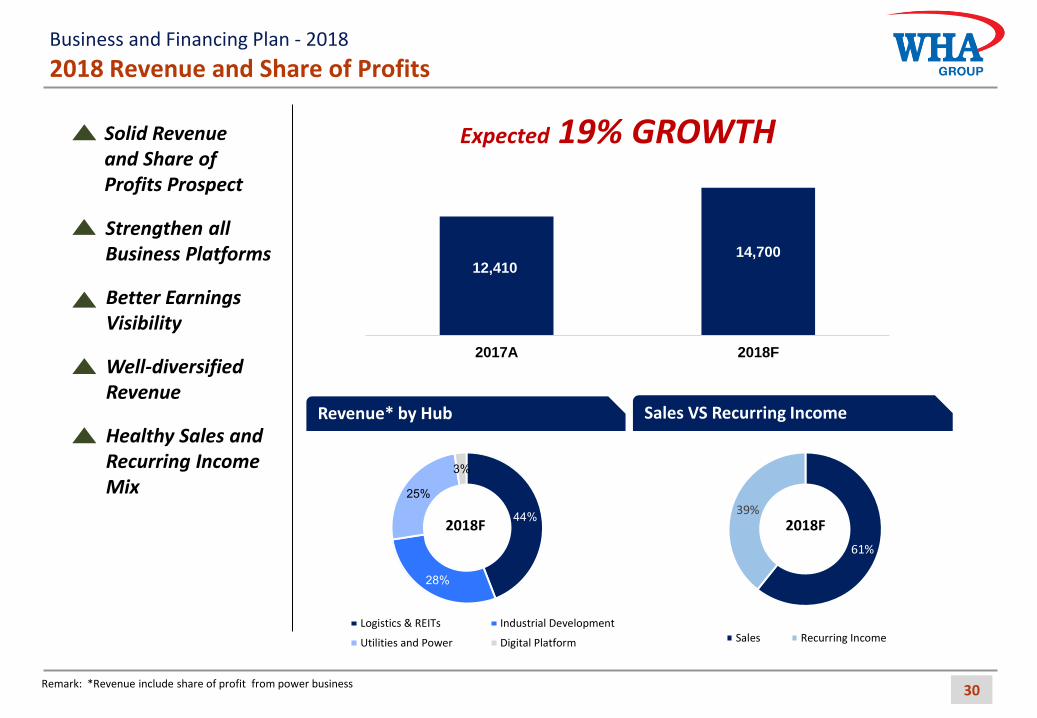
2017A 2018F
12,410 14,700
44%
28%
25%
3%
Logistics & REITs Industrial Development
Utilities and Power Digital Platform
2018 Revenue and Share of Profits
30
61%
39%
Sales Recurring Income
Sales VS Recurring Income
2018F
Revenue* by Hub
2018F
Solid Revenue and Share of Profits Prospect
Better Earnings Visibility
Strengthen all Business Platforms
Well-diversified Revenue
Healthy Sales and Recurring Income Mix
Expected 19% GROWTH
Business and Financing Plan - 2018
Remark: *Revenue include share of profit from power business
2018 Investment Plan and Leverage Level
31
2016A 2017A 2018F 2019F 2020F
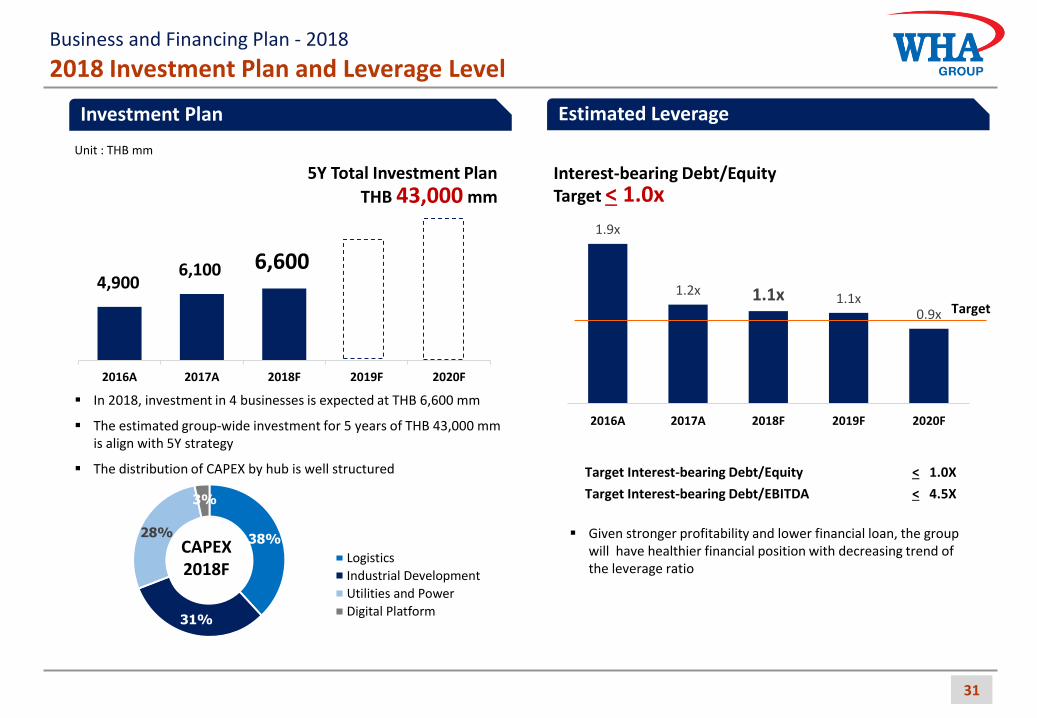
Investment Plan
5Y Total Investment Plan
THB 43,000 mm
In 2018, investment in 4 businesses is expected at THB 6,600 mm
The estimated group-wide investment for 5 years of THB 43,000 mm is align with 5Y strategy
The distribution of CAPEX by hub is well structured
Estimated Leverage
38%
31%
28%
3%
Logistics
Industrial Development
Utilities and Power
Digital Platform
CAPEX 2018F
6,600
9,900
MB 1.9x
1.2x 1.1x 1.1x 0.9x
2016A 2017A 2018F 2019F 2020F
Interest-bearing Debt/Equity Target < 1.0x
Target Interest-bearing Debt/Equity < 1.0X
Target Interest-bearing Debt/EBITDA < 4.5X
Target
Given stronger profitability and lower financial loan, the group will have healthier financial position with decreasing trend of the leverage ratio
6,100 4,900
Unit : THB mm
Business and Financing Plan - 2018
Overall Performance Financial Performance
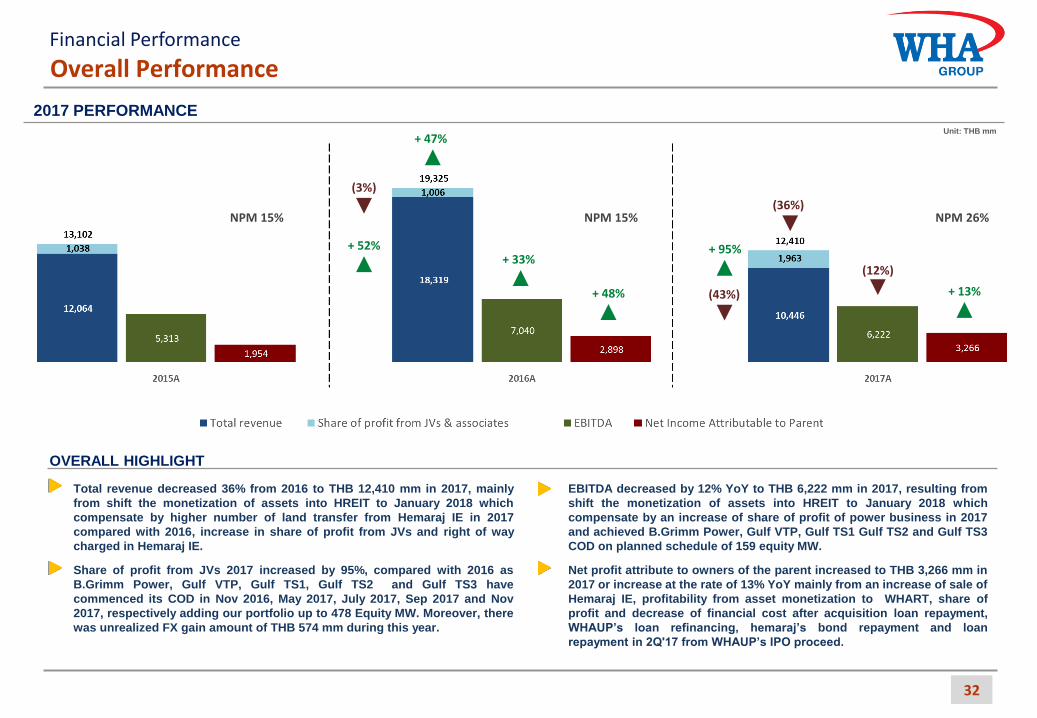
2017 PERFORMANCE Unit: THB mm
32
Total revenue decreased 36% from 2016 to THB 12,410 mm in 2017, mainly
from shift the monetization of assets into HREIT to January 2018 which
compensate by higher number of land transfer from Hemaraj IE in 2017
compared with 2016, increase in share of profit from JVs and right of way
charged in Hemaraj IE.
EBITDA decreased by 12% YoY to THB 6,222 mm in 2017, resulting from
shift the monetization of assets into HREIT to January 2018 which
compensate by an increase of share of profit of power business in 2017
and achieved B.Grimm Power, Gulf VTP, Gulf TS1 Gulf TS2 and Gulf TS3
COD on planned schedule of 159 equity MW.
Share of profit from JVs 2017 increased by 95%, compared with 2016 as
B.Grimm Power, Gulf VTP, Gulf TS1, Gulf TS2 and Gulf TS3 have
commenced its COD in Nov 2016, May 2017, July 2017, Sep 2017 and Nov
2017, respectively adding our portfolio up to 478 Equity MW. Moreover, there
was unrealized FX gain amount of THB 574 mm during this year.
Net profit attribute to owners of the parent increased to THB 3,266 mm in
2017 or increase at the rate of 13% YoY mainly from an increase of sale of
Hemaraj IE, profitability from asset monetization to WHART, share of
profit and decrease of financial cost after acquisition loan repayment,
WHAUP’s loan refinancing, hemaraj’s bond repayment and loan
repayment in 2Q'17 from WHAUP’s IPO proceed.
OVERALL HIGHLIGHT
+ 13%
(12%)
(36%)
(43%)
+ 95%
NPM 26% NPM 15% NPM 15%
+ 48%
+ 33%
+ 47%
(3%)
+ 52%
Net Profit Margin Financial Performance
33
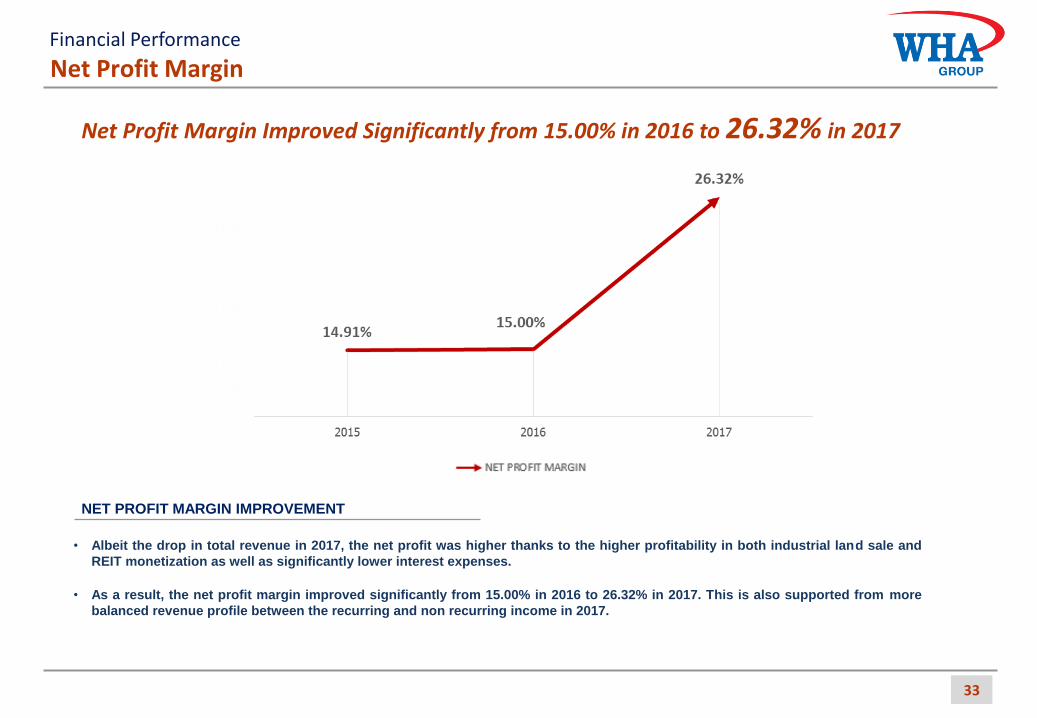
• Albeit the drop in total revenue in 2017, the net profit was higher thanks to the higher profitability in both industrial land sale and
REIT monetization as well as significantly lower interest expenses.
• As a result, the net profit margin improved significantly from 15.00% in 2016 to 26.32% in 2017. This is also supported from more
balanced revenue profile between the recurring and non recurring income in 2017.
NET PROFIT MARGIN IMPROVEMENT
Net Profit Margin Improved Significantly from 15.00% in 2016 to 26.32% in 2017
Profitability by Business
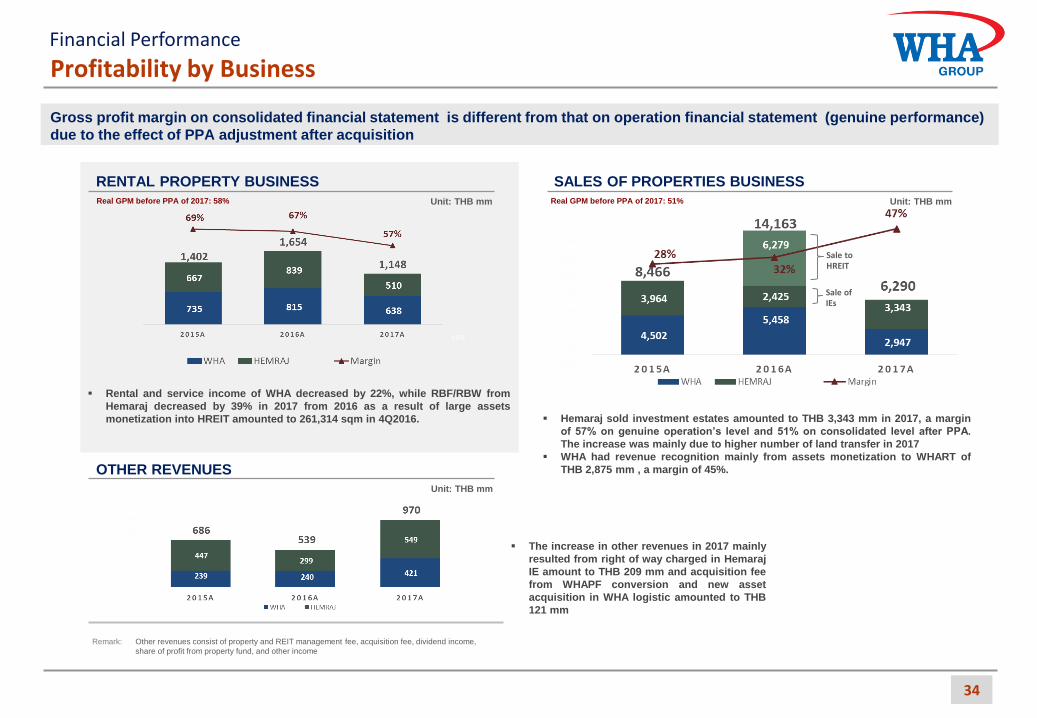
RENTAL PROPERTY BUSINESS SALES OF PROPERTIES BUSINESS
Unit: THB mm
Financial Performance
OTHER REVENUES
The increase in other revenues in 2017 mainly
resulted from right of way charged in Hemaraj
IE amount to THB 209 mm and acquisition fee
from WHAPF conversion and new asset
acquisition in WHA logistic amounted to THB
121 mm
Hemaraj sold investment estates amounted to THB 3,343 mm in 2017, a margin
of 57% on genuine operation’s level and 51% on consolidated level after PPA.
The increase was mainly due to higher number of land transfer in 2017
WHA had revenue recognition mainly from assets monetization to WHART of
THB 2,875 mm , a margin of 45%.
Sale to HREIT
Sale of IEs
Rental and service income of WHA decreased by 22%, while RBF/RBW from
Hemaraj decreased by 39% in 2017 from 2016 as a result of large assets
monetization into HREIT amounted to 261,314 sqm in 4Q2016.
Remark: Other revenues consist of property and REIT management fee, acquisition fee, dividend income,
share of profit from property fund, and other income
34
Real GPM before PPA of 2017: 58% Real GPM before PPA of 2017: 51%
Gross profit margin on consolidated financial statement is different from that on operation financial statement (genuine performance)
due to the effect of PPA adjustment after acquisition
Unit: THB mm
Unit: THB mm
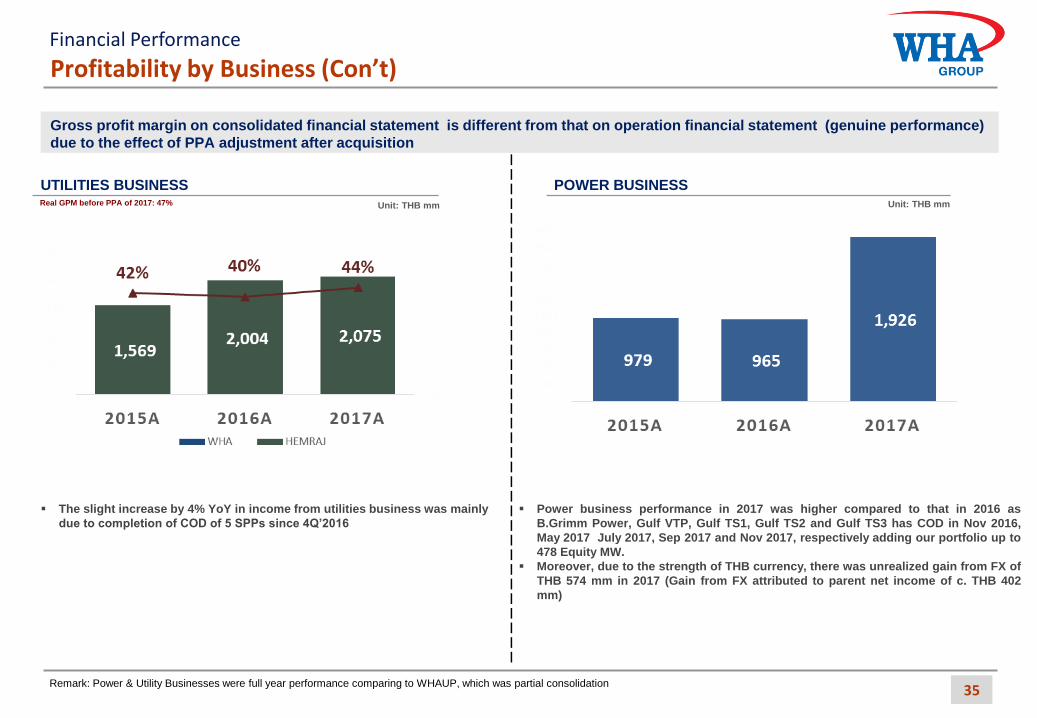
Profitability by Business (Con’t)
UTILITIES BUSINESS POWER BUSINESS
Gross profit margin on consolidated financial statement is different from that on operation financial statement (genuine performance)
due to the effect of PPA adjustment after acquisition
Financial Performance
The slight increase by 4% YoY in income from utilities business was mainly
due to completion of COD of 5 SPPs since 4Q’2016
Power business performance in 2017 was higher compared to that in 2016 as
B.Grimm Power, Gulf VTP, Gulf TS1, Gulf TS2 and Gulf TS3 has COD in Nov 2016,
May 2017 July 2017, Sep 2017 and Nov 2017, respectively adding our portfolio up to
478 Equity MW.
Moreover, due to the strength of THB currency, there was unrealized gain from FX of
THB 574 mm in 2017 (Gain from FX attributed to parent net income of c. THB 402
mm)
Remark: Power & Utility Businesses were full year performance comparing to WHAUP, which was partial consolidation 35
Real GPM before PPA of 2017: 47% Unit: THB mm Unit: THB mm
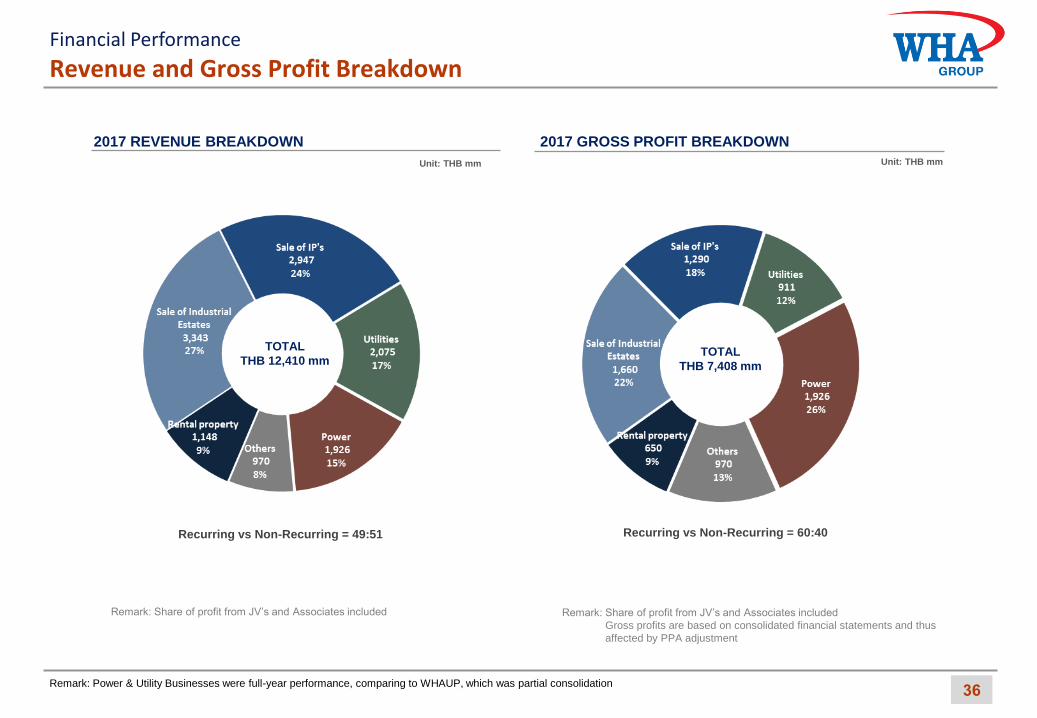
Revenue and Gross Profit Breakdown
36
2017 GROSS PROFIT BREAKDOWN
2017 REVENUE BREAKDOWN
Unit: THB mm Unit: THB mm
TOTAL
THB 12,410 mm TOTAL
THB 7,408 mm
Remark: Share of profit from JV’s and Associates included Remark: Share of profit from JV’s and Associates included
Gross profits are based on consolidated financial statements and thus
affected by PPA adjustment
Recurring vs Non-Recurring = 49:51 Recurring vs Non-Recurring = 60:40
Financial Performance
Remark: Power & Utility Businesses were full-year performance, comparing to WHAUP, which was partial consolidation
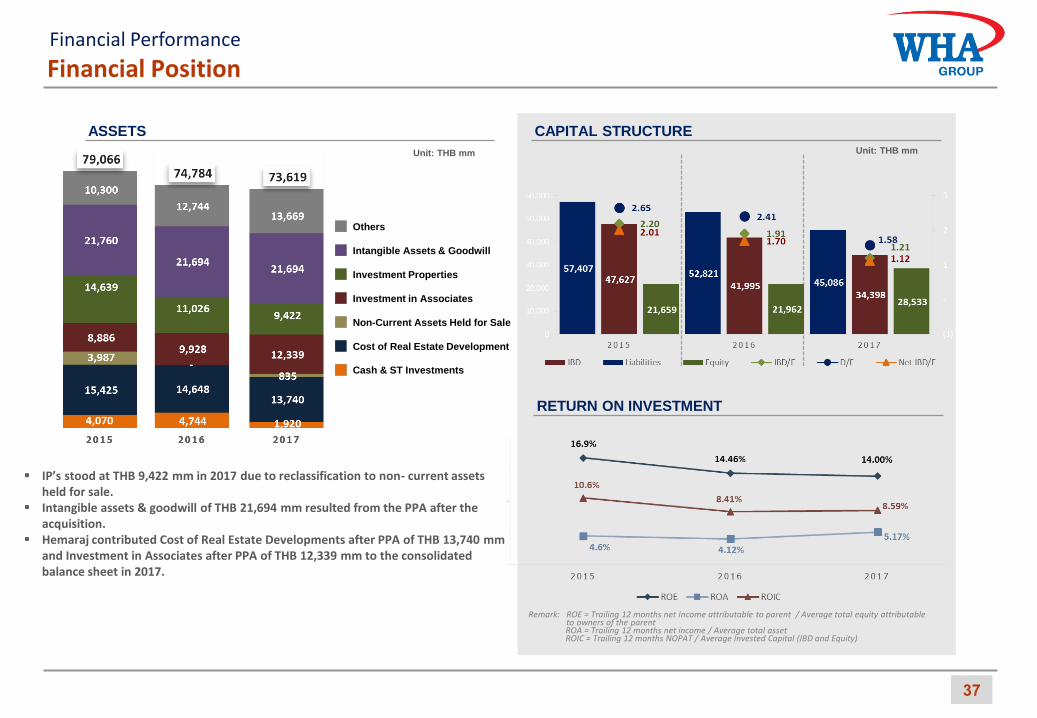
Financial Position
37
Unit: THB mm
CAPITAL STRUCTURE ASSETS
Unit: THB mm
RETURN ON INVESTMENT
IP’s stood at THB 9,422 mm in 2017 due to reclassification to non- current assets held for sale.
Intangible assets & goodwill of THB 21,694 mm resulted from the PPA after the acquisition.
Hemaraj contributed Cost of Real Estate Developments after PPA of THB 13,740 mm and Investment in Associates after PPA of THB 12,339 mm to the consolidated balance sheet in 2017.
Financial Performance
Remark: ROE = Trailing 12 months net Income attributable to parent / Average total equity attributable to owners of the parent
ROA = Trailing 12 months net income / Average total asset ROIC = Trailing 12 months NOPAT / Average Invested Capital (IBD and Equity)
Others
Intangible Assets & Goodwill
Investment Properties
Investment in Associates
Non-Current Assets Held for Sale
Cost of Real Estate Development
Cash & ST Investments
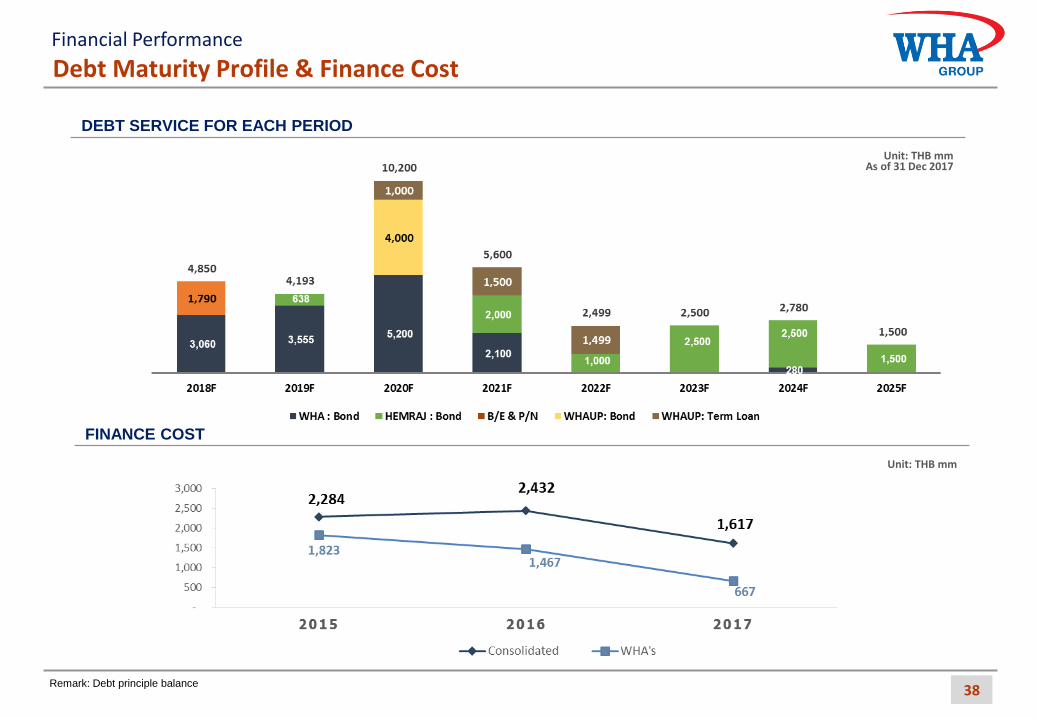
Debt Maturity Profile & Finance Cost
DEBT SERVICE FOR EACH PERIOD
Unit: THB mm
FINANCE COST
Financial Performance
Unit: THB mm As of 31 Dec 2017
38 Remark: Debt principle balance
Appendix
39

5-Year Aspirations
40
2020 Goals
Recurring Income c. 50%
NPAT Growth 10%-15% p.a.
ROE 18%-20%
Gearing Ratio <1.0x
Growth Driver
• Consolidate and Synergize 4 Business Hubs together with Utilizing Our Established Platform
• Maximize Asset Value and Productivity
Expand through Strategic Investment and Acquisition
Expand to Strategic Countries, especially CLMVI countries
Measurement
• Recurring Income c. 50% • Improvement of Margin
• Increase revenue and net profit from overseas
Appendix
41
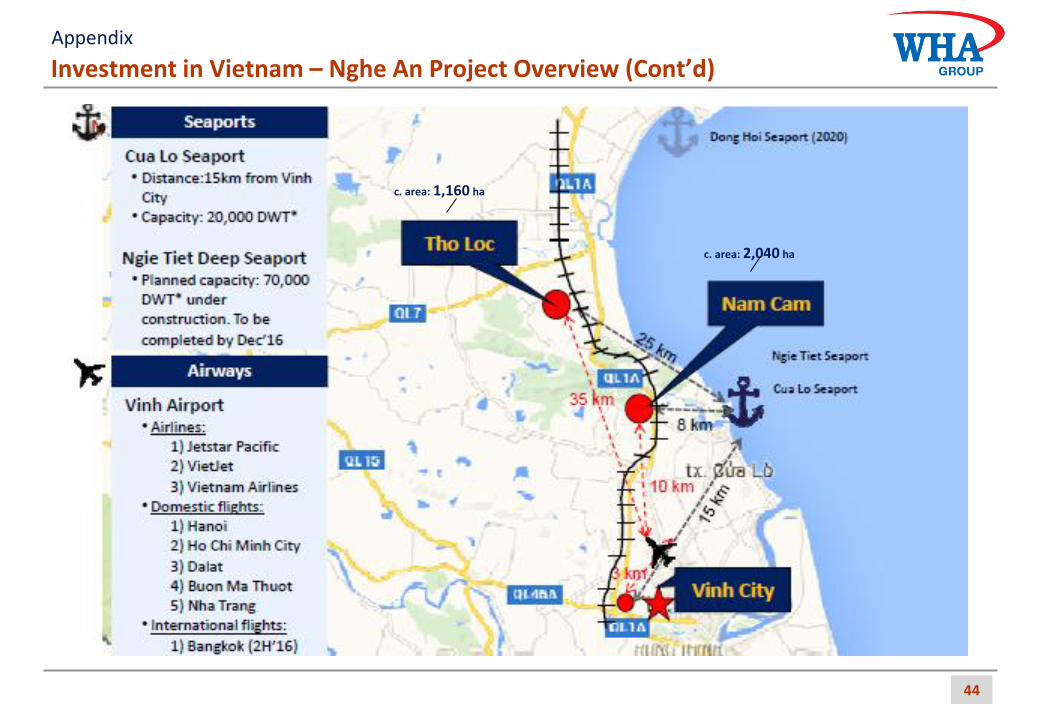
Investment in Vietnam – Nghe An Project Overview
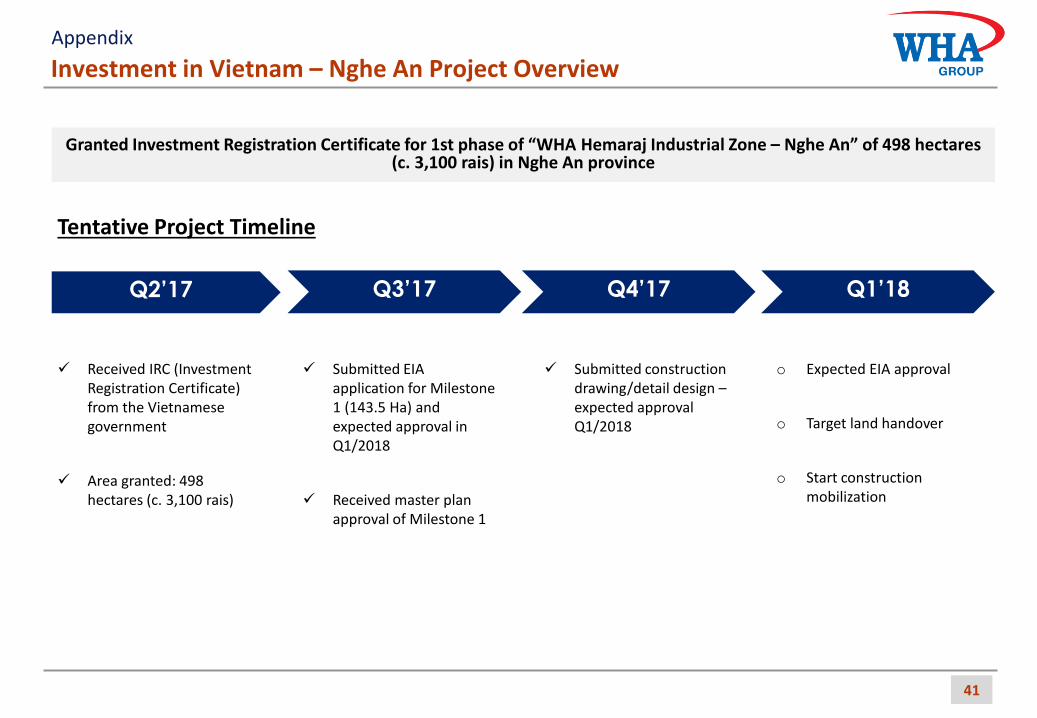
Tentative Project Timeline
Received IRC (Investment Registration Certificate) from the Vietnamese government
Area granted: 498 hectares (c. 3,100 rais)
Submitted EIA application for Milestone 1 (143.5 Ha) and expected approval in Q1/2018
Received master plan approval of Milestone 1
Submitted construction drawing/detail design – expected approval Q1/2018
Q2’17 Q3’17
o Expected EIA approval
o Target land handover
o Start construction mobilization
Q4’17 Q1’18
Granted Investment Registration Certificate for 1st phase of “WHA Hemaraj Industrial Zone – Nghe An” of 498 hectares (c. 3,100 rais) in Nghe An province
Appendix
42
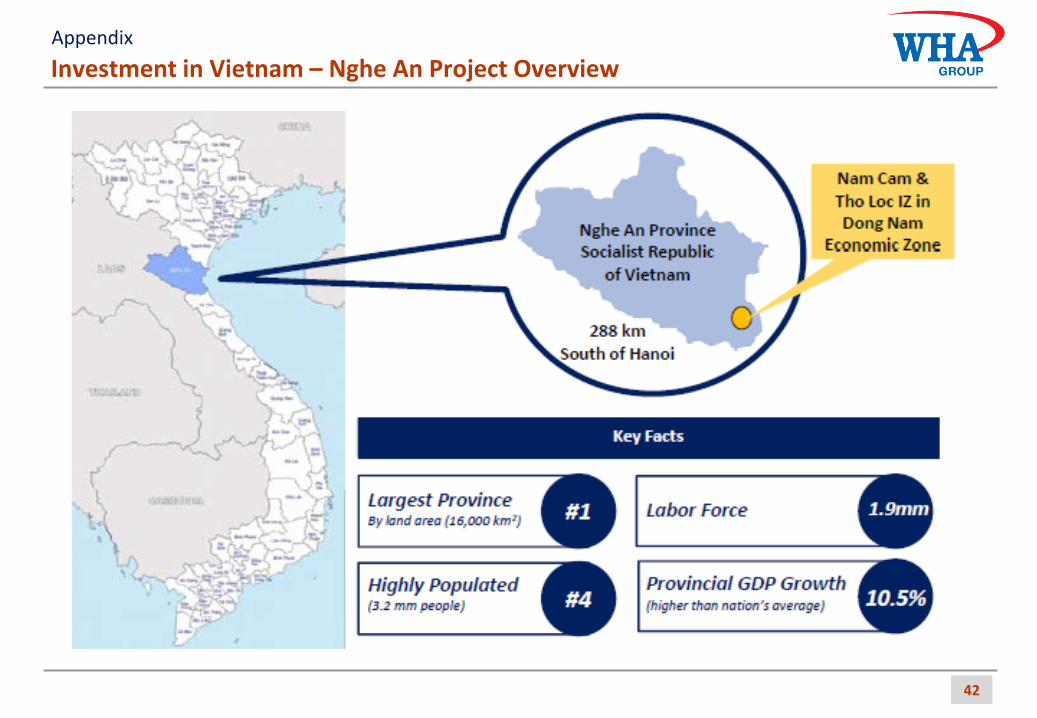
Investment in Vietnam – Nghe An Project Overview Appendix
43
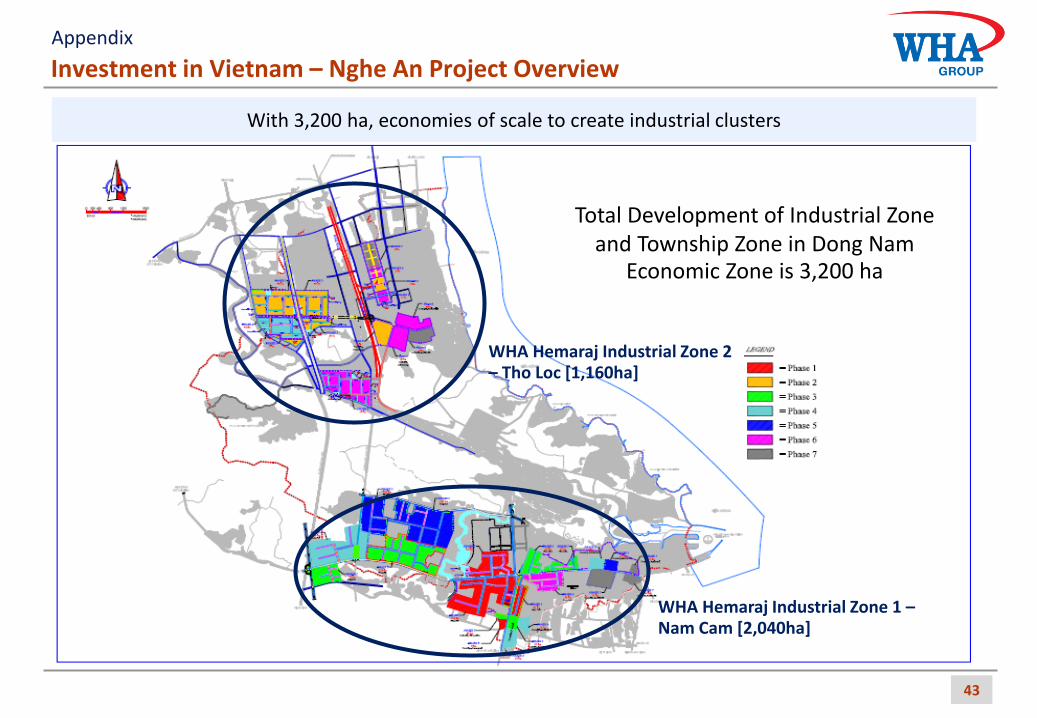
With 3,200 ha, economies of scale to create industrial clusters
WHA Hemaraj Industrial Zone 2 – Tho Loc [1,160ha]
WHA Hemaraj Industrial Zone 1 – Nam Cam [2,040ha]
Total Development of Industrial Zone and Township Zone in Dong Nam
Economic Zone is 3,200 ha
Investment in Vietnam – Nghe An Project Overview Appendix
44
Investment in Vietnam – Nghe An Project Overview (Cont’d)
c. area: 2,040 ha
c. area: 1,160 ha
Appendix
45
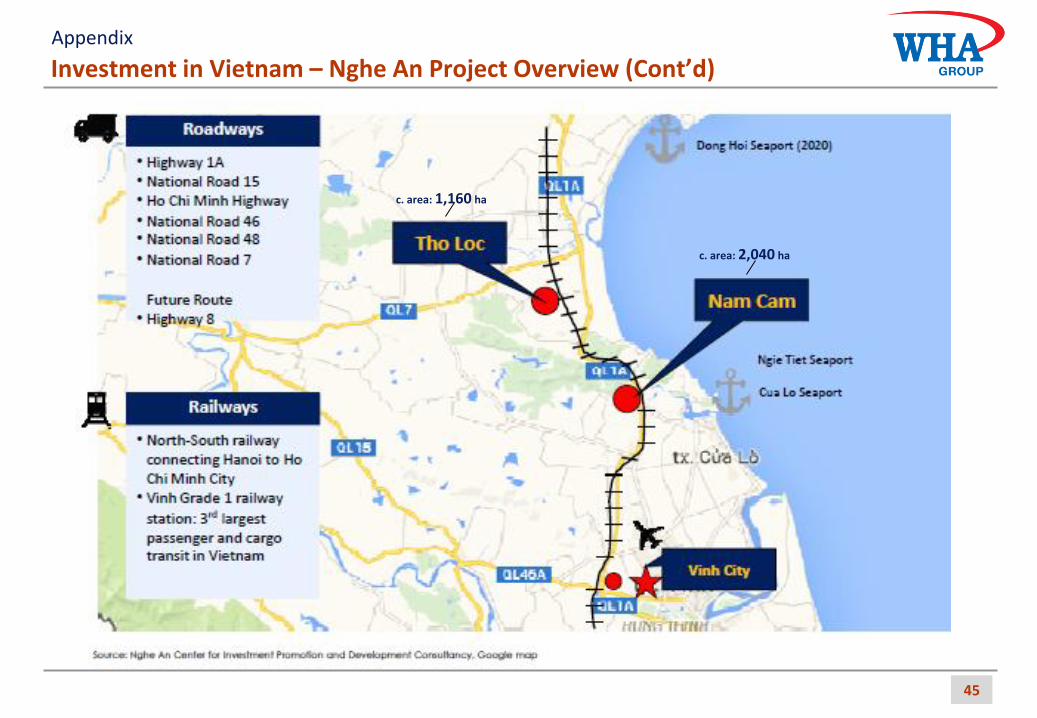
Investment in Vietnam – Nghe An Project Overview (Cont’d)
c. area: 2,040 ha
c. area: 1,160 ha
Appendix
Shareholding Information / Board of Director
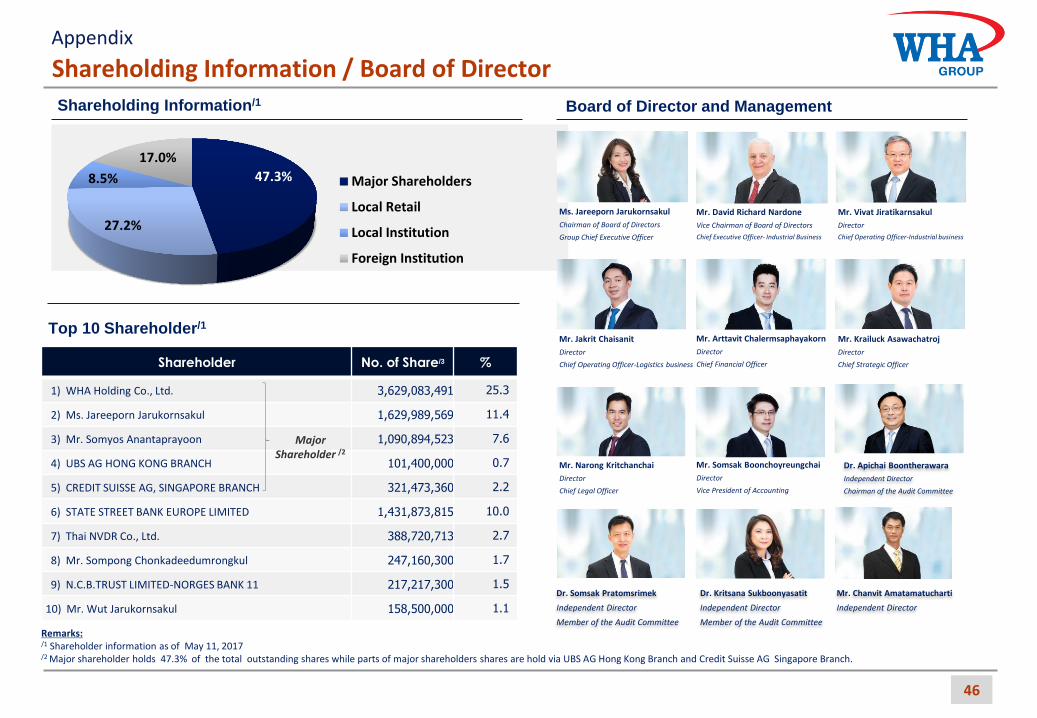
Shareholding Information/1
Top 10 Shareholder/1
Shareholder No. of Share/3 %
1) WHA Holding Co., Ltd. 3,629,083,491 25.3
2) Ms. Jareeporn Jarukornsakul 1,629,989,569 11.4
3) Mr. Somyos Anantaprayoon 1,090,894,523 7.6
4) UBS AG HONG KONG BRANCH 101,400,000 0.7
5) CREDIT SUISSE AG, SINGAPORE BRANCH 321,473,360 2.2
6) STATE STREET BANK EUROPE LIMITED 1,431,873,815 10.0
7) Thai NVDR Co., Ltd. 388,720,713 2.7
8) Mr. Sompong Chonkadeedumrongkul 247,160,300 1.7
9) N.C.B.TRUST LIMITED-NORGES BANK 11 217,217,300 1.5
10) Mr. Wut Jarukornsakul 158,500,000 1.1
• Major shareholder 47.3%
• Other pre-IPO shareholder /1 3.2%
• Post-IPO Investors 49.5%
Major Shareholder /2
Paid-up Capital
(THB 1,432.2 mm)
46
Board of Director and Management
Ms. Jareeporn Jarukornsakul
Chairman of Board of Directors
Group Chief Executive Officer
Mr. David Richard Nardone
Vice Chairman of Board of Directors
Chief Executive Officer- Industrial Business
Mr. Vivat Jiratikarnsakul
Director
Chief Operating Officer-Industrial business
Mr. Arttavit Chalermsaphayakorn
Director
Chief Financial Officer
Mr. Jakrit Chaisanit
Director
Chief Operating Officer-Logistics business
Mr. Narong Kritchanchai
Director
Chief Legal Officer
Mr. Krailuck Asawachatroj
Director
Chief Strategic Officer
Mr. Somsak Boonchoyreungchai
Director
Vice President of Accounting
Dr. Apichai Boontherawara
Independent Director
Chairman of the Audit Committee
Dr. Kritsana Sukboonyasatit
Independent Director
Member of the Audit Committee
Mr. Chanvit Amatamatucharti
Independent Director
Dr. Somsak Pratomsrimek
Independent Director
Member of the Audit Committee
Appendix
Remarks: /1 Shareholder information as of May 11, 2017 /2 Major shareholder holds 47.3% of the total outstanding shares while parts of major shareholders shares are hold via UBS AG Hong Kong Branch and Credit Suisse AG Singapore Branch.
47.3%
27.2%
8.5%
17.0%
Major Shareholders
Local Retail
Local Institution
Foreign Institution
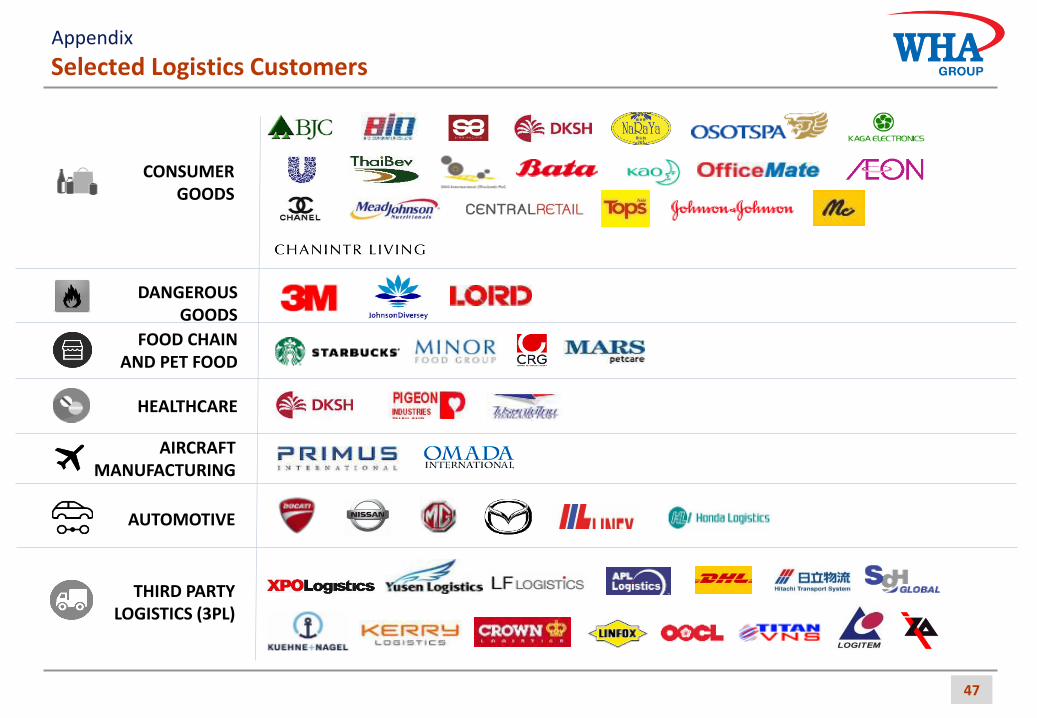
CONSUMER GOODS
DANGEROUS GOODS
FOOD CHAIN AND PET FOOD
HEALTHCARE
AUTOMOTIVE
THIRD PARTY LOGISTICS (3PL)
AIRCRAFT MANUFACTURING
47
Selected Logistics Customers Appendix
48
Consumer Petrochemical Steel/Metal
Automotive
Selected Industrial Customers Appendix