WGSIP12 – Miami - January 2009 – Research Data Seasonal Applications - Andy Morse.
37
WGSIP12 – Miami - January 2009 – Research Data Seasonal Applications - Andy Morse
Transcript of WGSIP12 – Miami - January 2009 – Research Data Seasonal Applications - Andy Morse.

WGSIP12 – Miami - January 2009 – Research Data Seasonal Applications - Andy Morse

WGSIP12 – Miami - January 2009 – Research Data Seasonal Applications - Andy Morse

WGSIP12 – Miami - January 2009 – Research Data Seasonal Applications - Andy Morse
Status report on use of and need for research data in seasonal applications
Andy Morse, Cyril Caminade and Anne JonesDepartment of Geography,
University of Liverpool,
Liverpool,
United Kingdom

WGSIP12 – Miami - January 2009 – Research Data Seasonal Applications - Andy Morse
Talk Themes
• Introduction & Background• Research Examples• Summary

WGSIP12 – Miami - January 2009 – Research Data Seasonal Applications - Andy Morse
IntroductionWeather and Climate Models - heading towards seamlessness
e.g. ECMWF• NWP deterministic, 25km few days• Medium range EPS 51 members, to 10 days at 50km (15 days at 75km)• Month – 51 members 75km• Seasonal 7 or 13 month 41 members 125km & seasonal research
• Decadal scale EPS very experimental – currently 13 months & out to 10 years
‘decadal gap’ period 2010 to 2050 – key new funding focus UK and US
• Climate models – global and regional typically run through late 20th century out to 2100 (100 to 300km)
multiple single model runs - range of scenarios

WGSIP12 – Miami - January 2009 – Research Data Seasonal Applications - Andy Morse
Research Examples – climate model – data exploration
Slide from Cyril Caminade
University of Liverpool.
Rainfall JAS Climatology – DEMETER 40 years but initial ENSEMBLES stream (new version seasonal models) only 10 years
– 40 year data to follow Mean (1991-2001):
Mean Bias (1991-2001):
During JAS, the ITCZ reaches its top northward position. Maximum rainfall occurs over the Senegal coast, the Cameroon Gulf and over the Ethiopian Highs
A common bias of coarse resolution GCM over Africa:Rainfall overestimation over the high mountains (Ethiopia).Underestimation over the low level mountains (Cameroon mounts).

WGSIP12 – Miami - January 2009 – Research Data Seasonal Applications - Andy Morse
Like the mean biases, the models overestimate rainfall variability over the Senegal coast and the Cameroon coasts. Precipitation variance is overestimated over ocean (the Gulf of Guinea).(The bias is reduced in DEMETER as there are more models).
Research Examples – climate model – data exploration
Slide from Cyril Caminade
University of Liverpool.
Rainfall JAS Variance
Standard Deviation (1991-2001):
Standard Deviation Bias (1991-2001):

WGSIP12 – Miami - January 2009 – Research Data Seasonal Applications - Andy Morse
Research Examples – climate model – data exploration
Common behaviour:Overestimation of rainfall during the rainy season (few models)Too Flat profile (not a clear peak centered in August)
Climates Mean Seasonal cycle (16°W-45°E) slide Cyril Caminade
WGSIP12 – Miami - January 2009 – Research Data Seasonal Applications - Andy Morse
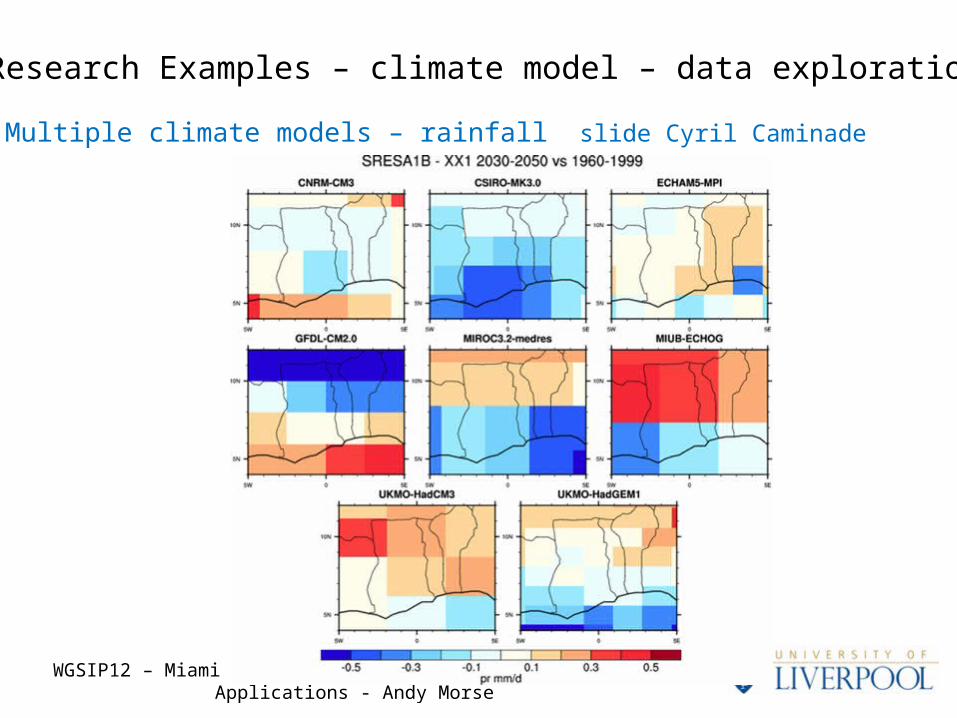
Research Examples – climate model – data exploration
Multiple climate models – rainfall slide Cyril Caminade

WGSIP12 – Miami - January 2009 – Research Data Seasonal Applications - Andy Morse
Research Examples – climate model – data exploration
Multiple climate models – temperature slide Cyril Caminade

WGSIP12 – Miami - January 2009 – Research Data Seasonal Applications - Andy Morse
1987 1988 1989 1990 1991 1992 1993 1994 1995 1996 1997 1998 1999
Whea
t yi
eld (t/
ha)
2.00
4.00
6.00
8.00
10.00
Observed yields are displayed in blue (from minimum to maximum). Mean is displayed as a red line.Simulated yields with downscaled multi model ensemble seasonal hindcasts are displayed as orange boxes.
F. Tomei, G. Villani, V. Marletto
ENSEMBLES Results obtained indicate the possibility to set up an operational wheat yield forecasting chain for northern Italy.
Observed yields vs. simulated with seasonal hindcastsObserved yields vs. simulated with seasonal hindcasts
Research Examples – ranges of users

WGSIP12 – Miami - January 2009 – Research Data Seasonal Applications - Andy Morse
Research Examples – ranges of users
Seasonal predictabilityof winter storminess(here: ECMWF System3)
Loss potential of winter storms
based on coupling ~300 yrs of s2d data with loss model
www.meteoswiss.ch/web/en/research/projects/nccr_ii/prewistor.htmlPaul Della-Marta, Mark Liniger
MeteoSwiss: Winter Storm Risk for Europe
ENSEMBLES
Publication submitted: Della-Marta et al: Improved estimates of the European winter wind storm climate and the risk of reinsurance loss using climate model data
WGSIP12 – Miami - January 2009 – Research Data Seasonal Applications - Andy Morse
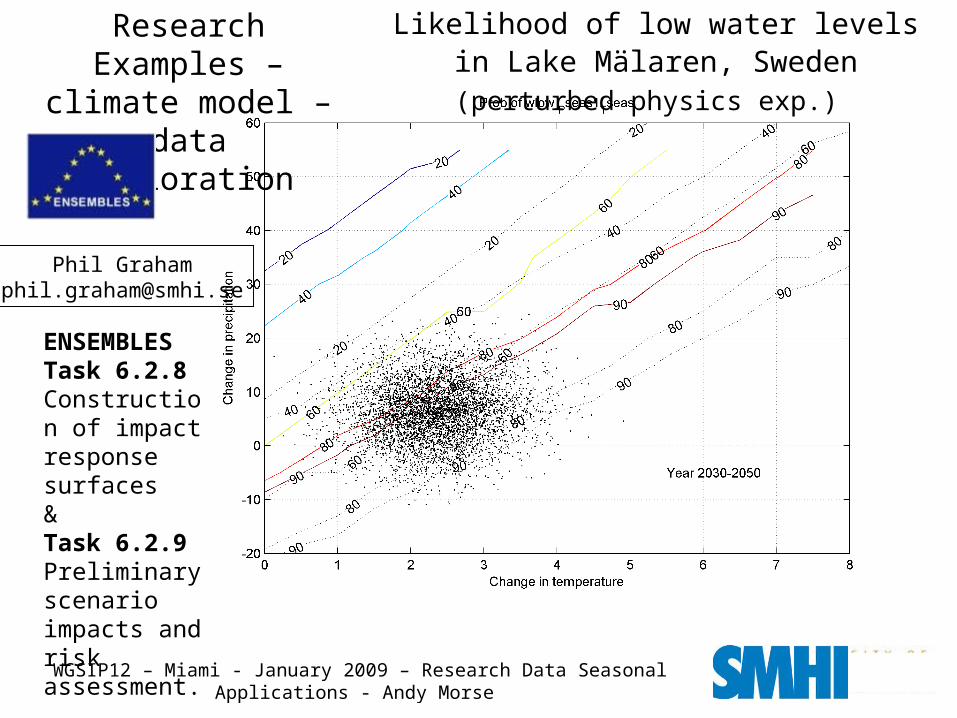
ENSEMBLESTask 6.2.8 Construction of impact response surfaces &Task 6.2.9 Preliminary scenario impacts and risk assessment.
Likelihood of low water levels in Lake Mälaren, Sweden (perturbed physics exp.)
Research Examples – climate model – data
exploration
Phil [email protected]

WGSIP12 – Miami - January 2009 – Research Data Seasonal Applications - Andy Morse
Research Examples – range of users
Blue tongue climates using RCMs
ENSEMBLES
first look using RCM data sets for later comparison with s2d and towards seamlessness
Ro relative anomaly over Northern Europe. The ECA observations are displayed in black the CTL (SRESA1B) multi model ensemble means are displayed in blue (red). The blue (orange) envelope highlights the spread
Cyril Caminade and Andy Morse

WGSIP12 – Miami - January 2009 – Research Data Seasonal Applications - Andy Morse 15
Malaria incidence
maturation
Gon
otro
phic
cyc
le
Larvae
Adult mosquitoes
ovi
po
s iti
on
ing
death
death
Dynamic mosquito population
Temperature and rainfall-driven
Dynamic malaria transmission
Temperature-driven
Research Examples – malaria modelling Liverpool Malaria Model (LMM)
Dynamic, process-based model driven by daily temperature and rainfall

WGSIP12 – Miami - January 2009 – Research Data Seasonal Applications - Andy Morse
Research Examples – malaria modelling
Tier-2 malaria runs - ROC Skill Scores Above Median Event
DEMETER driven LMM. Areas of high interannual variability were selected and persisted forecast skill was removed from the scores.
Jones, A. and Morse, A. (2007) CLIVAR Exchanges, 43
May 4-6JAS
Nov 4-6FMA

WGSIP12 – Miami - January 2009 – Research Data Seasonal Applications - Andy Morse
Fig. 2: (A) Differences in the annual average model prevalence (in %) and (B) in the standard deviation regarding the annual maximum of the model prevalence (in %) between the last decade of the A1B scenario (2041-2050) and the past period (1960-2000).
Changes in the malaria distributionClimate Change
University of Liverpool, A. Morse & A. JonesUniversity of Cologne, V. Ermert & A. FinkUniversity of Würzburg, H.Paeth
LMM malaria scenarios (2041-2050):• decreased malaria transmission due to precipitation reduction• reduced model prevalence variability in N-Sahel fewer epidemics/malaria retreat• 13-16°N: increased variability in the S-Sahelian zone more frequent epidemics in denser populated areas• farther south: malaria transmission remains stable

WGSIP12 – Miami - January 2009 – Research Data Seasonal Applications - Andy Morse
0
0.05
0.1
0.15
0.2
0.25
0.3
0.35
0.4
0.45
1 31 61 91 121 151
Forecast Day
Ma
lari
a P
rev
ale
nc
e
Research Examples – malaria prediction plume
95
85
65
35
15
5ERA
Botswana malaria forecast for February 1989, LMM driven by DEMETER multi-model
(ERA-driven model shown in red)
Plot from Anne Jones unpublished Ph.D. thesis University of Liverpool
WGSIP12 – Miami - January 2009 – Research Data Seasonal Applications - Andy Morse 19
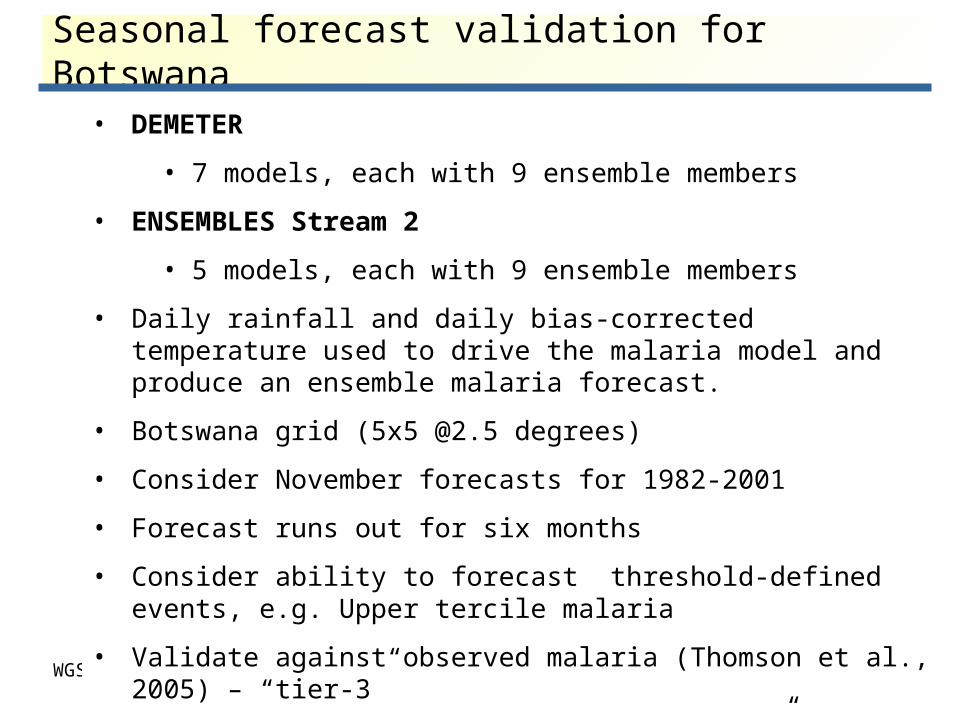
• DEMETER
• 7 models, each with 9 ensemble members
• ENSEMBLES Stream 2
• 5 models, each with 9 ensemble members
• Daily rainfall and daily bias-corrected temperature used to drive the malaria model and produce an ensemble malaria forecast.
• Botswana grid (5x5 @2.5 degrees)
• Consider November forecasts for 1982-2001
• Forecast runs out for six months
• Consider ability to forecast threshold-defined events, e.g. Upper tercile malaria
• Validate against observed malaria (Thomson et al., 2005) – “tier-3”
• And against ERA-40-driven model (“tier-2” potentially over continent)
Seasonal forecast validation for Botswana

WGSIP12 – Miami - January 2009 – Research Data Seasonal Applications - Andy Morse
-1
-0.8
-0.6
-0.4
-0.2
0
0.2
0.4
0.6
0.8
1
1
34
56
7
2
DEMETER ENSEMBLES
DEMETER ENSEMBLES
ERA40
1. Met France2. CERFACS3. LODYC4. INGV
5. ECMWF6. MPI7. UKMO
20
Seasonal forecast skill: ROC skill scores for predictions of upper tercile malaria incidence over Botswana, November forecast months 4-6 (FMA), against published malaria index. 95% confidence intervals shown.
DEMETER multi-model (7 models): 0.67 (0.41-0.93)ENSEMBLES multi-model (5 models): 0.70 (0.43-0.94)ERA-40 reference simulations: 0.88 (0.70-1.00)
Validation results (tier-3): upper tercile malaria

WGSIP12 – Miami - January 2009 – Research Data Seasonal Applications - Andy Morse
0.0
0.1
0.2
0.3
0.4
0.5
0.6
0.7
0.8
0.9
1.0
0.0 0.2 0.4 0.6 0.8 1.0
H
F
DEMETER
ENSEMBLES
00.1
0.20.3
0.40.5
0.60.7
1982
1983
1984
1985
1986
1987
1988
1989
1990
1991
1992
1993
1994
1995
1996
1997
1998
1999
2000
2001
Fore
cast
pro
babi
lity
-2.5-2-1.5-1-0.500.511.522.5
00.10.20.30.40.50.60.70.80.9
1982
1983
1984
1985
1986
1987
1988
1989
1990
1991
1992
1993
1994
1995
1996
1997
1998
1999
2000
2001
Fore
cast
pro
babi
lity
-2.5-2-1.5-1-0.500.511.522.5
21
DEMETER: ROC Area=0.44
ENSEMBLES: ROC Area=0.59
Solid bars indicate upper tercile years
Probability forecasts of upper tercile malaria for Botswana, November forecast months 4-6 (FMA), compared to observed anomalies from published index (red).
Visualisation of forecast performance: ECMWF model

WGSIP12 – Miami - January 2009 – Research Data Seasonal Applications - Andy Morse
Weighting malaria model outputSensitivity to single model weight
0.5
0.55
0.6
0.65
0.7
0.75
0.8
0.85
0 0.1 0.2 0.3 0.4 0.5 0.6 0.7 0.8 0.9 1single model weight
RO
C
cnrm crfc lodyscnr scwf smpiukmo equal weights
0.5
0.55
0.6
0.65
0.7
0.75
0.8
0.85
0 0.1 0.2 0.3 0.4 0.5 0.6 0.7 0.8 0.9 1single model weight
RO
C
cnrm crfc lodyscnr scwf smpiukmo equal weights
Single model weight w is varied between 0 and 1 in increments of 0.05.
Weights for the other 6 models are each set to (1-w)/6, so that the total weight sums to 1.
For each model in turn w=0 corresponds to a 6 model ensemble excluding that model and w=1 corresponds to the single model forecast
Skill of LMM incidence forecast for Botswana as a function of single model weight
Skill of LMM incidence forecast for Botswana as a function of single model weightModel missing Single model only

WGSIP12 – Miami - January 2009 – Research Data Seasonal Applications - Andy Morse
Post-processing - ensemble interpretation
23
Bröcker and Smith, 2008Kernel dressing (KD)
• Applies unit kernel function, K (e.g. Gaussian), to each ensemble member xi and then combines them:
i
iaxyK
dxyp
1
:),;(
axi +
BUT results show only marginal increase in ROC area for dressed v “counting” methods:
Counting Gaussian fit Standard Kernel Dressing
(2 params)
Affine Kernel Dressing
(5 params)
UKMO
DEMETER Met Office model
0.69
0.51-0.84
0.67
0.49-0.83
0.70
0.53-0.86
0.68
0.50-0.84
Tier-2 skill for Botswana upper tercile malaria, Nov forecast FMA, 1960-2001

WGSIP12 – Miami - January 2009 – Research Data Seasonal Applications - Andy Morse
Summary
• Experience in integrated EPS – initial promising results (DEMETER, ENSEMBLES)
• Need to make better use of current products and data and to understand limitations
• Impacts allow non-linear mapping of combined ensemble PDFs through time
• Impacts allow assessment of downscaling, dressing of ensembles etc.
• Impacts define forecast skill and potential user/societal value
• Impacts make link to decision makers/stakeholders
• Impacts allow linkage across modelling streams – semi seamless approach
• Need to develop seamless approaches with & for impacts
• Establish feedback from impacts communities of needs
to climate science community

WGSIP12 – Miami - January 2009 – Research Data Seasonal Applications - Andy Morse
Questions?

WGSIP12 – Miami - January 2009 – Research Data Seasonal Applications - Andy Morse

WGSIP12 – Miami - January 2009 – Research Data Seasonal Applications - Andy Morse
0
0.1
0.2
0.30.4
0.5
0.6
0.7
19
82
19
83
19
84
19
85
19
86
19
87
19
88
19
89
19
90
19
91
19
92
19
93
19
94
19
95
19
96
19
97
19
98
19
99
20
00
20
01
Fo
rec
as
t p
rob
ab
ilit
y
0.0
0.5
1.0
0.0 0.5 1.0
H
F
27
Event forecast
Event observed
Yes No
Yes Hit (a) False alarm (b)
No Miss (c) Correct rejection (d)
ca
aH
db
bF
P=0
P=1
Performance assessment: decision-making context
DEMETER multi-model malaria forecasts for upper tercile malaria, Botswana, November forecast months 4-6 (FMA), compared to observed anomalies from published index.
DEMETER
ERA-40 (cont)
ERA-40 (discrete)
Decision threshold, P

WGSIP12 – Miami - January 2009 – Research Data Seasonal Applications - Andy Morse 28
Research Examples -DEMETER performance for Botswana
0.0
0.5
1.0
0.0 0.5 1.0F
H
Tier-3 upper tercile incidence
Theoretical cost/loss versus potential economic value (measured relative to climatology)
ERA-40
DEMETERExpensive to take action (never act)
Cheap to take action (always act)
perfectc
forecastc
EE
EEV
lim
lim
1-specificity
sens
itiv
i ty
Event forecast
Event observed
Yes No
Yes Hit (a) False alarm (b)
No Miss (c) Correct rejection (d)
ca
aH
db
bF
ROC diagram
Slide Anne Jones, University of Liverpool

WGSIP12 – Miami - January 2009 – Research Data Seasonal Applications - Andy Morse
0
20
40
60
80
100
120
11 12 1 2 3 4 5 6 7 8 9 10
Mo
nthl
y m
ean
inci
denc
e
Month
0
50
100
150
200
250
11 12 1 2 3 4 5 6 7 8 9 10
Mo
nthl
y m
ean
rain
fall
(mm
)
Month
0
50
100
150
200
250
300
11 12 1 2 3 4 5 6 7 8 9 10
Mo
nthl
y d
egre
e d
ays
abo
ve 1
8C
Month
Research Examples – DEMETER driven malaria re-forecasts for Botswana
Temperature
Rainfall
Climate 1982-2001
Malaria
November forecast – DEMETER and ERA-40
Skill for above median events Nov 4-6 FMA Tier-3
Plot from Anne Jones University of Liverpool
Solid circles =DEMETER median, boxes =quartiles, whiskers=rangeHollow circles = ERA-40

WGSIP12 – Miami - January 2009 – Research Data Seasonal Applications - Andy Morse
Background -scalesGlobal model – regional impacts – local and microscale processes
1000s to 100s km
kms to 100s m
metre
cm to mm
Africa to mosquito 9 orders of magnitudeEarth-Sun distance to
galaxy scale

WGSIP12 – Miami - January 2009 – Research Data Seasonal Applications - Andy Morse
Background - integrating impacts within EPS
‘end- to- end’ approaches towards seamlessness
Climate forecasts – climate forecast developers – end user applications (health – human and animal, crops, water) – policy and decision makers - stakeholders (including governments) – social scientists (including economics) - general public … wide range of latitudes
User driven – tailoring product, skill requirements, ‘acceptable’ uncertainty – mentioned above
Climate Science – seamless approach, impact models, downscaling & bias correction, risks, feedback model development, adaptation
Policy – decisions for impact reduction
Technical – ensembles, data - cross cutting, model climates
Training – probabilistic – use, validation & uncertainty

WGSIP12 – Miami - January 2009 – Research Data Seasonal Applications - Andy Morse
Background – integrating impacts within EPS
Approach is often as top down (climate models downwards – is health less top down??) but an end-to-end ‘loop’ is better
Timely use of existing climate information – from observations, through and range of forecast products/output trough seasons to decades and beyond
Feedback (lack of) from impacts groups to climate science from user impacts is highlighted as a key concern, WMO meeting Hawaii, April 2008

WGSIP12 – Miami - January 2009 – Research Data Seasonal Applications - Andy Morse
Research Examples – model integration –advancedrainfall sensitivity
Pattern of wet days in addition to total amount is important
0
10
20
30
4050
60
70
80
90
100
0 6 12 18 24 30 36 42 48 54 60 66 72 78 84 90 96 102 108
Month
LM
M in
cid
en
ce1 day 10 day 30 day
LMM Monthly malaria incidence for Botswana as a function of artificially degraded rainfall resolution for 1982-1990.
• If data are averaged over a month (blue), peak incidence can be twice as high as with daily data.
• The season also tends to start early and finish later.
Slide from Anne Jones, University of Liverpool

WGSIP12 – Miami - January 2009 – Research Data Seasonal Applications - Andy Morse
Research Examples – climate model – data explorationPlume Plot May 2-5
1st June 1st Sep
Daily rainfall climatology from 1st June to 30 September (1991-2001) over the Sahel (20W-45E, 10N-20N). ifmk is the MPI model From the Max Planck institute involved in ENSEMBLES.
In blue is depicted the spread envelopeof the ensemble for different interquantile ranges. The model median is highlighted in black, the NCEP reanalysis in red.
A five-day low pass filter has been applied to the data.
Slide from Cyril Caminade
University of Liverpool.

WGSIP12 – Miami - January 2009 – Research Data Seasonal Applications - Andy Morse
Research Examples – climate model – data exploration
Global climate models slide Cyril Caminade

WGSIP12 – Miami - January 2009 – Research Data Seasonal Applications - Andy Morse 36
ROC Areas (95% confidence intervals) ERA-40 (continuous) and DEMETER-driven LMM malaria transmission anomaly forecasts for November start date, months 4-6 (FMA) against Thomson et al. Malaria index. ROC area > 0.5 indicates skill relative to climatology.
Research Examples DEMETER performance for Botswana
Event ERA-40 DEMETER
Lower tercile 0.714(0.438-0.938)
0.841(0.627-1.0)
Above the median 0.820(0.615-0.969)
0.780(0.544-0.949)
Upper tercile 0.879(0.640-1.0)
0.670(0.412-0.929)
Simple probability forecast – count ensemble members
Event threshold
Slide from Anne Jones, University of Liverpool

WGSIP12 – Miami - January 2009 – Research Data Seasonal Applications - Andy Morse 37
e.g. February forecast period is heavily influenced by rainfall from initialisation period
Tier-3 ROC AREAS Upper tercile
ERA-40 driven LMM incidence (Feb 2-4)
0.890(0.714-1.0)
DEMETER-driven LMM incidence
(Feb 2-4)
0.923(0.769-1.00)
ERA-40 control run (persistence)
0.874 (0.635-1.00)
0
50
100
150
200
250
2 3 4 5 6 7 8 9 10 11 12 1
Month
Mo
nth
ly m
ea
n r
ain
fall
(mm
)
DEMETER ensemble median ERA-40
Rainfall
Incidence
Forecast window/model lag
0
10
20
30
40
50
60
2 3 4 5 6 7 8 9 10 11 12 1
Month
Mo
nth
ly m
ea
n in
cid
en
ce
DEMETER ensemble median ERA-40
Incidence
Botswana malaria forecasts
Slide Anne Jones, University of Liverpool