WGBH Educational Foundation and production 109,652,267 105,851,884 ... The consolidated financial...
38
WGBH Educational Foundation Consolidated Financial Statements August 31, 2012 and 2011
-
Upload
nguyendang -
Category
Documents
-
view
218 -
download
1
Transcript of WGBH Educational Foundation and production 109,652,267 105,851,884 ... The consolidated financial...

WGBH Educational Foundation Consolidated Financial Statements August 31, 2012 and 2011

WGBH Educational Foundation Index August 31, 2012 and 2011
Page(s)
Report of Independent Auditors ........................................................................................................... 1
Consolidated Financial Statements
Statements of Financial Position ..................................................................................... . . ......... 2
Statements of Operations ...................... . . .................................................................. 3
Statements of Changes in Net Assets ............. . . ......................................................................... 4
Statements of Cash Flows. . ............................................. 5
Notes to Financial Statements ........................................................................................................... 6--28
Supplemental Consolidating Information as of and for Year Ended August 31,2012. .. ... 29
Consolidating Balance Sheet Information .............. . . .............................................................. 30
Consolidating Statement of Operations Information ............................................................................... 31

pwc
To the Board of Trustees of the WGBH Educational Foundation
Report of Independent Auditors
In our opinion, the accompanying consolidated statements of financial position and the related consolidated statements of operations, of changes in net assets, and of cash flows present fairly, in all material respects, the financial position of WGBH Educational Foundation (the "Foundation") and its subsidiaries at August 31,2012 and 2011, and the results of their operations, changes in their net assets, and their cash flows for the years then ended in conformity with accounting principles generally accepted in the Uniled States of America. These financial statements are the responsibility of the Foundation's management. Our responsibility is to express an opinion on these financial statements based on our audits. We conducted our audits of these statements in accordance with auditing standards generally accepted in the United States of America. Those standards require that we plan and perform the audit to obtain reasonable assurance about whether the financial statements are free of material misstatement. An audit includes examining, on a test basis, evidence supporting the amounts and disclosures in the financial statements, assessing the accounting principles used and significant estimates made by management, and evaluating the overall financial statement presentation. We believe that our audits provide a reasonable basis for our opinion.
Our audits were conducted for the purpose of forming opinions on the basic financial statements. The Supplemental Consolidating Information as of and for the year end August 31, 2012 are presented for purposes of additional analysis and are not a required part of the basic financial statements. The information is the responsibility of management and was derived from and relates directly to the underlying accounting and other records used to prepare the basic financial statements. The information has been subjected to the auditing procedures applied in the audits of the basic financial statements and certain additional procedures, including comparing and reconciling such information directly to the underlying accounting and other records used to prepare the basic financial statements or to the basic financial statements themselves and other additional procedures, in accordance with auditing standards generally accepted in the United States of America. In our opinion, the Supplemental Consolidating Information as of and for the year end August 31, 2012 is fairly stated, in all material respects, in relation to the basic financial statements taken as a whole.
January 30, 2013
~pers LLP, 12{jHigh Street; Boston, MA 02110 T: (617) 53U 5000, F, (617) 530 5001, www.pwc.com/us

WGBH Educational Foundation Consolidated Statements of Financial Position August 31,2012 and 2011
Assets Current assets
Cash and cash equivalents Accounts receivable (less allowance for uncollectible accounts of $406,000 and $468,000 for 2012 and 2011, respectively)
Current portion of receivables for asset sales Grants receivable (less allowance for uncollectible grants of of $28,000 and $97,000 for 2012 and 2011, respectively)
Pledges receivable, net Prepaid expenses and other assets
Total current assets
Long-term pledges receivable, net Long-term grants receivable, net Long-term receivables for asset sales Radio licenses Other assets Equity investments Funds held under bond agreements - restricted Investments, at fair market value Property, facilities and equipment, net
Total assets
Liabilities Current liabilities
Current maturities debt Accounts payable and other liabilities Accrued expenses Royalties payable Accrued bond interest expense Deferred revenue and other liabilities
Total current liabilities
Long-term deferred revenue and other liabilities Long-term debt, net of unamortized discount and premium Accrued bond interest expense
Total liabilities
Net Assets Unrestricted Temporarily restricted Permanently restricted
Total net assets
Total liabilities and net assets
2012 2011
$ 18,863,902 $ 20,668,369
11,700,895 8,991,061 5,643,969 5,683,699
54,554,816 68,245,480 2,472,457 2,388,701 1,848,766 1,427,101
95,084,805 107,404,411
2,300,407 2,710,971 13,115,529 18,474,223
126,817,573 124,821,747 16,868,713 16,868,713 8,052,439 8,169,373 4,941,787 2,908,542 1,225,609 1,285,000
70,542,709 63,619,068 176,152,168 180,363,877
$515,101,739 $ 526,625,925
$ 1,835,000 $ 1,800,000 5,025,806 4,613,411 9,317,179 12,379,973 2,643,422 2,416,514 5,299,528 5,325,494 5,353,411 475,261
29,474,346 27,010,653
9,192,670 6,979,783 175,487,330 177,402,682
5,190,360 3,034,368
219,344,706 214,427,486
173,415,978 174,818,898 86,228,016 107,992,872 36,113,039 29,386,669
295,757,033 312,198,439
$515,101,739 $ 526,625,925
The accompanying notes are an integral part of these consolidated financial slalemen!S

WGBH Educational Foundation Consolidated Statements of Operations August 31, 2012 and 2011
2012 2011
Operating revenue Contributions, principally viewer and listener support $ 23,614,801 $ 23,909,966 Community service grants from the Corporation for Public Broadcasting 7,422,700 8,193,515 Royalty and licensing 4,201,280 2,548,834 Captioning and ancillary services 7,868,302 7,526,208 Planned giving 1,546,276 744,766 Accretion of interest and other income on long-term receivables 11,887,075 7,489,147 Investment earnings authorized for operations 1,349,328 1,334,693 In-kind contributions and donated services 6,509,274 5,584,859 Affiliation fees 539,354 Carriage fees 711,272 Miscellaneous income 4,857,072 6,981,303
Total operating revenue 70,506,734 64,313,291
Net assets released from restrictions 104,523,255 104,876,445
Total operating revenue and other support 175,029,989 169,189,736
Operating expenses Programming and production 109,652,267 105,851,884 Broadcasting 12,990,631 12,348,398 Public information, guides and educational material 11,263,643 10,437,843 Fundraising and development 13,051,695 12,777,014 Underwriting 4,923,205 5,268,197 General and administrative 31,680,018 36,302,613
Total operating expenses 183,561,459 182,985,949
Deficit of operating revenue and other support over operating expenses (8,531,470) (13,796,213)
Nonoperating gains (losses) Contribution of net deficit for newly affiliated company (4,402,861) Underwater endowment transfer 11,814 120,751 Realized gains on investments 1,177,736 1,219,393 Change in net unrealized (Iosses)/gains on investments (224,068) 2,563,083 Investment income 342,684 434,749 Gain on equity investments 10,223,245 4,478,762 Impairment loss on radio licenses (1,500,000)
Nonoperating gains (losses), net 7,128,550 7,316,738
Decrease in unrestricted net assets $ (1,402,920) $ (6,479,475)
The accompanying notes are an Integral part of these consolidated financial statements
3
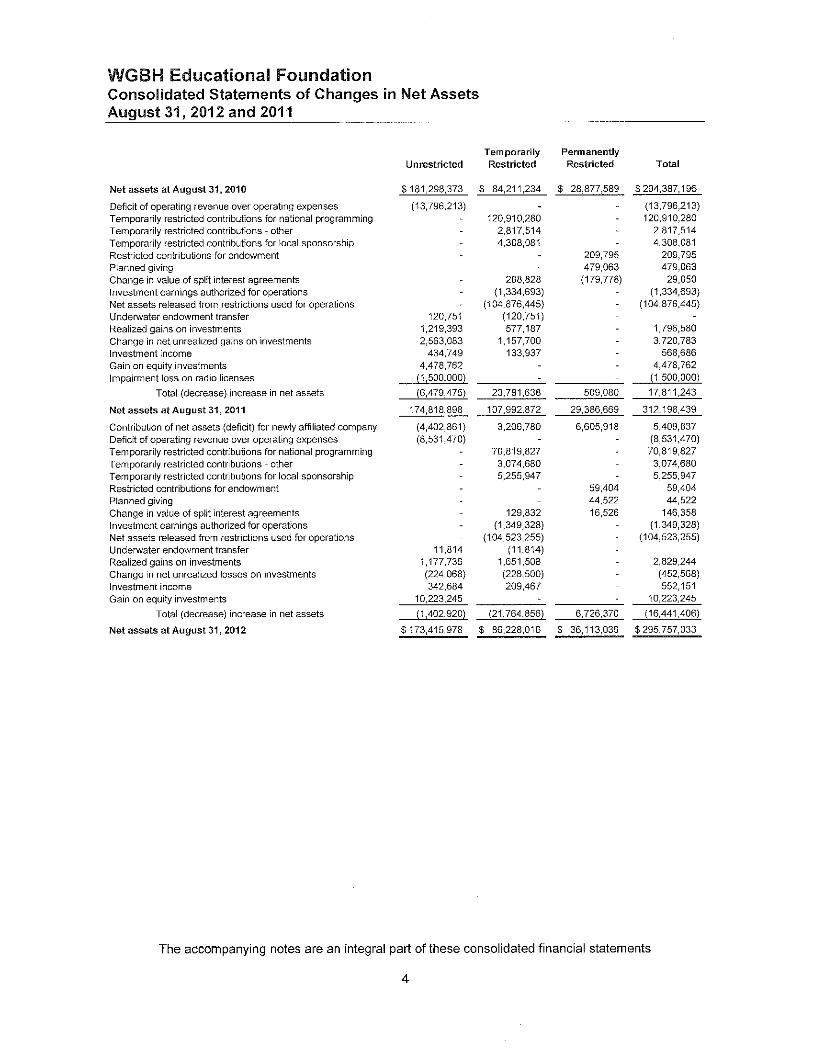
WGBH Educational Foundation Consolidated Statements of Changes in Net Assets August 31, 2012 and 2011
Temporarily Permanently Unrestricted Restricted Restricted Total
Net assets at August 31,2010 $ 181,298,373 $ 84,211,234 $ 28,877,589 $ 294,387,196
Deficit of operating revenue over operating expenses (13,796,213) (13,796,213) Temporarily restricted contributions for national programming 120,910,280 120,910,280 Temporarily restricted contributions - other 2,817,514 2,817,514 Temporarily restricted contributions for local sponsorship 4,308,081 4,308,081 Restricted contributions for endowment 209,795 209,795 Planned giving 479,063 479,063 Change in value of split interest agreements 208,828 (179,778) 29,050 Investment earnings authorized for operations (1,334,693) (1,334,693) Net assets released from restrictions used for operations (104,876,445) (104,876,445) Underwater endowment transfer 120,751 (120,751) Realized gains on investments 1,219,393 577,187 1,796,580 Change in net unrealized gains on investments 2,563,083 1,157,700 3,720,783 Investment income 434,749 133,937 568,686 Gain on equity investments 4,478,762 4,478,762 Impairment loss on radio licenses (1,500,000) (1,500,000)
Total (decrease) increase in net assets (6,479,475) 23,781,638 509,080 17,811,243
Net assets at August 31, 2011 174,818,898 107,992,872 29,386,669 312,198,439
Contribution of net assets (deficit) for newly affiliated company (4,402,861) 3,206,780 6,605,918 5,409,837 Deficit of operating revenue over operating expenses (8,531,470) (8,531,470) Temporarily restricted contributions for national programming 70,819,827 70,819,827 Temporarily restricted contributions - other 3,074,680 3,074,680 Temporarily restricted contributions for local sponsorship 5,255,947 5,255,947 Restricted contributions for endowment 59,404 59,404 Planned giving 44,522 44,522 Change in value of split interest agreements 129,832 16,526 146,358 Investment eamings authorized for operations (1,349,328) (1,349,328) Net assets released from restrictions used for operations (104,523,255) (104,523,255) Underwater endowment transfer 11,814 (11,814) Realized gains on investments 1,177,736 1,651,508 2,829,244 Change in net unrealized losses on investments (224,068) (228,500) (452,568) Investment income 342,684 209,467 552,151 Gain on equity investments 10,223,245 10,223,245
Total (decrease) increase in net assets (1,402,920) (21,764,856) 6,726,370 (16,441,406)
Net assets at August 31, 2012 $173,415,978 $ 86,228,016 $ 36,113,039 $ 295,757,033
The accompanying notes are an integral part of these consolidated financial statements
4

WGBH Educational Foundation Consolidated Statements of Cash Flows August 31, 2012 and 2011
Cash flows from operating activities Increase (decrease) in net assets Adjustments to reconcile increase in net assets to cash used in operating activities
Unrealized appreciation on investments and beneficial interest in perpetual trust Realized gains on investments Depreciation and amortization Gain on equity investments Impairment loss on radio licenses Contributions of securities Contributions restricted for investment in facilities and endowment Accretion of interest on long-term receivables for asset sales Contribution of net assets from newly affiliated company Increase in provision for bad debts Decrease (increase) in
Accounts receivable Grants receivable Pledges receivable Prepaid expenses and other assets Receivables for asset sales
Increase (decrease) in Accounts payable and other liabilities Royalties payable Accrued expenses Accrued bond interest Deferred revenue and support
Net cash flows used in operating activities
Cash flows from investing activities Purchases of property, facilities and equipment, net Investment in joint ventures Distributions received from equity investments Purchases of marketable securities Proceeds from sales of marketable securities Proceeds from sales of contributed securities Decrease in funds held under bond agreement
Net cash flows (used) provided by investing activities
Cash flows from financing activities Contributions restricted for investment in facilities and endowment Bond principal payments
Net cash flows used in financing activities
Net decrease in cash and cash ~alents
Cash and cash equivalents Beginning of year
End of year
Supplemental cash flow information Interest paid
2012 2011
$ (16,441,406) $ 17,811,243
213,348 (3,989,567) (2,826,274) (1,796,580) 8,300,660 8,246,896
(10,223,245) (4,478,762) 1,500,000
(406,170) (894,512) (684,375) (742,552)
(11,887,075) (7,489,147) (4,741,935)
245,761 179,964
137,908 (1,449,717) 20,992,286 (32,307,346)
595,937 1,385,001 (166,744) (755,871)
9,930,979 14,722,272
(1,857,069) (1,964,394) 226,908 (562,771)
(3,667,305) 1,467,223 2,130,026 2,131,081 3,570,563 211,389
(6,557,222) (8,776,150)
(2,874,065) (2,110,079) (300,000)
8,190,000 4,531,188 (9,070,452) (5,314,974) 11,291,471 8,334,005
407,160 892,480 59,391 1,139
8,003,505 6,033,759
684,375 742,552 (3,935,125) (1,770,000)
(3,250,750) (1,027,448)
(1,804,467) (3,769,839)
20,668,369 24,438,208
$ 18,863,902 $ 20,668,369
$ 7,656,272 $ 7,734,658
The accompanying notes are an integral part of these consolidated financial statements
5

WGBH Educational Foundation Notes to Consolidated Financial Statements August31, 2012 and 2011
1. Summary of Significant Accounting Policies
Basis of Financial Statement Presentation The consolidated financial statements of WGBH Educational Foundation (the "Foundation") include the accounts of the Foundation, its wholly owned affiliated stations (WGBH-TV, WGBX-TV, WGBHRadio, WGBY-TV Springfield, WCRB-Radio, WCAI-Radio, WNAN-Radio and Public Television Playhouse), and Public Radio International (PRI). All intercompany accounts and transactions have been eliminated.
The accompanying consolidated financial statements have been prepared on the accrual basis of accounting in conformity with accounting principles generally accepted in the United States of America (GAAP). Net assets are classified as either unrestricted, temporarily restricted or permanently restricted based on the existence or absence of donor-imposed restrictions. In the accompanying consolidated financial statements, net assets that have similar characteristics have been combined into similar categories as follows:
Permanently restricted net assets include gifts of cash and other assets which are required to be permanently retained by the Foundation. Generally, the donors of these assets permit the Foundation to use all or part of the related investment income or appreciation earned on these assets for general or specific purposes. Such assets primarily include the Foundation's permanent endowment funds.
Temporarily restricted net assets include assets with restrictions on the expenditure or other use of the contributed funds and assets with restrictions imposed by donor stipulation or law, including realized and unrealized gains on temporarily and permanently restricted net assets available for appropriation, but not appropriated in the current period. Temporary restrictions may expire due to the passage of time or through actions of the Foundation pursuant to the stipulations of the donor.
Unrestricted net assets are those not subject to donor-imposed restrictions. Unrestricted net assets may be designated for specific purposes by action of the Board of Trustees.
Revenues are reported as increases in unrestricted net assets unless restrictions are imposed by donor-imposed stipulations or law. Expenses are reported as decreases in unrestricted net assets. Expirations of donor-imposed stipulations that simultaneously increase one class of net assets and decrease another are reported as net assets released from restrictions. Upon approval by the Board of Trustees, transfers are made from undesignated, unrestricted net assets to board designated unrestricted net assets.
The Foundation receives capital contributions for long-lived assets and these contributions are reported as increases in temporarily restricted net assets upon receipt. The Foundation's policy is to release the capital contributions into unrestricted net assets ratably over the estimated useful life of the long-lived asset. The Foundation released $571,000 in both 2012 and 2011, from temporarily restricted net assets to unrestricted net assets.
Use of Estimates The preparation of the accompanying consolidated financial statements in conformity with GAAP requires management to make estimates and assumptions that affect the reported amounts of assets and liabilities and disclosure of contingent assets and liabilities at the date of the consolidated financial statements and the revenues and expenses reported for the period. Actual results could differ from those estimates.
6
WGBH Educational FOlJndation Notes to Consolidated Financial Statements August 31,2012 and 2011
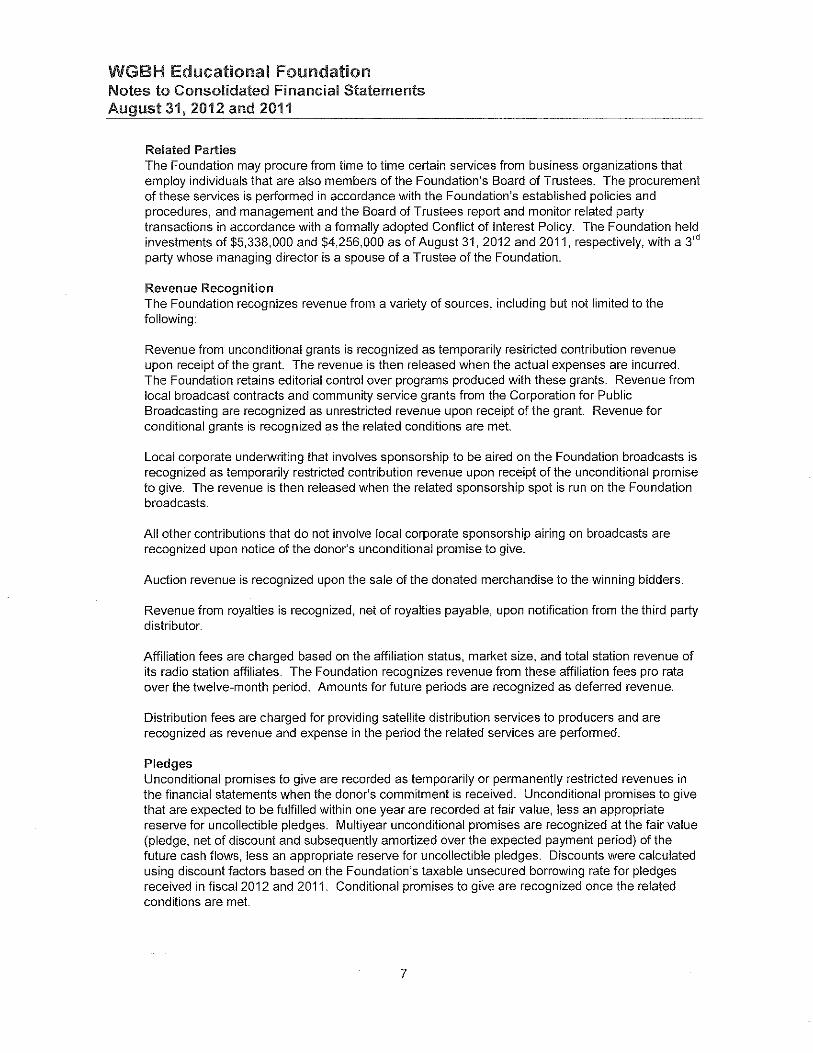
Related Parties The Foundation may procure from time to time certain services from business organizations that employ individuals that are also members of the Foundation's Board of Trustees. The procurement of these services is performed in accordance with the Foundation's established policies and procedures, and management and the Board of Trustees report and monitor related party transactions in accordance with a formally adopted Conflict of Interest Policy. The Foundation held investments of $5,338,000 and $4,256,000 as of August 31,2012 and 2011, respectively, with a 3ed
party whose managing director is a spouse of a Trustee of the Foundation.
Revenue Recognition The Foundation recognizes revenue from a variety of sources, including but not limited to the following:
Revenue from unconditional grants is recognized as temporarily restricted contribution revenue upon receipt of the grant The revenue is then released when the actual expenses are incurred. The Foundation retains editorial control over programs produced with these grants. Revenue from local broadcast contracts and community service grants from the Corporation for Public Broadcasting are recognized as unrestricted revenue upon receipt of the grant Revenue for conditional grants is recognized as the related conditions are met
Local corporate underwriting that involves sponsorship to be aired on the Foundation broadcasts is recognized as temporarily restricted contribution revenue upon receipt of the unconditional promise to give. The revenue is then released when the related sponsorship spot is run on the Foundation broadcasts.
All other contributions that do not involve local corporate sponsorship airing on broadcasts are recognized upon notice of the donor's unconditional promise to give.
Auction revenue is recognized upon the sale of the donated merchandise to the winning bidders.
Revenue from royalties is recognized, net of royalties payable, upon notification from the third party distributor.
Affiliation fees are charged based on the affiliation status, market size, and total station revenue of its radio station affiliates. The Foundation recognizes revenue from these affiliation fees pro rata over the twelve-month period. Amounts for future periods are recognized as deferred revenue.
Distribution fees are charged for providing satellite distribution services to producers and are recognized as revenue and expense in the period the related services are performed.
Pledges Unconditional promises to give are recorded as temporarily or permanently restricted revenues in the financial statements when the donor's commitment is received. Unconditional promises to give that are expected to be fulfilled within one year are recorded at fair value, less an appropriate reserve for uncollectible pledges. Multiyear unconditional promises are recognized at the fair value (pledge, net of discount and subsequently amortized over the expected payment period) of the future cash flows, less an appropriate reserve for uncollectible pledges. Discounts were calculated using discount factors based on the Foundation's taxable unsecured borrowing rate for pledges received in fiscal 2012 and 2011. Conditional promises to give are recognized once the related conditions are met.
7
WGBH Educational Foundation Notes to Consolidated Financial Statements August 31,2012 and 2011
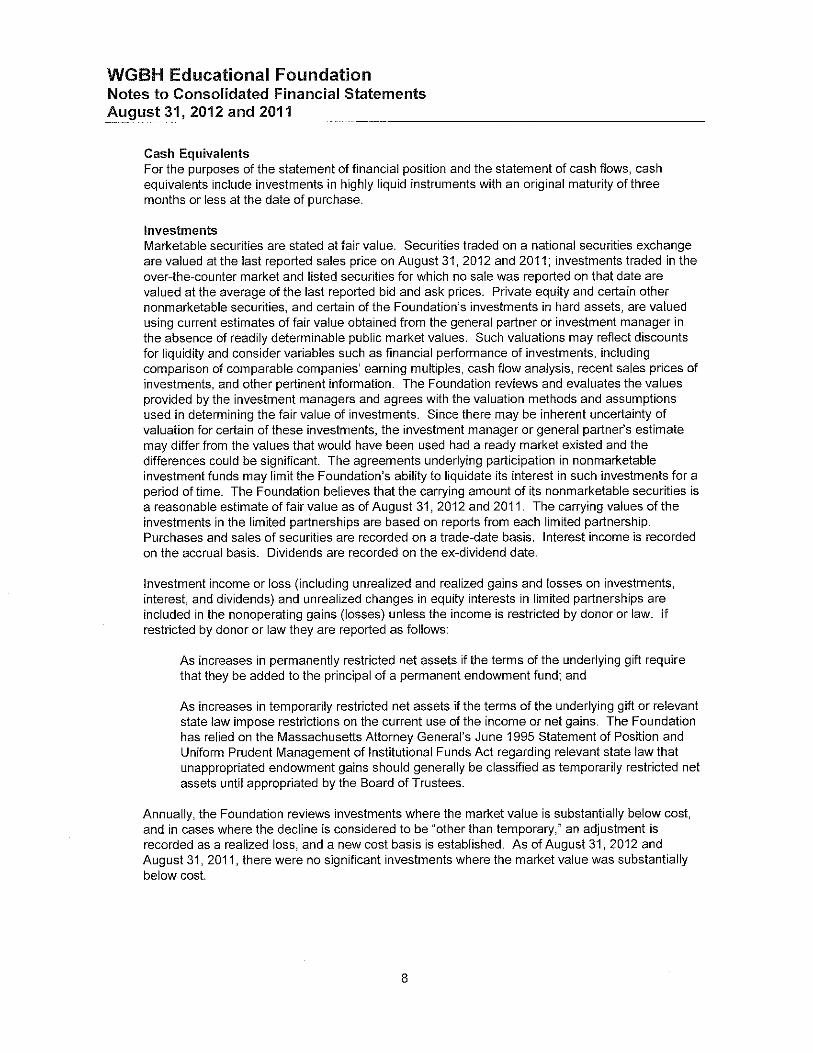
Cash Equivalents For the purposes of the statement of financial position and the statement of cash flows, cash equivalents include investments in highly liquid instruments with an original maturity of three months or less at the date of purchase.
Investments Marketable securities are stated at fair value. Securities traded on a national securities exchange are valued at the last reported sales price on August 31, 2012 and 2011; investments traded in the over-the-counter market and listed securities for which no sale was reported on that date are valued at the average of the last reported bid and ask prices. Private equity and certain other nonmarketable securities, and certain of the Foundation's investments in hard assets, are valued using current estimates of fair value obtained from the general partner or investment manager in the absence of readily determinable public market values. Such valuations may reflect discounts for liquidity and consider variables such as financial performance of investments, including comparison of comparable companies' earning multiples, cash flow analysis, recent sales prices of investments, and other pertinent information. The Foundation reviews and evaluates the values provided by the investment managers and agrees with the valuation methods and assumptions used in determining the fair value of investments. Since there may be inherent uncertainty of valuation for certain of these investments, the investment manager or general partner's estimate may differ from the values that would have been used had a ready market existed and the differences could be significant. The agreements underlying participation in nonmarketable investment funds may limit the Foundation's ability to liquidate its interest in such investments for a period of time. The Foundation believes that the carrying amount of its nonmarketable securities is a reasonable estimate of fair value as of August 31, 2012 and 2011. The carrying values of the investments in the limited partnerships are based on reports from each limited partnership. Purchases and sales of securities are recorded on a trade-date basis. Interest income is recorded on the accrual basis. Dividends are recorded on the ex-dividend date.
Investment income or loss (including unrealized and realized gains and losses on investments, interest, and dividends) and unrealized changes in equity interests in limited partnerships are included in the nonoperating gains (losses) unless the income is restricted by donor or law. if restricted by donor or law they are reported as follows:
As increases in permanently restricted net assets if the terms of the underlying gift require that they be added to the principal of a permanent endowment fund; and
As increases in temporarily restricted net assets if the terms of the underlying gift or relevant state law impose restrictions on the current use of the income or net gains. The Foundation has relied on the Massachusetts Attorney General's June 1995 Statement of Position and Uniform Prudent Management of Institutional Funds Act regarding relevant state law that unappropriated endowment gains should generally be classified as temporarily restricted net assets until appropriated by the Board of Trustees.
Annually, the Foundation reviews investments where the market value is substantially below cost, and in cases where the decline is considered to be "other than temporary," an adjustment is recorded as a realized loss, and a new cost basis is established. As of August 31,2012 and August 31, 2011, there were no significant investments where the market value was substantially below cost.
8

WGBH Educational Foundation Notes to Consolidated Financial Statements August 31, 2012 and 2011
Property, Facilities and Equipment Property, facilities and equipment are reported at cost at the date of acquisition or estimated fair value at the date of donation in the case of gifts; less accumulated depreciation. For assets placed in service, depreciation is provided using the straight-line method over the estimated useful life of the asset (or for leasehold improvements over the related lease term, whichever is shorter) which range from 3 to 40 years.
Maintenance and repairs are charged to expense as incurred; betterments are capitalized. Upon retirement or sale of property, facilities and equipment, the cost of the disposed assets and the related accumulated depreciation are removed from the accounts and any resulting gain or loss is credited or charged to unrestricted net assets.
Interest cost incurred on borrowed funds during the period of construction of capital assets is capitalized as a component of the cost of acquiring those assets.
Radio Licenses The Foundation owns various radio licenses for five separate radio frequencies which cover Cape Cod, the islands of Martha's Vineyard and Nantucket, Greater Boston and Southern New Hampshire. These radio licenses are indefinite lived assets and are subject to annual impairment testing. During 2011, the Foundation obtained a fair market valuation for its radio licenses that indicated an impairment of $1 ,500,000. The combined value for these radio frequencies was $16,868,713 for the years ended August 31, 2011 and 2012.
Equity Investments In 2008, the Foundation acquired a 20% equity share in National Public Media LLC ("NPM"), a private marketing firm, for $1,600,000. In 2009, the members of NPM issued additional shares, which diluted the Foundation's share of ownership of NPM to 18%. This investment is recorded using the equity method of accounting in both 2011 and 2012. The equity method has been applied since the investment is not publicly traded and the Foundation has significant influence over the operations of NPM. The carrying amount of this investment was $717,000 and $746,000 at August 31,2012 and 2011, respectively, with the corresponding losses induded in the gain on equity investments in the consolidated statements of operations.
In 2009, the Foundation entered into a joint venture with Public Broadcasting Service ("PBS") to form Public Media Distribution LLC (a Delaware Limited Liability Company) (the "Company"), which was effective as of January 1, 2009. The Company is conducting business under the name PBS Distribution ("PBSd"). The purpose of PBSd is to further the educational mission of public broadcasting and other media through worldwide distribution of public television content and other high quality content as provided by and on behalf of its Members. The Foundation has a 40% interest in the Company and records the investment using the equity method of accounting. The carrying amount of this investment was $4,224,000 and $2,075,000, at August 31,2012 and 2011, respectively, with the corresponding gains included in the gain on equity investments in the consolidated statements of operations.
Other Assets Other assets mainly consist of bond issuance costs. The bond issuance costs are being amortized on a straight-line basis over the term of the applicable bonds issued, which approximates the effective interest rate method. Total unamortized bond issuance costs were $6,067,000 and $6,317,000 as of August 31, 2012 and 2011, respectively.
9

WGBH Educational Foundation Notes to Consolidated Financial Statements August 31,2012 and 2011
In-Kind Contributions and Donated Services In-Kind contributions, donated services and materials which are significant to the operations of the Foundation, and whose value is clearly measurable, are recorded at the estimated fair value of the related services or material as revenue and expense, or capitalized as assets, when received. The fair value is determined based on the donor's usual and customary fees charged to paying customers for equivalent goods or services. Donated services and materials are received by the Foundation from various professional and educational organizations and relate principally to educational material, advertising/promotion and production in the support of national programming. The economic benefit and associated costs of these donated services and materials are recorded in the accompanying consolidated financial statements as revenue and expense at the estimated fair value of the services received to the extent that either the services require specialized skills and would be purchased by the Foundation if not donated, or that the services create or enhance nonfinancial assets.
Functional Allocation of Expenses The costs of providing the various programs and other activities have been summarized on a functional basis in the consolidated statements of operations. Accordingly, certain costs, such as salary, benefits, depreciation and maintenance have been allocated among the respective program and support services benefited based on total personnel costs or other systematic methods.
Split Interest Agreements Various benefactors have made contributions to the Pooled Life Income Fund in the Foundation's name. Upon donation, these amounts are recorded as contribution revenue at the estimated present value of the expected future cash flows, and are classified as unrestricted, temporarily restricted or permanently restricted according to the donor's intent These funds are divided into units and pooled and invested as a group. Donors are assigned a specific number of units based on the proportion of the fair value of their contributions to the total fair value of the pooled income fund on the date of the donor's entry to the pooled fund. Until a donor's death, the donor or donor's named beneficiary is paid the income earned on the donor's assigned units. Upon the death of the donors or their named beneficiaries, the value of these assigned units reverts to the Foundation.
The Foundation has received contributions in the form of charitable gift annuities. The donor contributes assets to the Foundation in exchange for a promise by the Foundation to pay annuity payments based on the agreements between the donor and the Foundation. Gift annuity donations are recorded as permanently restricted revenue, net of the estimated liability to the donor, at the date of gift.
The Foundation has also received contributions, mostly investment securities, of interests in irrevocable charitable remainder trusts for which the Foundation serves as the trustee. The principal amounts of such gifts are established in trusts maintained by independent fiduciaries. Upon donation, the market value of these gifts are recorded as assets. Permanently restricted contribution revenue and support is recognized after recording a liability for the estimated present value of future annuity payments. The liabilities and revenue are adjusted during the term of the agreement for changes in the value of the assets and changes to estimates of future benefits to the donors or their named beneficiaries. Upon the death of the donors or their named beneficiaries, the remaining value of the fund reverts to the Foundation.
10

WGBH Educational Foundation Notes to Consolidated Financial Statements August 31, 2012 and 2011
The Foundation also has received contributions of interests in irrevocable charitable remainder trusts for which the Foundation does not serve as the trustee. The Foundation records its beneficial interest in these assets as temporarily restricted or permanently restricted, contribution revenue, as appropriate, and pledges receivable at the estimated present value of the future distributions expected to be received over the term of the agreement Adjustments to the beneficial interest, to reflect changes in the fair value, are recognized as changes in the value of split interest agreements.
Upon the death of donors or their named beneficiaries, the assets received by the Foundation from the trust are recognized at fair value, and any difference is reported as a change in the value of split interest agreements in temporarily restricted or permanently restricted net assets, as appropriate.
Beneficial Interest in Perpetual Trust The Foundation has a beneficial interest in the Ralph Lowell Fund (the "Fund") held by the Boston Foundation ("TBF"). In accordance with GAAP the interest in the Fund is recorded on the TBF statement of financial position. The annual distribution from the Fund is recorded as other income in the consolidated statements of operations of the Foundation.
The fair value of the Fund was $903,000 and $962,000 at August 31,2012 and 2011, respectively. A grant distribution in the amount of $46,000 and $49,000 was made to the Foundation at August 31,2012 and 2011 and was recorded as income in the consolidated statements of changes in net assets.
Royalties Payable The Foundation recognizes royalty revenue pursuant to terms outlined in the rights sales agreements. Royalty agreements exist with third-parties from which the third-party receives, on average, 10%-30% of the royalty revenue recorded. These amounts are accrued for and recorded as a royalty payable when the royalty revenue is recorded by the Foundation.
Income Taxes The Foundation and its affiliates are exempt from federal income taxes under Section 501(c)(3) of the United States internal Revenue Code.
Fair Value of Financial Instruments The fair value of the Foundation's financial instruments approximates the carrying amount reported in the consolidated statements of financial position for cash and cash equivalents, receivables, bequests, investments, split-interest agreements and payables.
Health Insurance Plan The Foundation became self-insured for its employee health Insurance plan effective September 1, 2010.
Financial Statement Reclassification Certain accounts in the August 31, 2011 financial statements have been reclassified to conform to the August 31,2012 presentation.
11

WGBH Educational Foundation Notes to Consolidated Financial Statements August 31, 2012 and 2011
2. Acquisition of Public Radio International
On July 26,2012, the Foundation entered into an affiliation agreement to become the sale member of Public Radio International, a non-profit entity with headquarters in Minneapolis, Minnesota, and a national content producer, network and service provider for public radio. The acquisition was completed in order to react to the tremendous changes and opportunities occurring in public media so that the two affiliated organizations can more effectively serve the public. As part of the transaction WGBH transferred cash of $2,163,000 to PRI, earmarked for the specific purpose for PRI to pay their outstanding debt with a third party, in exchange for an inter-company note receivable for the same amount payable over the course of approximately 3.75 years at an interest rate of 5%. On November 8,2012, the Foundation signed an agreement to transfer this intercompany note to a 3cd party financial institution. The debt will be paid over 3.5 years at an interest rate of 3.75%. As part of this transaction PRI was also granted a line of credit for $1,300,000. The Foundation will serve as guarantor for both the note and the line of credi!.
The consolidated statement of operations for 2012 includes the operations of PRI since the date of acquisition. In 2012, the consolidated statement of operations includes unrestricted revenue and other support of approximately $1,667,327 related to the acquisitions and a deficit of revenues over expenses of approximately $189,242.
This transaction was accounted for as an acquisition in accordance with ASC 805-958, "Not-far-profit entities-Business Combination", which required the assets and liabilities of PRI to be accounted for at fair value, as of the date of acquisition. The fair value of the net assets at the dates of acquisition of PRI was recognized as a contribution of net assets from acquired subsidiaries as part of nonoperating gains, temporarily restricted net assets or permanently restricted net assets based on the donor restrictions, if any, on such net assets.
Current assets Investments Fixed assets Other noncurrent assets Current liabilities Contribution to affiliated company in advance of acquisition
Contribution received
$ 6,338,813 6,642,100 1,044,779
35,012 (6,515,742) (2,135,125)
$ 5,409,837
The fair value adjustments required to account for the acquisition have been recorded in consolidation and are not included in the acquired entity's financial statements.
12

WGBH Educational Foundation Notes to Consolidated Financial Statements August 31,2012 and 2011
3. Grants Receivable and Concentration of Credit Risk
The Foundation's grants receivable represent unconditional commitments from corporations, foundations and government agencies as follows (amounts below shown net of allowance for uncollectible grants and discounts):
2012 Gran! Source Short-Term Long-Term Total
Public Broadcasting Service $ 23,747,894 $ 3,198,677 $ 26,946,571 Individual donors 2,251,500 5,400,000 7,651,500 Corporations and Co-Productions 11,005,924 1,675,375 12,681,299 Corporation for Public Broadcasting 5,218,124 450,000 5,668,124 U.S. Government Agencies 5,537,663 1,224,299 6,761,962 Others (Subcontracts, Non-Profits, StateC&U, Foundations, and PTE) 6,793,711 1,167,178 7,960,889
Total grants $ 54,554,816 $ 13,115,529 $ 67,670,345
2011 Gran! Source Short-Term Long-Term Total
Public Broadcasting Service $ 32,761,739 $ 8,313,248 $ 41,074,987 Individual donors 2,555,500 7,450,000 10,005,500 Corporations and Co-Productions 8,405,935 965,225 9,371,160 Corporation for Public Broadcasting 7,908,199 1,293,400 9,201,599 U.S. Government Agencies 6,833,819 1,470,309 8,304,128 Others (Subcontracts, Non-Profits, StateC&U, Foundations, PRI and PTE) 9,780,288 (1,017,959) 8,762,329
Total grants $ 68,245,480 $ 18,474,223 $ 86,719,703
The Foundation's long-term grant receivables are discounted using the Foundation's taxable unsecured borrowing rate. The total discount was $719,000 and $1,066,000 at August 31, 2012 and 2011, respectively. The discount rates were 2.73% and 2.72% at August 31, 2012 and 2011, respectively.
4. Long-Term Receivables
On December 31, 2001, the Foundation entered into an agreement to sell all assets, properties, rights and interests of every kind connected to "This Old House" for $132,090,000. At that time the Foundation recorded a noninterest-bearing note receivable of $120,614,000. The receivable is carried at its present value of $29,750,000 and $27,533,000 in the consolidated statements of financial position at August 31, 2012 and 2011, respectively. The note matures in January 2018.
On March 21,2002, the Foundation sold certain real estate for $282,316,000. The Foundation recorded a non interest-bearing note receivable of $282,316,000 at March 21, 2002, which is carried at its net present value of $102,712,000 and $102,972,000 in the consolidated statements of financial position at August 31,2012 and 2011, respectively. Under the contract terms, the Foundation received the first payment in December 2004 and is being paid in semiannual installments with a maturity date of December 2041. The gains and proceeds from the sale leaseback transaction of $4,062,000 have been designated by the Board to fund the debt service of the Series 2002A, 2008A and 2008B bonds.
13

WGBH Educational Foundation Notes to Consolidated Financial Statements August 31, 2012 and 2011
The Foundation assesses the collectability of the long-term receivables by considering factors such as the economic risk associated with the receivables and the financial condition and economic environment of the organization from which the receivables are due. There is no allowance for doubtful accounts associated with these receivables.
5. Pledges Receivable
Pledges receivable at August 31, 2012 and 2011:
2012 2011
In less than one year $ 2,511,928 $ 2,434,538 Allowance for unfilled pledges (39,471 ) (45,837)
Pledges receivables, net 2,472,457 2,388,701
Between one year and five years 2,376,374 2,810,557 Less: Present value discount (75,967) (99,586)
Long-term pledges receivable, net $ 2,300,407 $ 2,710,971
The Foundation had $33,000 and $50,000 in conditional pledges at August 31, 2012 and 2011, respectively.
14

WGBH Educational Foundation Notes to Consolidated Financial Statements August 31, 2012 and 2011
6, Investments
Investments held by the Foundation are comprised of the following at August 31, 2012 and 2011:
2012 2011 Cost Markel Value Cost Market Value
Investments Money market funds $ 52,357 $ 52,357 $ 20,947 $ 20,947 Domestic equities 943,464 1,229,596 877,212 1,009,731 Foreign equities 168,855 205,744 188,285 199,273 Domestic bonds 7,148 7,028 7,149 7,003 Investments in funds externally managed
Domestic equities 3,260,368 4,111,553 2,996,650 3,507,577 Foreign equities 5,413,625 7,693,924 5,362,282 7,909,738 Domestic bonds 2,499,269 3,164,558 2,462,199 3,004,493 Foreign bonds 1,126,731 1,121,307 695,578 1,126,201 Real assets 8,703,159 8,811,967 7,996,879 8,856,386
Hedge funds 27,408,405 32,695,274 22,183,095 27,388,154 Private equity 1,639,302 2,012,605 1,497,982 1,861,724
Total investments 51,222,683 61,105,913 44,288,258 54,891,227
Assets in pooled income fund (PIF) and charitable gift annuities (CGA) Money market funds 215,239 207,330 191,128 170,817 Domestic equities 1,036,996 865,242 1,009,599 797,634 Foreign equities 209,030 174,409 253,289 200,111 Domestic bonds 200,224 167,062 206,896 163,456 Investments in funds externally managed
Domestic equities 4,744,654 5,212,171 3,309,692 3,401,253 Foreign equities 1,719,607 1,588,746 1,149,964 991,727 Domestic bonds 1,067,126 1,068,687 2,840,572 2,921,193 Hedge funds 68,266 56,959 Real assets 115,284 96,190 103,347 81,650
Total assets in PIF and CGA 9,376,426 9,436,796 9,064,487 8,727,841
Total investments and assets in PI F and CGA $ 60,599,109 $ 70,542,709 $ 53,352,745 $63,619,068
For the years ended August 31,2012 and 2011, the Foundation recorded net realized gains of $2,829,000 and $1,797,000, and dividend and interest income from investments of $552,000 and $569,000, respectively,
The Foundation recognized changes in net unrealized (Iosses)/gains of ($453,000) and $3,721,000, respectively, for the years ended August 31,2012 and 2011, respectively, on the above investments.
The Foundation had outstanding purchase commitments for investments in partnerships amounting to approximately $661,000 and $920,000, as of August 31,2012 and 2011, respectively.
15

WGBH Educational Foundation Notes to Consolidated Financial Statements August 31, 2012 and 2011
7.
The Foundation's endowment and similar funds are invested to maintain the real value of the principal to be capable of supporting annual spending needs and are guided by the asset allocation policies established by the investment committee of the Board of Trustees and implemented primarily through external investment managers. Investments are managed to balance the short-term need for an annualized return in excess of 4.5% in order to support current operations as well as the long-term need to maintain the endowment's purchasing power. To satisfy the long-term objectives of a diversified, volatility-managed portfolio, the Foundation targets an asset allocation of fixed income, global and domestic equities, marketable and nonmarketable alternative and real assets. The portfolio is expected to produce returns that meet or exceed long-term benchmarks.
The balances of the Pooled Life Income Funds, Gift Annuity Funds and Charitable Remainder Trusts for which the Foundation is the trustee are recorded as investments and the liabilities for future payments are recorded as accrued expenses or long-term deferred revenue and other liabilities. Split interest agreements held by third parties are valued at the present value of the future payments due to beneficiaries. These liabilities were calculated using discount factors based on the Foundation's taxable unsecured borrowing rate. A summary of the investments and liabilities for future payments are as follows:
2012 2011
Pooled Life Income Funds Market value $ 1,326,586 $ 1,274,361 Liability for future payments 208,038 215,599
Gift Annuity Funds Market value $ 5,666,164 $ 5,139,267 Liability for future payments 3,679,600 3,579,567
Charitable Remainder Trust, where Foundation is Trustee Market value $ 2,444,046 $ 2,314,214 Liability for future payments 1,513,724 1,518,281
Fair Value of Investment Assets and Liabilities
The Foundation values its investments at fair value in accordance with the Fair Value Measurements Standard. Under this Standard, fair value is defined as the price that would be received to sell an asset or be paid to transfer a liability (i.e., the "exit price") in an orderly transaction between market participants at the measurement date. The standard principally affects investments (unrestricted and restricted); however, other applicable fair value measurements include discounting multiyear pledges on the initial date of recognition, assets, and applicable liabilities of pooled income fund and charitable gift annuities.
Additionally, the standard establishes a fair value hierarchy that prioritizes the inputs to valuation techniques used to measure fair value. The hierarchy gives the highest priority to unadjusted quoted prices in active markets for identical assets or liabilities (Level 1 measurements) and the lowest priority to unobservable inputs (Level 3 measurements).
16

WGBH Educational Foundation Notes to Consolidated Financial Statements August 31, 2012 and 2011
Inputs are used in applying the various valuation techniques and broadly refer to the assumptions that market participants use to make valuation decisions, including assumptions about risk. Inputs may include price information, volatility statistics, specific and broad credit data, liquidity statistics, and other factors. A financial instrument's level within the fair value hierarchy is based on the lowest level of any input that is significant to the fair value measurement; however, the determination of what constitutes "observable" requires significant judgment by the Foundation. The Foundation considers observable data to be that market data which is readily available; regularly distributed or updated, reliable and verifiable, not proprietary, and provided by independent sources that are actively involved in the relevant market. The categorization of a financial instrument within the hierarchy is based upon the pricing transparency of the instrument and does not necessarily correspond to the Foundation's perceived risk of that instrument.
The availability of observable inputs can vary from product to product and is affected by a wide variety of factors, including for example, the type of product, whether the product is new and not yet established in the marketplace, the liquidity of markets and other characteristics particular to the transaction. To the extent that valuation is based on models or inputs that are less observable or unobservable in the market, the determination of fair value requires more judgment. Accordingly, the degree of judgment exercised by the Foundation in determining fair value is greatest for instruments categorized in Level 3.
In certain cases, the inputs used to measure fair value may fall into different levels of the fair value hierarchy. In such cases, for disclosure purposes the level in the fair value hierarchy within which the fair value measurement falls in its entirety is determined based on the lowest level input that is significant to the fair value measurement in its entirety.
A description of the Foundation's valuation methodologies for assets and liabilities measured at fair value is as follows:
Fair value for Level 1 is based upon quoted prices in active markets that the Foundation has the ability to access for identical assets and liabilities. Market price data is generally obtained from exchange or dealer markets. The Foundation does not adjust the quoted price for such assets and liabilities.
Fair value for Level 2 is based on quoted prices for similar instruments in active markets, quoted prices for identical or similar instruments in markets that are not active, and modelbased valuation techniques for which all significant assumptions are observable in the market or can be corroborated by observable market data for substantially the full term of the assets. Inputs are obtained from various sources including market participants, dealers, and brokers.
Fair value for Level 3 is typically based on unobservable inputs that are supported by little or no market activity and rely on assumptions and estimates about pricing derived from available information. Investments included in Level 3 primarily consist of the Foundation's ownership in alternative investments (principally limited partnership interests in hedge, private equity, real estate, and other similar funds), that are fair valued based on a partners capital account and do not strike a net asset value (NAV). Investments that are not redeemable at NAV in the near-term (greater than 90 days) are also classified as Level 3.
17

WGBH Educational Foundation Notes to Consolidated Financial Statements August 31, 2012 and 2011
The fair values (NAV) of the securities held by limited partnerships that do not have readily determinable fair values are determined by the general partner and are based on appraisals, or other estimates that require varying degrees of judgment. If no public market exists for the investment securities, the fair value is determined by the general partner taking into consideration, among other things, the cost of the securities, prices of recent placements of securities of the same issuer, and subsequent developments concerning the companies to which the securities relate. The Foundation has performed significant due diligence around these investments to ensure NAV is an appropriate measure of fair value as of August 31, 2012 and 2011.
The methods described above may produce a fair value calculation that may not be indicative of net realizable value or reflective of future fair values. Furthermore, while the Foundation believes its valuation methods are appropriate and consistent with other market participants, the use of different methodologies or assumptions to determine the fair value of certain financial instruments could result in a different estimate of fair value at the reporting date.
In determining an instrument's placement within the hierarchy, the Foundation separates the investment portfolio into the type of asset held and then any investments in funds by the type of underlying asset held by the fund.
18

WGBH Educational Foum.latioi1 Notes to Consolidated Financial Statements August 31,2012 and 2011
The following table presents the financial instruments carried on the statement of financial position as of August 31,2012:
Assets and Liabilities at Fair Value as of August 31, 2012 level 1 Level 2 Level 3
Other Significant Significant Unobservable Observable Inputs and/or
Quoted Prices Inputs Restrictions Total
Investments Money market funds $ 52,357 $ $ $ 52,357 Domestic equities 1,229,596 1,229,596 Foreign equities 205,744 205,744 Domestic bonds 7,028 7,028 Investments in funds externally managed
Domestic equities 1,266,946 2,844,607 4,111,553 Foreign equities 2,348,155 5,345,770 7,693,925 Domestic bonds 1,073,081 2,091,477 3,164,558 Foreign bonds 1,121,307 1,121,307 Real assets 3,473,075 1,297,586 4,041,306 8,811,967
Hedge funds 1,623,619 31,071,654 32,695,273 Private equity 2,012,605 2,012,605
Total investments 9,648,954 9,388,282 42,068,677 61,105,913
Assets in pooled income fund (PIF) and charitable gift annuities (CGA)
Money market funds 207,330 207,330 Domestic equities 865,242 865,242 Foreign equities 174,409 174,409 Domestic bonds 167,062 167,062 Investments in funds externa!!y managed
Domestic equities 5,212,171 5,212,171 Foreign equities 1,588,746 1,588,746 Domestic bonds 1,068,687 1,068,687 Hedge funds 56,959 56,959 Real assets 96,190 96,190
Total assets in PIF and eGA 9,116,585 320,211 9,436,796
Total investments and assets in PIF and eGA $ 18,765,539 $ 9,708,493 $ 42,068,677 $ 70,542,709
Beneficial interest in perpetual trust,.
Interest in investments held by trustee $ 1,269,845 $ $ $ 1,269,845
Total beneficial interest in perpetual trust $ 1,269,845 $ $ $ 1,269,845
Liability for the future payments for the Pooled Life Income Fund, Gift Annuity Funds, and Charitable Remainder Trusts
Liability for the future payments $ $ $ 5,401,362 $ 5,401,362
Total liability for future payments $ $ $ 5,401,362 $ 5,401,362
* The beneficial interest perpetual trust balance in included in other assets in the consolidated statement of financial position
19

WGBH Educational Foundation Notes to Consolidated Financial Statements August 31,2012 and 2011
The following table presents the financial instruments carried on the statement of financial position as of August 31, 2011:
Assets and Liabilities at Fair Value as of August 31, 2011 Level 1 Level 2 Level 3
Other Significant Significant Unobservable Observable Inputs and/or
Quoted Prices Inputs Restrictions Total
Investments Money market funds $ 20,947 $ $ $ 20,947 Domestic equities 1,009,731 1,009,731 Foreign equities 199,273 199,273 Domestic bonds 7,003 7,003 Investments in funds externally managed
Domestic equities 1,203,895 2,303,682 3,507,577
Foreign equities 2,274,839 5,634,899 7,909,738 Domestic bonds 987,935 2,016,558 3,004,493 Foreign bonds 1,126,201 1,126,201 Real assets 4,995,309 3,861,077 8,856,386
Hedge funds 1,266,646 26,121,508 27,388,154 Private equity 1,861,724 1,861,724
Total investments 6,822,821 11,903,857 36,164,549 54,891,227
Assets in pooled income fund (PIF) and charitable gift annuities (eGA)
Money market funds 170,817 170,817
Domestic equities 797,634 797,634 Foreign equities 200,111 200,111
Domestic bonds 163,456 163,456 Investments in funds externally managed
Domestic equities 3,401,253 3,401,253 Foreign equities 991,727 991,727
Domestic bonds 2,921,193 2,921,193 Real assets 81,650 81,650
Total assets in PIF and CGA 8,482,735 245,106 8,727,841
Total investments and assets in PIF and CGA $ 15,305,556 $ 12,148,963 $ 36,164,549 $ 63,619,068
Beneficial interest in perpetual trust * Interest in investments held by trustee $ 1,160,469 $ $ $ 1,160,469
Total beneficial interest in perpetual trust $ 1,160,469 $ $ $ 1,160,469
Liability for the future payments for the Pooled Life Income Fund, Gift Annuity Funds, and Charitable Remainder Trusts
Liability for the future payments $ $ $ 5,313,447 $ 5,313,447
Total liability for future payments $ $ $ 5,313,447 $ 5,313,447
* The beneficial interest perpetual trust balance in included in other assets in the consolidated statement of financial position
20

WGBH Educational Foundation Notes to Consolidated Financial Statements August 31, 2012 and 2011
The following table includes a roll-forward of the amounts for the year ended August 31, 2012 and 2011 for financial instruments classified within Level 3:
Fair value at September 1, 2011
Realized gains Unrealized gains (losses) Investment income Net purchases and sales Advisory fees Contribution from PRJ
Fair value at August 31,2012
Domestic Equities
Investments in Funds Externally Managed Domestic Real Hedge
Bonds Assets Funds
$ 2,303,682 $ 2,016,558 $ 3,861,077
3,416
$ 26,121,508
1,328,923 (79,614)
974 (1,572,119)
(199,779) 5,471,761
535,855 74,919 49,466
(44,396)
180,184 1,345
(3,256) (1,460)
$
Private Equity
1,861,724
136,873 19,385 7,501
11,327 (24,205)
$ 2,844,607 $ 2,091,477 $ 4,041,306 $ 31,071,654 $ 2,012,605
Domestic Equities
Investments in Funds Externally Managed Domestic Real Hedge
Bonds Assets Funds Private Equity
Fair value at September 1, 2010 $ 1,929,807 $ 1,936,438 $ 3,755,415 $ 26,412,060 $ 1,533,303
Realized gains (losses) Unrealized gains (losses) Investment income Net purchases and sales Advisory fees Transfer of assets between levels
Fair value at August 31, 2011
378,544 23,272
(27,941)
80,120 106,249
(9,681) 1,552 9,353
(1,811)
1,222,539 814,407
18,259 (2,004,193)
(341,564)
131,661 206,587
7,846 15,239
(32,912)
$ 2,303,682 $ 2,016,558 $ 3,861,077 $ 26,121,508 $ 1,861,724
The Foundation uses prices and inputs that are current as of the measurement date, including during periods of market dislocation. In periods of market dislocation, such as those experienced currently, the observability of prices and inputs, including those obtained from external pricing sources, may be reduced for many instruments,
The Foundation has adopted a policy that defines near-term liquidity as those investments allowing liquidity within 90 days of the measurement date. Included in Level 2 are those assets valued at NAV, which are redeemable in the near-term. This policy is consistent with other non-for-profit organizations with large endowments. There were no transfer between Level 1 and Level 2 for the years ended August 31,2012 and 2011.
Liability for future payments for the pooled life income fund, gift annuity funds, and charitable remainder trusts are classified as Level 3. The following table includes a rollforward of the amounts for the year ended August 31,2012 and 2011:
Fair value at September 1
Expense for future payments
Fair value at August 31
21
2012
$ 5,313,447
87,915
$ 5,401,362
2011
$ 5,419,339
105,892
$ 5,313,447

WGBH Educational Foundation Notes to Consolidated Financial Statements August 31,2012 and 2011
The following table includes a summary of fair values, redemption features and future commitments related to investments (excluding split interest agreements) for which estimated fair value was based upon NAV, capital account or other valuation procedures for the year ended August 31,2012:
Redemption Unfunded Redemption Notice
Fair Value Commitments Frequency Periods
Investments in funds externally managed Domestic equities $ 4,111,553 $ Quarterly, annually 60 days Foreign equities 7,693,925 Daily, monthly 1-30 days Domestic bonds 3,164,558 Daily, annually 1-90 days Foreign bonds 1,121,307 Monthly 1 day Real assets 8,811,967 48,000 Monthly, quarterly, 1-60 days, at
annually, at maturity maturity Hedge funds 32,695,273 Monthly, quarterly, 30-180 days
annually Private equity 2,012,605 613,000 At maturity n/a
$ 59,611,188 $ 661,000
The Foundation has made commitments amounting to $661,000 and expects these funds to be called from September 2012 through December 2015.
8. Property, Facilities and Equipment
Property, facilities and equipment consists of the following at August 31,2012 and 2011:
Land and improvements Buildings and improvements Broadcast, video and film equipment Office equipment, furniture and fixtures Computers and peripherals Fixed assets not yet placed into service Capitalized interest
Less: Accumulated depreciation
Property, facilities and equipment, net
Useful Life
3-40 years 1-20 years 3-25 years 2-10 years
25-39 years
2012
$ 6,716,080 165,871,400 25,444,630 5,597,608
15,033,048 2,084,589
19,714,140
240,461,495
(64,309,327)
$176,152,168
2011
$ 6,716,080 164,982,571 24,941,632 5,354,820
13,400,571 1,456,747
19,714,140
236,566,561
(56,202,684)
$180,363,877
During 2012, the Foundation disposed of $24,000 of fixed assets at cost, with no net book value. The disposal of the asset during 2012 resulted in no gain or loss. The Foundation did not have any asset disposals in 2011.
Depreciation expense related to property, facilities and equipment was $8,131,000 and $8,077,000 for the years ended August 31, 2012 and 2011, respectively,
22

WGBH Educational Foundation Notes to Consolidated Financial Statements August 31,2012 and 2011
9. Long-Term Debt
Long-term debt consists of the following at August 31,2012 and 2011:
MIFA Series 1998A revenue bonds, 3.7%-4.9%, due 1998-2013 MDFA Series 2002A revenue bonds, 4.0%-5.8%, due 2006-2042 MDFA Series 2008A revenue bonds, 3.0%-5.0%, due 2008-2042 MDFA Series 20088 revenue bonds, Zero Coupon, due 2024-2042
Discounts and premiums, net
Less: Current maturities
Long-term debt, net
Original Issuance
$ 25,000,000 111,890,000 107,495,000 22,566,620
2012 2011
$ 735,000 $ 1,435,000 48,730,000 49,830,000
102,920,000 102,920,000 22,566,620 22,566,620
174,951,620 176,751,620
2,370,710 2,451,062
177,322,330 179,202,682
(1,835,000) (1,800,000)
$ 175,487,330 $177,402,682
Discounts and premiums include MDFA Series 2002A premium of $2,483,000 and $2,567,000 for the years ended August 31, 2012 and 2011, respectively, and MDFA Series 2008A discount of $113,000 and $116,000 for the years ended August 31, 2012 and 2011, respectively. The net amortization expense for the discounts and premiums was $80,000 and $80,000 for the years ended August 31,2012 and 2011, respectively. The effective interest rate for the MDFA Series 2008B was 5.6%.
The scheduled principal payments are shown in the table below:
Principal Payments Schedule
Fiscal Year 2013 2014 2015 2016 2017 Thereafter
Total principal payments
$ 1,835,000 1,200,000 1,470,000 1,085,000 1,250,000
168,111,620
$174,951,620
With the exception of the zero coupon bonds, bond interest is payable semiannually. Total bond interest expense was $9,956,000 and $10,036,000 for the years ended August 31, 2012 and 2011, respectively.
One insurance company insures the 1998 Bonds and 2002 Bonds and a different insurance company insures the 2008 Bonds. The two insurers have recourse to the Foundation if the Foundation defaults and an insurer must pay. The Foundation's obligations to the insurers in connection with the 2002 Bonds and the 2008 Bonds are collateralized by an assignment of the payment stream under the noninterest bearing note receivable issued in connection with the sale of certain real estate, and a mortgage on the headquarters of the Foundation located in Brighton, MA.
The fair value. of the Foundation's debt, based on quoted market prices, was $166,858,000 and $168,716,000 at August 31,2012 and 2011, respectively.
23

WGBH Educational Foundation Notes to Consolidated Financial Statements August 31,2012 and 2011
Line of Credit On May 15, 2010, the Foundation increased a discretionary line of credit to $25,000,000 from $15,000,000. Borrowings under the agreement are made at the Foundation's option, as either a LlBOR Rate Loan or as a Prime Rate Loan. If made as a LlBOR Rate Loan, interest on the outstanding principal will accrue at a rate equal to the sum of the LlBOR Advantage Rate plus 2.5%. If made as a Prime Rate Loan, the outstanding principal will accrue interest at a per annum rate equal to the prime rate minus 1.00%. There were no amounts outstanding on the line of credit at August 31, 2012 and 2011, respectively.
10. Retirement Plan
The Foundation has multiple defined contribution plans (the "Plans") for eligible employees through the Teachers Insurance and Annuity Association ("TIM") and College Retirement Equity Fund ("CREF"), Fidelity Investments, and Lincoln Financial retirement programs. The Plans are designed in accordance with the provisions of Section 403(b) of the Internal Revenue Code. Contributions are made by the provisions of Section 403(b) of the Internal Revenue Code. The Foundation's expense under the Plans totaled $1,539,000 and $1,809,000 for fiscal years 2012 and 2011, respectively. At August 31, 2012 and 2011 the Foundation had a liability of $192,000 and $78,000, respectively for benefits paid under the Plans. These amounts are included within accrued expenses on the consolidated statement of financial position.
The Foundation matched 80% of qualified employee salary deferrals for the largest plan for the years ended August 31, 2012 and 2011. Effective March 15, 2011, the Foundation changed the matching rate for one of its plans from 200% to 100% of qualified employee salary deferrals.
11. Components of Net Assets
Net assets of the Foundation consist of the following designations at August 31, 2012 and 2011:
Temporarily Permanently 2012 Unrestricted Restricted Restricted Total
Detail of net assets Undesignated $ 9,004,472 $ 3,362,248 $ $ 12,366,720 Board-designated debt service 97,993,076 97,993,076 Board-designated programming 38,904,586 38,904,586 Grants for future programming 46,932,465 46,932,465 Capital campaign and other 27,734,662 27,734,662 Endowment 27,513,844 8,198,641 36,113,039 71,825,524
$ 173,415,978 $ 86,228,016 $ 36,113,039 $ 295,757,033
24

WGBH Educational Foundation Notes to Consolidated Financial Statements August 31,2012 and 2011
2011 Unrestricted
Delail of net assets Undesignated $ 10,685,210 $ Board-designated debt service 101,634,508 Board-designated programming 34,433,241 Grants for future programming Capital campaign and other Endowment 28,065,939
Temporarily Restricted
74,478,618 27,167,236 6,347,018
$174,818,898 $ 107,992,872
Permanently Restricted Total
$ $ 10,685,210 101,634,508 34,433,241 74,478,618 27,167,236
29,386,669 63,799,626
$ 29,386,669 $ 312,198,439
Permanently restricted net assets of $36,113,039 and $29,386,669 at August 31, 2012 and 2011, respectively, are composed of the investments of contributed principal that has been restricted by the donor in perpetuity and the beneficial interest that the Foundation has in certain third-party perpetual trusts. Unless there are specific donor stipulations or Board of Trustees designations, the related investment income is used to support programs and operating expenses.
The Foundation's endowment is subject to an enacted version of the Uniform Prudent Management of Institutional Funds Act of 2006 (UPMIFA), and as such, generally accepted accounting principles requires disclosures about the Foundation's endowment funds including both donor-restricted and board-designated endowment funds. Board-designated funds are not subject to UPMIFA.
The Foundation's endowment consists of individual funds established for a variety of purposes and includes both donor-restricted endowment funds and funds designated by the Board of Trustees to function as endowments. Net assets associated with endowment funds are classified and reported based on the existence or absence of donor-imposed restrictions. Net assets associated with endowment funds designated by the Board of Trustees may be expended by a vote of the Board of Trustees and are recorded as unrestricted net assets.
The policy governing the investment of the Foundation's endowment is twofold: to provide a reasonable and prudent level of currently expendable income in accordance with the spending policy set by the Investment Committee from time to time (currently 4.5% of the endowment's moving average fair value over the prior 36 months as of May 31 of the preceding fiscal year in which distribution is planned); and to support the Foundation and its mission over the long term by ensuring that the future growth of the endowment is sufficient to offset normal inflation plus reasonable spending, thereby preserving the constant doliar value and purchasing power of the endowment for the benefit of future programs and services. Under this policy, as approved by the Board of Trustees, the endowment assets are invested in a manner that is intended to produce a real return, net of inflation and investment management costs, of at least 5% over the long term. Actual returns in any given year may vary from this amount.
To satisfy its long-term rate-of-return objectives, the Foundation relies on a total return strategy in which investment returns are achieved through both capital appreciation (realized and unrealized) and current yield (interest and dividends). The Foundation targets a diversified asset allocation that places a greater emphasis on equity-based and alternative investments to achieve its long-term objective within prudent ris~ constraints.
25

WGBH Educational Foundation Notes to Consolidated Financial Statements August 31,2012 and 2011
At August 31, 2012, the endowment net asset composition by type of fund consisted ofthe following:
Temporarily Permanently Unrestricted Restricted Restricted Total
Donor-restricted funds $ (8,892) $ 8,198,641 $ 36,113,039 $ 44,302,788 Board-designated funds 27,522,736 27,522,736
Total endowments $ 27,513,844 $ 8,198,641 $ 36,113,039 $ 71,825,524
Changes in endowment net assets for the twelve months ended August 31,2012, consisted of the following:
Temporarily Permanently Unrestricted Restricted Restricted Total
Endowment net assets at September 1, 2011 $ 28,065,939 $ 6,347,018 $ 29,386,669 $ 63,799,626
Investment return Investment income 149,000 209,467 358,467 Net appreciation (depreciation) (realized and unrealized) (603,556) 3,003,298 16,526 2,416,268
Total investment gain (454,556) 3,212,765 16,526 2,774,735
Contributions 1,413,177 103,926 1,517,103
Contributions of endowment from newly affiliated company 6,605,918 6,605,918 Appropriation of endowment assets for expenditures (1,522,530) (1,349,328) (2,871,858) other changes
Underwater endowment transfer 11,814 (11,814)
Endowment net assets at August 31,2012 $ 27,513,844 $ 8,198,641 $ 36,113,039 $ 71,825,524
At August 31, 2011, the endowment net asset composition by type of fund consisted of the following:
Temporarily Permanently Unrestricted Restricted Restricted Total
Donor-restricted funds $ (20,706) $ 6,347,018 $ 29,386,669 $ 35,712,981 Board-designated funds 28,086,645 28,086,645
Total endowments $ 28,065,939 $ 6,347,018 $ 29,386,669 $ 63,799,626
26

WGBH Educational Foundation Notes to Consolidated Financial Statements August 31,2012 and 2011
12.
Changes in endowment net assets for the twelve months ended August 31, 2011, consisted of the following:
Temporarily Pennanently Unrestricted Restricted Restricted Total
Endowment net assets, September 1, 2010 $ 25,084,803 $ 5,724,810 $ 28,877,589 $ 59,687,202
Investment return Investment income 288,353 133,937 422,290 Net appreciation (realized and unrealized) 3,735,038 1,943,715 (179,778) 5,498,975
Total investment gain 4,023,391 2,077,652 (179,778) 5,921,265
Contributions 516,766 688,858 1,205,624 Appropriation of endowment assets for expenditures (1,679,772) (1,334,693) (3,014,465) Other changes
UndelWater endowment transfer 120,751 (120,751)
Endowment net assets, August 31,2011 $ 28,065,939 $ 6,347,018 $ 29,386,669 $ 63,799,626
Commitments and Contingencies
The Foundation is obligated to make rental payments for other operating facilities and equipment under various noncancelable operating lease agreements expiring from 2013 to 2040, as follows:
Fiscal Year 2013 $ 1,334,000 2014 1,338,000 2015 1,407,000 2016 1,417,000 2017 1,397,000 Thereafter 17,679,000
$ 24,572,000
Rent expense amounted to $1,683,000 and $1,686,000 for the years ended August 31,2012 and 2011, respectively. Of these amounts, $1,107,000 and $1,136,000 related to noncancelable operating leases for the years ended August 31, 2012 and 2011, respectively.
Under operating lease agreements, the Foundation rents certain office space to third parties. The total of future minimum rentals to be received by the Foundation under the noncancelable leases are as follows:
Fiscal Year 2013 $ 722,162 2014 184,201 2015 99,050 Thereafter 90,321
$ 1,095,734
Rental income for building leases amounted to $938,000 and $1,328,000 for the years ended August 31,2012 and 2011, respectively.
27

WGBH Educational Foundation Notes to Consolidated Financial Statements August 31, 2012 and 2011
The Foundation receives funding or reimbursement from government agencies for various business activities, which are subject to audit. In addition, the Foundation is engaged in various legal cases, which have arisen in the normal course of its operations. The Foundation believes that the outcomes of these matters will not have a material adverse effect on the financial position of the Foundation.
13. Subsequent Events
The Foundation has evaluated subsequent events through January 30, 2013, the date the consolidated financial statements were available for issuance. There were no other subsequent events other than those previously described in footnote 2.
28
Supplemental Consolidating Information as of and for Year Ended August 31,2012
29

WGBH Educational Foundation Consolidating Balance Sheet Information August 31,2012
WGBH-WGBH PRI Elimination Consolidated
Assets Cash and cash equivalents $ 18,433,433 $ 430,469 $ $ 18,863,902 Accounts receivable (less allowance for uncollectible accounts of $406,000 and $468,000 for 2012 and 2011, respectively) 12,128,561 1,735,738 (2,163,404) 11,700,895
Current portion of receivables for asset sales 5,643,969 5,643,969 Grants receivable (less allowance for uncollectible grants of $28,000 and $97,000 for 2012 and 2011, respectively) 56,419,765 1,709,037 (3,573,986) 54,554,816 Pledges receivable, net 2,289,600 182,857 2,472,457 Prepaid expenses and other assets 1,613,096 235,670 1,848,766
Total current assets 96,528,424 4,293,771 (5,737,390) 95,084,805
long-term pledges receivable, net 2,271,027 29,380 2,300,407 Long-term grants receivable, net 13,115,529 13,115,529 Long~term receivables for asset sales 126,817,573 126,817,573 Radio Licenses 16,868,713 16,868,713 Other assets 8,052,439 8,052,439 Equity Investments 4,941,787 4,941,787 Funds held under bond agreements - restricted 1,225,609 1,225,609 Invesbnents, at market value 63,804,002 6,738,707 70,542,709 Property, facilities and equipment, net 175,123,487 1,028,681 176,152,168
Total assets $ 508,748,590 $ 12,090,539 $ (5,737,390) $ 515,101,739
Liabilities
Current maturities debt $ 1,835,000 $ $ $ 1,835,000 Accounts payable and other liabilities 3,778,614 1,604,038 (356,846) 5,025,806 Accrued expenses 8,698,222 618,957 9,317,179 Royalties payable 2,643,422 2,643,422 Accrued bond interest expense 5,299,528 5,299,528 Deferred revenue 2,825,888 2,527,523 5,353,411
Total current liabilities 25,080,674 4,750,518 (356,846) 29,474,346
Long-term deferred revenue and other liabilities 9,190,900 661,085 (659,315) 9,192,670 Long-term debt, net of unamortized discount and premium 175,487,330 2,163,404 (2,163,404) 175,487,330 Accrued bond interest expense 5,190,360 5,190,360
Total liabilities 214,949,264 7,575,007 (3,179,565) 219,344,706
Net Assets
Unrestricted 177,999,868 (5,251,417) 667,527 173,415,978 Temporarily restricted 86,292,337 3,161,031 (3,225,352) 86,228,016 Permanently restricted 29,507,121 6,605,918 36,113,039
Total net assets 293,799,326 4,515,532 (2,557,825) 295,757,033
T otalliabllities and net assets $ 508,748,590 $ 12,090,539 $ (5,737,390) $ 515,101,739
30

WGBH Educational Foundation Consolidating Statement of Operations Information August 31,2012
WGBH PRI Elimination Consolidated
Operating revenue Contributions, principally viewer and listener support $ 23,614,801 $ $ $ 23,614,801 Community service grants from the Corporation for Public Broadcasting 7,422,700 7,422,700
Royalty and licensing 4,201,280 4,201,280 Captioning and ancillary services 7,868,302 7,868,302
Planned giving 1,546,276 1,546,276
Accretion of interest and other income on long-term receivables 11,887,075 11,887,075 Investment earnings authorized for operations 1,349,328 1,349,328 ~n-kind contributions and donated setvices 6,500,941 8,333 6,509,274
Affiliation Revenue 539,354 539,354 Carriage Fees 711,272 711,272 Miscellaneous income 4,739,757 117,315 4,857,072
Total operating revenue 69,130,460 1,376,274 70,506,734
Net assets released from restrictions 104,580,835 291,053 (348,633) 104,523,255
Total operating revenue and other support 173,711,295 1,667,327 {348,633) 175,029,989
Operating expenses Programming and production 108,779,261 1,229,852 (356,846) 109,652,267 Broadcasting 12,922,586 68,045 12,990,631 Public information, guides and educational material 11,263,643 11,263,643 Legacy Enterprises Fundraising and development 13,051,695 13,051,695 Underwriting 4,923,205 4,923,205 General and administrative 31,121,346 558,672 31,680,018
Total operating expenses 182,061,736 1,856,569 (356,846) 183,561,459
Loss from operations (8,350,441) (189,242) 8,213 (8,531,470)
Nonoperating gains (losses) Contribution of deficit from newly affiliated company (5,062,175) 659,314 (4,402,861) Underwater endowment transfer 11,814 11,814 Realized gain on investments 1,177,736 1,177,736 Change in net unrealized (loss) gain on investments (224,068) (224,068) Investment Income 342,684 342,684 Gain on Equity Investments 10,223,245 10,223,245 Impairment loss on radio licenses
Non-operating gains, net 11,531,411 (5,062,175) 659,314 7,128,550
Decrease in unrestricted net assets $ 3,180,970 $ (5,251,417) $ 667,527 $ (1,402,920)
31
To US Bank (Trustee), Bond owners, and other interested parties:
We are pleased to submit the following information about WGBH Educational Foundation ("WGBH").
Financial Operations
In fiscal year 2012 WGBH had a total of $175.0 million of unrestricted revenue and support with a total of$183.5 million in operating expenses.
The staffing level at August 31, 2012 for all of WGBH's operations was approximately 850 employees, approximately 640 of whom worked full time.
The primary source of funds for the broadcast operations of W GBH' s radio stations and television channels is from contributions from members. Total revenue from member contributions was approximately $23.6 million in fiscal year 2012.
The following table sets forth the total membership contributions for each of the last five fiscal years:
Fiscal Membership Year Dollars
2008 24,710,340 2009 22,919,502 2010 23,908,555 2011 23,909,966 2012 23,614,801
The second-largest revenue source for WGBH's broadcast operations consists of federal funds administered by the Corporation for Public Broadcasting (CPB). Based on a matching formula, WGBH's annual Community Service grants from CPB totaled approximately $7.4 million for fiscal year 2012. The balance of support for Boston operations comes primarily from local corporate underwriting, investment income, and sales of the Massachusetts Film Tax credit.
WGBH operates public television station WGBY in Springfield, Massachusetts, which had approximately $4.2 million in expenses for fiscal year 2012. The sources of income for that station are similar to those for W GBH' s greater Boston operation (except for the absence of royalty income), but on a much smaller scale.
A-I

The largest revenue-producing actIvIty for WGBH is the production of television programs for PBS. W GBH has prospered, securing a steady share of the programming funds from PBS and from national foundations and corporations. The total revenues in fiscal year 2012 for productions in that area that were released from grantee and donor restrictions area were approximately $103.2 million. Revenues from ancillary, technology-based activities represent another revenue source for WGBH: in fiscal year 2012 they generated approximately $7.9 million of revenue.
In 2010 WGBH purchased the radio frequency 99.5 FM, which broadcasts in Greater Boston and Southern New Hampshire, for $14.4M. The purchase allowed WGBH to expand its radio audience as 99.5 FM broadcasts classical music, and 89.7 FM broadcasts an expanded news and talk radio format during the weekday hours, and it continues to broadcast Jazz. During the short period of time that this expansion has taken place there has been an increase in both Local Corporate Sponsorship, and donations from Listeners.
On July 26, 2012, the Foundation entered into an affiliation agreement to become the sole member of Public Radio International, a non-profit entity with headquarters in Minneapolis, Minnesota, and a national content producer, network and service provider for public radio. The acquisition was completed in order to react to the tremendous changes and opportunities occurring in public media so that the two affiliated organizations can more effectively serve the public. As part of the transaction WGBH transferred cash of $2,163,000 to PRI, earmarked for the specific purpose for PRI to pay their outstanding debt with a third party, in exchange for an inter-company note receivable for the same amOlmt payable over the course of approximately 3.75 years at an interest rate of 5%. On November 8, 2012, the Foundation signed an agreement to transfer this intercompany note to a 3rd party financial institution. The debt will be paid over 3.5 years at an interest rate of 3.75%. As part of this transaction PRI was also granted a line of credit for $1,300,000. The Foundation will serve as guarantor for both the note and the line of credit. The consolidated statement of operations for 2012 includes the operations of PRI since the date of acquisition. In 2012, the consolidated statement of operations includes unrestricted revenue and other support of approximately $1,667,327 related to the acquisitions and a deficit of revenues over expenses of approximately $189,242.
WGBH's Statements of Operations for fiscal years ended August 31, 2008 through 2012, shown in the following table, are derived from the audited financial statements. This information should be read in conjunction with WGBH's audited financial statements as of August 31, 2012, together with the related notes and report of PricewaterhouseCoopers LLP, WGBH's independent auditors.
(Table appears on next page.)
A-2

WGBH EDUCATIONAL FOUNDATION CONSOLIDATED STATEMENTS OF OPERATIONS for the years ended August 31, 2008- August 31, 2012
Changes in Unrestricted Net Assets 2012 2011 2010 2009 2008 Contributions, principally viewer and listener support $23,614,801 $23,909,966 $23,908,555 $22,919,502 $24,710,340 Local corporate support 4,524,456 5,056,021 3,477,840 4,329,484 Community service grants from CPB 7,422,700 8,193,515 9,044,229 8,273,570 7,569,592 Royalties, licensing, video sales and international distribution 4,201,280 2,548,834 2,678,545 11,797,127 20,036,949 Captioning and ancillary services 7,868,302 7,526,208 7,171,060 8,246,379 9,017,216 Planned giving 1,546,276 744,766 305,728 506,459 340,965 Accretion of interest on long-tenn receivable 11,887,075 7,489,147 8,242,199 8,721,723 9,167,743 Investment earnings authorized for opemtions 1,349,328 1,334,693 1,314,006 1,282,474 2,520,013 In-kind contributions and donated services 6,509,274 5,584,859 6,452,193 4,891,284 5,028,392 Affiliation fees 539,354 Carriage fees 711,272 Miscellaneous income 4,857,072 6,764,928 7,807,403 6,548,161 4,102,477
Total operating revenue 70,506,734 68,621,372 71,979,939 76,664,519 86,823,171 Net assets released from restrictions 104,523,255 100,568,364 117,169,725 135,841,470 136,258,468
Total unrestricted revenue and other support 175,029,989 169,189,736 189,149,664 212,505,989 223,857,967
Expenses Programming and production 109,652,267 105,851,884 119,948,471 133,548,615 141,419,359 Broadcasting 12,990,631 12,348,398 12,969,796 13,992,852 15,014,931 Public infonnation, guides and educational material 11,263,643 10,437,843 11,223,067 19,136,572 26,225,201 Fundraising and development 13,051,695 12,777,014 13,472,313 14,930,619 18,271,964 Underwriting 4,923,205 5,268,197 5,502,923 5,998,782 6,512,492 General and administrative 31,680,018 36,302,613 31,662,794 30,177,179 29,494,705
Total operating expenses 183,561,459 182,985,949 194,779,364 217,784,619 236,938,652 (Deficit) excess of operating revenue and other support over operating expenses (8,531,470) (13,796,213) (5,629,700) (5,278,630) (13,857,087)
Nonoperating gains (losses) Loss on bond recapitalization (9,398,223) Contribution of net deficit for newly affiliated co. (4,402,861) Undenvater endo\\TIlent transfer 11,814 120,751 328,926 (381,792) (88,591) Realized (losses) gains on investments 1,177,736 1,219,393 306,412 (990,060) 1,591,798 Change in unrealized (losses) gains on investments (224,068) 2,563,083 1,706,180 (1,643,246) (2,400,975) Investment income 342,684 434,749 410,111 462,590 1,674,096 Gain (loss) on equity investments 10,223,245 4,478,762 4,087,101 1,147,186 (304,430) Impainnent loss on radio licenses (1,500,000)
Nonoperating (losses) gains, net 7,128,550 7,316,738 6,838,730 (1,405,322) (8,926,325) Prior year adjustment to net assets * (3,841,875) (Decrease) Increase in unrestricted net assets (1,402,920) (6,479,475) 1,209,030 (6,683,952) (26,625,213)
Changes in temporarily restricted net assets Contribution of net assets for newly affiliated 3,206,780
company Temporarily restricted contributions for national
programming 70,819,827 120,910,280 72,766,176 123,207,189 194,708,808
Temporarily restricted contributions -other 3,074,680 2,817,514 3,919,708 684,525 982,283 Temporarily restricted contributions for local 5,225,947
sponsorship Investment earnings authorized for operations (1,349,328) (1,334,693) (1,314,006) (1,282,474) (2,520,013) Change in value of split interest agreements 129,832 208,828 9,010 (461,447) (414,809) Underwater endowment transfer (11,814) (120,751) (328,926) 381,792 88,591 Investment income 209,467 133,937 259,296 433,988 1,231,377 Realized gains (losses) on investment 1,651,508 577,187 449,439 (1,272,280) 1,725,892 Change in unrealized (losses) gains on investments (228,500) 1,157,700 2,058,761 (2,050,503) (2,569,536) Net assets released from restrictions (104,523,255) (100,568,364) (117,169,725) (135,841,470) (136,258,468)
(Decrease) increase in temporarily restricted net assets (21,764,856) 23,781,638 (39,350,267) (16,200,680) 56,974)25
Changes in pennanently restricted net assets Contribution of net assets for newly affiliated 6,605,918
company Endo\\TIlent contributions 59,404 209,795 69,872 346,261 5,762,694 Planned giving 44,522 479,063 54,715 1,236,897 Change in value of slit interest agreements 16,526 (179,778) 631,764 (426,529) (182,912)
Increase in permanently restricted net assets 6,726,370 509,080 756,351 1,156,629 5,579,782
A-3

(Decrease) Increase in net assets Net assets, beginning of year
Net assets, end of year
(16,411,406) 312,198,439
$295757033
17,811,243 294,387,196
$312198439
(37,384,886) 331,772,082
$294387 196
(21,728,003) 353,500,085
$331772082
35,928,694 317,571,391
$353500085
* During 201 0, the Foundation detennined that beginning unrestricted net asset balances for fiscal 2009 needed to be revised to correctly reflect the classification of certain assets and liabilities relating to bonds that were partially defeased in prior years. AB a result, total assets decreased approximately $3,154,000, total1iabilities increased by approximately $688,000 and unrestricted net assets decreased by $3,841,875.
Endowment
WGBH's endowment is comprised of cash, equities, and fixed-income assets and is separated into three major categories: Permanently Restricted, Temporarily Restricted, and Unrestricted (Board Designated). Permanently Restricted and Temporarily Restricted funds are restricted as to principal or for specific purposes, and therefore any such funds may not be available to meet the Borrower's obligations under the Loan and Trust Agreement. BoardDesignated principal and income are available for use upon the vote of the Board of Trustees.
The endowment assets are recorded at market value. Below is a chart of the balances, additions, spendings, and gains in the endowment from fiscal years 2008 to 2012, which information is derived from WGBH's audited financial statements for the years presented:
2012 2011 2010 2009 2008 Beginning Balance $63.799.626 $59,687,202 $56.812.691 $63,627,040 $60,507.239 Additions 8,123,021 1,205.624 349,815 2,035,299 6,103,659
(Spendings) (2,871,858) (3,014,465) (3,072,323) (2,821,264) (3,131,476) Gain/(Loss) and income 2,774,735 5,921,265 5,597,019 (6,028,384) 147,618 Balance, end ofJiscal year $71,825,524 $63,799,626 $59,687,202 $56,812,691 $63,627,040
Unrestricted 27,513,844 28,065,939 25,084,803 24,100,217 27,820,271 Temporarily Restricted 8,198,641 6,347,018 5,724,810 4,591,236 8,842,160 Permanently Restricted 36,113,039 29,386,669 28,877,589 28,121,238 26,964,609
As of August 31, 2012, the asset allocation ofthe investments was less than 1 % cash and cash equivalents; 30% equities; 8% fixed income; and 61 % alternative investments (hedge funds, inflation hedging funds, and private equity investments, etc.) WGBH has engaged Cambridge Associates to assist in investment manager selection, reporting and performance evaluation.
A-4

As of the date hereof, WGBH's outstanding variable rate long-term debt obligations are as follows:
I. Massachusetts Development Finance Agency (MDFA) Revenue Bonds Current Interest Bonds Series 2008A , in the aggregate outstanding principal amount of $102,920,000 as of the date hereof, and MDFA Zero Coupon Series 2008B in the aggregate outstanding principal amount of $22,566,620, as ofthe date hereof.
2. Massachusetts Development Finance Agency Revenue Bonds, WGBH Educational Foundation Issue, Series 2002A (the "Series 2002A Bonds"), in the aggregate outstanding principal amount of$48,730,000 as of the date hereof.
3. Massachusetts Industrial Finance Agency C'MIFA") Revenue Bonds, WGBH Educational Foundation Issue, Series 1998 (the "Series 1998 Bonds"), in the aggregate outstanding principal amount of$735,000 as of the date hereof.
For additional information concerning WGBH's debt, see WGBH's audited financial statements as of August 31, 2012, together with the related notes and report of PricewaterhouseCoopers LLP, WGBH's independent auditors.
Line afCredit
On May 15, 20 I 0, WGBH increased its revolving credit facility from RBS Citizens, National Association (successor in interest to Citizens Bank of Massachusetts) from $15 million to $25 million. Borrowings under this line of credit bear interest monthly based on the LIBOR Advantage Rate plus two and one half percent per annum (2.50%) or on the prime rate minus one percent (1.00%) per annum, as WGBH may elect to borrow at either rate. The line of credit must be paid down to zero at least once a year. There were no borrowings outstanding on this line of credit as of August 31, 2012.
A-5