Westpac Inflation & Unemployment Expectations Chart Pack (July 2013)
30
Consumer expectations Inflation & unemployment expectation chart pack. July 2013
-
Upload
leithvanonselen -
Category
Documents
-
view
262 -
download
2
Transcript of Westpac Inflation & Unemployment Expectations Chart Pack (July 2013)

Consumer expectations Inflation & unemployment expectation chart pack.
July 2013

Westpac-Melbourne Institute Consumer unemployment expectations
• The unemployment expectations index eased in July falling
3.6%mth following a 6.3% rise in June & a 5.4% rise in May. This has seen the annual pace of the index ease back to 3.2%yr from 4.9%yr in June and 1.9%yr in May. The annual growth rate was negative in April (–0.5%yr) and March (–6.5%yr).
• The trend level of the index is now 22% higher than its long run average. This is something we are watching closely as it suggest we are still in a soft patch for the labour market and that unemployment is set to continue to rise modestly in the year ahead. In particular, it is pointing to a very weak outlook for full-time employment and total hours worked.
• By city, the largest deterioration has occurred in the mining regions. In particular, WA is equal with Qld in being the most pessimistic about the labour market while NSW is now the most optimistic.
2

Westpac-Melbourne Institute Consumer unemployment expectations (cont)
• In particular it is quite revealing there are growing labour market
concerns by paraprofessional & trades - they had been more optimistic than the average and have now caught the more pessimistic managers & professional.
• As the mining sector starts to wind down its investment surge, and the domestic construction/manufacturing sectors servicing it feel the pinch, job insecurity has increased among both managers & professionals and labourers & operators. It is the sales & clerical employees that remain the most optimistic, relatively speaking.
• The level of the unemployment index suggests the pressure remains on the RBA to cut rates further. The fact that inflationary expectations remain well anchored suggests they have ample scope to do so should they decide it is necessary.
3

Labour market concerns still trending higher…
80
100
120
140
160
180
200
80
100
120
140
160
180
200
Jul-88 Jul-93 Jul-98 Jul-03 Jul-08 Jul-13
index index
unemployment expectations
unemployment expectations trend
Sources: Westpac-MI
unemployment
expected to rise
unemployment
expected to fall
peak,
Feb ’09
4

…suggesting rising unemployment…
80
100
120
140
160
180
200
-200
-100
0
100
200
300
400
Jul-88 Jul-93 Jul-98 Jul-03 Jul-08 Jul-13
index
annual change in unemployment rate smoothed (lhs)
unemployment expectations trend (rhs)
bps
Sources: Westpac-MI
unemployment
rising
unemployment
falling
5

...& employment to lag population growth...
-150
-100
-50
0
50
100
150
200
-80
-60
-40
-20
0
20
40
Jul-95 Jul-99 Jul-03 Jul-07 Jul-11
bps tty
unemploy. expectations (lhs leading 4mths)
change in employ/pop ratio (rhs)
% long run average Sources: Westpac-MI, ABS
6

...as full-time employment fades...
-1.5
-1.0
-0.5
0.0
0.5
1.0
1.5
2.0 -30
-20
-10
0
10
20
30
40
50
Jul-99 Jul-03 Jul-07 Jul-11
% 3mth
unemploy. exp* (lhs leading 2mths) trend full-time employ (rhs)
% inverted Sources: Westpac-MI, ABS
*trend represented as deviation from 10 year average
7

...holding back the overall labour market.
-1.0
-0.5
0.0
0.5
1.0
1.5 -40
-30
-20
-10
0
10
20
30
40
50
Jul-99 Jul-03 Jul-07 Jul-11
% 3mth % deviation
unemployment expectations trend* (lhs leading 2mths)
trend total employment (rhs)
Sources: Westpac-MI, ABS * represented as deviation from full history average
8

Hours worked to continue to languish...
-5.0
-3.0
-1.0
1.0
3.0
5.0
-50
-30
-10
10
30
50
Jul-95 Jul-99 Jul-03 Jul-07 Jul-11
% yr
unemploy. expectations (lhs leading 4mths)
hours worked %yr (rhs)
% long run average Sources: Westpac-MI, ABS
9

...due to some near term weakness.
-1.5
-1.0
-0.5
0.0
0.5
1.0
1.5 -50
-40
-30
-20
-10
0
10
20
30
40
50
Jul-95 Jul-99 Jul-03 Jul-07 Jul-11
% 3mth
unemploy. expectations* (lhs leading 1mth)
trend hours worked (rhs)
% long run average Sources: Westpac-MI, ABS
10

Those working are getting more worried
60
70
80
90
100
110
120
130
140
150
60
70
80
90
100
110
120
130
140
150
Jul-00 Jul-03 Jul-06 Jul-09 Jul-12
index index
working
unemploy/retired/not working
Sources: Westpac-MI
Long run average = 100
11

Sales & clerical are the most optimistic
60
70
80
90
100
110
120
130
140
150
60
70
80
90
100
110
120
130
140
150
Jul-01 Jul-04 Jul-07 Jul-10 Jul-13
index index
manager/prof
labourer/operator
paraprof/trades
sales/clerical
Sources: Westpac-MI
Unemployment expectations by occupation LR ave = 100
12
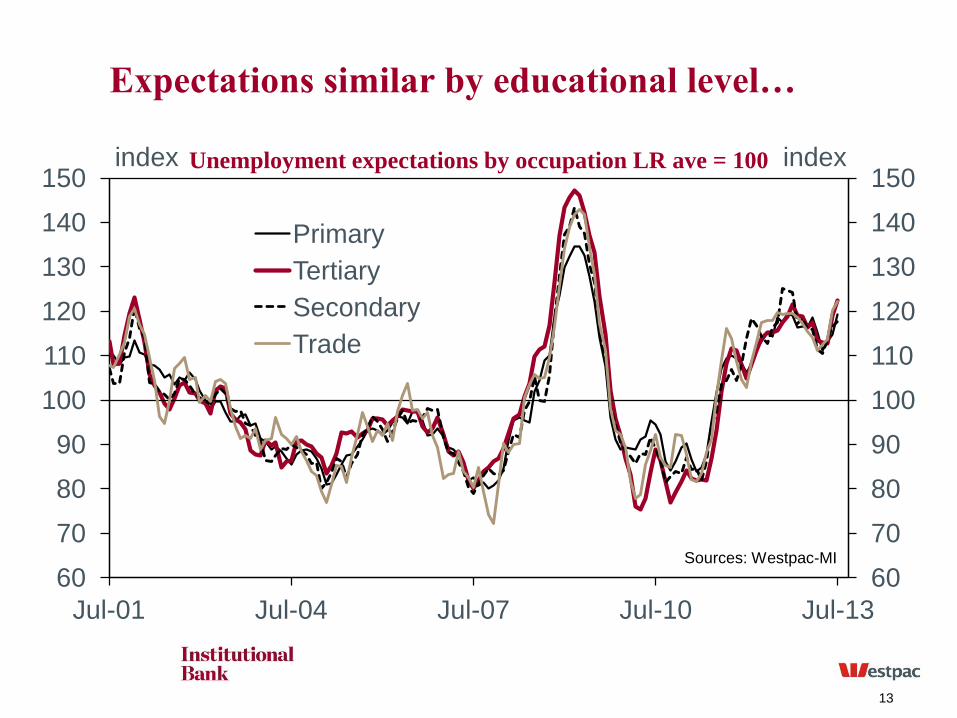
Expectations similar by educational level…
60
70
80
90
100
110
120
130
140
150
60
70
80
90
100
110
120
130
140
150
Jul-01 Jul-04 Jul-07 Jul-10 Jul-13
index index
Primary
Tertiary
Secondary
Trade
Sources: Westpac-MI
Unemployment expectations by occupation LR ave = 100
13

…but males a touch more pessimistic…
60
70
80
90
100
110
120
130
140
150
160
60
70
80
90
100
110
120
130
140
150
160
Jul-01 Jul-04 Jul-07 Jul-10 Jul-13
index index
Male Female
Sources: Westpac-MI
Unemployment expectations by occupation LR ave = 100
14

…but similar if they live with/without children…
60
70
80
90
100
110
120
130
140
150
160
60
70
80
90
100
110
120
130
140
150
160
Jul-01 Jul-04 Jul-07 Jul-10 Jul-13
index index
Live with children<18
Does not live with child<18
Sources: Westpac-MI
Unemployment expectations by family type LR ave = 100
15

…and home ownership.
60
70
80
90
100
110
120
130
140
150
160
60
70
80
90
100
110
120
130
140
150
160
Jul-01 Jul-04 Jul-07 Jul-10 Jul-13
index index
tenant
mortgagor
owned
Sources: Westpac-MI
Unemployment expect by household type LR ave = 100
16

The south east cities are the most optimistic...
60
70
80
90
100
110
120
130
140
150
60
70
80
90
100
110
120
130
140
150
Jul-01 Jul-04 Jul-07 Jul-10 Jul-13
index index
Sydney
Melbourne
Remaining cities
Sources: Westpac-MI
Unemployment expectations by state LR ave = 100
17

…& WA the most pessimistic…
60
70
80
90
100
110
120
130
140
150
160
60
70
80
90
100
110
120
130
140
150
160
Jul-01 Jul-04 Jul-07 Jul-10 Jul-13
index index
NSW WA
Vic Qld
Sources: Westpac-MI
Unemployment expectations by state LR ave = 100
18

…as expectation deteriorate in rural areas.
60
70
80
90
100
110
120
130
140
150
60
70
80
90
100
110
120
130
140
150
Jul-01 Jul-04 Jul-07 Jul-10 Jul-13
index index
urban
rural
Sources: Westpac-MI
Unemployment expectations by state LR ave = 100
19

NSW full-time stronger than expectations
-2.0
-1.0
0.0
1.0
2.0 -50
-40
-30
-20
-10
0
10
20
30
40
50
Jul-95 Jul-99 Jul-03 Jul-07 Jul-11
% 3mth
unemploy. exp* (lhs)
trend full-time employ (rhs)
% inverted Sources: Westpac-MI, ABS
*trend represented as deviation
from 10 year average
20

Vic expectations now diverging from employ
-2.0
-1.0
0.0
1.0
2.0 -50
-40
-30
-20
-10
0
10
20
30
40
50
Jul-98 Jul-02 Jul-06 Jul-10
% 3mth
unemploy. exp* (lhs leading 2 mths)
trend full-time employ (rhs)
% inverted Sources: Westpac-MI, ABS
*trend represented as deviation
from 10 year average
21

Qld jobs are weaker than expectations
-1.0
0.0
1.0
2.0
3.0 -50
-40
-30
-20
-10
0
10
20
30
40
50
Jul-99 Jul-03 Jul-07 Jul-11
% 3mth
unemploy. exp* (lhs leading 2 mths)
trend full-time employ (rhs)
% inverted Sources: Westpac-MI, ABS
*trend represented as deviation
from 10 year average
22

WA expectations on a downward slide
-3.0
-2.0
-1.0
0.0
1.0
2.0
3.0 -50
-40
-30
-20
-10
0
10
20
30
40
50
60
Jul-95 Jul-99 Jul-03 Jul-07 Jul-11
% 3mth
unemploy. exp* (lhs leading 2 mths)
trend full-time employ (rhs)
% inverted Sources: Westpac-MI, ABS
*trend represented as deviation
from 10 year average
23

Job worries will keep the pressure on rates…
80
100
120
140
160
180
-500
-400
-300
-200
-100
0
100
200
300
Jul-01 Jul-04 Jul-07 Jul-10 Jul-13
Index invert.
annual change in cash rate (lhs)
forecasts
unemployment expectations trend (rhs)
bps
Source: Westpac-MI
When unemployment expectations improve, the
RBA tightens monetary policy
When unemployment
expectation deteriorate, the
RBA eases monetary policy
24

…as the labour market softens again.
-48
-32
-16
0
16
32
48
64
80 -500
-400
-300
-200
-100
0
100
200
300
Jul-01 Jul-04 Jul-07 Jul-10 Jul-13
%yr
annual change in cash rate (lhs)
forecasts
change in expectations (rhs)
bps
Source: Westpac-MI
When unemployment expectations
improve, the RBA tightens monetary policy
When unemployment
expectation deteriorate, the
RBA eases monetary policy
25

Westpac-Melbourne Institute Consumer inflationary expectations
• The Melbourne Institute survey of consumer inflation expectations
lifted a little in July by 0.3ppt back to 2.4%yr, where it was in May. The trend is drifting higher, 2.32%yr from 2.31% in June and 2.27%yr in May.
• The median expected inflation rate of managers & professionals continues to lift, printing 3.1%yr in July from 2.6%yr in June & 2.4%yr in May. It is now just above the 3.0%yr print in April. The trend is drifting higher for managers & professionals, 2.79%yr from 2.75%yr in June and 2.66%yr in May.
• Inflationary expectations remain anchored around the mid-point of the RBA's target band of 2½%yr. But we are watching this closely. The net balance of those households expecting price rises vs. those expecting has drifted higher at 71.2% in June it is now close to the longer run average of 75.6%. A net balance greater than the average points to a broadening of inflationary expectations.
26

Inflation expectations remain well anchored
0
1
2
3
4
5
6
7
0
1
2
3
4
5
6
7
Jul-97 Jul-01 Jul-05 Jul-09 Jul-13
% ann % ann
trend median
27

Expectations still well below longer run average
-1
0
1
2
3
4
5
6
7
-1
0
1
2
3
4
5
6
7
Jul-98 Jul-01 Jul-04 Jul-07 Jul-10 Jul-13
% ann % ann
CPI
professionals trend
consumers trend
Sources: ABS, Westpac Economics, Melbourne Institute
Spike
higher pre
GST
A real
inflation spike
Carbon price
boost very
small
28
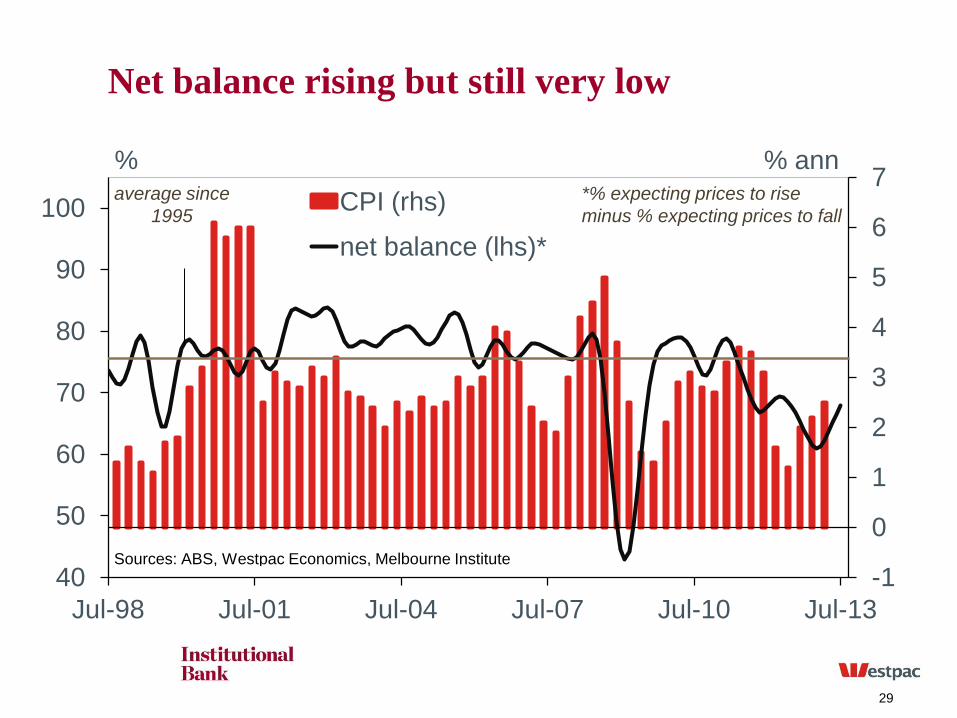
Net balance rising but still very low
-1
0
1
2
3
4
5
6
7
40
50
60
70
80
90
100
Jul-98 Jul-01 Jul-04 Jul-07 Jul-10 Jul-13
% ann %
CPI (rhs)
net balance (lhs)*
Sources: ABS, Westpac Economics, Melbourne Institute
average since
1995
*% expecting prices to rise
minus % expecting prices to fall
29

Disclaimer Disclaimer Things you should know: Each time someone visits our site, data is captured so that we can accurately evaluate the quality of our content and make improvements for you. We may at times use technology to capture data about
you to help us to better understand you and your needs, including potentially for the purposes of assessing your individual reading habits and interests to allow us to provide suggestions regarding other reading material which may
be suitable for you.
If you are located in Australia, this material and access to this website is provided to you solely for your own use and in your capacity as a wholesale client of Westpac Institutional Bank being a division of Westpac Banking Corporation ABN 33 007 457 141 AFSL 233714 (‘Westpac’). If you are located outside of Australia, this material and access to this website is provided to you as outlined below. This material and this website contain general commentary only and do not constitute investment advice. Certain types of transactions, including those involving futures, options and high yield securities give rise to
substantial risk and are not suitable for all investors. We recommend that you seek your own independent legal or financial advice before proceeding with any investment decision. This information has been prepared without taking
account of your objectives, financial situation or needs. This material and this website may contain material provided by third parties. While such material is published with the necessary permission none of Westpac or its related
entities accepts any responsibility for the accuracy or completeness of any such material. Although we have made every effort to ensure the information is free from error, none of Westpac or its related entities warrants the accuracy,
adequacy or completeness of the information, or otherwise endorses it in any way. Except where contrary to law, Westpac and its related entities intend by this notice to exclude liability for the information. The information is subject
to change without notice and none of Westpac or its related entities is under any obligation to update the information or correct any inaccuracy which may become apparent at a later date. The information contained in this material
and this website does not constitute an offer, a solicitation of an offer, or an inducement to subscribe for, purchase or sell any financial instrument or to enter a legally binding contract. Past performance is not a reliable indicator of
future performance. The forecasts given in this material and this website are predictive in character. Whilst every effort has been taken to ensure that the assumptions on which the forecasts are based are reasonable, the forecasts
may be affected by incorrect assumptions or by known or unknown risks and uncertainties. The ultimate outcomes may differ substantially from these forecasts.
Transactions involving carbon give rise to substantial risk (including regulatory risk) and are not suitable for all investors. We recommend that you seek your own independent legal or financial advice before proceeding with any
investment decision. This information has been prepared without taking account of your objectives, financial situation or needs. Statements setting out a concise description of the characteristics of carbon units, Australian carbon
credit units and eligible international emissions units (respectively) are available at www.cleanenergyregulator.gov.au, as mentioned in section 202 of the Clean Energy Act 2011, section 162 of the Carbon Credits (Carbon Farming
Initiative) Act 2011 and section 61 of the Australian National Registry of Emissions Units Act 2011. You should consider each such statement in deciding whether to acquire, or to continue to hold, any carbon unit, Australian carbon
credit unit or eligible international emissions unit.
Additional information if you are located outside of Australia
New Zealand: The current disclosure statement for the New Zealand division of Westpac Banking Corporation ABN 33 007 457 141 or Westpac New Zealand Limited can be obtained at the internet address www.westpac.co.nz.
Westpac Institutional Bank products and services are provided by either Westpac Banking Corporation ABN 33 007 457 141 incorporated in Australia (New Zealand division) or Westpac New Zealand Limited. For further information
please refer to the Product Disclosure Statement (available from your Relationship Manager) for any product for which a Product Disclosure Statement is required, or applicable customer agreement. Download the Westpac NZ QFE
Group Financial Advisers Act 2008 Disclosure Statement at www.westpac.co.nz.
China, Hong Kong, Singapore and India: Westpac Singapore Branch holds a wholesale banking licence and is subject to supervision by the Monetary Authority of Singapore. Westpac Hong Kong Branch holds a banking license
and is subject to supervision by the Hong Kong Monetary Authority. Westpac Hong Kong branch also holds a license issued by the Hong Kong Securities and Futures Commission (SFC) for Type 1 and Type 4 regulated activity.
Westpac Shanghai and Beijing Branches hold banking licenses and are subject to supervision by the China Banking Regulatory Commission (CBRC). Westpac Mumbai Branch holds a banking license from Reserve Bank of India
(RBI) and subject to regulation and supervision by the RBI. U.K.: Westpac Banking Corporation is registered in England as a branch (branch number BR000106) and is authorised and regulated by The Financial Services Authority. Westpac Europe Limited is a company registered in
England (number 05660023) and is authorised and regulated by The Financial Services Authority. This material and this website and any information contained therein is directed at a) persons who have professional experience in
matters relating to investments falling within Article 19(1) of the Financial Services Act 2000 (Financial Promotion) Order 2005 or (b) high net worth entities, and other persons to whom it may otherwise be lawfully communicated, falling within Article 49(1) of the Order (all such persons together being referred to as “relevant persons”). The investments to which this material and this website relates are only available to and any invitation, offer or agreement to
subscribe, purchase or otherwise acquire such investments will be engaged in only with, relevant persons. Any person who is not a relevant person should not act or rely upon this material and this website or any of its contents. In the same way, the information contained in this material and this website is intended for “eligible counterparties” and “professional clients” as defined by the rules of the Financial Services Authority and is not intended for “retail
clients”. With this in mind, Westpac expressly prohibits you from passing on the information on this material and this website to any third party. In particular this material and this website, website content and, in each case, any copies
thereof may not be taken, transmitted or distributed, directly or indirectly into any restricted jurisdiction.
U.S.: Westpac operates in the United States of America as a federally licensed branch, regulated by the Office of the Comptroller of the Currency. Westpac is also registered with the US Commodity Futures Trading Commission (“CFTC”) as a Swap Dealer, but is neither registered as, or affiliated with, a Futures Commission Merchant registered with the US CFTC. Westpac Capital Markets, LLC (‘WCM’), a wholly-owned subsidiary of Westpac, is a broker-
dealer registered under the U.S. Securities Exchange Act of 1934 (‘the Exchange Act’) and member of the Financial Industry Regulatory Authority (‘FINRA’). This communication is provided for distribution to U.S. institutional
investors in reliance on the exemption from registration provided by Rule 15a-6 under the Exchange Act and is not subject to all of the independence and disclosure standards applicable to debt research reports prepared for retail investors in the United States. WCM is the U.S. distributor of this communication and accepts responsibility for the contents of this communication. All disclaimers set out with respect to Westpac apply equally to WCM. If you would
like to speak to someone regarding any security mentioned herein, please contact WCM on +1 212 389 1269. All disclaimers set out with respect to Westpac apply equally to WCM. Investing in any non-U.S. securities or related financial instruments mentioned in this communication may present certain risks. The securities of non-U.S. issuers may not be registered with, or be subject to the regulations of, the SEC in the United States. Information on such
non-U.S. securities or related financial instruments may be limited. Non-U.S. companies may not subject to audit and reporting standards and regulatory requirements comparable to those in effect in the United States. The value of
any investment or income from any securities or related derivative instruments denominated in a currency other than U.S. dollars is subject to exchange rate fluctuations that may have a positive or adverse effect on the value of or income from such securities or related derivative instruments. The author of this communication is employed by Westpac and is not registered or qualified as a research analyst, representative, or associated person under the rules of FINRA, any other U.S. self-regulatory organisation, or the
laws, rules or regulations of any State. Unless otherwise specifically stated, the views expressed herein are solely those of the author and may differ from the information, views or analysis expressed by Westpac and/or its affiliates. For the purposes of Regulation AC only: Each analyst whose name appears in this report certifies that (1) the views expressed in this report accurately reflect the personal views of the analyst about any and all of the subject
companies and their securities and (2) no part of the compensation of the analyst was, is, or will be, directly or indirectly related to the specific views or recommendations in this report.
For XYLO Foreign Exchange clients: This information is provided to you solely for your own use and is not to be distributed to any third parties. XYLO Foreign Exchange is a division of Westpac Banking Corporation ABN 33 007
457 141 and Australian credit licence 233714. Information is current as at date shown on the publication. This information has been prepared without taking account of your objectives, financial situation or needs. Because of this you should, before acting on this information, consider its appropriateness, having regard to your objectives, financial situation or needs. XYLO Foreign Exchange’s combined Financial Services Guide and Product Disclosure Statement
can be obtained by calling XYLO Foreign Exchange on 1300 995 639, or by emailing [email protected].