Western North Dakota Energy Project Housing Solutions Webinar Series December 9, 2014 1 Affordable...
30
Western North Dakota Energy Project Housing Solutions Webinar Series December 9, 2014 1 Affordable Housing 101 Development Finance Basics
-
Upload
derrick-kevin-warner -
Category
Documents
-
view
217 -
download
1
Transcript of Western North Dakota Energy Project Housing Solutions Webinar Series December 9, 2014 1 Affordable...

Western North Dakota Energy Project Housing Solutions Webinar Series
December 9, 2014
1
Affordable Housing 101
Development Finance Basics

What is “Affordable Housing”?
• No more than 30% of a household’s gross income.– Senior with $15,450 Social Security income
• $386 per month– Preschool teacher earning $26,680 per year
• $667 per month– Highway Patrol officer earning $46,250 per yr
• $1,156 per month
• Monthly rent of $2,500 requires $100,000 annual household income
2
33
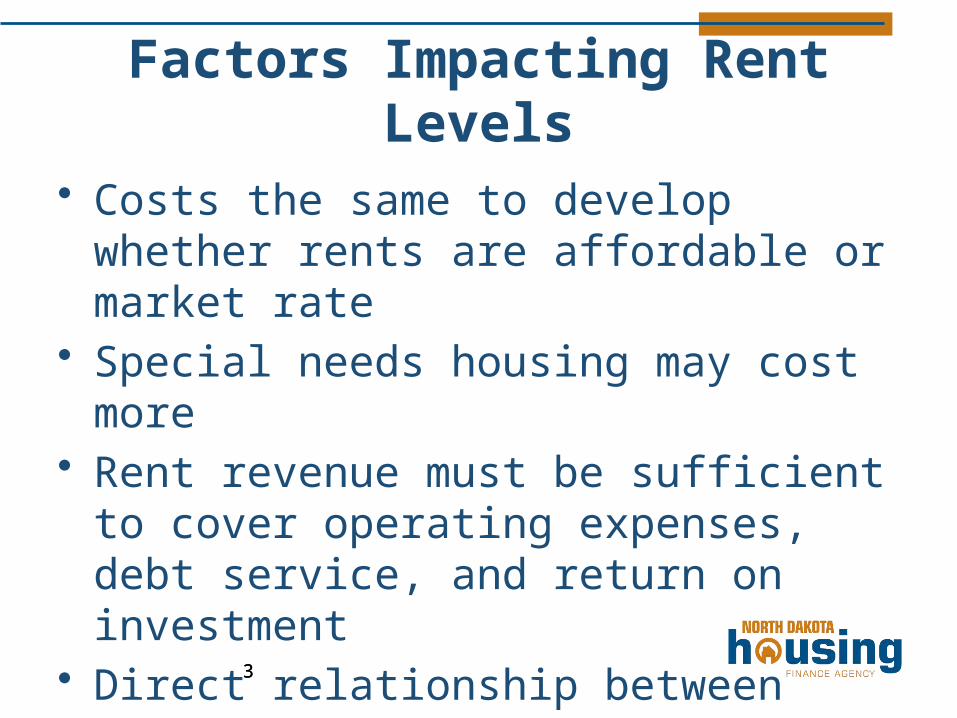
Factors Impacting Rent Levels
• Costs the same to develop whether rents are affordable or market rate
• Special needs housing may cost more• Rent revenue must be sufficient to cover
operating expenses, debt service, and return on investment
• Direct relationship between development costs and rent level
44
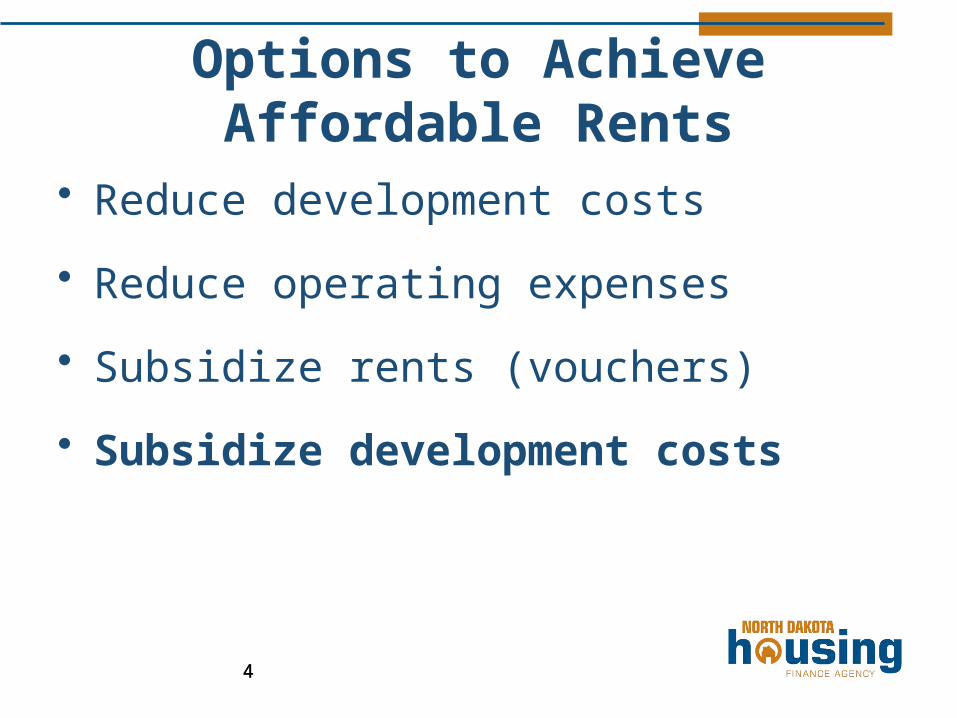
Options to Achieve Affordable Rents
• Reduce development costs
• Reduce operating expenses
• Subsidize rents (vouchers)
• Subsidize development costs
55
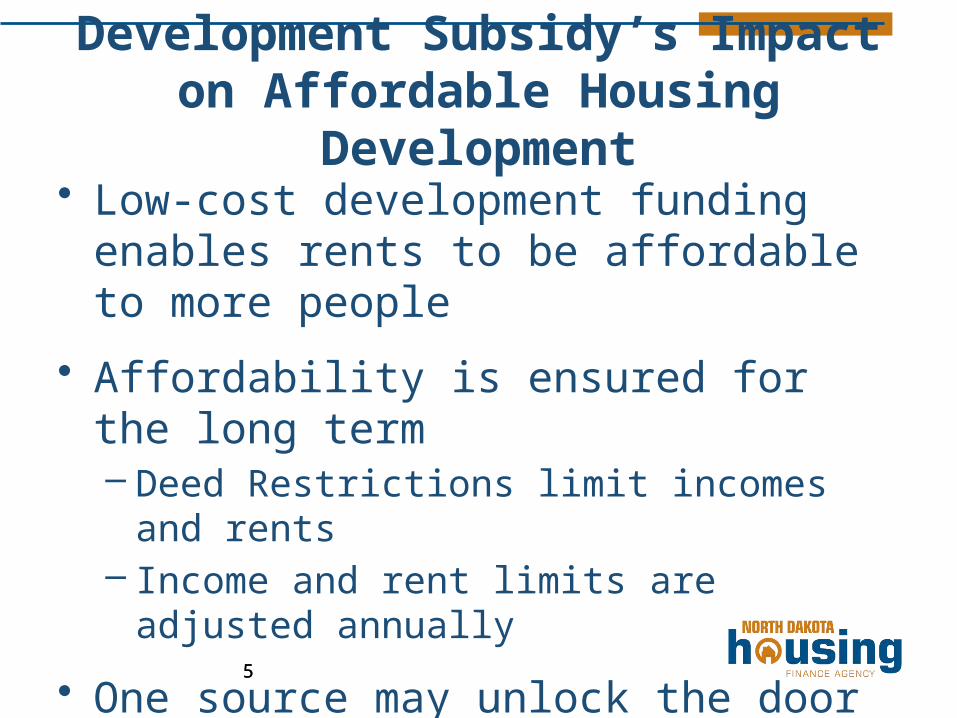
Development Subsidy’s Impact on Affordable Housing Development
• Low-cost development funding enables rents to be affordable to more people
• Affordability is ensured for the long term– Deed Restrictions limit incomes and rents– Income and rent limits are adjusted annually
• One source may unlock the door to other private, local, state and federal resources

24 Unit Apartment Building$175,000 x 24 units = $4,200,000 Total Cost
Traditional Financing• Equity $1.26 million (30%)• Debt $2.94 million (70%)
$189,391 Debt Service (5%, 30 year)
$120,000 Operating Expense
$100,800 Return on Equity (8%)
$410,191 Needed Annual Revenue
= $1,424 Average Monthly Rent per Unit
66

24 Unit Apartment Building$175,000 x 24 units = $4,200,000 Total Cost
Traditional Financing• Equity $1.26 million (30%)• Debt $2.94 million (70%)
$189,391 Debt Service (5%, 30 year)
$120,000 Operating Expense
$100,800 Return on Equity (8%)
$410,191 Needed Annual Revenue
= $1,424 Average Monthly Rent per Unit
Development Subsidy• Equity $1.26 million (30%)• Soft Debt/Grant $1.26 mil. (30%)• Debt $1.68 million (40%)
$108,223 Debt Service (5%, 30 year)
$120,000 Operating Expense
$100,800 Return on Equity (8%)
$329,023 Needed Annual Revenue
= $1,142 Average Monthly Rent per Unit
77

24 Unit Apartment BuildingMixed Income Property
Rent Distribution Scenario• 5 units @ $415 (30% AMI)• 5 units @ $670 (50% AMI)• 5 units @ $1,050 (80% AMI)
• 9 units @ $1,860 (“Market Rate”)
= $1,142 Average Unit Rent
88

Development Funding Resources
Grant Programs– No repayment– Provide equity into the project– Tenant income and rent requirements– Examples
• Affordable Housing Program - FHLB• Community Development Block Grant• Private philanthropic foundations• Low Income Housing Tax Credits
– 9% “competitive” credits– 4% credits with bond financing
9

Development Funding Resources
Soft Debt Programs– Repayment is flexible
• Deferred payments• Forgivable• Interest-only payments• Contingent payments based on cash flow
– Tenant income and rent requirements– Examples
• Housing Incentive Fund• HOME• Neighborhood Stabilization Program
10
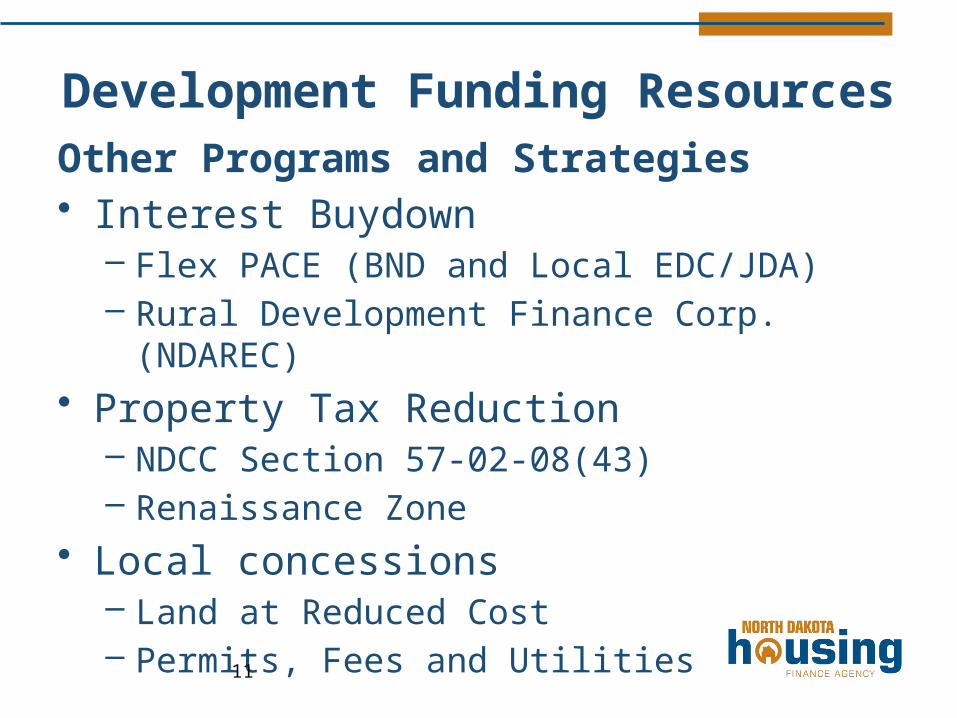
Development Funding ResourcesOther Programs and Strategies• Interest Buydown
– Flex PACE (BND and Local EDC/JDA)– Rural Development Finance Corp. (NDAREC)
• Property Tax Reduction– NDCC Section 57-02-08(43)– Renaissance Zone
• Local concessions– Land at Reduced Cost– Permits, Fees and Utilities
11

24 Unit Senior ProjectCosts
Land Acquisition $650,000
New Construction 3,200,000
Fees and Permits 50,000
Soft Costs 120,000
Finance Costs 100,000
Developer Fee 300,000
Operating Reserve 80,000
Total Cost $4,500,000
Funding Sources
Total Funding Sources $0
12
Operating Budget
Tenant # Units Rent Annual
30% AMI 8 $450 $43,200
50% AMI 6 $750 54,000
80% AMI 4 $1,100 52,800
120%AMI 6 $1,450 104,400
Gross Potential Rent $254,400
Less Vacancy & Bad Debt (17,808)
Effective Gross Income $236,592
Administrative Expense $23,500
Utility Expense 30,000
Operating and Maintenance 19,000
Property Taxes 35,000
Replacement Reserve ($300/unit) 7,200
Total Operating Expenses ($114,700)
Net Operating Income $121,892
Debt Service (Principal & Interest)
Net Cash Flow
Debt Coverage Ratio

24 Unit Senior Project: Conventional FinancingCosts
Land Acquisition $650,000
New Construction 3,200,000
Fees and Permits 50,000
Soft Costs 120,000
Finance Costs 100,000
Developer Fee 300,000
Operating Reserve 80,000
Total Cost $4,500,000
Funding Sources
Bank Debt (5% 15 years) $4,000,000
Owner Equity Investment 500,000
Total Funding Sources $4,500,000
13
Operating Budget
Tenant # Units Rent Annual
30% AMI 8 $450 $43,200
50% AMI 6 $750 54,000
80% AMI 4 $1,100 52,800
120%AMI 6 $1,450 104,400
Gross Potential Rent $254,400
Less Vacancy & Bad Debt (17,808)
Effective Gross Income $236,592
Administrative Expense $23,500
Utility Expense 30,000
Operating and Maintenance 19,000
Property Taxes 35,000
Replacement Reserve ($300/unit) 7,200
Total Operating Expenses ($114,700)
Net Operating Income $121,892
Debt Service (Principal & Interest)
(379,581)
Net Cash Flow ($257,689)
Debt Coverage Ratio 0.32
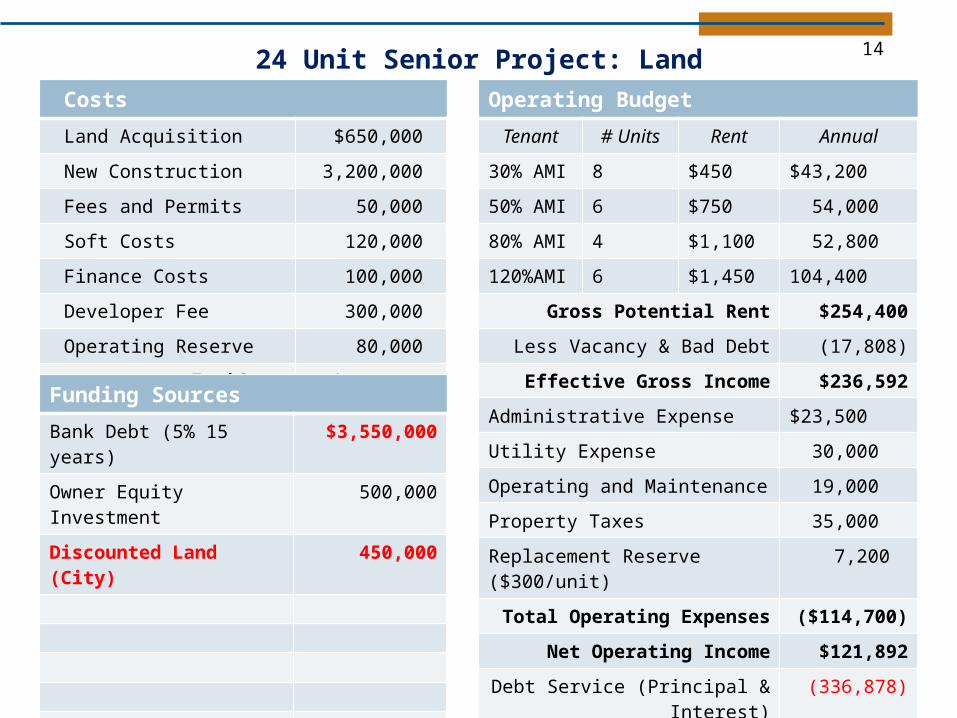
24 Unit Senior Project: LandCosts
Land Acquisition $650,000
New Construction 3,200,000
Fees and Permits 50,000
Soft Costs 120,000
Finance Costs 100,000
Developer Fee 300,000
Operating Reserve 80,000
Total Cost $4,500,000
Funding Sources
Bank Debt (5% 15 years) $3,550,000
Owner Equity Investment 500,000
Discounted Land (City) 450,000
Total Funding Sources $4,500,000
14
Operating Budget
Tenant # Units Rent Annual
30% AMI 8 $450 $43,200
50% AMI 6 $750 54,000
80% AMI 4 $1,100 52,800
120%AMI 6 $1,450 104,400
Gross Potential Rent $254,400
Less Vacancy & Bad Debt (17,808)
Effective Gross Income $236,592
Administrative Expense $23,500
Utility Expense 30,000
Operating and Maintenance 19,000
Property Taxes 35,000
Replacement Reserve ($300/unit) 7,200
Total Operating Expenses ($114,700)
Net Operating Income $121,892
Debt Service (Principal & Interest)
(336,878)
Net Cash Flow ($214,986)
Debt Coverage Ratio 0.36
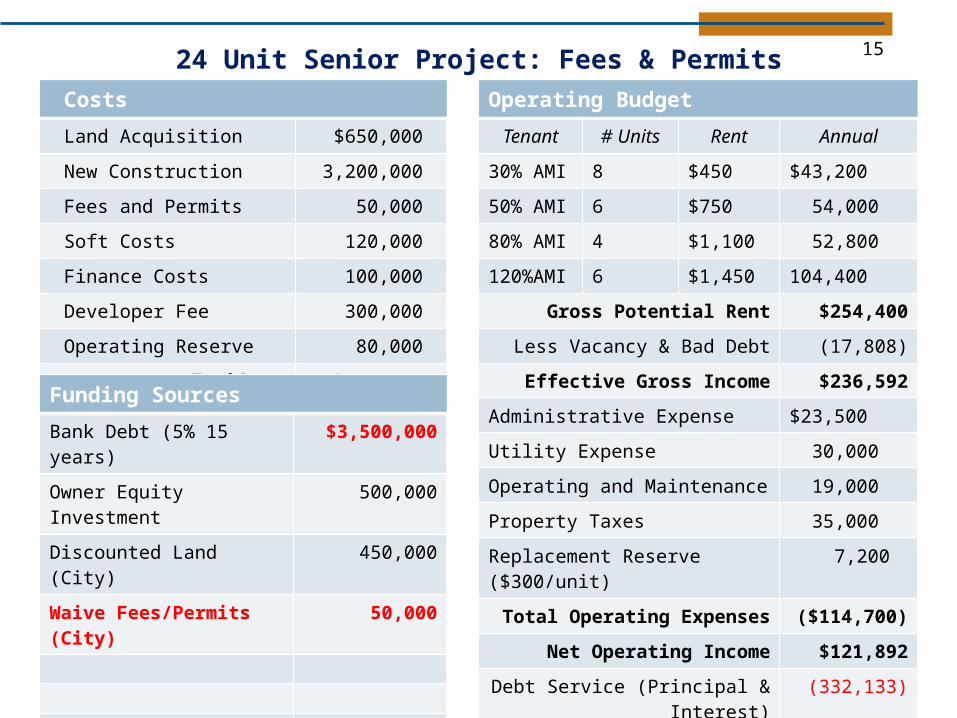
24 Unit Senior Project: Fees & PermitsCosts
Land Acquisition $650,000
New Construction 3,200,000
Fees and Permits 50,000
Soft Costs 120,000
Finance Costs 100,000
Developer Fee 300,000
Operating Reserve 80,000
Total Cost $4,500,000
Funding Sources
Bank Debt (5% 15 years) $3,500,000
Owner Equity Investment 500,000
Discounted Land (City) 450,000
Waive Fees/Permits (City) 50,000
Total Funding Sources $4,500,000
15
Operating Budget
Tenant # Units Rent Annual
30% AMI 8 $450 $43,200
50% AMI 6 $750 54,000
80% AMI 4 $1,100 52,800
120%AMI 6 $1,450 104,400
Gross Potential Rent $254,400
Less Vacancy & Bad Debt (17,808)
Effective Gross Income $236,592
Administrative Expense $23,500
Utility Expense 30,000
Operating and Maintenance 19,000
Property Taxes 35,000
Replacement Reserve ($300/unit) 7,200
Total Operating Expenses ($114,700)
Net Operating Income $121,892
Debt Service (Principal & Interest)
(332,133)
Net Cash Flow ($210,241)
Debt Coverage Ratio 0.37
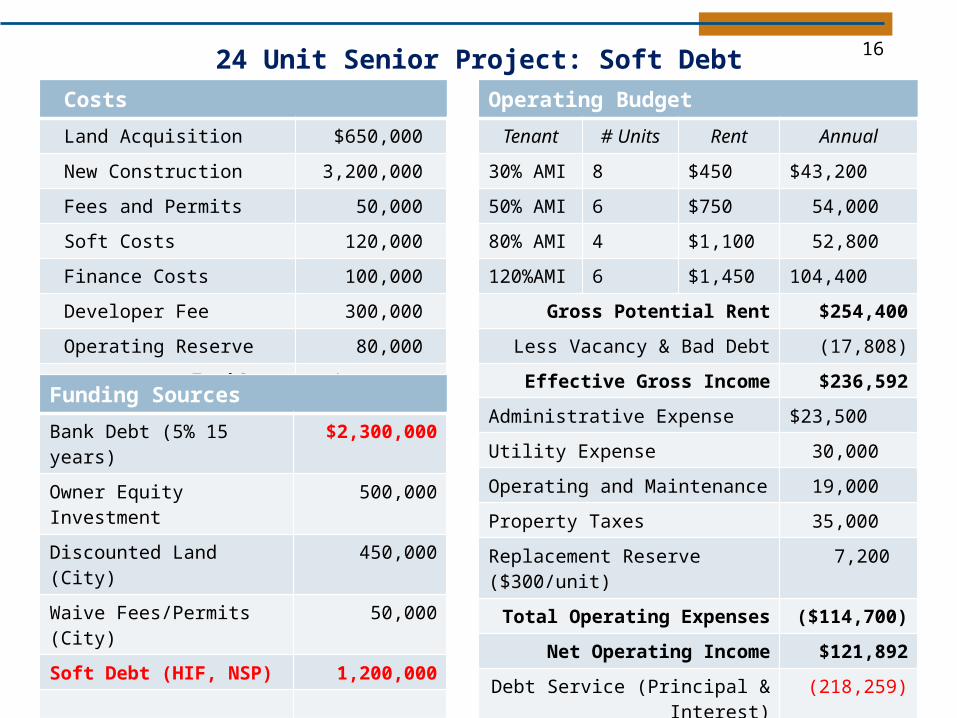
24 Unit Senior Project: Soft DebtCosts
Land Acquisition $650,000
New Construction 3,200,000
Fees and Permits 50,000
Soft Costs 120,000
Finance Costs 100,000
Developer Fee 300,000
Operating Reserve 80,000
Total Cost $4,500,000
Funding Sources
Bank Debt (5% 15 years) $2,300,000
Owner Equity Investment 500,000
Discounted Land (City) 450,000
Waive Fees/Permits (City) 50,000
Soft Debt (HIF, NSP) 1,200,000
Total Funding Sources $4,500,000
16
Operating Budget
Tenant # Units Rent Annual
30% AMI 8 $450 $43,200
50% AMI 6 $750 54,000
80% AMI 4 $1,100 52,800
120%AMI 6 $1,450 104,400
Gross Potential Rent $254,400
Less Vacancy & Bad Debt (17,808)
Effective Gross Income $236,592
Administrative Expense $23,500
Utility Expense 30,000
Operating and Maintenance 19,000
Property Taxes 35,000
Replacement Reserve ($300/unit) 7,200
Total Operating Expenses ($114,700)
Net Operating Income $121,892
Debt Service (Principal & Interest)
(218,259)
Net Cash Flow ($96,367)
Debt Coverage Ratio 0.56

24 Unit Senior Project: Property TaxesCosts
Land Acquisition $650,000
New Construction 3,200,000
Fees and Permits 50,000
Soft Costs 120,000
Finance Costs 100,000
Developer Fee 300,000
Operating Reserve 80,000
Total Cost $4,500,000
Funding Sources
Bank Debt (5% 15 years) $2,300,000
Owner Equity Investment 500,000
Discounted Land (City) 450,000
Waive Fees/Permits (City) 50,000
Soft Debt (HIF, NSP) 1,200,000
Total Funding Sources $4,500,000
17
Operating Budget
Tenant # Units Rent Annual
30% AMI 8 $450 $43,200
50% AMI 6 $750 54,000
80% AMI 4 $1,100 52,800
120%AMI 6 $1,450 104,400
Gross Potential Rent $254,400
Less Vacancy & Bad Debt (17,808)
Effective Gross Income $236,592
Administrative Expense $23,500
Utility Expense 30,000
Operating and Maintenance 19,000
Property Taxes 10,400
Replacement Reserve ($300/unit) 7,200
Total Operating Expenses ($90,100)
Net Operating Income $146,492
Debt Service (Principal & Interest)
(218,259)
Net Cash Flow ($71,767)
Debt Coverage Ratio 0.67

24 Unit Senior Project: GrantsCosts
Land Acquisition $650,000
New Construction 3,200,000
Fees and Permits 50,000
Soft Costs 120,000
Finance Costs 100,000
Developer Fee 300,000
Operating Reserve 80,000
Total Cost $4,500,000
Funding Sources
Bank Debt (5% 15 years) $1,900,000
Owner Equity Investment 500,000
Discounted Land (City) 450,000
Waive Fees/Permits (City) 50,000
Soft Debt (HIF, NSP) 1,200,000
Grants (Found’n, CDBG) 400,000
Total Funding Sources $4,500,000
18
Operating Budget
Tenant # Units Rent Annual
30% AMI 8 $450 $43,200
50% AMI 6 $750 54,000
80% AMI 4 $1,100 52,800
120%AMI 6 $1,450 104,400
Gross Potential Rent $254,400
Less Vacancy & Bad Debt (17,808)
Effective Gross Income $236,592
Administrative Expense $23,500
Utility Expense 30,000
Operating and Maintenance 19,000
Property Taxes 10,400
Replacement Reserve ($300/unit) 7,200
Total Operating Expenses ($90,100)
Net Operating Income $146,492
Debt Service (Principal & Interest)
(180,300)
Net Cash Flow ($33,808)
Debt Coverage Ratio 0.81
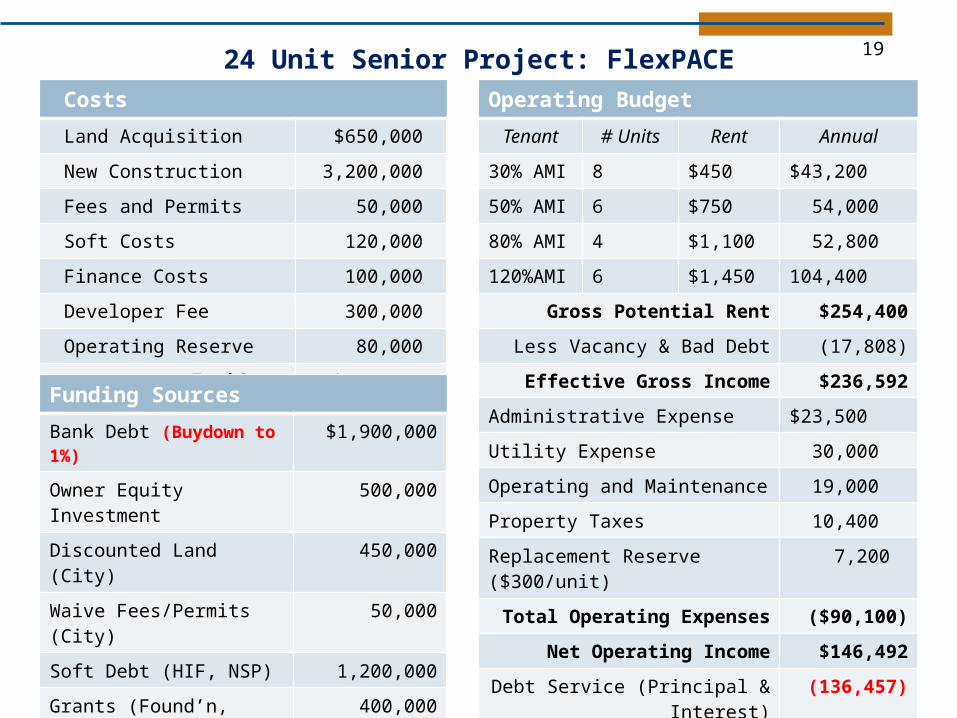
24 Unit Senior Project: FlexPACECosts
Land Acquisition $650,000
New Construction 3,200,000
Fees and Permits 50,000
Soft Costs 120,000
Finance Costs 100,000
Developer Fee 300,000
Operating Reserve 80,000
Total Cost $4,500,000
Funding Sources
Bank Debt (Buydown to 1%) $1,900,000
Owner Equity Investment 500,000
Discounted Land (City) 450,000
Waive Fees/Permits (City) 50,000
Soft Debt (HIF, NSP) 1,200,000
Grants (Found’n, CDBG) 400,000
$175,000 Local FlexPACE Match (EDC/JDA)
Total Funding Sources $4,500,000
19
Operating Budget
Tenant # Units Rent Annual
30% AMI 8 $450 $43,200
50% AMI 6 $750 54,000
80% AMI 4 $1,100 52,800
120%AMI 6 $1,450 104,400
Gross Potential Rent $254,400
Less Vacancy & Bad Debt (17,808)
Effective Gross Income $236,592
Administrative Expense $23,500
Utility Expense 30,000
Operating and Maintenance 19,000
Property Taxes 10,400
Replacement Reserve ($300/unit) 7,200
Total Operating Expenses ($90,100)
Net Operating Income $146,492
Debt Service (Principal & Interest)
(136,457)
Net Cash Flow $10,035
Debt Coverage Ratio 1.07

24 Unit Senior Project: Final Pro FormaCosts
Land Acquisition $650,000
New Construction 3,200,000
Fees and Permits 50,000
Soft Costs 120,000
Finance Costs 100,000
Developer Fee 300,000
Operating Reserve 80,000
Total Cost $4,500,000
Funding Sources
Bank Debt (Buydown to 1%) $1,700,000
Owner Equity Investment 500,000
Discounted Land (City) 450,000
Waive Fees/Permits (City) 50,000
Soft Debt (HIF, NSP) 1,200,000
Grants (Found’n, CDBG) 400,000
$175,000 Local FlexPACE Match (EDC/JDA)
Deferred Developer Fee 200,000
Total Funding Sources $4,500,000
20
Operating Budget
Tenant # Units Rent Annual
30% AMI 8 $450 $43,200
50% AMI 6 $750 54,000
80% AMI 4 $1,100 52,800
120%AMI 6 $1,450 104,400
Gross Potential Rent $254,400
Less Vacancy & Bad Debt (17,808)
Effective Gross Income $236,592
Administrative Expense $23,500
Utility Expense 30,000
Operating and Maintenance 19,000
Property Taxes 10,400
Replacement Reserve ($300/unit) 7,200
Total Operating Expenses ($90,100)
Net Operating Income $146,492
Debt Service (Principal & Interest)
(122,093)
Net Cash Flow $24,399
Debt Coverage Ratio 1.20

21

• The NDSBDC can work with you to help put the finance package together utilizing this program and flex pace plus your local programs.
• We have proforma spred sheets that will calculate all ratios needed for
22

• Bank• NDHFA• Appraiser• Developer• All will be have slightly different views of
rates of return, debt coverage needs and ways to maximize what is important to the project lead
23

Income 2013 2014 2015 2016 2017 2018 2019 2020 2021 2022 2023 2024 2025 2024 2025one bedroom 80 of hud $0.00 $0.00 $0.00 $0.00 $0.00 $0.00 $0.00 $0.00 $0.00 $0.00 $0.00 $0.00 $0.00 $0.00 $0.00two bedroom 80 of hud $17,424.00 $17,772.48 $18,127.93 $18,490.49 $18,860.30 $19,237.50 $19,622.25 $20,014.70 $20,414.99 $20,823.29 $21,239.76 $21,664.55 $22,097.85 $22,539.80 $22,990.60Three bedroom 80 of hud $10,056.00 $10,257.12 $10,462.26 $10,671.51 $10,884.94 $11,102.64 $11,324.69 $11,551.18 $11,782.21 $12,017.85 $12,258.21 $12,503.37 $12,753.44 $13,008.51 $13,268.68one bedroom 140% and unrestricted $0.00 $0.00 $0.00 $0.00 $0.00 $0.00 $0.00 $0.00 $0.00 $0.00 $0.00 $0.00 $0.00 $0.00 $0.00two bedroom and unrestricted $64,344.00 $65,630.88 $66,943.50 $68,282.37 $69,648.01 $71,040.98 $72,461.79 $73,911.03 $75,389.25 $76,897.04 $78,434.98 $80,003.68 $81,603.75 $83,235.83 $84,900.54three bedroom and unrestricted $89,808.00 $91,604.16 $93,436.24 $95,304.97 $97,211.07 $99,155.29 $101,138.39 $103,161.16 $105,224.39 $107,328.87 $109,475.45 $111,664.96 $113,898.26 $116,176.22 $118,499.75Gross income $181,632.00 $185,264.64 $188,969.93 $192,749.33 $196,604.32 $200,536.40 $204,547.13 $208,638.08 $212,810.84 $217,067.05 $221,408.39 $225,836.56 $230,353.29 $234,960.36 $239,659.57vacancy rate $12,714.24 $12,968.52 $13,227.90 $13,492.45 $13,762.30 $14,037.55 $14,318.30 $14,604.67 $14,896.76 $15,194.69 $15,498.59 $15,808.56 $16,124.73 $16,447.23 $16,776.17total income $168,917.76 $172,296.12 $175,742.04 $179,256.88 $182,842.02 $186,498.86 $190,228.83 $194,033.41 $197,914.08 $201,872.36 $205,909.81 $210,028.00 $214,228.56 $218,513.13 $222,883.40Supplies $1,440.00 $1,483.20 $1,527.70 $1,573.53 $1,620.73 $1,669.35 $1,719.44 $1,771.02 $1,824.15 $1,878.87 $1,935.24 $1,993.30 $2,053.10 $2,114.69 $2,178.13Maintenance $8,640.00 $8,899.20 $9,166.18 $9,441.16 $9,724.40 $10,016.13 $10,316.61 $10,626.11 $10,944.89 $11,273.24 $11,611.44 $11,959.78 $12,318.57 $12,688.13 $13,068.78Ad/Promotion $720.00 $741.60 $763.85 $786.76 $810.37 $834.68 $859.72 $885.51 $912.07 $939.44 $967.62 $996.65 $1,026.55 $1,057.34 $1,089.06audit $1,200.00 $1,236.00 $1,273.08 $1,311.27 $1,350.61 $1,391.13 $1,432.86 $1,475.85 $1,520.12 $1,565.73 $1,612.70 $1,661.08 $1,710.91 $1,762.24 $1,815.11Telephone $288.00 $296.64 $305.54 $314.71 $324.15 $333.87 $343.89 $354.20 $364.83 $375.77 $387.05 $398.66 $410.62 $422.94 $435.63utilities for low income $5,040.00 $5,191.20 $5,346.94 $5,507.34 $5,672.56 $5,842.74 $6,018.02 $6,198.56 $6,384.52 $6,576.06 $6,773.34 $6,976.54 $7,185.83 $7,401.41 $7,623.45utilities for common areas $1,440.00 $1,483.20 $1,527.70 $1,573.53 $1,620.73 $1,669.35 $1,719.44 $1,771.02 $1,824.15 $1,878.87 $1,935.24 $1,993.30 $2,053.10 $2,114.69 $2,178.13Insurance $5,760.00 $5,932.80 $6,110.78 $6,294.11 $6,482.93 $6,677.42 $6,877.74 $7,084.07 $7,296.60 $7,515.49 $7,740.96 $7,973.19 $8,212.38 $8,458.75 $8,712.52water sewer garbage $8,640.00 $8,899.20 $9,166.18 $9,441.16 $9,724.40 $10,016.13 $10,316.61 $10,626.11 $10,944.89 $11,273.24 $11,611.44 $11,959.78 $12,318.57 $12,688.13 $13,068.78Real Estate Taxes $0.00 $0.00 $0.00 $0.00 $0.00 $0.00 $0.00 $0.00 $0.00 $0.00 $0.00 $0.00 $0.00 $0.00 $0.00management fee $5,040.00 $5,191.20 $5,346.94 $5,507.34 $5,672.56 $5,842.74 $6,018.02 $6,198.56 $6,384.52 $6,576.06 $6,773.34 $6,976.54 $7,185.83 $7,401.41 $7,623.45grounds snow lawn $5,760.00 $5,932.80 $6,110.78 $6,294.11 $6,482.93 $6,677.42 $6,877.74 $7,084.07 $7,296.60 $7,515.49 $7,740.96 $7,973.19 $8,212.38 $8,458.75 $8,712.52reserves $3,600.00 $3,708.00 $3,819.24 $3,933.82 $4,051.83 $4,173.39 $4,298.59 $4,427.55 $4,560.37 $4,697.18 $4,838.10 $4,983.24 $5,132.74 $5,286.72 $5,445.32operational expense $47,568.00 $48,995.04 $50,464.89 $51,978.84 $53,538.20 $55,144.35 $56,798.68 $58,502.64 $60,257.72 $62,065.45 $63,927.41 $65,845.24 $67,820.59 $69,855.21 $71,950.87
debt service principal and interest $117,088.00 $120,352.00 $120,352.00 $120,352.00 $120,352.00 $120,352.00 $120,352.00 $120,352.00 $120,352.00 $120,352.00 $120,352.00 $120,352.00 $120,352.00 $120,352.00 $120,352.00
net income-vacancy rate $4,261.76 $2,949.08 $4,925.15 $6,926.04 $8,951.81 $11,002.51 $13,078.15 $15,178.77 $17,304.36 $19,454.91 $21,630.39 $23,830.77 $26,055.97 $28,305.92 $30,580.53Second Net Income -$3,238.24 -$4,700.92 -$2,877.85 -$1,033.02 $833.57 $2,721.90 $4,631.94 $6,563.63 $8,516.91 $10,491.71 $12,487.93 $14,505.46 $16,544.16 $18,603.87 $20,684.44return to investors at 10 $7,500.00 $7,650.00 $7,803.00 $7,959.06 $8,118.24 $8,280.61 $8,446.22 $8,615.14 $8,787.45 $8,963.19 $9,142.46 $9,325.31 $9,511.81 $9,702.05 $9,896.09
24

12 rent 1.4 unrestricted total rent $15,136.00
one bed room 0 605 0 0 900 0 0 900 0two bedroom 2 726 1452 1 1162 1162 3 1400 4200three bed room 1 838 838 2 1342 2684 3 1600 4800
2290 3846 90000 0 0
total 3 3 6
investors 150000
0.057500 $625.00
unit number of units monthly Yearly
Supplies 10 12 $120.00 $1,440.00Maintenance 60 12 $720.00 $8,640.00Ad/Promotion 5 12 $60.00 $720.00Acct & Legal 5 12 $60.00 $720.00Telephone 2 12 $24.00 $288.00heat 70 6 $420.00 $5,040.00common utilities 10 12 $120.00 $1,440.00 Insurance 40 12 $480.00 $5,760.00manange,emt fee 35 12 $420.00 $5,040.00Real Estate Taxes 70 0 $0.00 $0.00grounds snow and lawn 40 12 $480.00 $5,760.00water sewer garbage 60 12 $720.00 $8,640.00reserve account 25 12 $300.00 $3,600.00
25

Client Name: Client Name The North Dakota Small Business Development Center has prepared these FINANCIAL STATEMENT: Pro Forma Income Statement financial projections from information communicated by the Client.
Date Prepared Date We are not licensed by the state of North Dakota to practice Public Accountingand can therefore give no opinion or assurance on the statements.
Year 1 Jan-14 Feb-14 Mar-14 Apr-14 May-14 Jun-14 Jul-14 Aug-14 Sep-14 Oct-14 Nov-14 Dec-14 TOTALS
REVENUE $15,136 $15,136 $15,136 $15,136 $15,136 $15,136 $15,136 $15,136 $15,136 $15,136 $15,136 $15,136 $181,632 100.0%
COST OF GOODS SOLD $0 $0 $0 $0 $0 $0 $0 $0 $0 $0 $0 $0 $0 0.0%
GROSS PROFIT $15,136 $15,136 $15,136 $15,136 $15,136 $15,136 $15,136 $15,136 $15,136 $15,136 $15,136 $15,136 $181,632 100.0%
EXPENSES: #
Ow ner's Salary # $0 $0 $0 $0 $0 $0 $0 $0 $0 $0 $0 $0 $0 0.0%
Ow ner Payroll Taxes 15.30% $0 $0 $0 $0 $0 $0 $0 $0 $0 $0 $0 $0 $0 0.0%
Bad Debts 0.00% $0 $0 $0 $0 $0 $0 $0 $0 $0 $0 $0 $0 $0 0.0%
Outside Services # $0 $0 $0 $0 $0 $0 $0 $0 $0 $0 $0 $0 $0 0.0%
Supplies # $140 $140 $120 $140 $140 $140 $140 $140 $140 $140 $140 $140 $1,660 0.9%
Maintenance # $600 $600 $600 $600 $600 $600 $600 $600 $600 $600 $600 $600 $7,200 4.0%
Ad/Promotion # $70 $70 $120 $70 $70 $70 $70 $70 $70 $70 $70 $70 $890 0.5%
Office Expense # $0 $0 $0 $0 $0 $0 $0 $0 $0 $0 $0 $0 $0 0.0%
common utilities # $140 $140 $140 $140 $140 $140 $140 $140 $140 $140 $140 $140 $1,680 0.9%
Acct & Legal # $70 $70 $70 $70 $70 $70 $70 $70 $70 $70 $70 $70 $840 0.5%
management # $720 $720 $720 $720 $720 $720 $720 $720 $720 $720 $720 $720 $8,640 4.8%
Telephone # $50 $50 $48 $50 $50 $50 $50 $50 $50 $50 $50 $50 $598 0.3%
w ater sew er garbage # $800 $800 $800 $800 $800 $800 $800 $800 $800 $800 $800 $800 $9,600 5.3%
Insurance # $500 $500 $500 $500 $500 $500 $500 $500 $500 $500 $500 $500 $6,000 3.3%
return to investors # $0 $0 $0 $0 $0 $0 $0 $0 $0 $0 $0 $0 $0 0.0%
Real Estate Taxes # $0 $0 $0 $0 $0 $0 $0 $0 $0 $0 $0 $0 $0 0.0%
low income utilities # $490 $490 $490 $490 $490 $490 $490 $490 $490 $490 $490 $490 $5,880 3.2%
grounds snow and grass # $560 $560 $560 $560 $560 $560 $560 $560 $560 $560 $560 $560 $6,720 3.7%
reserves # $350 $350 $350 $350 $350 $350 $350 $350 $350 $350 $350 $350 $4,200 2.3%
Int - Loan 1 $1,358 $1,351 $1,344 $1,337 $1,330 $1,323 $1,316 $1,309 $1,302 $1,295 $1,288 $1,281 $15,837 8.7%
Int - Loan 2 $0 $0 $0 $0 $0 $0 $0 $0 $0 $0 $0 $0 $0 0.0%
Int - Loan 3 $0 $0 $0 $0 $0 $0 $0 $0 $0 $0 $0 $0 $0 0.0%
Int-Line of Credit 0.00% $0 $0 $0 $0 $0 $0 $0 $0 $0 $0 $0 $0 $0 0.0%
Depreciation $0 $0 $0 $0 $0 $0 $0 $0 $0 $0 $0 $0 $0 0.0%
Amortization $0 $0 $0 $0 $0 $0 $0 $0 $0 $0 $0 $0 $0 0.0%
TOTAL EXPENSES $5,848 $5,841 $5,862 $5,827 $5,820 $5,813 $5,806 $5,799 $5,792 $5,785 $5,778 $5,771 $69,745 38.4%
NET PROFIT BEFORE TAX $9,288 $9,295 $9,274 $9,309 $9,316 $9,323 $9,330 $9,337 $9,344 $9,351 $9,358 $9,365 $111,887 61.6%
INCOME TAX 0.0% $0 $0 $0 $0 $0 $0 $0 $0 $0 $0 $0 $0 $0 0.0%
NET INCOME $9,288 $9,295 $9,274 $9,309 $9,316 $9,323 $9,330 $9,337 $9,344 $9,351 $9,358 $9,365 $111,887 61.6%
PROFIT CENTERS
p1 tw o bed low $1,452 $1,452 $1,452 $1,452 $1,452 $1,452 $1,452 $1,452 $1,452 $1,452 $1,452 $1,452 $17,424 10%
p2 three bed low $838 $838 $838 $838 $838 $838 $838 $838 $838 $838 $838 $838 $10,056 6%
p3 tw o bed mod $1,162 $1,162 $1,162 $1,162 $1,162 $1,162 $1,162 $1,162 $1,162 $1,162 $1,162 $1,162 $13,944 8%
p4 three bed mod $2,684 $2,684 $2,684 $2,684 $2,684 $2,684 $2,684 $2,684 $2,684 $2,684 $2,684 $2,684 $32,208 18%
p5 tw o bed open $4,200 $4,200 $4,200 $4,200 $4,200 $4,200 $4,200 $4,200 $4,200 $4,200 $4,200 $4,200 $50,400 28%
p6 three bed open $4,800 $4,800 $4,800 $4,800 $4,800 $4,800 $4,800 $4,800 $4,800 $4,800 $4,800 $4,800 $57,600 32%
TOTAL $15,136 $15,136 $15,136 $15,136 $15,136 $15,136 $15,136 $15,136 $15,136 $15,136 $15,136 $15,136 $181,632 100%
COGS
TOTAL $0 $0 $0 $0 $0 $0 $0 $0 $0 $0 $0 $0 $026

27
Client Name: Client Name The North Dakota Small Business Development Center has prepared these FINANCIAL STATEMENT: Pro Forma Cash Flow financial projections from information communicated by the Client. Date Prepared Date We are not licensed by the state of North Dakota to practice Public Accounting
and can therefore give no opinion or assurance on the statements.
BUDGET MONTH Year 1 Jan-14 Feb-14 Mar-14 Apr-14 May-14 Jun-14 Jul-14 Aug-14 Sep-14 Oct-14 Nov-14 Dec-14 TOTALCASH INFLOW
Cash Sales $15,136 $15,136 $15,136 $15,136 $15,136 $15,136 $15,136 $15,136 $15,136 $15,136 $15,136 $15,136 $181,632Collection from Credit $0 $0 $0 $0 $0 $0 $0 $0 $0 $0 $0 $0 $0
Draw /(Repay) LOC $0 $0 $0 $0 $0 $0 $0 $0 $0 $0 $0 $0 $0
Notes Injected / (Repaid) $0 $0 $0 $0 $0 $0 $0 $0 $0 $0 $0 $0 $0
Loan Injection (Net of Fees) $0 $0 $0 $0 $0 $0 $0 $0 $0 $0 $0 $0 $0
Equity Injection $0 $0 $0 $0 $0 $0 $0 $0 $0 $0 $0 $0 $0
TOTAL CASH RECEIVED $15,136 $15,136 $15,136 $15,136 $15,136 $15,136 $15,136 $15,136 $15,136 $15,136 $15,136 $15,136 $181,632
CASH PAID OUT
Outside Services $0 $0 $0 $0 $0 $0 $0 $0 $0 $0 $0 $0 $0
Supplies $140 $140 $120 $140 $140 $140 $140 $140 $140 $140 $140 $140 $1,660
Maintenance $600 $600 $600 $600 $600 $600 $600 $600 $600 $600 $600 $600 $7,200
Ad/Promotion $70 $70 $120 $70 $70 $70 $70 $70 $70 $70 $70 $70 $890
Office Expense $0 $0 $0 $0 $0 $0 $0 $0 $0 $0 $0 $0 $0
common utilities $140 $140 $140 $140 $140 $140 $140 $140 $140 $140 $140 $140 $1,680
Acct & Legal $70 $70 $70 $70 $70 $70 $70 $70 $70 $70 $70 $70 $840
management $720 $720 $720 $720 $720 $720 $720 $720 $720 $720 $720 $720 $8,640
Telephone $50 $50 $48 $50 $50 $50 $50 $50 $50 $50 $50 $50 $598
w ater sew er garbage $800 $800 $800 $800 $800 $800 $800 $800 $800 $800 $800 $800 $9,600
Insurance $500 $500 $500 $500 $500 $500 $500 $500 $500 $500 $500 $500 $6,000
return to investors $0 $0 $0 $0 $0 $0 $0 $0 $0 $0 $0 $0 $0
Real Estate Taxes $0 $0 $0 $0 $0 $0 $0 $0 $0 $0 $0 $0 $0
low income utilities $490 $490 $490 $490 $490 $490 $490 $490 $490 $490 $490 $490 $5,880
grounds snow and grass $560 $560 $560 $560 $560 $560 $560 $560 $560 $560 $560 $560 $6,720
reserves $350 $350 $350 $350 $350 $350 $350 $350 $350 $350 $350 $350 $4,200
Other $0 $0 $0 $0 $0 $0 $0 $0 $0 $0 $0 $0 $0
Int - Loan 1 $1,358 $1,351 $1,344 $1,337 $1,330 $1,323 $1,316 $1,309 $1,302 $1,295 $1,288 $1,281 $15,837
Int - Loan 2 $0 $0 $0 $0 $0 $0 $0 $0 $0 $0 $0 $0 $0
Depreciation $0 $0 $0 $0 $0 $0 $0 $0 $0 $0 $0 $0 $0
Amortization $0 $0 $0 $0 $0 $0 $0 $0 $0 $0 $0 $0 $0
Subtotal $5,848 $5,841 $5,862 $5,827 $5,820 $5,813 $5,806 $5,799 $5,792 $5,785 $5,778 $5,771 $69,745
Princ. Pmt - Loan 1 $8,397 $8,404 $8,411 $8,418 $8,425 $8,432 $8,439 $8,446 $8,453 $8,460 $8,467 $8,474 $101,229
Princ. Pmt - Loan 2 $0 $0 $0 $0 $0 $0 $0 $0 $0 $0 $0 $0 $0
Capital Purchases $0 $0 $0 $0 $0 $0 $0 $0 $0 $0 $0 $0 $0
Income Taxes $0 $0 $0 $0 $0 $0 $0 $0 $0 $0 $0 $0 $0
Ow ner's Withdraw al $0 $0 $0 $0 $0 $0 $0 $0 $0 $0 $0 $0 $0
TOTAL CASH PAID $14,245 $14,245 $14,273 $14,245 $14,245 $14,245 $14,245 $14,245 $14,245 $14,245 $14,245 $14,245 $170,974
CHANGE IN CASH $891 $891 $863 $891 $891 $891 $891 $891 $891 $891 $891 $891 $10,658
Beginning Balance $0 $891 $1,781 $2,644 $3,534 $4,425 $5,315 $6,206 $7,096 $7,987 $8,877 $9,768
Ending Balance $891 $1,781 $2,644 $3,534 $4,425 $5,315 $6,206 $7,096 $7,987 $8,877 $9,768 $10,658

Debt Coverage Ratio Analysis Projected Year 1
Net Profit Before Taxes $111,887
+ Depreciation $0
+ Amortization $0
+ Interest $15,837
- Increase in Permanent Working Capital $0
- New Capital Expenditures (Net of New Loans Injected) $0
= Total Cash Flow Available for D/S $127,724
/ Total Debt Service $117,066
= Debt Coverage Ratio 1.09
28

• We can run several different scenarios so you can fine tune the rent to best possible level for your project and your community and make sure it fits what you are trying to accomplish.
29

3030
Questions?North Dakota Housing Finance Agency
www.ndhfa.orgBill Hourigan
Housing Outreach Officer701/328-8080 or 800/292-8621
[email protected] Olson
SBDC Director
Williston State College SBDC 1-701-570-4260