Western New England Univeristy Poll
13
EARLY POLLING FINDS DEMOCRATS IN COMMAND IN MASSACHUSETTS Voters give positive marks to Clinton and Sanders and take a dim view of Trump TABLES Next, please tell me if you have a favorable or unfavorable opinion of the following people. If you haven't heard of them or don't have an opinion of them, just tell me and we'll move on. Do you have a favorable or unfavorable opinion of (name). (Names of declared and potential candidates for president were rotated in random order in the survey.) Favorable – Unfavorable Ratings for Hillary Clinton Favorable Unfavorable Haven’t heard of No opinion Refused (Vol.) N* Oct. 1 – 8, 2015 Registered voters 52% 41% 0% 6% 1% 425 Party Registration** Democrat 76% 16% 0% 7% 1% 154 Republican 18% 80% 0% 1% 1% 51 Unenrolled / Independent 41% 50% 0% 8% 1% 208 Gender Male 41% 54% 0% 5% 1% 204 Female 61% 31% 0% 8% 1% 221 * Samples are unweighted N’s and consist of registered voters. Row percentages may not sum to 100 percent due to rounding. ** Party registration was measured with the following question: Thinking about your voter registration that is on file with your local election office, are you registered as a Democrat, Republican, unenrolled or independent voter, or something else? Favorable – Unfavorable Ratings for Bernie Sanders Favorable Unfavorable Haven’t heard of No opinion Refused (Vol.) N* Oct. 1 – 8, 2015 Registered voters 48% 23% 8% 20% 1% 425 Party Registration Democrat 64% 13% 8% 15% 1% 154 Republican 13% 54% 12% 21% 0% 51 Unenrolled / Independent 47% 23% 5% 23% 1% 208 Gender Male 41% 37% 5% 17% 1% 204 Female 55% 12% 11% 22% 1% 221
-
Upload
jim-kinney -
Category
Documents
-
view
1.623 -
download
0
description
Showing presidential race strengths.
Transcript of Western New England Univeristy Poll
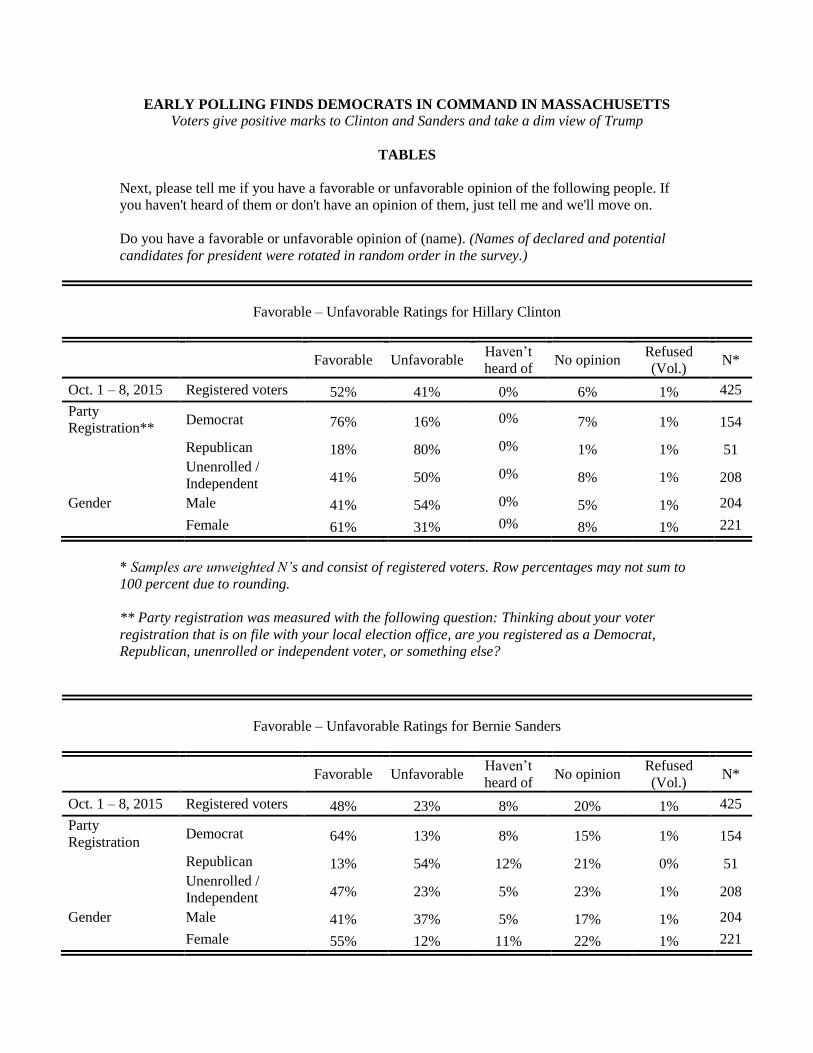
EARLY POLLING FINDS DEMOCRATS IN COMMAND IN MASSACHUSETTS
Voters give positive marks to Clinton and Sanders and take a dim view of Trump
TABLES
Next, please tell me if you have a favorable or unfavorable opinion of the following people. If
you haven't heard of them or don't have an opinion of them, just tell me and we'll move on.
Do you have a favorable or unfavorable opinion of (name). (Names of declared and potential
candidates for president were rotated in random order in the survey.)
Favorable – Unfavorable Ratings for Hillary Clinton
Favorable Unfavorable
Haven’t
heard of No opinion
Refused
(Vol.) N*
Oct. 1 – 8, 2015 Registered voters 52% 41% 0% 6% 1% 425
Party
Registration** Democrat 76% 16% 0% 7% 1% 154
Republican 18% 80% 0% 1% 1% 51
Unenrolled /
Independent 41% 50% 0% 8% 1% 208
Gender Male 41% 54% 0% 5% 1% 204
Female 61% 31% 0% 8% 1% 221
* Samples are unweighted N’s and consist of registered voters. Row percentages may not sum to
100 percent due to rounding.
** Party registration was measured with the following question: Thinking about your voter
registration that is on file with your local election office, are you registered as a Democrat,
Republican, unenrolled or independent voter, or something else?
Favorable – Unfavorable Ratings for Bernie Sanders
Favorable Unfavorable
Haven’t
heard of No opinion
Refused
(Vol.) N*
Oct. 1 – 8, 2015 Registered voters 48% 23% 8% 20% 1% 425
Party
Registration Democrat 64% 13% 8% 15% 1% 154
Republican 13% 54% 12% 21% 0% 51
Unenrolled /
Independent 47% 23% 5% 23% 1% 208
Gender Male 41% 37% 5% 17% 1% 204
Female 55% 12% 11% 22% 1% 221
2
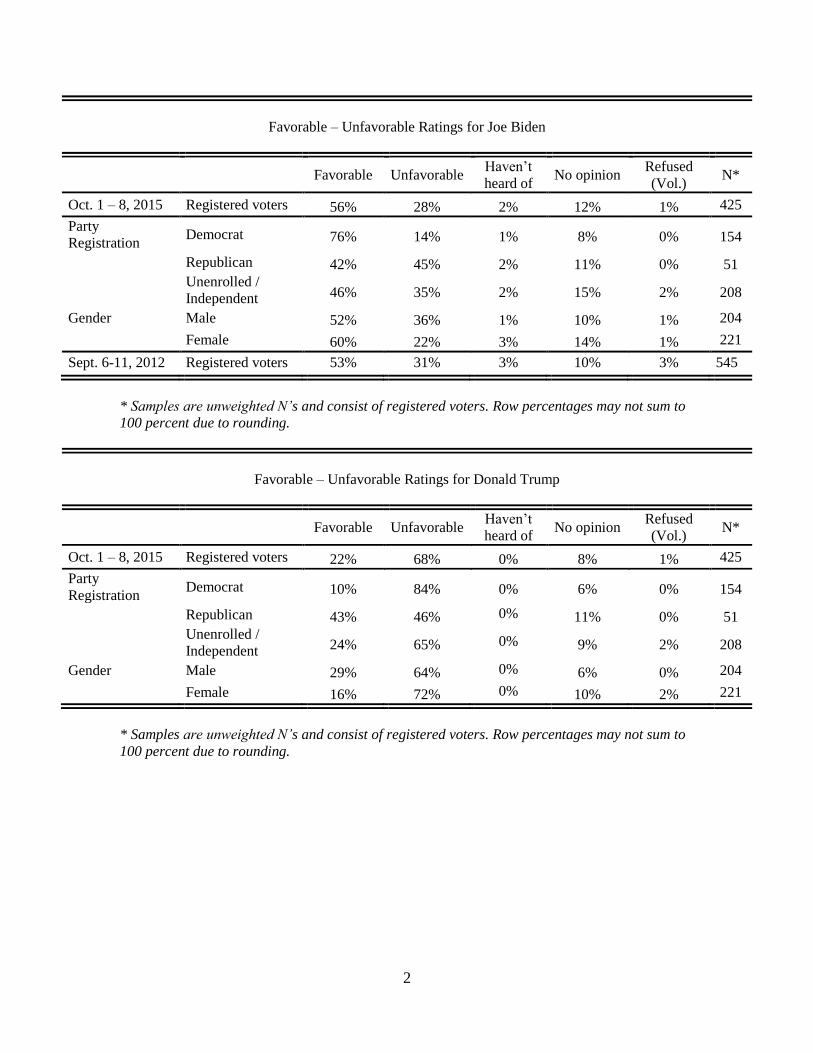
Favorable – Unfavorable Ratings for Joe Biden
Favorable Unfavorable
Haven’t
heard of No opinion
Refused
(Vol.) N*
Oct. 1 – 8, 2015 Registered voters 56% 28% 2% 12% 1% 425
Party
Registration Democrat 76% 14% 1% 8% 0% 154
Republican 42% 45% 2% 11% 0% 51
Unenrolled /
Independent 46% 35% 2% 15% 2% 208
Gender Male 52% 36% 1% 10% 1% 204
Female 60% 22% 3% 14% 1% 221
Sept. 6-11, 2012 Registered voters 53% 31% 3% 10% 3% 545
* Samples are unweighted N’s and consist of registered voters. Row percentages may not sum to
100 percent due to rounding.
Favorable – Unfavorable Ratings for Donald Trump
Favorable Unfavorable
Haven’t
heard of No opinion
Refused
(Vol.) N*
Oct. 1 – 8, 2015 Registered voters 22% 68% 0% 8% 1% 425
Party
Registration Democrat 10% 84% 0% 6% 0% 154
Republican 43% 46% 0% 11% 0% 51
Unenrolled /
Independent 24% 65% 0% 9% 2% 208
Gender Male 29% 64% 0% 6% 0% 204
Female 16% 72% 0% 10% 2% 221
* Samples are unweighted N’s and consist of registered voters. Row percentages may not sum to
100 percent due to rounding.
3
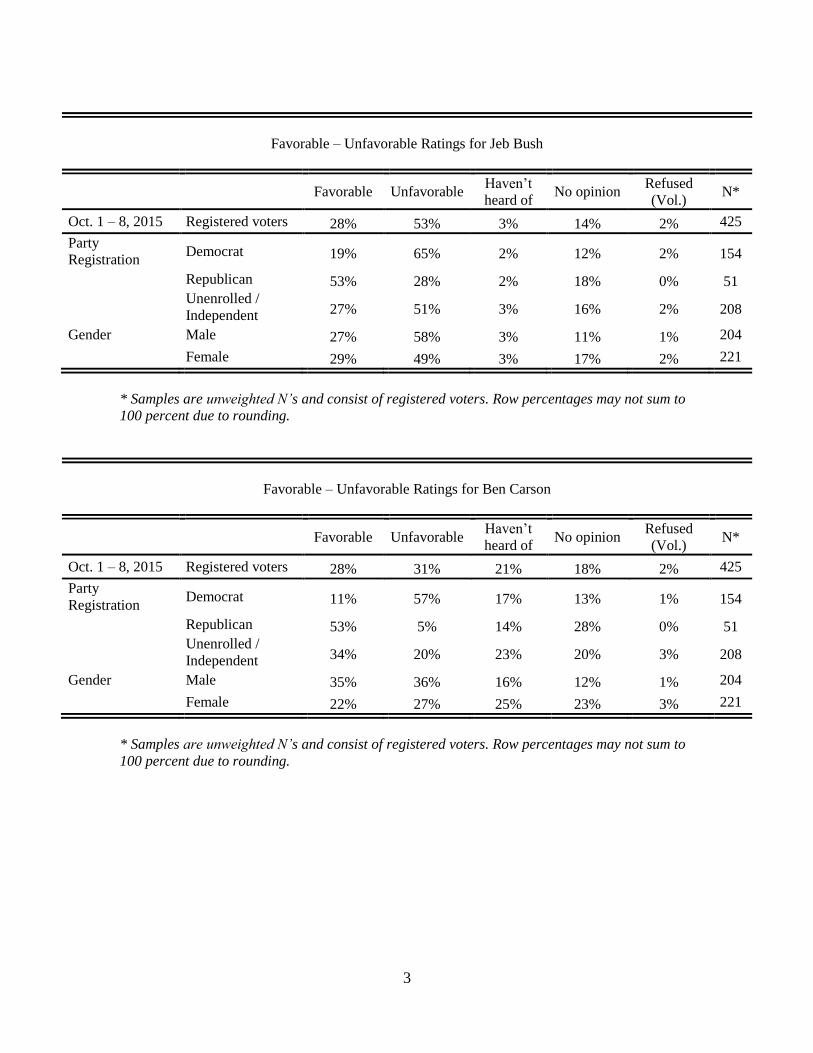
Favorable – Unfavorable Ratings for Jeb Bush
Favorable Unfavorable
Haven’t
heard of No opinion
Refused
(Vol.) N*
Oct. 1 – 8, 2015 Registered voters 28% 53% 3% 14% 2% 425
Party
Registration Democrat 19% 65% 2% 12% 2% 154
Republican 53% 28% 2% 18% 0% 51
Unenrolled /
Independent 27% 51% 3% 16% 2% 208
Gender Male 27% 58% 3% 11% 1% 204
Female 29% 49% 3% 17% 2% 221
* Samples are unweighted N’s and consist of registered voters. Row percentages may not sum to
100 percent due to rounding.
Favorable – Unfavorable Ratings for Ben Carson
Favorable Unfavorable
Haven’t
heard of No opinion
Refused
(Vol.) N*
Oct. 1 – 8, 2015 Registered voters 28% 31% 21% 18% 2% 425
Party
Registration Democrat 11% 57% 17% 13% 1% 154
Republican 53% 5% 14% 28% 0% 51
Unenrolled /
Independent 34% 20% 23% 20% 3% 208
Gender Male 35% 36% 16% 12% 1% 204
Female 22% 27% 25% 23% 3% 221
* Samples are unweighted N’s and consist of registered voters. Row percentages may not sum to
100 percent due to rounding.
4
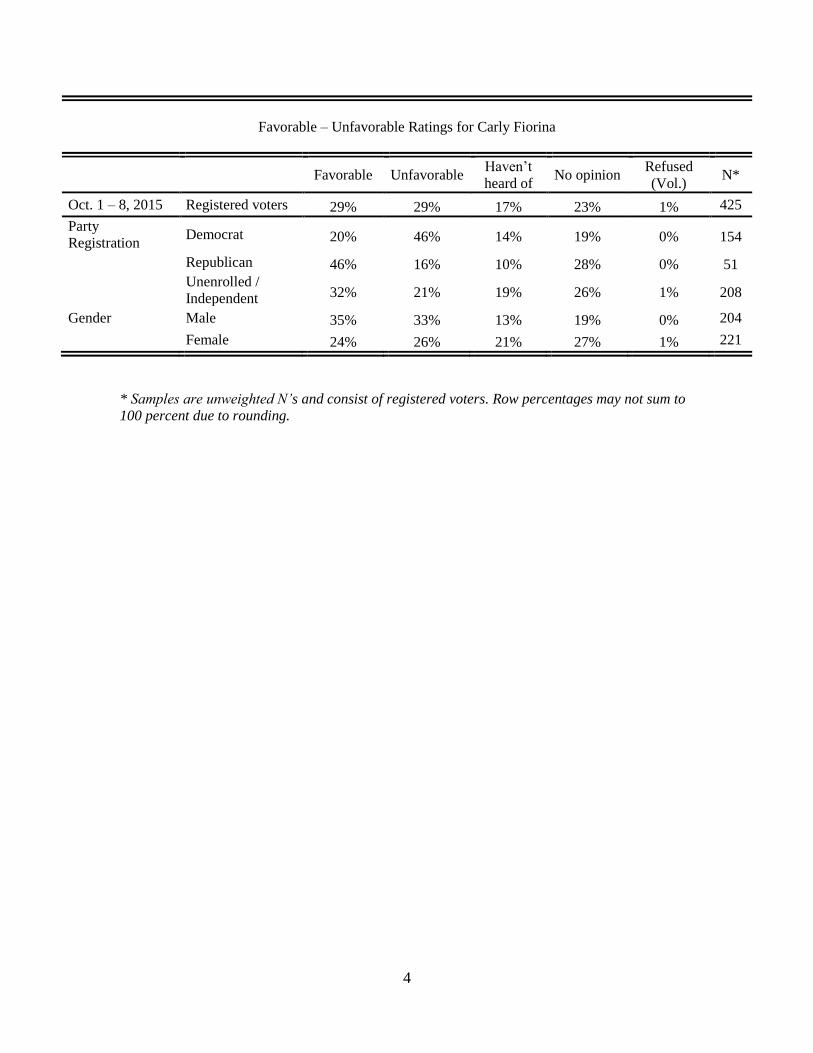
Favorable – Unfavorable Ratings for Carly Fiorina
Favorable Unfavorable
Haven’t
heard of No opinion
Refused
(Vol.) N*
Oct. 1 – 8, 2015 Registered voters 29% 29% 17% 23% 1% 425
Party
Registration Democrat 20% 46% 14% 19% 0% 154
Republican 46% 16% 10% 28% 0% 51
Unenrolled /
Independent 32% 21% 19% 26% 1% 208
Gender Male 35% 33% 13% 19% 0% 204
Female 24% 26% 21% 27% 1% 221
* Samples are unweighted N’s and consist of registered voters. Row percentages may not sum to
100 percent due to rounding.
5
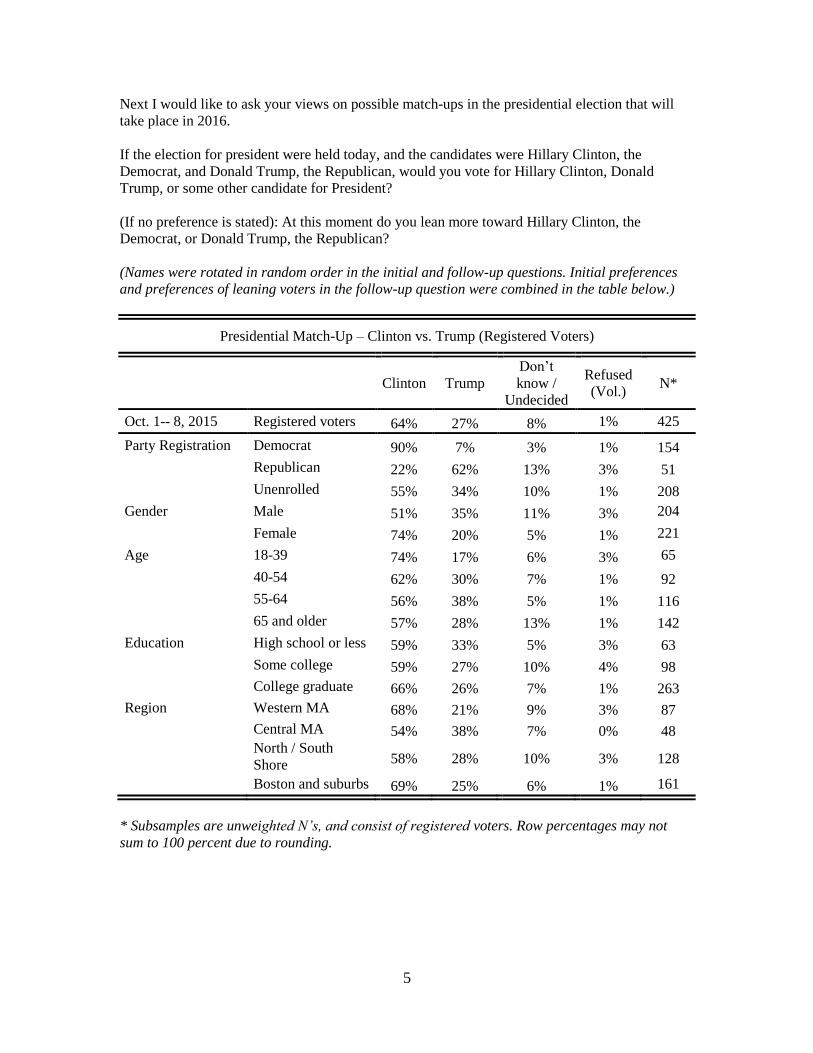
Next I would like to ask your views on possible match-ups in the presidential election that will
take place in 2016.
If the election for president were held today, and the candidates were Hillary Clinton, the
Democrat, and Donald Trump, the Republican, would you vote for Hillary Clinton, Donald
Trump, or some other candidate for President?
(If no preference is stated): At this moment do you lean more toward Hillary Clinton, the
Democrat, or Donald Trump, the Republican?
(Names were rotated in random order in the initial and follow-up questions. Initial preferences
and preferences of leaning voters in the follow-up question were combined in the table below.)
Presidential Match-Up – Clinton vs. Trump (Registered Voters)
Clinton Trump
Don’t
know /
Undecided
Refused
(Vol.) N*
Oct. 1-- 8, 2015 Registered voters 64% 27% 8% 1% 425
Party Registration Democrat 90% 7% 3% 1% 154
Republican 22% 62% 13% 3% 51
Unenrolled 55% 34% 10% 1% 208
Gender Male 51% 35% 11% 3% 204
Female 74% 20% 5% 1% 221
Age 18-39 74% 17% 6% 3% 65
40-54 62% 30% 7% 1% 92
55-64 56% 38% 5% 1% 116
65 and older 57% 28% 13% 1% 142
Education High school or less 59% 33% 5% 3% 63
Some college 59% 27% 10% 4% 98
College graduate 66% 26% 7% 1% 263
Region Western MA 68% 21% 9% 3% 87
Central MA 54% 38% 7% 0% 48
North / South
Shore 58% 28% 10% 3% 128
Boston and suburbs 69% 25% 6% 1% 161
* Subsamples are unweighted N’s, and consist of registered voters. Row percentages may not
sum to 100 percent due to rounding.
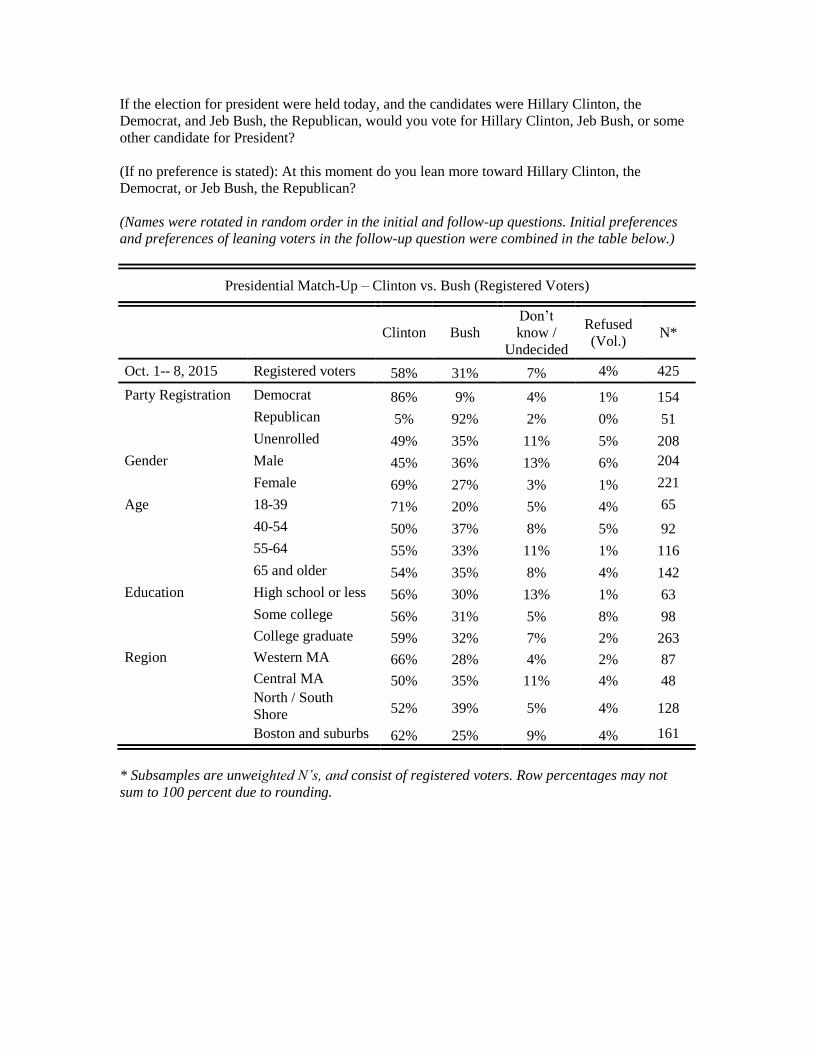
If the election for president were held today, and the candidates were Hillary Clinton, the
Democrat, and Jeb Bush, the Republican, would you vote for Hillary Clinton, Jeb Bush, or some
other candidate for President?
(If no preference is stated): At this moment do you lean more toward Hillary Clinton, the
Democrat, or Jeb Bush, the Republican?
(Names were rotated in random order in the initial and follow-up questions. Initial preferences
and preferences of leaning voters in the follow-up question were combined in the table below.)
Presidential Match-Up – Clinton vs. Bush (Registered Voters)
Clinton Bush
Don’t
know /
Undecided
Refused
(Vol.) N*
Oct. 1-- 8, 2015 Registered voters 58% 31% 7% 4% 425
Party Registration Democrat 86% 9% 4% 1% 154
Republican 5% 92% 2% 0% 51
Unenrolled 49% 35% 11% 5% 208
Gender Male 45% 36% 13% 6% 204
Female 69% 27% 3% 1% 221
Age 18-39 71% 20% 5% 4% 65
40-54 50% 37% 8% 5% 92
55-64 55% 33% 11% 1% 116
65 and older 54% 35% 8% 4% 142
Education High school or less 56% 30% 13% 1% 63
Some college 56% 31% 5% 8% 98
College graduate 59% 32% 7% 2% 263
Region Western MA 66% 28% 4% 2% 87
Central MA 50% 35% 11% 4% 48
North / South
Shore 52% 39% 5% 4% 128
Boston and suburbs 62% 25% 9% 4% 161
* Subsamples are unweighted N’s, and consist of registered voters. Row percentages may not
sum to 100 percent due to rounding.
7
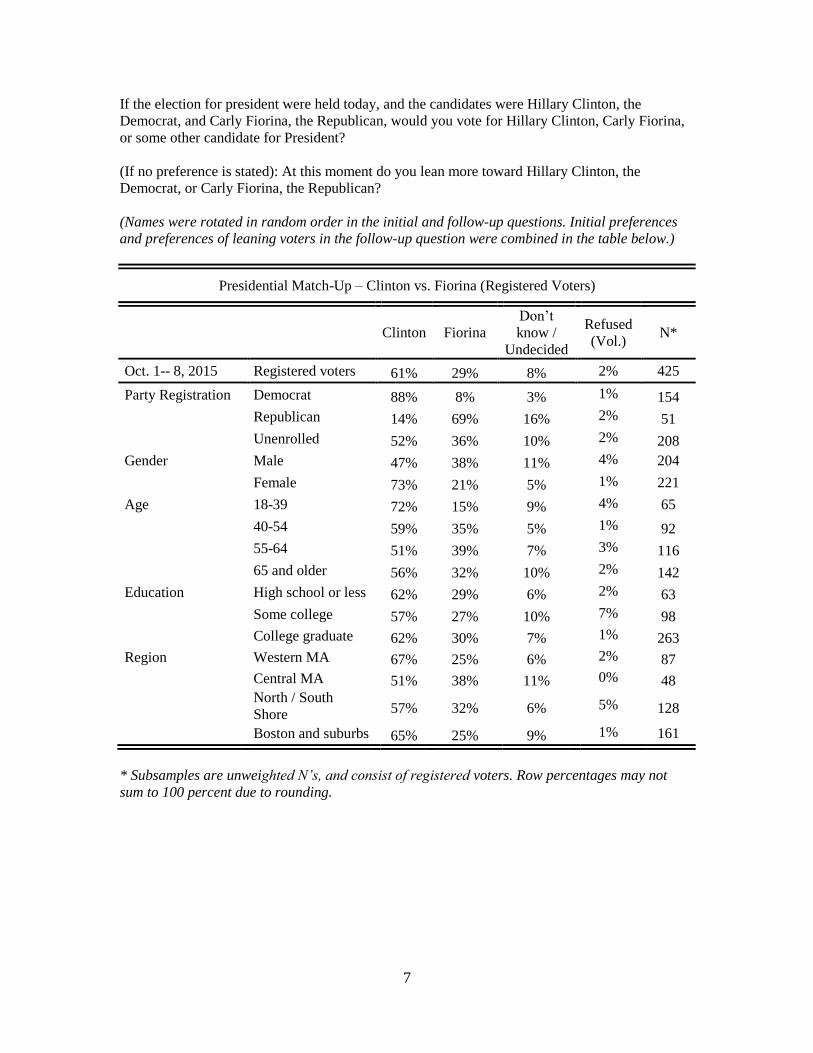
If the election for president were held today, and the candidates were Hillary Clinton, the
Democrat, and Carly Fiorina, the Republican, would you vote for Hillary Clinton, Carly Fiorina,
or some other candidate for President?
(If no preference is stated): At this moment do you lean more toward Hillary Clinton, the
Democrat, or Carly Fiorina, the Republican?
(Names were rotated in random order in the initial and follow-up questions. Initial preferences
and preferences of leaning voters in the follow-up question were combined in the table below.)
Presidential Match-Up – Clinton vs. Fiorina (Registered Voters)
Clinton Fiorina
Don’t
know /
Undecided
Refused
(Vol.) N*
Oct. 1-- 8, 2015 Registered voters 61% 29% 8% 2% 425
Party Registration Democrat 88% 8% 3% 1% 154
Republican 14% 69% 16% 2% 51
Unenrolled 52% 36% 10% 2% 208
Gender Male 47% 38% 11% 4% 204
Female 73% 21% 5% 1% 221
Age 18-39 72% 15% 9% 4% 65
40-54 59% 35% 5% 1% 92
55-64 51% 39% 7% 3% 116
65 and older 56% 32% 10% 2% 142
Education High school or less 62% 29% 6% 2% 63
Some college 57% 27% 10% 7% 98
College graduate 62% 30% 7% 1% 263
Region Western MA 67% 25% 6% 2% 87
Central MA 51% 38% 11% 0% 48
North / South
Shore 57% 32% 6% 5% 128
Boston and suburbs 65% 25% 9% 1% 161
* Subsamples are unweighted N’s, and consist of registered voters. Row percentages may not
sum to 100 percent due to rounding.
8
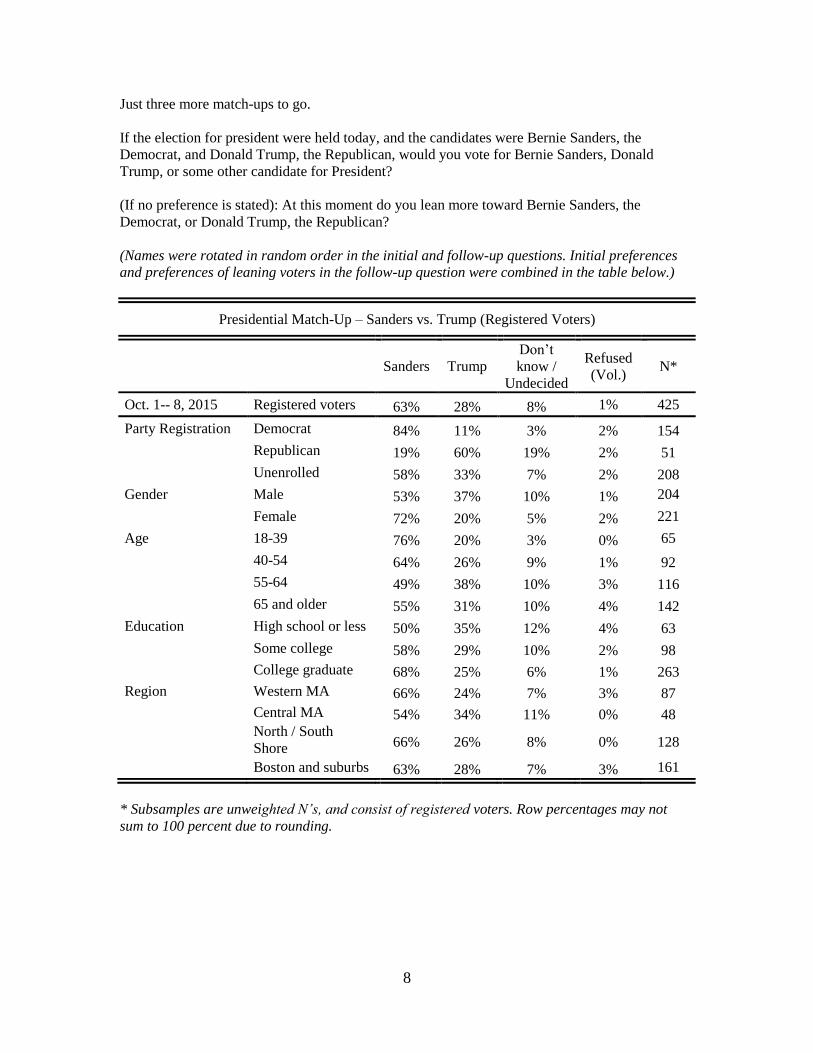
Just three more match-ups to go.
If the election for president were held today, and the candidates were Bernie Sanders, the
Democrat, and Donald Trump, the Republican, would you vote for Bernie Sanders, Donald
Trump, or some other candidate for President?
(If no preference is stated): At this moment do you lean more toward Bernie Sanders, the
Democrat, or Donald Trump, the Republican?
(Names were rotated in random order in the initial and follow-up questions. Initial preferences
and preferences of leaning voters in the follow-up question were combined in the table below.)
Presidential Match-Up – Sanders vs. Trump (Registered Voters)
Sanders Trump
Don’t
know /
Undecided
Refused
(Vol.) N*
Oct. 1-- 8, 2015 Registered voters 63% 28% 8% 1% 425
Party Registration Democrat 84% 11% 3% 2% 154
Republican 19% 60% 19% 2% 51
Unenrolled 58% 33% 7% 2% 208
Gender Male 53% 37% 10% 1% 204
Female 72% 20% 5% 2% 221
Age 18-39 76% 20% 3% 0% 65
40-54 64% 26% 9% 1% 92
55-64 49% 38% 10% 3% 116
65 and older 55% 31% 10% 4% 142
Education High school or less 50% 35% 12% 4% 63
Some college 58% 29% 10% 2% 98
College graduate 68% 25% 6% 1% 263
Region Western MA 66% 24% 7% 3% 87
Central MA 54% 34% 11% 0% 48
North / South
Shore 66% 26% 8% 0% 128
Boston and suburbs 63% 28% 7% 3% 161
* Subsamples are unweighted N’s, and consist of registered voters. Row percentages may not
sum to 100 percent due to rounding.

9
If the election for president were held today, and the candidates were Bernie Sanders, the
Democrat, and Jeb Bush, the Republican, would you vote for Bernie Sanders, Jeb Bush, or some
other candidate for President?
(If no preference is stated): At this moment do you lean more toward Bernie Sanders, the
Democrat, or Jeb Bush, the Republican?
(Names were rotated in random order in the initial and follow-up questions. Initial preferences
and preferences of leaning voters in the follow-up question were combined in the table below.)
Presidential Match-Up – Sanders vs. Bush (Registered Voters)
Sanders Bush
Don’t
know /
Undecided
Refused
(Vol.) N*
Oct. 1-- 8, 2015 Registered voters 57% 30% 9% 3% 425
Party Registration Democrat 79% 17% 2% 2% 154
Republican 7% 89% 4% 0% 51
Unenrolled 53% 28% 15% 5% 208
Gender Male 49% 35% 14% 2% 204
Female 65% 26% 6% 3% 221
Age 18-39 71% 22% 7% 0% 65
40-54 54% 34% 9% 3% 92
55-64 50% 31% 14% 6% 116
65 and older 48% 36% 11% 5% 142
Education High school or less 54% 27% 16% 3% 63
Some college 57% 30% 7% 6% 98
College graduate 58% 31% 8% 2% 263
Region Western MA 64% 24% 11% 1% 87
Central MA 50% 33% 13% 4% 48
North / South
Shore 57% 32% 9% 1% 128
Boston and suburbs 58% 30% 8% 4% 161
* Subsamples are unweighted N’s, and consist of registered voters. Row percentages may not
sum to 100 percent due to rounding.
10
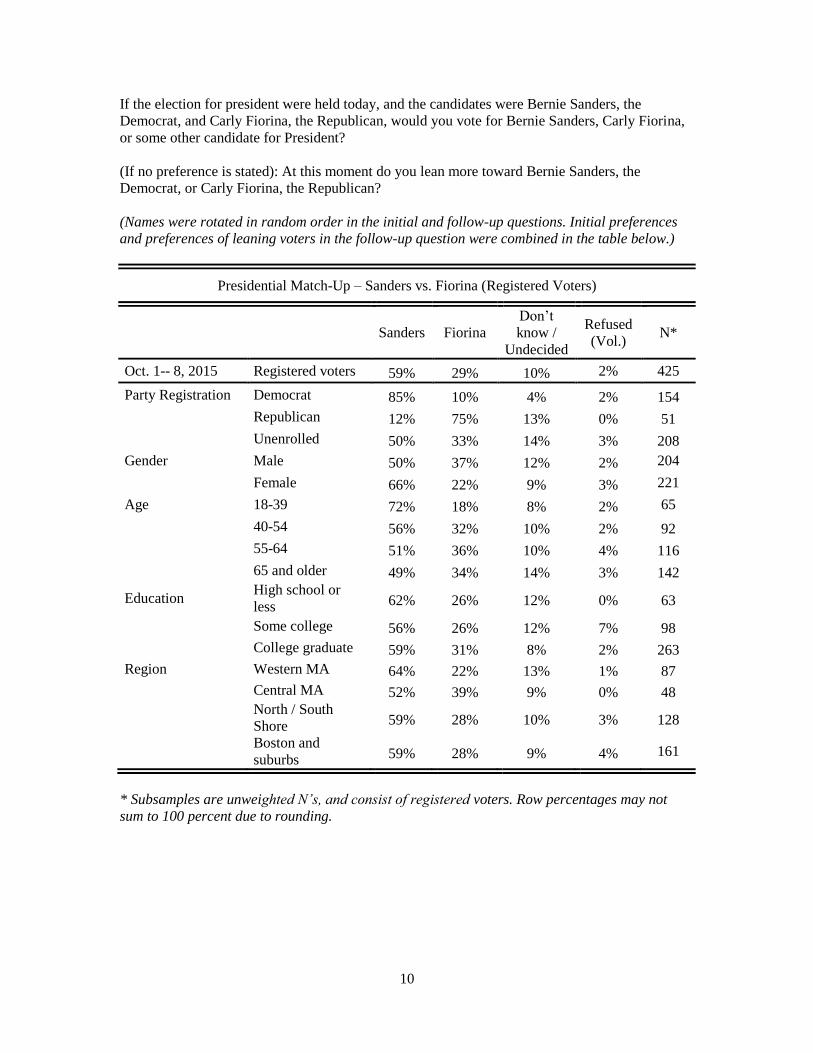
If the election for president were held today, and the candidates were Bernie Sanders, the
Democrat, and Carly Fiorina, the Republican, would you vote for Bernie Sanders, Carly Fiorina,
or some other candidate for President?
(If no preference is stated): At this moment do you lean more toward Bernie Sanders, the
Democrat, or Carly Fiorina, the Republican?
(Names were rotated in random order in the initial and follow-up questions. Initial preferences
and preferences of leaning voters in the follow-up question were combined in the table below.)
Presidential Match-Up – Sanders vs. Fiorina (Registered Voters)
Sanders Fiorina
Don’t
know /
Undecided
Refused
(Vol.) N*
Oct. 1-- 8, 2015 Registered voters 59% 29% 10% 2% 425
Party Registration Democrat 85% 10% 4% 2% 154
Republican 12% 75% 13% 0% 51
Unenrolled 50% 33% 14% 3% 208
Gender Male 50% 37% 12% 2% 204
Female 66% 22% 9% 3% 221
Age 18-39 72% 18% 8% 2% 65
40-54 56% 32% 10% 2% 92
55-64 51% 36% 10% 4% 116
65 and older 49% 34% 14% 3% 142
Education High school or
less 62% 26% 12% 0% 63
Some college 56% 26% 12% 7% 98
College graduate 59% 31% 8% 2% 263
Region Western MA 64% 22% 13% 1% 87
Central MA 52% 39% 9% 0% 48
North / South
Shore 59% 28% 10% 3% 128
Boston and
suburbs 59% 28% 9% 4% 161
* Subsamples are unweighted N’s, and consist of registered voters. Row percentages may not
sum to 100 percent due to rounding.
11
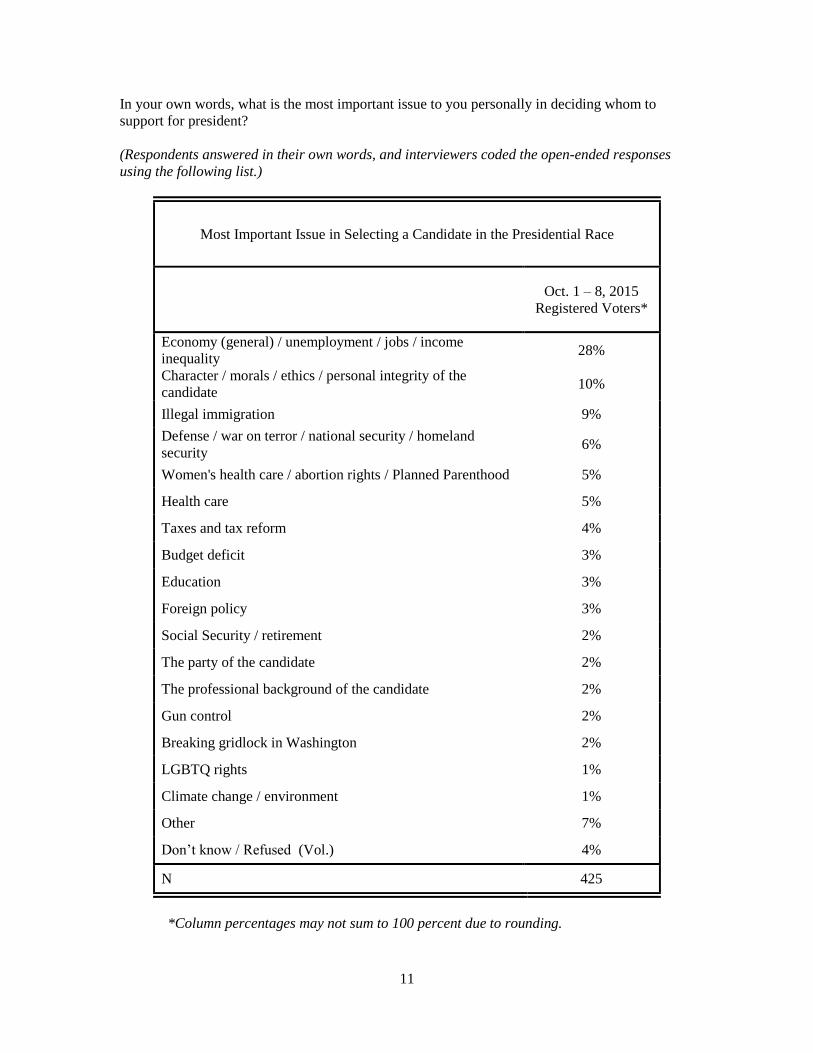
In your own words, what is the most important issue to you personally in deciding whom to
support for president?
(Respondents answered in their own words, and interviewers coded the open-ended responses
using the following list.)
Most Important Issue in Selecting a Candidate in the Presidential Race
Oct. 1 – 8, 2015
Registered Voters*
Economy (general) / unemployment / jobs / income
inequality 28%
Character / morals / ethics / personal integrity of the
candidate 10%
Illegal immigration 9%
Defense / war on terror / national security / homeland
security 6%
Women's health care / abortion rights / Planned Parenthood 5%
Health care 5%
Taxes and tax reform 4%
Budget deficit 3%
Education 3%
Foreign policy 3%
Social Security / retirement 2%
The party of the candidate 2%
The professional background of the candidate 2%
Gun control 2%
Breaking gridlock in Washington 2%
LGBTQ rights 1%
Climate change / environment 1%
Other 7%
Don’t know / Refused (Vol.) 4%
N 425
*Column percentages may not sum to 100 percent due to rounding.

12
How enthusiastic would you say you are about voting for president in next year's election? Extremely enthusiastic, very enthusiastic, somewhat
enthusiastic, not too enthusiastic, or not at all enthusiastic?
Enthusiasm for Voting in the 2016 Presidential Election – Registered Voters
Extremely
Enthusiastic
Very
Enthusiastic
Somewhat
Enthusiastic
Not Very
Enthusiastic
Not At All
Enthusiastic
No
opinion
(Vol.)
N*
Oct. 1-- 8, 2015 Registered
voters 18% 31% 27% 16% 7% 1% 425
Party Registration Democrat 22% 34% 27% 10% 7% 0% 154
Republican 25% 11% 34% 24% 7% 0% 51
Unenrolled 15% 33% 27% 16% 7% 2% 208
CNN / ORC
National Survey,
Sept. 17 – 19,
2015
Registered
voters 31% 24% 24% 10% 10% 1% 924
* Subsamples are unweighted N’s, and consist of registered voters. Row percentages may not sum to 100 percent due to rounding.
13
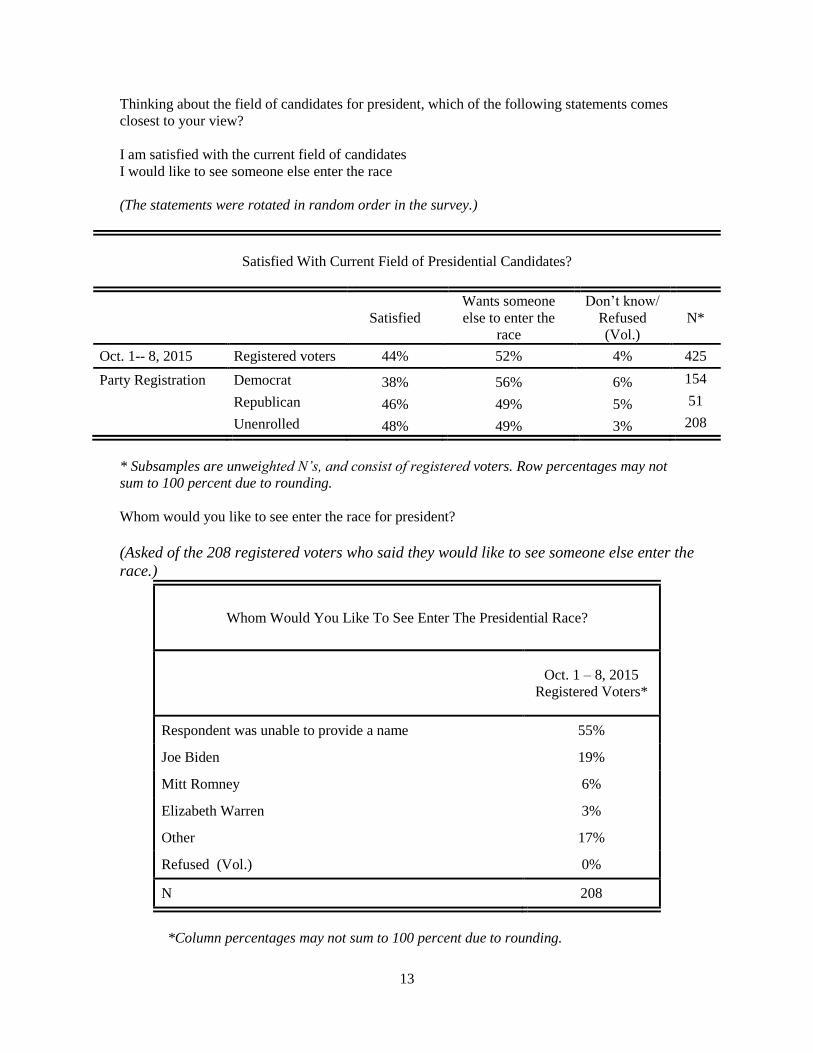
Thinking about the field of candidates for president, which of the following statements comes
closest to your view?
I am satisfied with the current field of candidates
I would like to see someone else enter the race
(The statements were rotated in random order in the survey.)
Satisfied With Current Field of Presidential Candidates?
Satisfied
Wants someone
else to enter the
race
Don’t know/
Refused
(Vol.)
N*
Oct. 1-- 8, 2015 Registered voters 44% 52% 4% 425
Party Registration Democrat 38% 56% 6% 154
Republican 46% 49% 5% 51
Unenrolled 48% 49% 3% 208
* Subsamples are unweighted N’s, and consist of registered voters. Row percentages may not
sum to 100 percent due to rounding.
Whom would you like to see enter the race for president?
(Asked of the 208 registered voters who said they would like to see someone else enter the
race.)
Whom Would You Like To See Enter The Presidential Race?
Oct. 1 – 8, 2015
Registered Voters*
Respondent was unable to provide a name 55%
Joe Biden 19%
Mitt Romney 6%
Elizabeth Warren 3%
Other 17%
Refused (Vol.) 0%
N 208
*Column percentages may not sum to 100 percent due to rounding.