Western blotting of dystrophin: Quantification and ... · Western blotting of dystrophin:...
32
Western blotting of dystrophin: Quantification and correlations Kevin M. Flanigan, MD Center for Gene Therapy Nationwide Children’s Hospital Columbus, OH
Transcript of Western blotting of dystrophin: Quantification and ... · Western blotting of dystrophin:...

Western blotting of dystrophin: Quantification and correlations
Kevin M. Flanigan, MD Center for Gene Therapy Nationwide Children’s Hospital Columbus, OH
Disclosures
• Site principal investigator for PTC Therapeutics, Prosensa, Akashi, and the NIH FOR-DMD study; site co-investigator for Sarepta
• Advisory boards for Sarepta, PTC, Audentes, Eli Lilly, and Italafarmico
• None of the work presented today is directly related to these relationships

Quantification of dystrophin
• Immunofluorescence • Immunoblot
• Challenges of Western blotting include:
• Standardization of electrophoresis and blotting • Choice of antibodies • Methods of imaging • Choices for normalization

• Could we robustly and reproducibly quantify pre- to post-treatment fold changes in dystrophin expression?
• Could we reliably quantitate dystrophin properly localized to the membrane?

Method of quantifying dystrophin intensity at the muscle membrane using spectrin masking
Serial 10 micron muscle sections Primary antibodies:
Mouse monoclonal spectrin (NCL-SPEC1, Leica Microsystems Inc.), 1:100 Rabbit polyclonal C-terminal dystrophin (ab15277, Abcam, Cambridge, Massachusetts, USA), 1:400
Secondary antibodies (both 1:500): Alexa Fluor® 488 F(ab’)2 fragment goat anti-mouse IgG (H+L) (A11017, Molecular Probes, Eugene, Oregon, USA) Alexa Fluor® 568 goat antirabbit IgG (A11036, Molecular Probes)
Mounted in ProLong® Gold antifade reagent (P36934, Molecular Probes).

Method of quantifying dystrophin intensity at the muscle membrane using spectrin masking
12-bit .tiff images are obtained using the confocal microscope. (A) the spectrin image and (B) the dystrophin image files are both opened. (C) A threshold picked by the user is applied to the spectrin image to determine contiguous regions that will create the spectrin mask. (D) The thresholded spectrin image is converted into a binary image where all white pixels have a value of 1 and all black pixels have a value of 0. (E) The binary image is eroded by converting pixels with a value of 1 to 0, if the surrounding pixels are less than or equal to the Neighbourhood value of 3. (F) The eroded image is dilated to restore positive regions lost during the erosion step. Black pixels with a value of 0 are converted to white pixels with a value of 1 if the surrounding white pixels are greater than or equal to the Neighbourhood value of 3. Erode and Dilate used in combination help remove noise. The resulting image is used as the spectrin mask. The spectrin mask is applied to both the (G) spectrin image and (H) the dystrophin image. Colours are used by the Metamorph program to show the mask being applied to the original image. Area and intensity values within the mask are automatically recorded in an Excel spreadsheet.


Western blot method
• 10 muscle sections (10 micron) solubilized in 400 ml lysis buffer on Tissuelyzer II (30 s X 3) • 4.4 mM Tris, pH, 9% SDS, 4% glycerol, 5% b-Mercaptoethanol)
• 25 mg total protein 2–8% Tris-Acetate precast gel (Invitrogen) • Run at 30 V (constant) for 5 h and 30 min, at which time the voltage was increased to 100 V for 1 hour • Transfer to nitrocellulose at 300 mAmps for 18 h at 4°C • Blocked in 5% non-fat dry milk diluted in TBST (0.1% Tween20) for 1.5 h at room temperature • Primary antibodies for 19 hours at 4 deg C:
• dystrophin (Ab15277) at 1 mg/ml • Pan-actin (Neomarkers, Kalamazoo, Michigan, USA) at 0.5 mg/ml) for 19 h at 4°
• Room temp incubation for 30 min with the HRP-conjugated secondary antibodies: • Goat anti-rabbit (1:15000) • Goat anti-mouse IgG (H+L) (1:500000)
• SuperSignal West Femto Maximum Sensitive Substrate (Thermo Scientific) on Kodak Biomax Light film • Bands quantified using the ImageJ gel analyser function. • Dystrophin band intensity was normalized to pan-actin in each lane • Expressed as a percentage of the control specimen dystrophin signal.

Dup 3-4
Del 3-27


Good concordance for ranking of samples in order or dystrophin expression


Concordance between the Taylor and Arechavala-Gomeza methods of IF quantification
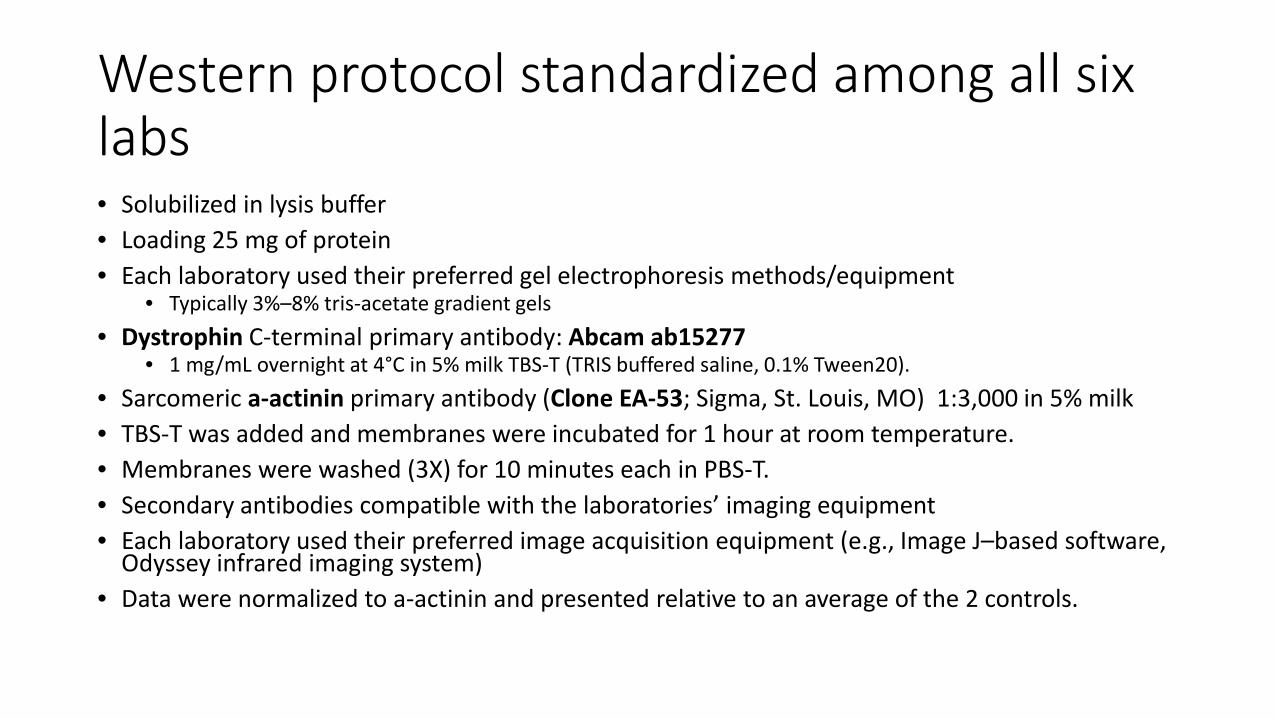
Western protocol standardized among all six labs • Solubilized in lysis buffer • Loading 25 mg of protein • Each laboratory used their preferred gel electrophoresis methods/equipment
• Typically 3%–8% tris-acetate gradient gels • Dystrophin C-terminal primary antibody: Abcam ab15277
• 1 mg/mL overnight at 4°C in 5% milk TBS-T (TRIS buffered saline, 0.1% Tween20). • Sarcomeric a-actinin primary antibody (Clone EA-53; Sigma, St. Louis, MO) 1:3,000 in 5% milk • TBS-T was added and membranes were incubated for 1 hour at room temperature. • Membranes were washed (3X) for 10 minutes each in PBS-T. • Secondary antibodies compatible with the laboratories’ imaging equipment • Each laboratory used their preferred image acquisition equipment (e.g., Image J–based software,
Odyssey infrared imaging system) • Data were normalized to a-actinin and presented relative to an average of the 2 controls.

BOM
A
BOM
B
BOM
C
BOM
D
BOM
E
BOM
F
BOM
G
BOM
H
Quantification by Image J
H
G
E
F
C
B
A
D

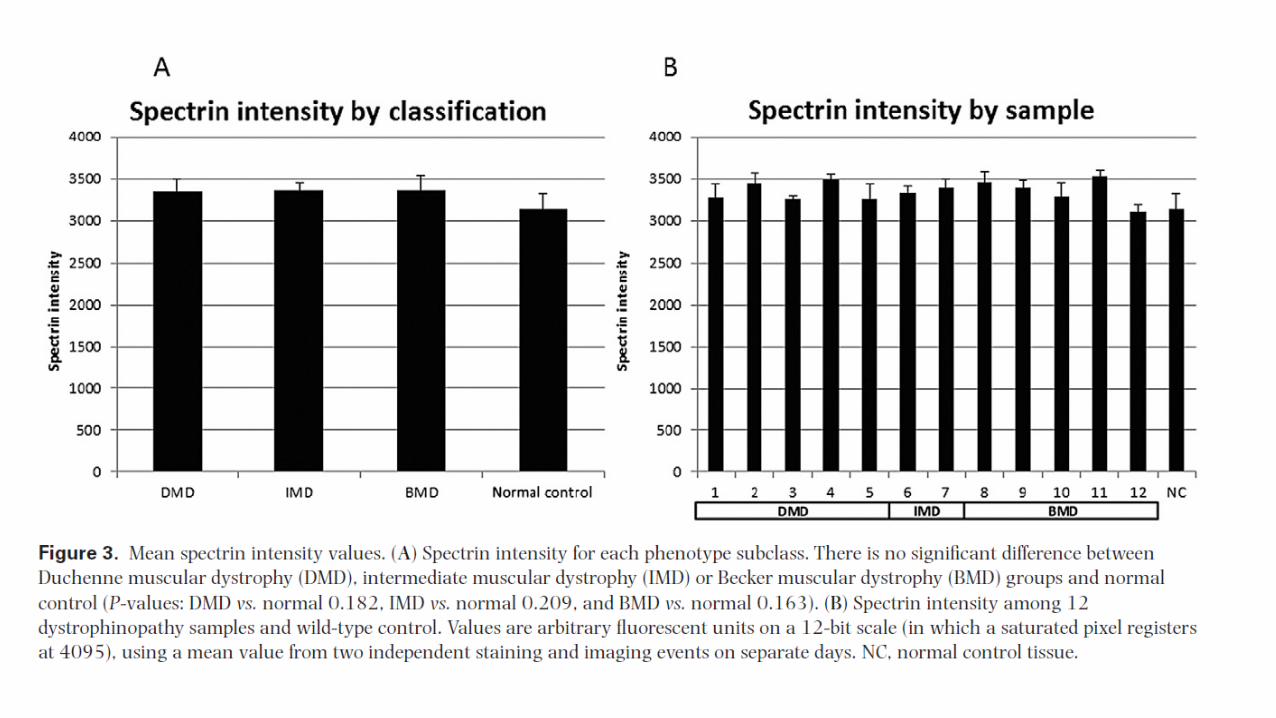
Higher variability in WB than in IF among labs
• Mean SD of 15.95 (ranging between 0.89 for sample E and 33.09 for sample F)
• CV values for Western blotting averaged 80% (ranging between 23% for sample F and 223% for sample E)
• Interlaboratory variability improves as the level of dystrophin increases.
• Intralaboratory variability was also more pronounced than for immunohistochemistry.
• Only laboratory 1 had an optimal CV value of 0.3%; laboratory 3 had the highest at 119% (figure 3).

I • In some samples, IF and WB compared quite well
• Sample A, BMD: c.40_41del GA
• In others, WB results were much higher.
• Sample F, BMD: large deletion of exons 10-44
• Likely due to mutation: lacking most of actin binding domain 1 (ABD1)
• Suggest protein may be stable but mislocalized

Our conclusions (1)
• Many BMD mutations (and presumably, the equivalent DMD mutations after exon skipping) affect the 3-dimensional structure and actin-binding properties of dystrophin
• Capturing both the total amount of dystrophin in the homogenate as well as its localization at the sarcolemma is clearly important

Can we minimize sources of variability in WB?
• ECL detection is sensitive (low pg detection) • Limitations of ECL detection
• Indirect signal (enzymatic reaction) • Timing of exposure; saturation of signal • Challenges to co-probing (often need to strip/re-probe) • Variability in response

Flash 10s 20s
Dys C-term (Ab15277, Thermo) 1:200
BOM
A
BOM
B
BOM
C
BOM
D
BOM
E
BOM
F
BOM
G
BOM
H
BOM
A
BOM
B
BOM
C
BOM
D
BOM
E
BOM
F
BOM
G
BOM
H
BOM
A
BOM
B
BOM
C
BOM
D
BOM
E
BOM
F
BOM
G
BOM
H
α-actinin (EA-53, Sigma) 1:3000

Dual color infrared dye imaging (LiCor Odyssey)
• Linearity of the signal • Controlled for saturation • Multiplex detection • Improved normalization on
same blot
www.licor.com

http://webinar.sciencemag.org/webinar/archive/quantitative-western-blotting (March 3, 2015)

BOM
A
BOM
B
BOM
C
BOM
D
BOM
E
BOM
F
BOM
G
BOM
H
BOM Samples with fluorometric detection (LiCor)
Dys C-term (Dys, Thermo) 1:200
α-actinin (EA-53, Sigma) 1:3000

Excellent concordance between ECL and LiCor quantification
Percentage WT (avg)

Blot-to-blot reproducibility is high

Further multiplexing is possible
Utrophin (green) Mancho3
α-actinin (green) (EA-53, Sigma)
Dys C-term (Dys, Thermo)

http://webinar.sciencemag.org/webinar/archive/quantitative-western-blotting (March 3, 2015)

http://webinar.sciencemag.org/webinar/archive/quantitative-western-blotting (March 3, 2015)

Conclusions
• Assessing dystrophin by both IF and WB is important, because a different pattern of expression can lead to differences in the functional outcome irrespective of the total amount of protein present
• Reference samples can be shared among laboratories – even internationally – for reproducible Western blotting
• A move to infrared dye imaging methods (LiCor, Amersham) will likely improve reproducibility further
• Normalization to total protein content (Cy5 labeling, for example) should be considered

Acknowledgements • Flanigan Lab, Center for Gene Therapy, Columbus
• Tabatha Simmons, BS • Adeline Vulin, PhD • Nicolas Wein, PhD • Laura E. Taylor, BS • Yuuki Kaminoh, BS
• University College London:
• Francesco Muntoni, MD • Karen Anthony, PhD • Silvia Torelli, PhD • Lucy Feng, PhD • Narinder Janghra, BSc • Caroline A. Sewry, PhD • Jennifer E. Morgan, PhD
• Neuromuscular Disorders Group, BioCruces Health Research Institute, Barakaldo, Spain
• Virginia Arechavala-Gomeza, PhD
• Institut de Myologie, Paris • Gisèle Bonne, PhD • Maud Beuvin, MS • Thomas Voit, MD
• Institute of Genetic Medicine, Newcastle • Rita Barresi, PhD • Matt Henderson, MSc • Steven Laval, PhD • Volker Straub, MD
• Prosensa Therapeutics
• Afrodite Lourbakos, PhD • Giles Campion, MD
• University of Utah • Chris Rodesch, PhD

![Western Blotting BCH 462[practical] Lab#6. Objective: -Western blotting of proteins from SDS-PAGE.](https://static.fdocuments.net/doc/165x107/56649dc85503460f94abe06c/western-blotting-bch-462practical-lab6-objective-western-blotting-of.jpg)