Western Australian Government Submission - Home ... Workforce planning for the Western Australian...
33
Western Australian Government Submission Productivity Commission Geographic Labour Mobility issues paper September 2013
Transcript of Western Australian Government Submission - Home ... Workforce planning for the Western Australian...

�
�
Western Australian Government Submission
Productivity Commission
Geographic Labour Mobility issues paper
September 2013

�
�
WESTERN AUSTRALIAN GOVERNMENT SUBMISSION: GEOGRAPHIC LABOUR MOBILITY
Table of Contents
1. Summary of Recommendations ..................................................................................... 1
2. What role does geographic labour mobility play in a well-functioning labour market
for Western Australia? .................................................................................................... 3
3. What are the possible elements of geographic labour mobility? ..................................... 3
4. What might constitute a regional labour market in Western Australia? ........................... 3
5. What is the relative contribution of trends in geographic labour mobility to the
regional labour supply in Western Australia? .................................................................. 4
5.1 Changing economic conditions ............................................................................... 4
5.2 Fly in, fly out working arrangements ........................................................................ 4
6. What is the evidence on how geographic labour mobility affects regions and
communities in Western Australia? ................................................................................ 5
6.1 FIFO case study example: Newman and Tom Price ................................................ 5
6.2 The Perth and Peel Development Outlook ............................................................ 11
6.3 Building Stronger Rural Communities – Recognising Prior Learning Project ......... 11
7. How have governments in Western Australia responded to these effects
(including governance and planning processes)? ......................................................... 11
7.1 Western Australia's workforce plans ...................................................................... 11
7.2 Regional Workforce Development Best Practice Framework and Best
Practice Principles .............. 12
7.3 Workforce planning for the Western Australian local government sector ............... 13
7.4 Workforce planning in local government at the national level ................................ 13
8. What are the key impediments to geographic labour mobility in Western Australia
and how are they changing over time? ......................................................................... 13
8.1 Attraction and retention issues identified from regional, and industry
workforce development plans ................ 13
8.2 Housing affordability and financial disincentives to home ownership ..................... 15
8.3 Access to key government and community services ............................................. 18
9. What actions does the Western Australian Government and businesses take that
influence geographic labour mobility? .......................................................................... 19
9.1 Royalties for Regions ............................................................................................ 20
9.2 Housing affordability.............................................................................................. 20
9.3 Harmonisation of apprenticeships ......................................................................... 22
9.4 Planning strategies ............................................................................................... 22

�
�
9.5 Encouraging flexible, non-location dependant workforces ..................................... 23
10. What are the implications of technological, structural and demographic
developments on patterns of geographic labour mobility in Western Australia? ........... 23
10.1 Non-location dependant workforces .................................................................... 23
10.2 Child care ............................................................................................................ 24
10.3 Aboriginal workforce development and labour mobility ........................................ 24
11. What effect does international migration have on geographic labour mobility in
Western Australia? ....................................................................................................... 26
11.1 Western Australian skilled migration strategy ...................................................... 26
11.2 Major changes in migration policy ....................................................................... 26
11.3 Labour mobility of recently arrived migrants into Western Australia ................. 26
Attachment 1 – Additional data sources and references ...................................................... 28
Attachment 2 – List of Western Australian State Government agencies that
contributed to the submission ..................................................................... 30

��
�
WESTERN AUSTRALIAN GOVERNMENT SUBMISSION GEOGRAPHIC LABOUR MOBILITY
The Western Australian Government welcomes the opportunity to make a
submission to the Productivity Commission’s issues paper in relation to Geographic
Labour Mobility.
Ensuring the availability of a skilled workforce is of strategic importance for Western
Australia in fulfilling its economic and social potential. Western Australia's economy
is dynamic, and the degree to which the State's workforce moved between jobs
during its resource expansion period was a key factor assisting the State's strong
economic growth and structural adjustment.
However, it is also recognised that there are costs associated with such mobility, for
example, the effects that high rates of staff turnover have on businesses, the
relocation costs faced by individuals/households, and a reduction in the benefits that
longer job tenure can have for workers. During the peak period of the State’s
resources expansion intense competition for skilled labour resulted in a degree of
‘crowding out’ of skilled labour in the State’s non-resource industries.
Achieving a flexible workforce is challenging, in part due to issues associated with
the attraction and retention of labour, particularly in regional and remote areas of the
State.
Unique factors impact on regional geographic labour mobility in Western Australia,
including the State’s large land mass and significant distances between some
centres, the many resource sector sites operating in remote locations across the
State, and diverse climatic conditions. These factors provide unique challenges for
service provision in regional areas of the State.
However, labour mobility strategies addressing these challenges cannot be a ‘one
size fits all’ approach, and within this context, strategies need to address a diverse
range of industry sectors, professions/trade groupings, and regions.
This submission has identified eight recommendations for the Productivity
Commission to consider as part of its review into Geographic Labour Mobility, which
are summarised below.
1. Summary of Recommendations
Recommendation 1
Regional labour markets are influenced by a number of critical factors. It is
recommended that key factors be identified and strategies for increasing labour
��
�
mobility be examined in the context of those factors (e.g. regional factors including
climate, cost of living, availability of housing, infrastructure, access to services),
industry sectors, and across professions/trades.
Recommendation 2
Improved data collection methods and analysis to support understanding of the
impact of FIFO workforces on host communities, including local government, small
business, hospitals, police and other services.
Recommendation 3
The scope and context of out-migration in regional locations be examined and
strategies identified to support regional workers in declining industry sectors (e.g.
agriculture) develop transferable skills for employment in areas of skills shortages.
Recommendation 4
Research undertaken by the Workforce Development, Supply and Demand Principal
Committee (WDSDPC) inform the Productivity Commission review of regional labour
mobility.
Recommendation 5
Potential for expansion and improvement of Commonwealth initiatives for rental
support (including the non-taxable income supplement payment added on to the
pension, allowance or benefit of eligible income support customers who rent in the
private rental market), and to improve access to home loans in regional locations.
Recommendation 6
It is important that horizontal fiscal equalisation (HFE) does not mute the migration of
labour across States in response to differences in labour and capital productivity. A
more ‘market oriented’ implementation of HFE would allow States to retain some of
the proceeds of economic development, to provide the incentives and capacity to
facilitate economic growth and structural adjustment opportunities.
Recommendation 7
Regional labour mobility and improved employment outcomes for Aboriginal people
be improved by strategies that make connections and ‘join the dots’ between
employers, job seekers, communities, service providers and governments.
Recommendation 8
Improved (annual) data collection at national, State and regional levels and
information about the patterns of movement and employment (by location, industry
sector and profession/trade) of migrants (including people on short- term working
visas).

��
�
2. What role does geographic labour mobility play in a well-functioning labour market for Western Australia?
As the lead agency for workforce development in Western Australia, the Department
of Training and Workforce Development (DTWD) has developed Skilling WA – A
workforce development plan for Western Australia1, which outlines strategies that
provide the basis for the State Government’s response to Western Australia’s
workforce challenges. One of the key principles that underpins workforce
development embedded in Skilling WA is the promotion of efficiency and mobility in
the State’s labour market.
The Productivity Commission’s economic modelling exercises found that the
potential benefits associated with improved geographic labour mobility during a
mining boom were higher average real wage levels and economic growth rates
(albeit with the non-mining jurisdictions capturing more of these benefits on a per
capita basis)2.
3. What are the possible elements of geographic labour mobility?
A very broad definition of geographic labour mobility would assist in developing a
richer understanding of the flexibility it provides for matching workers and jobs
across locations (and likewise, where there are any inherent barriers/inhibiters, or
possible costs). The reasons people move often extends beyond employment
considerations, and can be complex, multifaceted, and difficult to disentangle.
4. What might constitute a regional labour market in Western Australia?
For regional policy and planning purposes there is interest in the movement of
people and businesses within and between non-metropolitan regions, as well as
movement between the metropolitan area (as a region) and non-metropolitan
regions. The reasons, distances and implications for moving within metropolitan
regions are different to those for moving from one country town or non-metropolitan
regional centre to another. It is appropriate that this Review focus on movements
that impact on the supply of labour – that is, movements between regional labour
markets rather than within regional labour markets.
�������������������������������������������������������������1 DTWD, Skilling WA http://www.dtwd.wa.gov.au/dtwd/detcms/portal/
2 This is mainly due to the modelling exercise showing that the increased ability of workers to move to
work in another state or territory in turn helped moderate the rate of wages growth in resource boom jurisdictions, while increasing it elsewhere. See: Productivity Commission 2009, Review of Mutual Recognition Schemes, Research Report, Appendix E: Labour market impacts of mutual recognition.

��
�
5. What is the relative contribution of trends in geographic labour mobility to the regional labour supply in Western Australia?
5.1 Changing economic conditions
Current economic conditions, with a relative slowdown in economic activity across
most industries both nationally and at a state level, create uncertainty for workers
when deciding whether to relocate for a job, and have a negative impact on the
capacity to finance such a move.
In particular, the transition underway currently in Western Australia from an intense
investment phase towards more export driven operations phases in the resources
sector implies a reduction in the construction workforce for mining areas over coming
years. During this period, construction workers can expect longer and costlier
transition periods between jobs. This is compounded by rising unemployment rates
in all regions, increasing the risk of moving to a new area for fixed term contracts and
projects.
Climatic conditions also impact on changing patterns of geographic labour mobility in
Western Australia. Deteriorating economic conditions associated with a drying
climate in the State’s central Wheatbelt region is resulting in migration from this area.
(See also Section 6.3: Building Stronger Rural Communities – Recognition of Prior
Learning Project (RPL)).
Recommendation 1
Regional labour markets are influenced by a number of critical factors. It is
recommended that the Review identify key factors and examine strategies for
increasing labour mobility in the context of those factors (e.g. regional factors
including climate, cost of living, availability of housing, infrastructure, access
to services; industry sectors; and across professions/trades).
5.2 Fly in, fly out working arrangements
Much of Western Australia’s mineral wealth is located in remote and often harsh
environments of the State’s regions. Companies are unable to source all of their
employees from the local population, and bring in workers on ‘fly-in, fly-out’ (FIFO)
working arrangements. The reliance on FIFO working arrangements provides
industry with an alternative to permanent relocation. The regions of highest labour
demand in Western Australia are in the Pilbara, Kalgoorlie-Esperance and the Mid
West.
A range of factors contribute to the need for FIFO including:
• a lack of skilled workers from the local community;
• the scarcity of affordable housing and amenities; and
• flexible employment arrangements that allow employers to engage skilled
labour for finite periods during the construction phase of a project.

��
�
For some employers, the use of FIFO is necessary to meet labour demands of major
resource and infrastructure projects in regional and remote parts of the State. FIFO is
also an attractive option for some workers given the generous remuneration provided
by resource companies and contractors to compensate workers for living away from
home and/or in harsh conditions. This includes subsidised onsite living costs and
significant time off in between work periods.
While there is a lack of timely, accurate and detailed data available on the State’s
FIFO workforce3, according to the Western Australian Chamber of Minerals and
Energy (CME), approximately 46 800 people or 52% of the State’s resource industry
workforce were employed on FIFO rosters in 20114.
The CME’s 2013 State Growth Outlook indicates that FIFO arrangements will remain
in place for in excess of 50% of the resources sector workforce in Western Australia
in the short to medium term. This is in spite of an expected decrease in employment
levels after 2014, as the current set of resource sector projects moves from
construction phases to operations phases5.
The shift from resource project construction to operations phases is likely to be less
labour intensive. However, it will still require the availability of a skilled workforce in
the resource regions.
For more information regarding issues relating to FIFO, please refer to the case
study on Newman and Tom Price in the next section.
6. What is the evidence on how geographic labour mobility affects regions and communities in Western Australia?
6.1 FIFO case study example: Newman and Tom Price
This case study examines the phenomenon of FIFO workforce participation and its
effect on host communities, drawing on the examples of Newman and Tom Price.
It is difficult to pinpoint where FIFO workforce participation sits in the spectrum of
workforce mobility. It is simultaneously the most and least mobile of employment
arrangements. The FIFO system allows a large workforce to be delivered to a site
anywhere in the country with minimal delay, at the same time enabling the employee
to retain his/her existing place of residence.
�������������������������������������������������������������3 There are a number of data quality concerns that have reduced the ability to accurately obtain FIFO
information from the ABS 2011 Census such as erroneous assumptions about a person’s usual residence, place of work accuracy, and limitations of the data (i.e. the questions on the Census do not allow for information about FIFO cycle length, frequency or reason for visit). 4 Chamber of Minerals and Energy of Western Australia, Submission to the Standing Committee on
Regional Australia’s Inquiry into the Use of ‘Fly-in, Fly-out (FIFO) and ‘Drive-in, Drive-out (DIDO) Workforce Practices in Regional Australia, October 2011, p8. 5 Chamber of Minerals and Energy of Western Australia, State Growth Outlook 2013, p14.
��
�
FIFO work arrangements allow spouses and children to retain existing employment,
education arrangements and social networks. They also enable capital from the
mining centres of the Pilbara and Goldfields to flow out to other parts of the nation.
Some analysts are of the view that the extended periods away from family and
friends that FIFO work arrangements demand is harmful to relationships and sense
of community. However, it is difficult to find robust comparative data that measures
the mental health and social status of FIFO families against that of regionally
resident workers in the same and different industries.
Newman and Tom Price are the two largest towns of Western Australia's inland
Pilbara, which is one of the most sparsely populated regions of the world. Newman
has a population of 5827 people and is the largest town in the Shire of East Pilbara
which has a population of 12 814 and covers approximately 380 000km2. Tom Price
(population 3134 at 2011 Census) is the largest town in the Shire of Ashburton, which
has a total resident population of 10 829 and covers approximately 105 000 km2.
In 2012, mineral resources worth approximately $50 billion dollars were extracted
from the Shires of Ashburton and East Pilbara. The combined total operating income
for the two Shires in 2012-13 was approximately $92 million. Resources from
Ashburton and East Pilbara accounted for approximately 21% of Australia's
merchandise exports in 2012, yet the resident population of the area comprises only
about 0.1% of the national total.
Newman and Tom Price were developed in the 1960s as 'company towns' to house
workers for the nearby mines, and their families. At that time, establishing a resident
workforce was considered the best way to operate in such a remote location. State
Agreements provided a mechanism for implementing the State Government’s
objectives for the development of those regions. The Mount Newman Mining
Company (now BHP) and Hamersley Iron (now part of Rio Tinto) developed housing
and infrastructure in Newman and Tom Price respectively.
During the 1980s the normalisation process was initiated, and administration of the
towns was handed over to the respective local governments. The legacy of Newman
and Tom Price originally being company towns is substantial. BHP and Rio Tinto are
still the major employers in each town, they still provide power and water and they
still own most of the housing stock.
In the first decade of the 21st century, demand for iron ore increased enormously,
largely driven by a development boom in China. During a ten year period the price of
iron ore increased by more than 1000%. This triggered massive investment in the
ore rich region, creating the requirement for a substantially larger workforce. For the
new phase of development both companies departed from their previous approach to
labour supply, augmenting the regional labour pool with a predominantly FIFO
workforce. This approach was taken for a variety of reasons including:

��
�
• the overall cost of supporting a FIFO employee is significantly less than for a
resident employee. Fortescue Metals Group estimates the cost of supporting
a residential employee in a major town to be in the vicinity of three times the
expense as for a similar FIFO employee;
• more rapid employment growth, which was critical during the surging market
of the time;
• land release in Newman and Tom Price is constrained by several key factors
including native title claims, mining tenements and environmental protection;
• the construction phase of a typical project is more labour intensive than the
operational phase and continues for a limited duration. FIFO arrangements
allow workers to reach the site without completely uprooting;
• construction and infrastructure provision costs are significantly reduced with
FIFO style accommodation; and
• social changes meant fewer workers were prepared to relocate their families
to remote locations, which can interrupt a spouse’s career, restrict children’s
educational opportunities, and limit access to critical services such as health
care.
The exact number of FIFO workers in the region is difficult to gauge. At the time of
the 2011 Census approximately 56% (2401 employees) of the workforce in the Shire
of Ashburton and 65% (3281 employees) in the Shire of East Pilbara stated that they
worked in the mining sector.
Research by the Pilbara Industry's Community Council (PICC) indicates that 85% of
the mining workforce in Ashburton and 95% of the mining workforce in East Pilbara
was FIFO at the time of the Census. The PICC forecast that these rates would
increase to 89% of the mining workforce in the Shire of Ashburton and remain at
95% in the Shire of East Pilbara in 2013.
Census data show the count of people present in the area at Census night and the
number of persons for whom the area was the place of usual residence. This gives a
rough indication of how many 'extra people' were in the area at the time of the
Census. The number of persons present in Newman (Urban Centre Locality) on
Census night (place of enumeration) was significantly higher (6762) than the
estimated resident population. This figure includes residents, tourists and visitors
and provides a better indication of the total service population. The number of
persons present in the Shire of East Pilbara was also substantially greater than
those usually resident (11 950), with 17 148 persons present.
In Tom Price the discrepancy between those usually resident and those present on
Census night was not particularly large, which suggests that within the town itself the
population may be relatively settled. The number of persons present in Tom Price
(suburb) on Census night (8069) however, was significantly higher than the count of
persons for whom Tom Price (suburb) was cited as place of usual residence (5460).
The number of persons present in the Shire of Ashburton was also substantially
greater than those usually resident (10 001), with 15 057 persons present.

�
�
The increase in the number of people present on Census night who are employed in
the mining or construction industries is apparent when comparing Census data. At
the 2001 Census, in the Shire of Ashburton 1294 people present on Census night
stated that they were employed in the mining industry and 211 people stated that
they were employed in construction. At the 2011 Census those figures had increased
to 4064 and 1710 respectively. In the Shire of East Pilbara 1372 people present on
Census night stated that they were employed in the mining sector and 380 stated
that they were employed in construction. In 2011 the count in East Pilbara had
increased to 5458 and 1075 respectively.
Proportion of population resident and visiting from a different area (SA2)
Source: ABS Catalogue 2001.0 Community profile - place of enumeration
It is clear from these figures that there was an enormous influx of people to the
region prior to the 2011 Census to work in the mining industry (either in the
construction or operations phase). However, the precise number of FIFO workers,
the duration of their stay and the extent to which they interact with established
communities is uncertain.
The impact of the rapid increase in employment opportunities and consequent
demand for land and housing has had a major impact on the cost of living in
Newman and Tom Price. The median house price in Newman increased from
$88 500 in 2003 to $850 000 in 2012.
In Tom Price the median house price increased from $84 000 in 2004 to $805 000 in
2012. The median house price in Perth for 2012 was considerably lower than either
town at $475 000.
Renting houses is also extremely expensive in these locations. BHP and Rio Tinto
still own a considerable proportion of the housing stock, which they use to house
employees. At the 2011 Census, respondents stated that 80% of rented dwellings in
�
��
��
��
��
��
��
��
�
��
��
�������� ������������ �������� ��������
�������������������������
���������������� ������

��
�
Newman and 87% of rented dwellings in Tom Price were rented from 'other land lord
type' which includes employers - these households typically paid no or very little rent.
Rental properties available to the public in Newman and Tom Price were also
considerably more expensive than is typical in Western Australia. In 2012, the
median weekly rental price in Perth was approximately $430 per week. In Tom Price
advertised prices ranged from $1600 to $2500 per week. In Newman prices ranged
from $1300 to $3300 per week.
Wages in Newman and Tom Price are also often much higher due to the numerous
lucrative jobs in the mining sector. At the 2011 Census, 21% of Newman residents
and 35% of Tom Price residents stated that they earned more than $2000 per week,
compared to 9% for the State.
The very high cost of living - particularly for accommodation - in Tom Price and
Newman, means that people considering a move to these towns must either have
very large incomes or have their accommodation supplied, or subsidised, by their
prospective employer. This presents a critical barrier to labour movement into
Newman and Tom Price, particularly for prospective employees of small businesses.
This, in turn, becomes a major hurdle for small business development due to the
potentially prohibitive costs of attracting staff. The Pilbara Development Commission
is working with local stakeholders to address these challenges and make small
business development in the towns more viable.
Aversion to long-term settlement (both commercial and residential) has a serious
impact on revenue to host local governments, which in turn diminishes their ability to
provide suitable infrastructure and facilities. This can become an issue, as Newman
and Tom Price act as service hubs for the growing mining operations of the region.
Although BHP and Rio Tinto regularly contribute financially to community groups,
public events and infrastructure in the towns, the local government has little control
over how this money is spent.
In essence, the availability of a FIFO workforce option in towns like Newman and
Tom Price diminishes the urgency of dwelling provision. If the workforce was
necessarily resident, then large scale developments would require greater provision
of infrastructure (hard and social) and broader opportunities for housing
development. This would assist in overcoming barriers to the provision of
accommodation for service workers and other non-mining workers. It could also
improve housing affordability, reducing the barrier to workforce mobility and
improving opportunities for small business development.
Conversely, the use of a FIFO workforce enables more flexible and swift project
development which is critical during periods of high growth. Mining activity around
Newman and Tom Price could not have progressed to the same extent if project
development relied solely on a resident workforce. This would have significantly
reduced employment opportunities, company profits and market share, State
Government royalties and economic growth on a national scale.
��
�
There are considerable benefits to the host community that can be derived from a
local FIFO workforce. It is State Government policy to, where practicable, locate
FIFO camps close to established towns and to construct camps in a fashion that
provides a legacy benefit to the host community. Frequently, companies will invest in
services such as medical centres for their own staff, which are also available to non-
employees.
In addition, the presence of a large number of well-paid non-resident individuals in
close proximity to established towns such as Newman and Tom Price provides a
larger market for local businesses, although some other communities have
experienced negative social consequences where the company does not impose off-
site behavioural rules on its employees.
There are also opportunities for small industries to develop, by servicing the camps.
In Newman, BHP provides bicycles for their FIFO employees which are constructed
and serviced by a local indigenous organisation. In Tom Price, the Ashburton
Aboriginal Corporation has been producing biodiesel with cooking oil from FIFO
camps since 2006. This provides fuel for power generators in isolated communities
and is purchased by Rio Tinto for use in mine machinery.
FIFO work arrangements have transformed the relationship between mining towns
and the mines that fuelled their development. The effects of this form of workforce
mobility are not yet fully understood. There are undoubtable benefits for employers
and, to a large degree, for employees, but the consequences for the host community
are more mixed. The FIFO system of workforce provision creates unusual dynamics
in what are often isolated regional communities. This phenomenon needs to be
better understood to plan for and manage the impacts of a FIFO workforce.
The role of land use planning and regulating agencies is also evolving in this area.
Traditionally, there have been few planning or development controls on worker
accommodation located at mine sites and away from towns, and the legislative
mandate for imposing such controls is unclear. This has led to a wide range of
worker accommodation conditions, with some companies providing ‘resort style’
accommodation, while at the other end of the spectrum, site accommodation is of
relatively poor quality.
The willingness of workers to take up jobs, or remain in them, in remote mine sites is
likely to be significantly influenced by the conditions in which they are housed.
Recommendation 2
Improved data collection methods and analysis to support understanding of
the impact of FIFO workforces on host communities, including local
government, small business, hospitals, police and other services.

���
�
6.2 The Perth and Peel Development Outlook
The Perth and Peel Development Outlook6 (the Outlook) provides a comprehensive
assessment of the factors shaping future demand and supply of land and dwellings
in the Perth and Peel area. The Outlook informs planning and management for future
development of land, housing, infrastructure and services to support growth of the
Perth and Peel areas. The Outlook also reports on employment and demographic
trends which add to the understanding of labour mobility in Western Australia. More
information on the Outlook can be found at: www.planning.wa.gov.au/udp.
6.3 Building Stronger Rural Communities – Recognising Prior Learning
Project
In the eastern part of the central Wheatbelt Region, deteriorating economic
conditions associated with a drying climate are having a significant impact on
geographic labour mobility in the form of out-migration. To address this, the Building
Stronger Rural Communities RPL Project 7 – a partnership between the DTWD and
C.Y. O’Connor Institute, and the Department of Agriculture and Food – was
implemented. The program was over-subscribed and resulted in over 150 people
gaining formal qualifications (aligning to the Australian Qualification Framework) to
enhance their competitiveness for off-farm employment.
Recommendation 3
A Review of regional labour mobility include the scope and context of out-
migration in regional locations and industries, and examine strategies to
support regional workers develop transferable skills for employment in areas
of skills shortages.
7. How have governments in Western Australia responded to these effects (including governance and planning processes)?
7.1 Western Australia's workforce plans
Skilling WA recognised the need for a broader identification of skilled labour needs at
both the State and regional levels, in order to target strategies to build, attract and
retain a skilled workforce in each of the State’s nine regional areas. As a result:
• Regional Workforce Development Plans, outlining key challenges to workforce
development in each of the nine regions of Western Australia, are being
developed to provide industry, government and community sector strategies
at local and State levels. Regional workforce development alliances have
been established to lead workforce development initiatives in each region.
Membership representation is drawn from local businesses, industry groups,
�������������������������������������������������������������6 Planning Western Australia, The Perth and Peel Development Outlook 2011-12,
http://www.planning.wa.gov.au/publications/6409.asp 7 C.Y. O’Connor Institute, Building Stronger Rural Communities RPL Project,
http://www.cyoc.wa.edu.au/Documents/A4%20RPL.pdf

���
�
local governments (representing community aspirations), relevant government
agencies and the local State Training Provider.
As at July 2013, five regional workforce development plans8 have been
released for the Wheatbelt, Goldfields-Esperance, Great Southern, South
West, and Pilbara regions, and are now being implemented. Plans for the
Kimberley, Peel, Mid West, and Gascoyne will be released over the next year.
Strategies in these plans align with the five strategic goals of Skilling WA.
• Western Australia’s current industry training advisory arrangements comprise
a network of ten Industry Training Councils, providing high level, strategic
information and advice to inform the training needs and priorities of industry in
Western Australia. This advice includes industry intelligence on skills supply
and demand, and in particular, current or emerging skills shortages in the
State.
Each Industry Training Council develops industry workforce development
plans that outline the needs and skills issues of their particular industry area,
including issues related to labour mobility. Further information is available at:
http://www.dtwd.wa.gov.au/dtwd/detcms/navigation/training-councils/
7.2 Regional Workforce Development Best Practice Framework and Best
Practice Principles
A national Workforce Development, Supply and Demand Principal Committee9
(WDSDPC) was established in April 2010 and provides support to the Standing
Council on Tertiary Education, Skills and Employment (SCOTESE). The WDSDPC
provides high-level advice on issues of national significance relating to workforce
development, supply and demand.
The development of best practice regional workforce development principles and a
best practice regional workforce planning and development framework is a key
project for the WDSDPC in 2012–13. This project evolved from the Committee’s
recognition that for workforce planning and development to be effective at a national
level, coordinated regional workforce planning is essential. The initial phase of the
project examined:
• regional workforce planning (including the types of data acquisition and
workforce modelling currently undertaken and how this data is shared with
stakeholders);
• regional workforce development planning; and
• regional workforce development occurring in Australia.
�������������������������������������������������������������8 DTWD, regional workforce development plans
http://www.dtwd.wa.gov.au/dtwd/detcms/navigation/regional-workforce-development-plans/ 9 NCVER, Workforce Development Supply Demand Principal Committee,
http://www.ncver.edu.au/resources/glossary/glossary_full_record.html?query=BROWSE&entry=Workforce+Development%2C+Supply+and+Demand+Principal+Committee

���
�
The Committee has finalised the Regional Workforce Development Best Practice
Framework and Best Practice Principles. These documents will be available on the
DTWD website (www.dtwd.wa.gov.au) in early September 2013.
Recommendation 4
Research undertaken by the WDSDPC inform the Productivity Commission
review of regional labour mobility.
7.3 Workforce planning for the Western Australian local government
sector
The Integrated Planning and Reporting Program supports the State Government’s
Local Government Reform Program. Developed by the Department of Local
Government and Communities, this program builds the capacity of local
governments to undertake strategic community planning, long-term financial
planning, asset management, workforce planning and community engagement.
Local governments in Western Australia develop Strategic Community Plans and
Corporate Business Plans, which include strategies to address capability
requirements in asset management, long term financial planning and workforce
planning. Local governments have access to a Workforce Planning Toolkit and other
resources, including Workforce Planning Training Workshops in metropolitan and
country areas, and a Workforce Planning Panel of Consultants.
7.4 Workforce planning in local government at the national level
The Western Australian Government contributes to national workforce planning and
development initiatives, including the:
• National Local Government Workforce Development Strategy initiated through
the then Local Government Planning Ministers’ Council of the Council of
Australian Governments and carried forward by the Australian Centre of
Excellence for Local Government (ACELG); and
• Australian Local Government Workforce and Employment Census,
coordinated through ACELG.
8. What are the key impediments to geographic labour mobility in Western Australia and how are they changing over time?
8.1 Attraction and retention issues identified from regional, and industry
workforce development plans
With regional centre growth agendas emerging in a number of States, attraction and
retention issues should be a focus of the Commission’s research. The severity of
attraction and retention issues identified from the latest set of regional and industry
workforce development plans10 varies both within and between regions (and across
industries) in Western Australia. Key issues include:
�������������������������������������������������������������10
See also Section 7.1: 'Western Australia's workforce plans' in this submission.

���
�
• Housing - A lack of available and affordable housing in many regions and/or
sub-regions has resulted in some businesses experiencing difficulties
attracting and retaining staff to the point where businesses have become
unviable. There are concerns relating to the loss of social housing for some
households/individuals if full time employment is secured (and social housing
income thresholds are subsequently breached).
• Competition for skilled labour - The ‘crowding-out’ effect associated with the
resources and construction sectors is well documented in industry and
regional workforce development plans. This relates to those sectors that have
less capacity to match the wages and employment conditions of the resources
and construction sectors. Key issues include:
o inter-regional competition of labour, with some employees choosing
higher wage regions as a place of work and residence;
o skills mismatch between local job opportunities and the available
workforce;
o employers in other sectors, particularly non-government organisations
that provide essential services and small and medium enterprises, find
it difficult to match the wages and salaries offered in the mining
regions;
o competing with wages offered elsewhere can erode profits and the viability of some enterprises, further weakening the regional economy; and
o apprenticeship/traineeship cancellations and withdrawals due to
availability of higher paying positions offered by resource and
construction firms11.
Occupational categories where competition is occurring is wide ranging and
includes professionals, trade and technical workers, community service
workers, plant operators, and a number of semi-skilled occupations. The
ability to attract professionals to regional areas to work in local government is
also impacted (see also section 8.3 entitled ‘Access to key government and
community services’).
Understanding and addressing the effects of ‘crowding-out’ and the potential
‘hollowing-out’ of other occupational sectors is essential. The Western
Australian State Training Board, in collaboration with DTWD, is currently
undertaking research to identify those occupations at most risk of being
crowded out. The findings of this research and recommendations on
how to possibly mitigate such risks are expected to be finalised
in late 2013. The phase 1 report is available online at
www.stb.wa.gov.au/Pages/CrowdingOut.aspx.
�������������������������������������������������������������11
Skilling WA consultation forum with Industry Training Councils, 27 March 2013.

���
�
• Regional perceptions - Perceptions about lifestyle and community including
factors such as the cost of living, level of social opportunities, facilities and
services plays an important role in attracting potential workers to a region.
• Career opportunities and pathways - One of the main barriers to attraction and
retention in regional areas is a view that opportunities for career progression
are poor. Employees often see regional employment as a ‘stepping stone’ in
the workforce ladder, rather than a place to build a long-term career. As a
result, employment is often transitory, with significant implications for
employers in terms of recruitment costs and training. There are also
perceptions of unattractive working conditions in some industries, such as
hospitality, tourism and agriculture.
• Health, education and community services - A common concern of potential
and existing employees in regional areas is the availability and quality of key
services, particularly health and educational services.
• Attracting and retaining young people - All industry workforce development plans highlight the challenges in attracting young people into industries where skill shortages exist.
• Ageing population - Regional areas with a high percentage of retirees
(compared with metropolitan Perth) reduce the availability of workers.
• Childcare facilities - Lack of affordable childcare facilities in regional Western
Australia is a barrier to women with children re-entering the workforce, and
workers with children relocating to the region for work.
8.2 Housing affordability and financial disincentives to home ownership
Mobility within the labour market is underpinned by the ability of the workforce to
access affordable and appropriate housing as, when, and where required. Against a
backdrop of population growth double the national rate, housing affordability remains
a critical challenge in Western Australia.
A flexible housing market is essential. Consumers must be able to access the most
appropriate option for their particular circumstances, including income, employment,
family/household type, size and age. A lack of access to affordable and appropriate
housing discourages or delays individuals from relocating to alternative locations to
pursue employment opportunities. This creates a constraint on economic
development and limits individual household economic participation and wealth
creation. Contributing factors to a lack of affordable housing in Western Australia
include:
• constrained supply of existing land and housing;
• rapid increase in demand;
���
�
• inability of the market to adapt quickly to rapid changes in market conditions;
• lack of timely delivery of development-ready land and infrastructure
constraints;
• housing supply constraints such as shortages in skilled workers, materials and
firms resulting in high costs; and
• housing supply constraints such as shortages in skilled workers, materials and
firms resulting in high costs.
For many individuals and households, their willingness to relocate to pursue
employment opportunities is constrained by financial disincentives or barriers to
moving home.
These financial disincentives include:
• Limited access to finance
The amount demanded by banks as a deposit, tighter limits on lending, and
the additional cost of Lenders Mortgage Insurance (LMI) adversely impact on
workers. The amount that banks are willing to lend to those with a 10%
deposit is insufficient to purchase a median priced property in some locations
in the State, particularly in the Pilbara and Kimberley. Regardless of income,
the amount that banks are willing to lend reduces, and in some locations
halves, when the deposit is reduced to 5%. This makes a median priced
housing inaccessible for many people. Banks will not lend to individuals for
land purchases in the North West of the State with less than a 10% deposit.
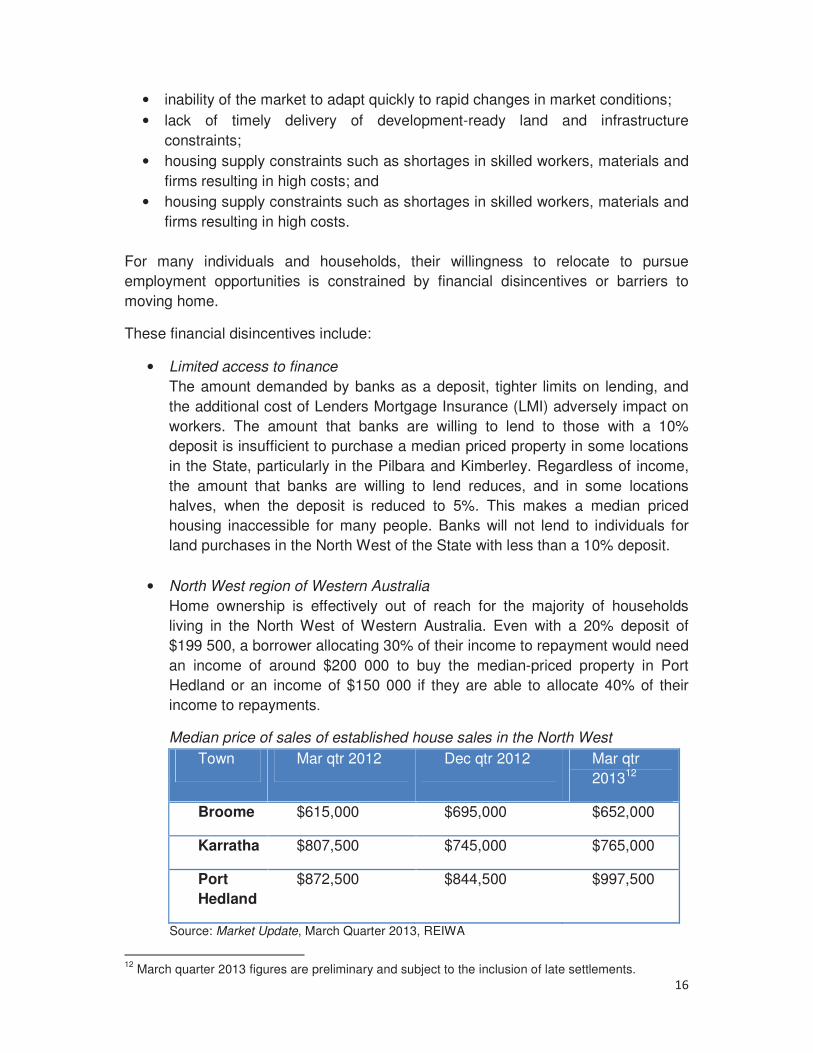
• North West region of Western Australia
Home ownership is effectively out of reach for the majority of households
living in the North West of Western Australia. Even with a 20% deposit of
$199 500, a borrower allocating 30% of their income to repayment would need
an income of around $200 000 to buy the median-priced property in Port
Hedland or an income of $150 000 if they are able to allocate 40% of their
income to repayments.
Median price of sales of established house sales in the North West
Town Mar qtr 2012 Dec qtr 2012 Mar qtr
201312
Broome $615,000 $695,000 $652,000
Karratha $807,500 $745,000 $765,000
Port
Hedland
$872,500 $844,500 $997,500
Source: Market Update, March Quarter 2013, REIWA
�������������������������������������������������������������12
March quarter 2013 figures are preliminary and subject to the inclusion of late settlements.

���
�
The following table shows the median weekly rents, the quarterly and annual
change and income needed for housing to be affordable at 30% and 50% of
income. Even when allocating 50% to rent and the recent fall in rents, very
high incomes are needed to afford the median private sector rents in Karratha
and Port Hedland.
Median weekly rents and annual incomes needed to maintain affordability in
the NW
Town March
qtr 2013
Qtly/annual
change
Affordable
at 30% of
income
Affordable
at 50% of
income
Broome $ 650 0.0%/ +4.8% $112,700 $ 67,600
Karratha $1,200 -4.0%/-25.0% $208,000 $124,800
Port Hedland
$1,675 -15.2%/-6.9% $290,300 $174,200
Source: Market Update, March Quarter 2013, REIWA
• Commonwealth Rent Assistance (CRA)
This non-taxable income supplement payment is added on to the pension,
allowance or benefit of eligible income support customers who rent in the
private rental market. Pensioners, allowees and those receiving more than the
base rate of Family Tax Benefit Part A may be eligible for Rent Assistance.
CRA improves affordability outcomes, but it varies between regions. A 2004
Australian Housing and Urban Institute study13 found that regional differences
in rents in the private rental market, in household incomes and household
structures that interact with the Australia-wide settings of CRA, result in
regional variations in the impact of CRA upon housing affordability. The study
modelled four different scenarios under which various settings of CRA were
varied and the impact on housing affordability and budget costs measured.
The uneven regional effect of CRA on rental markets and housing affordability
has flow-on impacts upon mobility overall, but particularly at lower income
levels.
Recommendation 5
Examine the potential for expansion and improvement of Commonwealth
initiatives for rental support (including the non-taxable income supplement
payment added on to the pension, allowance or benefit of eligible income
�������������������������������������������������������������13
Tony Melhuish, Anthony King and Elizabeth Taylor, “The regional impact of Commonwealth Rent Assistance” (November 2004), AHURI.

��
�
support customers who rent in the private rental market), and for improved
access to home loans in regional locations.
8.3 Access to key government and community services
Western Australia’s capacity to provide these services is restricted by the current
distribution of GST revenues according to the principle of horizontal fiscal
equalisation (HFE). The current implementation of HFE redistributes government
revenues attributable to above average economic growth to other States – it can be
characterised as a 100% tax on any above average fiscal capacity. By stripping
away growth revenues, Western Australia’s capacity to finance the up-front costs of
infrastructure (including housing support), services and facilities necessary to
facilitate national structural adjustment is eliminated (unless paid for through above
average taxes or below average services elsewhere).
Access to key and critical services has significant impact on regional labour mobility.
Workers require a level of certainty that they and their family will have access to
appropriate and reliable government and community services.
A lack of affordable housing has a significant impact on the quality and availability of
services. When businesses have to pay high housing costs for staff, these costs are
either passed on to the consumer, the level of services is reduced, or services are
withdrawn.
Infrastructure costs represent a significant challenge for State and local
governments, in particular in mining areas where planning decisions need to balance
the intense short term pressure associated with the labour intensive construction
phase of resource projects and the relatively lower, longer term labour requirements
of their operation phase.
Barriers to attracting and retaining public sector staff in regional locations of the
State impacts on geographic labour mobility, significantly in the education, police and
health sectors. Western Australia’s Public Sector Commission’s strategic planning
process (2014 to 2017) includes identification of strategies to improve public
workforce mobility.
Public Sector Commission research and consultation on recruitment issues in the
regions identified key issues, including:
o relocation allowances to and from Perth;
o housing allowances;
o accurately priced district allowances to address high costs of living in remote areas;
o school and childcare places;
o the ability to transfer back to metropolitan areas;
o the mobility of regional agency staff – ease of movement from one project to
another; and

���
�
o geographic labour mobility is also an important factor with respect to the
availability and capacity of the workforce in the Western Australian local
government sector.
Geographic labour mobility issues specific to the local government workforce
include:
o labour shortages across a number of occupational groups, common to the local
government sector nationally and to other sectors;
o substantial loss of Western Australian local government workforce to the mining
companies;
o the considerably higher wages/salaries attract differing occupational groups
depending on the stage of development of the mining operations;
o the recent trend is for employees returning to their local governments after about
two years. FIFO workforce arrangements generally do not provide benefits for
local governments and their communities, as services are utilised but there is
little advantage to the community economically and socially;
o regional local governments are unable to attract the workforce they require due to
remoteness and a lack of housing and services and facilities, particularly for families;
o the current implementation of HFE in the distribution of general purpose grants
among local governments does not enable regional local governments to
overcome these problems, particularly due to the inadequacy of Commonwealth
Government payments for remote local governments. Also, the above mentioned
problems with the distribution of GST revenues means that the State Government
does not have the capacity to assist regional local governments without levying
above average taxes or providing below average services elsewhere;
o increased engagement of employees through the 457 visa employment process;
o development of technological options such as working from home and greater
sharing of mobile workforces (e.g. environmental health officers and building
officers); and
o employees increasing drawn from locations that are a considerable distance from
the workplace, with associated increased travel time.
Recommendation 6
It is important that HFE does not mute the migration of labour across States in
response to differences in labour and capital productivity. A more ‘market
oriented’ implementation of HFE would allow States to retain some of the
proceeds of economic development, to provide the incentives and capacity to
facilitate economic growth and structural adjustment opportunities.
9. What actions does the Western Australian Government and businesses take that influence geographic labour mobility?
The Western Australian Government has a diverse range of initiatives to improve
geographic labour mobility.
��
�
9.1 Royalties for Regions
The Royalties for Regions (RfR) policy recognises challenges facing regional and
remote Western Australia, and funds initiatives to enhance the liveability and
vibrancy of regional communities across the State. This Western Australian
Government program aims to grow permanent regional populations to better service
regionally based industries and reduce the demand for FIFO workers.
Significant projects funded through the RfR program include:
• Pilbara Cities14 - aims to address the issues associated with significant growth in
the Pilbara region. The objective is to build the populations of Karratha and Port
Hedland into cities of 50 000 persons, and Newman to 15 000 persons, with
other Pilbara towns growing into more attractive and sustainable local
communities.
• SuperTowns - assists towns in the southern half of the State to plan and prepare
for the projected population expansion by creating vibrant communities with job
opportunities. Boddington, Collie, Esperance, Jurien Bay, Katanning, Manjimup,
Margaret River, Morawa and Northam are the State’s initial SuperTowns.
• Regional Airport Development Scheme15 - aims to improve regional aviation
facilities across Western Australia and enhance economic growth. The funding
has supported more than 150 aviation projects across Western Australia valued
at $67 million.
• Regional Workers Incentives Scheme - provides for an increased district
allowance for public sector employees in regional Western Australia as part of
the process to attract and retain those workers who provide essential
government services. Around 9000 regional public sector workers are potentially
eligible for the district allowance.
9.2 Housing affordability
Western Australian Government initiatives to make affordable housing accessible
include:
• Affordable Housing Strategy 2010–2020: Opening Doors to Affordable
Housing - addresses the challenge of a long term decline in affordability, an
emerging gap between supply and demand, particularly at the low cost end of the
market, and an overstretched public housing system. The Western Australian
Government works with partners and markets to increase the range of housing
options and solutions that are affordable, available and appropriate.
• Keystart Home Loans - provides a range of home ownership products through
the State Government lending provider, Keystart. The aim is to assist Western
Australians into affordable housing, and reduce pressure in other parts of the
housing market by:
�������������������������������������������������������������14
Pilbara Development Commission, http://www.pdc.wa.gov.au/pilbara-cities/about-pilbara-cities/ 15
Department of Transport, Regional Airport Development Scheme, http://www.transport.wa.gov.au/aviation/1347.asp

���
�
o increasing income limits, property purchase price caps and debt servicing
ratio; and
o decreasing the buffer rate to one closer to the major banks; and requiring a
2% deposit and no lenders mortgage insurance.
The following Keystart income limits and property purchase price caps recognise
the State's regional differences, and are currently:
Location
Income limits (per annum) Property
purchase
price caps
Singles Couples Families
Metropolitan area
$90,000 $110,000 $130,000 $450,000
Regional areas (exc. Kimberley & Pilbara)
$110,000 $130,000 $130,000 $500,000
Kimberley $120,000 $150,000 $150,000 $700,000
Pilbara $150,000 $180,000 $180,000 $850,000
As at June 2013, the housing affordability initiatives outlined above have led to
more than 10 000 opportunities being created, with 4655 households who could
not otherwise access finance helped to purchase a home through Keystart Home
Loans, and 600 households assisted to purchase a home through the
SharedStart program.
• Service worker accommodation in regional communities through the Affordable
Housing Strategy and Royalties for Region Affordable Housing Initiatives. This
ensures workers are available to maintain key and essential services in regional
Western Australian communities.
These initiatives ensure that businesses and Non-Government Organisations
(NGOs) are able to attract and retain qualified and experienced staff to maintain
quality services. Targeted housing initiatives include:
• Key service worker housing - key workers are essential to keeping regions
sustainable and the economy growing. They include, but are not limited to, skilled
and semi-skilled workers employed in the following industries: childcare,
education, emergency services, health care, hospitality, retail, trades and
manufacturing, and government employees.
In Western Australia, the lack of affordable housing in the North West, particularly
in Pilbara towns such as Port Hedland and Newman, has had a significant impact
on local businesses and their employees. The provision of discounted rents,
particularly in areas where rents are unaffordable for people on low to moderate
incomes, assists businesses and NGOs to attract and retain workers and thus
maintain services and community amenities.

���
�
The NGO Housing Strategic Intervention was a targeted $35 million initiative
funded by the Royalties for Regions Regional Infrastructure and Headworks
Fund. It delivered 58 rental properties to NGOs across the Pilbara and Kimberley
to sustain the delivery of key State Government funded services.
The State Government Royalties for Regions-supported housing package to ease
the pressure on Port Hedland’s housing shortage and high rents included the
provision of 125 service worker homes across Port and South Hedland. This
initiative addressed an immediate shortage of accommodation for service
workers in the town whilst a longer term solution was being created through the
Osprey Key Workers’ Village.
The City of Perth’s Key City Worker Apartments are subsidised through the
National Rental Affordability Scheme (NRAS) and offer rents at 20% below
market rates. They provide an opportunity for people on low to moderate incomes
to experience affordable inner city living.
• Employment Related Accommodation facilities - four Employment Related
Accommodation (ERA) facilities have been constructed under the National
Partnership Agreement on Remote Indigenous Housing (NPARIH) with the
Commonwealth Government. These provide stable, supported and affordable
accommodation for regional and remote Aboriginal apprentices, trainees and
workers who are required to travel away from their home community for work.
ERAs are currently available in Halls Creek, Broome, Derby and Fitzroy
Crossing, and two are planned for the Pilbara region.
9.3 Harmonisation of apprenticeships
Western Australia supports regional labour mobility through participation in
apprenticeship reforms to enable apprentices and trainees to move between jobs
and between States with no disadvantage.
9.4 Planning strategies
Well-planned cities, towns, and transport routes connect people to their jobs,
services, family and friends and places of recreation in Western Australia. Western
Australia’s integrated approach to planning supports regional labour mobility. For
example:
• The Urban Development Program (UDP) provides information to support inter-
agency decision-making about urban development and the provision of services
to the community. By tracking land demand and supply, and proposed
development and urban infrastructure in the State, more effective use of land,
better staging of development and prioritisation of State infrastructure investment
support urban growth.
• The Perth and Peel Development Outlook and Regional Hotspots monitor urban
and regional growth to inform effective coordination land supply and infrastructure

���
�
provision within the Perth, Peel and across selected regional centres in Western
Australia. Directions 2031 and Beyond, State Planning Strategy and Sub-regional
structure plans guide future development and provide a framework to address
infrastructure provision, transport issues, access to employment, and sustainable
land use.
Planning for land supply and employment opportunities includes the identification of
strategic industrial land estates. The clustering of related businesses and compatible
land uses provides the local labour force with opportunities for re-employment if an
existing position ends. The availability of skilled labour further encourages industries
to locate within such precincts. For example:
• The Australian Marine Complex (AMC) in Kwinana is a coordinated industrial
estate which, due to its strategic location and managed development, caters for
manufacturing, fabrication, assembly, maintenance and technology development,
servicing the marine, defence, oil and gas, and resource industries.
• Bentley Technology Park is an industry cluster co-located with Curtin University
of Technology and a CSIRO research centre, and includes a business incubator
facility. This development was designed to attract technology-based companies,
and facilitate interaction and the development of synergies, while also providing
opportunities for the development of workers with specialised skills. Currently
strategic land use planning is being undertaken to integrate Curtin University’s
expansion plans with opportunities to enhance the effectiveness of the Bentley
Technology Park.
9.5 Encouraging flexible, non-location dependant workforces
It is critical that human resource policies and managerial attitudes keep up with
technological change and the changing shape of work (see also section 10.1 below).
The State Government (Department of Commerce) website - Flexible Workplaces16-
provides information for managers and employees in small business and industry on
flexible working arrangements, including telework.
10. What are the implications of technological, structural and demographic developments on patterns of geographic labour mobility in Western Australia?
10.1 Non-location dependant workforces
Workplace flexibility is about when, where and how people work. These
arrangements are rapidly becoming essential to effective organisations profitable
businesses, and labour mobility.
Telework - where employees regularly work from a place that is other than the office,
utilises information and communications technology such as phone, fax, internet,
�������������������������������������������������������������16
Department of Commerce, Flexible workplaces https://www.commerce.wa.gov.au/labourrelations/content/FlexibleWorkplaces/index.htm

���
�
email to stay connected to colleagues and work systems. Western Australia's mining
industry has made sizable investment into autonomous and remote operations (such
as driverless trains, remotely operated mining trucks, and similar). As well as
changing the nature of work and the skills sets required, technology changes the
location required for work, can increase urban-based roles in remote centre
operations, and reduce the number of on-site roles required on each site17.
10.2 Child care
The provision of child care services in regional areas of the State is a significant
workforce challenge. The Regional Community Child Care Development Fund18
supports child care services in regional Western Australia, and ensures that parents
in regional areas have access to quality community child care.
Child care services, particularly in regional and remote areas of the State,
experience ongoing staff shortages. This occupation remains on the Western
Australian State priority occupation list19.
10.3 Aboriginal workforce development and labour mobility
It is acknowledged that Aboriginal20 people have higher rates of mobility relative to
the rest of the working-age population21. However, research has found that the very
act of moving has a negative effect on the labour market outcomes of Aboriginal
people22. Barriers to regional labour mobility for Aboriginal people in Western
Australia include:
• geographical remoteness and a lack of proximity to major job markets is
challenging for some Aboriginal people – particularly for those who usually reside
in remote locations in Western Australia. Labour mobility for Aboriginal people in
regional and remote locations of the State is impacted by traditional, cultural, and
linguistic factors. (Family and community ties impact on decisions to relocate for
�������������������������������������������������������������17
For more information, see: McNab,K.,Onate,B.,Brereton,D.,Horberry,T.,Lynas,D.and Franks,D.M., 2013, Exploring the social dimensions of autonomous and remote operation mining: Applying Social Licence in Design. Prepared for CSIRO Minerals Down Under Flagship, Mineral Futures Collaboration Cluster, by the Centre for Social Responsibility in Mining and the Minerals Industry Safety and Health Centre, Sustainable Minerals Institute, The University of Queensland, Brisbane. 18
Department of Local Government and Communities, Regional Community Child Care Development Fund http://www.communities.wa.gov.au/grants/grants/regional-community-child-care-development-fund/Pages/default.aspx 19
The State priority occupation list is an annually produced list of skilled occupations, where the occupations listed are considered priorities for guiding the funding of training in Western Australia's Vocational Education and Training sector. More information can be found here: http://www.dtwd.wa.gov.au/dtwd/detcms/portal/ 20
The terms Aboriginal, Aboriginal and Torres Strait Islander, and Indigenous in referring to the first Australians, are used interchangeably to maintain accuracy with respect to other preceding documents and initiatives. The term Aboriginal, more broadly used here, should be taken to mean Aboriginal, Aboriginal and Torres Strait Islander, and Indigenous peoples. 21
Bill, A . and Mitchell, W.F. 2006, Great Expectations: migration and labour market outcomes in Australia, Working Paper, No. 06-08, Centre of Full Employment and Equity, University of Newcastle, Newcastle, http://e1.newcastle.edu.au/coffee/pubs/wp/2006/06-08.pdf 22
Biddle, N. 2010, ‘Indigenous migration and the labour market: A cautionary tale’, Australian Journal of Labour Economics, vol. 13, no. 3, pp. 313-330.

���
�
employment for most people – especially in a State of vast distances and
expensive airfares);
• low completion rates in education (one third of Aboriginal adults in Western
Australia have completed year 12 or a post school qualification)23, and low levels
of English language, literacy and numeracy impact on work-readiness and labour
mobility; and
• lack of a driver’s licence, and limited or no access to transport, housing, and
accommodation impede regional labour mobility for Aboriginal people.
The focus of the State Government’s Training together – working together24
Aboriginal workforce development strategy is on Aboriginal participation in the
workforce, and to ensure that development and application of their skills is within a
workplace context.
Better connections between employers and Aboriginal people, and a more unified
system of support improve opportunities for individuals to gain sustainable
employment, for example:
• five Aboriginal Workforce Development Centres have been established across
the State: in Perth, Bunbury, Geraldton, Kalgoorlie and Broome; and
• the Aboriginal Business Directory WA25 aims to increase Aboriginal workforce
participation and mobility by connecting individuals with Aboriginal businesses,
and linking them to employment opportunities throughout Western Australia. As
of 6 August 2013, 150 businesses have registered. Four principal and seven
supporting sponsors have been secured to cover the costs of promoting and
operating the Directory.
Recommendation 7
Strategies to improve labour mobility and employment outcomes for Aboriginal people make connections and ‘join the dots’ between employers, job seekers, communities, service providers and governments.
�������������������������������������������������������������23
ABS, 2011 Census, (please note that the Training together – working together publication references 2006 Census data and states ‘around 20% of Aboriginal adults have completed year 12 or a post school qualification’). 24
Training together – working together: sustainable employment outcomes for Aboriginal people through training: Aboriginal workforce development strategy http://www.trainingwa.wa.gov.au/trainingwa/detcms/navigation/category.jsp?categoryID=9549938 25
Aboriginal Business Directory WA, http://www.abdwa.com.au/home.asp?cmd=

���
�
11. What effect does international migration have on geographic labour mobility in Western Australia?
11.1 Western Australian skilled migration strategy
The Western Australian skilled migration strategy26 supplements the State’s
workforce with skilled migrants to fill those jobs unable to be filled from the local
workforce. It provides a blueprint for managing Western Australia’s participation in
the national migration program and attracting labour from interstate and overseas to
provide a flexible labour market, reduce pressure on wages and support the delivery
of services.
11.2 Major changes in migration policy
A major change to Australia’s migration policy which is impacting on Western
Australia is the shift from supply-driven migration towards demand-driven outcomes,
in the form of employer and government sponsored skilled migration. For example:
• SkillSelect requires prospective applicants to submit an expression of interest
(EOI) before being invited to make a visa application. Migrants wanting to be
sponsored for employment by state/territory governments, employers or any
independent applicants (non-sponsored) must receive an invitation prior to
lodging a visa application;
• Regional Sponsored Migration Scheme (RSMS) enables employers to sponsor
skilled migrants to work in designated regional areas. Employers wishing to
sponsor under this program must demonstrate that the position cannot be filled by
an Australian citizen or permanent resident;
• Enterprise Migration Agreements (EMAs) target large scale resource projects
(capital expenditure more than two billion dollars and with a peak workforce of
more than 1500 workers) and aim to reduce the administrative burden on
employers involved in these projects; and
• Regional Migration Agreements focus on support for regional areas experiencing
labour and skill shortages.
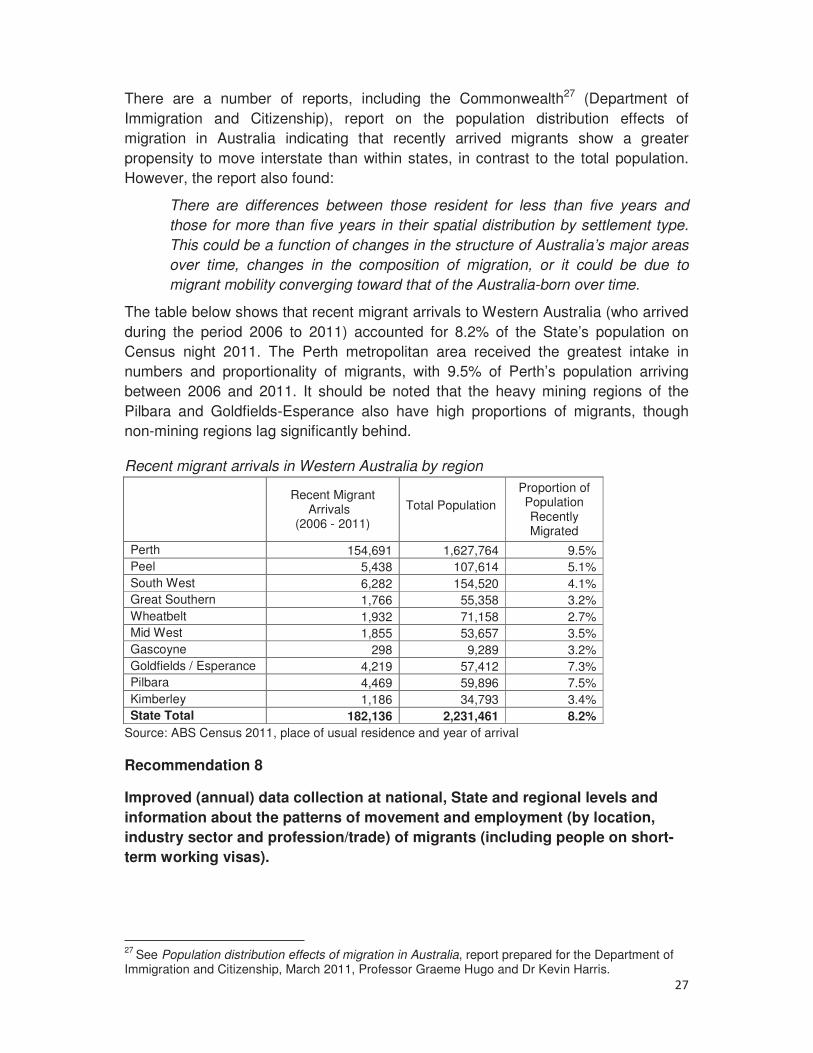
11.3 Labour mobility of recently arrived migrants into Western
Australia There is no reliable and timely system for collection of data that helps track
subsequent migration patterns of migrants once in Australia, or for migrants who
then move within Australia for work-related reasons. While Australian Bureau of
Statistics Census data provides some indication of patterns of movement, the
Census is only carried out every five years, and does not have related questions
about reasons/intentions for moving.
�������������������������������������������������������������26
DTWD, Western Australian Skilled Migration Strategy, http://www.dtwd.wa.gov.au/dtwd/detcms/apprenticeships-and-training/training-and-workforce-development/articles/western-australian-skilled-migration-strategy.en?oid=Article-id-11449218
���
�
There are a number of reports, including the Commonwealth27 (Department of
Immigration and Citizenship), report on the population distribution effects of
migration in Australia indicating that recently arrived migrants show a greater
propensity to move interstate than within states, in contrast to the total population.
However, the report also found:
There are differences between those resident for less than five years and
those for more than five years in their spatial distribution by settlement type.
This could be a function of changes in the structure of Australia’s major areas
over time, changes in the composition of migration, or it could be due to
migrant mobility converging toward that of the Australia-born over time.
The table below shows that recent migrant arrivals to Western Australia (who arrived
during the period 2006 to 2011) accounted for 8.2% of the State’s population on
Census night 2011. The Perth metropolitan area received the greatest intake in
numbers and proportionality of migrants, with 9.5% of Perth’s population arriving
between 2006 and 2011. It should be noted that the heavy mining regions of the
Pilbara and Goldfields-Esperance also have high proportions of migrants, though
non-mining regions lag significantly behind.
Recent migrant arrivals in Western Australia by region
Recent Migrant Arrivals
(2006 - 2011)
Total Population
Proportion of Population Recently Migrated
Perth 154,691 1,627,764 9.5%
Peel 5,438 107,614 5.1%
South West 6,282 154,520 4.1%
Great Southern 1,766 55,358 3.2%
Wheatbelt 1,932 71,158 2.7%
Mid West 1,855 53,657 3.5%
Gascoyne 298 9,289 3.2%
Goldfields / Esperance 4,219 57,412 7.3%
Pilbara 4,469 59,896 7.5%
Kimberley 1,186 34,793 3.4%
State Total 182,136 2,231,461 8.2%
Source: ABS Census 2011, place of usual residence and year of arrival
Recommendation 8
Improved (annual) data collection at national, State and regional levels and
information about the patterns of movement and employment (by location,
industry sector and profession/trade) of migrants (including people on short-
term working visas).
�������������������������������������������������������������27
See Population distribution effects of migration in Australia, report prepared for the Department of Immigration and Citizenship, March 2011, Professor Graeme Hugo and Dr Kevin Harris.
��
�
Attachment 1 – Additional data sources and references
The following data sources may assist the Productivity Commission in its investigations.
• Western Australian State Supplementary Survey - Labour Mobility and
Intentions, Western Australia, Oct 2008, Australian Bureau of Statistics cat. No.
6209.5.
• It should be noted that there are significant technical limitations in accessing
workforce data and using labour market forecasting modelling at the regional
level in Western Australia due to the relatively small labour markets in those
regions and to the difficulty of capturing the multiplier effects of major resource
projects with large workforce. These limitations are compounded by the lack of
detailed information on the development plans of these resource projects and on
the workforce implications of these plans. The Department of Training and
Workforce Development is investigating the development of an experimental
Regional Priority Occupation List, based on local stakeholders input.
• The 2011 Regional Price Index28 (RPI) for Western Australia was produced by
the Department of Regional Development and Lands with funding from the
Royalties for Regions program. The RPI is a cost comparison of a common
basket of goods and services across a number of regional locations to Perth.
More specifically, it identifies the differences in the price of selected goods and
services (the basket of goods and services) between regional town centres and
Perth. It is based on the premise of identifying how much it costs a person living
in Perth to buy a selection of commonly used goods and services and then
pricing these goods at different regional locations throughout Western Australia.
• The Department of Immigration and Citizenship’s (DIAC) Longitudinal Survey of
Australia's Migrants (LSIA) has detailed questions on labour market and
geographical mobility and could be extracted from changes in address across
waves.
• The DIAC Continuous Survey of Australia's Migrants is a longitudinal survey, so
technically it may enable geographical mobility analysis to be linked to labour
market.
• The Australia at Work Survey by the Workplace Research Centre, University of
Sydney is a longitudinal survey covering the period 2007-2012.
�������������������������������������������������������������28
The Department of Regional Development, Regional Price Index, http://www.drd.wa.gov.au/publications/Documents/Regional-Price-Index-2011.pdf
���
�
The following reference list may assist the Productivity Commission in its
investigations.
1. Buchanan, J., Baldwin, S. and Wright, S. (2011). “Understanding and Improving
Labour Mobility: A Scoping Paper”, NCVER Occasional Paper, Commonwealth of
Australia, Adelaide.
2. Cameron, R. (2011). “Responding to Australia’s Regional Skill Shortages
Through Regional Skilled Migration”, Journal of economic and Social Policy, Vol.
14(3), pp.1-33.
3. Khoo, S-E, McDonald, P. and Hugo, G. (2005). “Temporary Skilled Migrants in
Australia: Employment Circumstances and Migration Outcomes”, report prepared
for Department of Immigration and Multicultural and Indigenous Affairs.
4. Khoo, S-E and McDonald, P. (2006). “Temporary Skilled Migrants’ Employment
and Residence Outcomes: Findings from the Follow-up Survey of 457 Visa
Holders”, report prepared for Department of Immigration and Multicultural and
Indigenous Affairs.
5. Department of Immigration and Citizenship (2005). “Survey and Analysis of the
Regional Sponsored Migration Scheme Subclass”, Commonwealth of Australia,
ACT.
6. HRpulse (2009). “Australian Experiences with Skilled Migration – Perception and
Reality”, Research Report.
7. Bahn, S., Yap, G. and Barratt-Pugh, L. (2012). “457 Visa Workers in the Western
Australian Resources Sector”,
https://www.ecu.edu.au/__data/assets/pdf_file/0003/406353/FINAL-34028-ECU_Research_Report-Web.pdf
��
�
Attachment 2 – List of Western Australian State Government agencies that contributed to the submission
• Department of the Premier and Cabinet�
• Department of Treasury�
• Department of Training and Workforce Development�
• Public Sector Commission�
• Department of Local Government and Communities�
• Department of Planning�
• Department of Housing�
• Department of Commerce�
• Department of State Development�
• Department of Regional Development�
• C Y O’Connor Institute
• Kimberley Training Institute