West Red Lake Gold Mines Inc. - Initiating Coverage - JV with Goldcorp in the Red Lake Gold District
19
Siddharth Rajeev, B.Tech, MBA, CFA Analyst February 2, 2017 2017 Fundamental Research Corp. “10+ Years of Bringing Undiscovered Investment Opportunities to the Forefront” www.researchfrc.com PLEASE READ THE IMPORTANT DISCLOSURES AT THE BACK OF THIS REPORT West Red Lake Gold Mines Inc (CSE: RLG / OTCQB: RLGMF / FWB: HYK) - Initiating Coverage - JV with Goldcorp in the Red Lake Gold District Sector/Industry: Junior Resource www.westredlakegold.com Market Data (as of February 2, 2017) Current Price C$0.19 Fair Value C$0.51 Rating* BUY Risk* 5 (Highly Spec) 52 Week Range C$0.16 - C$0.36 Shares O/S 106,711,836 Market Cap C$20.28 mm Current Yield N/A P/E (forward) N/A P/B 1.8x YoY Return 533.3% YoY TSXV 64.4% *see back of report for rating and risk definitions. * All figures in C$ unless otherwise specified. Investment Highlights West Red Lake Gold Mines Inc.’s goal (“company”, “RLG”) is to advance their West Red Lake project to a multi-million ounce gold project over the next two to three years. An initial resource estimate on the project, announced in February 2016, showed a high grade inferred resource of 4.45 Mt at 7.57 gpt for 1.09 Moz of gold. The project, which hosts three historic gold mines, is located in the Red Lake Gold District of Northwestern Ontario, Canada - one of the richest gold producing regions in the world. The company has a 60:40 joint venture (“JV”) partnership with Goldcorp Inc. (TSX: G). The region has several toll milling options, offering the company the potential to quickly advance to production at a significantly low capital budget. Goldcorp’s Red Lake mine is 20 km from the West Red Lake project. The company has identified several opportunities to expand the resource along strike and to depth. The next phase of drilling commenced in late January. Management’s background in M&A (mergers and acquisitions), and Ontario based gold projects, is a key advantage. We are initiating coverage on RLG with a fair value estimate of $0.51 per share. Risks The value of the company is highly dependent on gold prices. Exploration and development risks. The company may have to upgrade and/or increase the identified resource to be a more attractive acquisition target. Although the Red Lake Gold District is a highly prolific region for mining, the regional geology is relatively complex. Access to capital and potential share dilution.
-
Upload
michael-dehn -
Category
Business
-
view
82 -
download
0
Transcript of West Red Lake Gold Mines Inc. - Initiating Coverage - JV with Goldcorp in the Red Lake Gold District

Siddharth Rajeev, B.Tech, MBA, CFA Analyst
February 2, 2017
2017 Fundamental Research Corp. “10+ Years of Bringing Undiscovered Investment Opportunities to the Forefront” www.researchfrc.com PLEASE READ THE IMPORTANT DISCLOSURES AT THE BACK OF THIS REPORT
West Red Lake Gold Mines Inc (CSE: RLG / OTCQB: RLGMF / FWB: HYK) - Initiating Coverage - JV with Goldcorp in the Red Lake Gold District Sector/Industry: Junior Resource www.westredlakegold.com Market Data (as of February 2, 2017)
Current Price C$0.19 Fair Value C$0.51 Rating* BUY Risk* 5 (Highly Spec) 52 Week Range C$0.16 - C$0.36 Shares O/S 106,711,836 Market Cap C$20.28 mm Current Yield N/A P/E (forward) N/A P/B 1.8x YoY Return 533.3% YoY TSXV 64.4%
*see back of report for rating and risk definitions. * All figures in C$ unless otherwise specified.
Investment Highlights West Red Lake Gold Mines Inc.’s goal (“company”, “RLG”) is to
advance their West Red Lake project to a multi-million ounce gold project over the next two to three years. An initial resource estimate on the project, announced in February 2016, showed a high grade inferred resource of 4.45 Mt at 7.57 gpt for 1.09 Moz of gold.
The project, which hosts three historic gold mines, is located in the Red Lake Gold District of Northwestern Ontario, Canada - one of the richest gold producing regions in the world.
The company has a 60:40 joint venture (“JV”) partnership with Goldcorp Inc. (TSX: G).
The region has several toll milling options, offering the company the potential to quickly advance to production at a significantly low capital budget. Goldcorp’s Red Lake mine is 20 km from the West Red Lake project.
The company has identified several opportunities to expand the resource along strike and to depth. The next phase of drilling commenced in late January.
Management’s background in M&A (mergers and acquisitions), and Ontario based gold projects, is a key advantage.
We are initiating coverage on RLG with a fair value estimate of $0.51 per share.
Risks The value of the company is highly dependent on gold prices. Exploration and development risks. The company may have to upgrade and/or increase the identified
resource to be a more attractive acquisition target. Although the Red Lake Gold District is a highly prolific region for
mining, the regional geology is relatively complex. Access to capital and potential share dilution.

Page 2
2017 Fundamental Research Corp. “10+ Years of Bringing Undiscovered Investment Opportunities to the Forefront” www.researchfrc.com PLEASE READ THE IMPORTANT DISCLOSURES AT THE BACK OF THIS REPORT
Background Location
RLG, based out of Toronto, Canada, is a junior resource company focused on the West Red Lake project, located at the west-end of the Red Lake Gold District of Northwestern Ontario. The project holds properties totaling 3,100 hectares, including three historic gold mines. RLG has a 60% interest in the Rowan Mine (Goldcorp owns the remaining 40%), and a 100% interest in two other historic mines, namely the Mount Jamie Mine and the Red Summit Mine. The company was previously known as Hy Lake Gold Inc. Although the corporation was incorporated in November 1991, it began operating as a resource company only in October 2005. Its focus has always been on the Red Lake region. The properties in the current portfolio were acquired through various option agreements signed between 2005 and 2010. In October 2012, Tom Meredith was appointed as the Chairman of the Board of Directors. Mr. Meredith was the CEO of Lexam VG Gold (TSX: LEX). Robert McEwen is the Chairman of Lexam. Lexam’s predecessor was VG Gold, a company focused on gold projects in Timmins, Ontario, and run by Tom Meredith. VG Gold attracted a strategic investment from Rob McEwen’s Lexam Exploration in 2009. The two companies subsequently merged and formed Lexam VG Gold. Ken Guy, the Exploration Manager of Lexam, started working with RLG in 2014. John Kontak, who was the President of Victory Gold Mines, joined RLG in 2014. Victory Gold was also focused on Timmins, and was acquired by Northern Gold Mining Inc. (now Osisko Mining / TSX: OSK) in 2013. We believe the new team’s background in M&A and Ontario based gold projects is a key advantage of company. RLG’s three historic mines are located in Todd, Hammell Lake, and Fairlie townships. The project consists of 145 contiguous patented, leased, and staked mining claims located 16 km northwest of the town of Red Lake, and approximately 20 km west of Goldcorp’s Red Lake mine, and the Campbell mine, located in Balmertown, Ontario. The following maps show the location of the West Red Lake project within Red Lake, and the well-known mines in the region.

Page 3
2017 Fundamental Research Corp. “10+ Years of Bringing Undiscovered Investment Opportunities to the Forefront” www.researchfrc.com PLEASE READ THE IMPORTANT DISCLOSURES AT THE BACK OF THIS REPORT
Source: Company

Page 4
2017 Fundamental Research Corp. “10+ Years of Bringing Undiscovered Investment Opportunities to the Forefront” www.researchfrc.com PLEASE READ THE IMPORTANT DISCLOSURES AT THE BACK OF THIS REPORT
The Red Lake Gold District is one of the richest (high-grade) gold producing regions in the world having produced over 30 Moz. Goldcorp’s Red Lake mine is one of the largest gold mines in Canada. The Red Lake mine, and the Campbell mine, have produced over 18 Moz over the past 75 years. The following table shows a summary of Goldcorp’s recent production history at Red Lake.
Production Summary 2013 2014 2015Gold produced (oz) 493,000 414,400 375,700Gold grade (g/t) 20.3 19.5 18.4Gold recovery (%) 95% 96% 96%All-in sustaining costs (US$/oz) $880 $934 $906Throughput (tpd) 2,160 1,870 1,770Mining costs (US$/t mined) $233 $217 $198Processing costs (US$/t milled) $47 $48 $49 Source: Goldcorp.
In 2015, 375,700 oz were produced from very high-grade (18.4 gpt) ore. Goldcorp’s processing facilities in the region have a capacity of 3,500 tpd. However, 2015’s throughput of 1,770 tpd suggests the utilization rate is currently at just over 50%. We believe this is highly encouraging for RLG as it offers toll milling opportunities for RLG’s gold projects. Another gold project that is worth mentioning in the region is the Madsen gold project, owned by Pure Gold Mining Inc. (TSXV: PGM). Madsen, which hosts three past producing mines, holds a very high grade gold deposit with an indicated resource of 928 koz (8.93 gpt) and an inferred resource of 297 koz (11.74 gpt), using a cut-off grade of 5 gpt. Historic production from the project was 2.5 Moz at an average grade of 9.9 gpt. The project has a 550 tpd mill. Madsen is approximately 12 km from RLG’s projects. A 2016 preliminary economic assessment (“PEA”) indicated an average annual production of 58 koz, and an after-tax Net Present Value (“NPV”) at 5%, of $76 million at a gold price of US$1,175 / oz. Although the indicated and inferred resources total 1.23 Moz, the PEA used 0.26 Moz as only mineral resources above 600 m depth were considered. Rubicon Minerals Corporation (TSX: RMX) owns the Phoenix Gold project, which is 40 km (by road) from RLG’s projects. Phoenix has an indicated resource of 106 koz (6.73 gpt) and an inferred resource of 307 koz (6.28 gpt), using a cut-off grade of 4 gpt. The project was in production for a short period in 2015. The existing processing facility has a throughput capacity of 1,250 tpd. We believe the presence of other facilities in the region is a major positive for RLG as it offers the potential for RLG to advance to production at a significantly lower cost. This feature also improves their attractiveness as an acquisition target. Potential competition for RLG, we believe, could come from the high-grade Cochenour project, also owned by Goldcorp. Goldcorp is conducting exploratory work on the project,

Page 5
2017 Fundamental Research Corp. “10+ Years of Bringing Undiscovered Investment Opportunities to the Forefront” www.researchfrc.com PLEASE READ THE IMPORTANT DISCLOSURES AT THE BACK OF THIS REPORT
Regional Geology Rowan and Red Summit
which is only 5 km from the Red Lake mine. Cochenour does not have a resource estimate at this time. Another possible competitor is Confederation Minerals Ltd.’s (TSXV: CFM) Newman Todd gold project. However, their resource is significantly lower and is of much lower grade. Newman Todd has an indicated resource of 99koz (2.76 gpt for open pit and 3.36 gpt for underground) and an inferred resource of 123koz (2.78 gpt for open pit and 4.54 gpt for underground). The West Red Lake project, estimated to have a strike length of approximately 12 km, is situated along the east-west trending Pipestone Bay St Paul Deformation Zone. Another key regional geological zone is the Golden Arm Structure and the sub-parallel NT Zone which strikes northeast on to the project. The company has been exploring the property both along strike and to depth.
Source: Company
The gold mineralization in the region is primarily associated with quartz veining. Gold mineralization in RLG’s project are primarily confined to a number of narrow quartz veins. These veins are hosted by moderate to steeply dipping shear zones and faults, with locally associated shallow dipping extensional veins and hydrothermal breccias. Gold mineralization in the region is estimated to extend to depths over 2,000 m. To put things in perspective, the depth of the Red Lake Mine is 1,820 m, and the Campbell shaft is at 1,315 m. Although the region has high potential for high-grade mineralization, one of the key challenges is the high variation in vein density (grade). For example, Rubicon Minerals had to recently revise Phoenix’s resource estimate downwards. Rubicon attributed the downgrade to their deposit being more geologically complex, and that the high-grade gold mineralization is less continuous than previously understood. Overview The Rowan Mine project is a 60:40 joint venture (consisting of 117 claims) between the company and Goldcorp. The project also includes two additional claims, called the Red Summit Mine claims, on which the company has a 100% interest.

Page 6
2017 Fundamental Research Corp. “10+ Years of Bringing Undiscovered Investment Opportunities to the Forefront” www.researchfrc.com PLEASE READ THE IMPORTANT DISCLOSURES AT THE BACK OF THIS REPORT
The company had originally entered into an option agreement with Goldcorp in 2007. RLG earned a 60% interest in 2010, and became the project’s operating partner by incurring $2.50 million in exploration expenses over 3 years, and issuing 1 million common shares to Goldcorp. Goldcorp has the option to re-acquire an additional 11% interest in the JV for $7 million once the JV spends $5 million on the project; such a scenario will result in a 51: 49 JV between Goldcorp and the company. The two Red Summit Mine claims, which are located to the east of the Rowan Mine, were acquired in 2009 from Claude Resources Inc. (acquired by Silver Standard Resources / TSX: SSO) for $25k in cash and $100k in exploration expenses. These claims are subject to a 3% NSR, of which 1% can be acquired for $0.50 million. Accessibility The Rowan Mine property is accessed by good condition roads (55 km) from Balmertown. The property can also be accessed by water (on the south) from Red Lake. The neighboring lakes offer the properties sufficient access to water for future operations. Power to the sites can be sourced from the existing local infrastructure. Historic Development and Production Gold was originally discovered at the Rowan Mine project in 1928. Several parties have intermittently operated the project since then. The mine was in production from 1986 to 1988, which resulted in the recovery of 1,298 oz of gold from 13,023 tons at 3.1 gpt. A NI 43-101 compliant technical report published on the project in February 2016, indicated that the historic records of mining are ambiguous due to poor record keeping. The existing mine infrastructure include a vertical shaft, 3 levels (including an adit on the first level), and underground exploration of drifting and raising along gold zones. Goldcorp subsequently acquired the property in 1994 through its amalgamation with the Dickenson Group of Companies. Goldquest Explorations Inc., which was a part of the Dickenson Group, held the property at that time. Goldcorp subsequently optioned the property to King's Bay Gold Corporation (TSXV: KBG) and a 23 hole (4,846 m) drill program was conducted in 2006, to test the geological and geophysical anomalies in the Rowan Mine shaft. The option was subsequently dropped by King’s Bay. The Red Summit Mine claims were reported to be in production in 1936, and it was reported that high grade ore produced 277 oz of gold and 65 oz of silver from 591 tons. Upon entering into the option agreement with Goldcorp in 2007, RLG conducted several drill programs on the project. The primary focus was on the 1.2 km portion of strike length located in the Rowan Mine area, down to a depth of approximately 350 m. The following table provides a summary of the various drill programs.

Page 7
2017 Fundamental Research Corp. “10+ Years of Bringing Undiscovered Investment Opportunities to the Forefront” www.researchfrc.com PLEASE READ THE IMPORTANT DISCLOSURES AT THE BACK OF THIS REPORT
2010 - 2011 2012 - 2013 2014 2015 2016 2017 (Est.)
Drilled 11,216 m Drilled 8,416 m Drilled 1,416 m Drilled 1,767 m Drilled 5,176 m Exploration Drilling
Earned a 60% interest in the Rowan Mine Property
Expanded Rowan Mine Gold Zones and NT Zone
Drilled Rowan Mine Gold Zones Develop NI 43-101 Report NI 43-101 Report Filed
Feb 18Preliminary Permitting
Work
Resource Estimate The February 2016 technical report showed an inferred resource of 4.45 Mt at 7.57 gpt for 1.09 Moz of gold.
Tonnes Au (gpt) Au (Moz)
Inferred Resource 4,468,900 7.57 1,087,700 The resource was calculated based on a database of 570 diamond drill holes, and 36,062 assay records. The base-case estimate used a cut-off grade of 3gpt. The following table shows the sensitivity of the resource estimate to various cut-off grades.
Cut-Off (gpt) Tonnes Au (gpt) Au (Moz)5.0 2,602,400 10.25 857,900 4.0 3,332,000 8.98 962,100 3.0 4,468,900 7.57 1,087,700 2.0 5,736,400 6.45 1,188,600 1.0 9,379,300 4.48 1,351,800
The following chart shows the location of the current resource and the expansion potential along depth and across multiple zones to the east.

Page 8
2017 Fundamental Research Corp. “10+ Years of Bringing Undiscovered Investment Opportunities to the Forefront” www.researchfrc.com PLEASE READ THE IMPORTANT DISCLOSURES AT THE BACK OF THIS REPORT
Rowan Mine Gold Zones and Structural Intersection
The resource expansion is expected from the following: Upgrade the current inferred resources to measured / indicated resources
Potential to expand the Rowan Mines Zones to depth; the currently identified
resources are only up to a depth of 350m. As mentioned earlier, mineralization in the region is known to continue to depth of over 2,000 m.
Evaluate a Structural Intersection target situated between the Rowan Mine and the
Red Summit Mine. The Structural Intersection is situated on the intersection of the Pipestone Bay St Paul Deformation Zone, the Golden Arm Structure, and the NT Zone between 1 km and 2 km east of the Rowan Mine shaft. The NT Zone is estimated to strike northeast-southwest across the Rowan Mine property for approximately 3 km, with a width of approximately 100m. The Structural Intersection area is estimated to be 1.3 km in width and 2 km in length. This is an exciting prospect for RLG as the intersection of two major regional geological structures typically creates a good environment for huge gold deposits. Goldcorp’s Red Lake Mine is also situated in a similar structural intersection.
Red Summit Mine hosts several known gold zones, including a 575 ft shaft, which are extremely underexplored. RLG’s drilling indicates that the gold mineralization envelope extends for at least 150 m southeast of the mine workings, with a northeast width of about 200 m.

Page 9
2017 Fundamental Research Corp. “10+ Years of Bringing Undiscovered Investment Opportunities to the Forefront” www.researchfrc.com PLEASE READ THE IMPORTANT DISCLOSURES AT THE BACK OF THIS REPORT
Source: Company Current Drill Program In December 2016, the company announced positive results of a 8-hole / 2,811m drill program. Six holes tested the down dip extension of the Rowan Mine zones, and two holes further tested the potential of the Structural Intersection area. The program was successful in intersecting additional high grade gold mineralization in the structural intersection area, and in expanding the gold zones to depth in the western portion of the Rowan Mine area. Highlights of the drill results are presented below: Structural Intersection 26.85 gpt over 1m
Rowan Mine 8.74 gpt over 3.5m, including 23.01 gpt Au over 1m 8.97 gpt Au over 1.2m 1.88 gpt Au over 12.3m, including 24.23 gpt Au over 0.5m 11.66 gpt Au over 1.1m
Development Timeline / Strategy The next drilling program will focus on expanding the eastern portion of the Rowan Mine to depth and along strike, and the eastern side of the structural intersection area. The program is likely to include 8 holes / 3,000 m, for a capital budget of $450,000.

Page 10
2017 Fundamental Research Corp. “10+ Years of Bringing Undiscovered Investment Opportunities to the Forefront” www.researchfrc.com PLEASE READ THE IMPORTANT DISCLOSURES AT THE BACK OF THIS REPORT
Mount Jamie
Management’s goal is to keep expanding the gold mineralization over the next two years. Preliminary environmental studies are ongoing. Overview The 100% owned Mount Jamie mine, consisting of 26 claims, is located to the west of the Rowan mine. The property is located in Todd Township. The following table shows the company’s various option agreements to acquire the 26 claims. The company has exercised their options to acquire a 100% interest in all the claims listed below.
Year (Option Agreement) Asset Interest Seller Price
2005 9 claims 75% Jamie Frontier Resources Inc.
$80k cash, 550k common shares, $1M in exploration expenses, and a 3% NSR.
2007 9 claims 25% Gsont Holdings Limited 2 million common shares
2007 5 claims 100% Martin Bobinski and Antony Maciejewski
$70k cash, 200k common shares, $140k exploration expense, 3% NSR (2% can be repurchased for $2M), and $500k upon completing a bankable
feasibility study.
2007 6 claims 100% Martin Bobinski and Antony Maciejewski
150k common shares and a 3% NSR (2% of which can be repurchased for $2M).
2008 4 claims 100% Rubicon Minerals Corporation
$50k cash, 75k common shares, and a 2% NSR(1% of which can be repurchased for $1M)
2010 2 claims 100%Perry English on behalf of
Rubicon Minerals Corporation
$107k cash, 600k common shares, and a 2% NSR (1% of which can be repurchased for $1M)
Historic Development and Production Gold was first discovered on the property in 1920. As with Rowan, this project was also subject to intermittent work by several operators. The property was put into production in 1935, and production continued until 1942. The existing infrastructure includes two shafts on two known veins. Shaft 1 is at a depth of 772 feet, with 3,200 feet of lateral development and 630 feet
of raising on four levels.
Shaft 2 is at a depth of 559 feet with minor lateral development on the first level. A 100 tpd mill was constructed and about 2,000 to 3,000 tons of material was mined

Page 11
2017 Fundamental Research Corp. “10+ Years of Bringing Undiscovered Investment Opportunities to the Forefront” www.researchfrc.com PLEASE READ THE IMPORTANT DISCLOSURES AT THE BACK OF THIS REPORT
(average gold grade of 13.3 gpt), some of which was treated and the rest stockpiled. Resource Estimate RLG calculated a resource estimate of approximately 21 koz (average grade of 13.3 gpt) on the property in 2010. The resource calculation was conducted only in the area of the historic mine workings. The following table shows a summary.
Tonnes Au (gpt) Au (Moz)No. 1 Shaft Area Measured + Indicated 23,920 14.7 11,252 Inferred 4,100 13.6 1,784 No. 2 Shaft Area Indicated 3,582 9.7 1,108 Central Area Inferred 7,817 11.8 2,949 East Boundary ZoneInferred 9,072 13.1 3,812 Surface Stockpile 1,269 6.9 279 TotalMeasured + Indicated 28,771 13.7 12,639 Inferred 20,989 12.7 8,545
The main focus of exploration has been gold zones situated in the area of the mine shaft. Management estimates that good exploration potential exists to expand the Mount Jamie Mine gold zones along strike and to depth. In particular, the North Zone, which is situated 200 m to the north of the mine shaft, is estimated to be an extension of the Rowan Mine gold system, as shown below.

Page 12
2017 Fundamental Research Corp. “10+ Years of Bringing Undiscovered Investment Opportunities to the Forefront” www.researchfrc.com PLEASE READ THE IMPORTANT DISCLOSURES AT THE BACK OF THIS REPORT
Management
Source: Company Development Timeline / Strategy Management does not have immediate plans for this property as all of their focus is on the Rowan Mine exploration / development program. Our discussions with management indicated that their target is to expand the known resource of the project initially to over 2 Moz, and potentially position the company as an acquisition target. As noted earlier, we believe the proximity to toll milling facilities in the region is a major advantage for the project. Management and board members combined hold 4.45 million shares, or 4.4% of the total outstanding shares.
Management Shares % of TotalTom Meredith, Executive Chairman 1,638,467 1.5%John Kontak, President & Director 2,830,000 2.7%Daniel Crandall, Director and Audit Committee Chair 75,000 0.1%Michael Dehn, Director 3,000 0.0%John Heslop, Vice ChairmanTotal 4,446,467 4.4% The largest institutional shareholder is Toronto based investment firm, Accilent Capital

Page 13
2017 Fundamental Research Corp. “10+ Years of Bringing Undiscovered Investment Opportunities to the Forefront” www.researchfrc.com PLEASE READ THE IMPORTANT DISCLOSURES AT THE BACK OF THIS REPORT
Management Inc. Accilent owns 28.47 million shares, or 27% of the total outstanding. Brief biographies of the management team and board members, as provided by the company, follow: Tom Meredith, Executive Chairman Mr. Meredith has 30 years experience in the junior mining industry. Previously he was the President & CEO of Lexam VG Gold from 1995 to 2011 where he led the development of four gold projects in Timmins, Ontario. During the early 1990's he served as the Vice President of Operations for Northfield Minerals where he was responsible for initiating production at the Cheminis Gold Mine near Kirkland Lake, Ontario. John Kontak, President and Director Mr. Kontak was previously the President of Victory Gold Mines from 2010 to 2013 where he managed the publicly listed company and the exploration and development of its former producing Gold Pike Mine until the company was acquired following a takeover offer made by Northern Gold Mining. From 2007 to 2010 he was the President of a junior exploration and development company Batavia Energy until the company sold its resource assets pursuant to a proposed acquisition by CBM Asia Development Corp. Mr. Kontak has also been a director of several junior resource companies with projects both in Canada and internationally. He has an MBA from Suffolk University in Boston and a LL.B. from Dalhousie Law School. Ken Guy, Exploration Manager Mr. Guy, P.Geo. and a Qualified Person according to NI 43-101, has over 25 years of experience in exploration and development projects in Northern Ontario. Previous to West Red Lake Gold Mines, Mr. Guy was associated with Lexam VG Gold, Cyprus Amax, BP Selco, and Getty Metals. Daniel Crandall, Director and Audit Committee Chair Mr. Crandall has provided CFO, accounting, regulatory compliance, and management advisory services to numerous issuers on the TSX and TSX-Venture exchanges. Previously, he was a Manager at Collins Barrow Toronto LLP, a public accounting firm where he worked for over five years. Mr. Crandall holds a CPA, CA, as well as an Honours Bachelor of Accounting degree from Brock University. John Heslop, Vice Chairman Mr. Heslop is a professional geologist with over 40 years in the natural resource sector. Starting in 1987 Mr. Heslop was President & CEO and a Director of Thundermin Resources until it was acquired by Rambler Resources in January of 2016. Mr. Heslop served as President of the PDAC in 1996 and 1997. Currently Mr. Heslop serves on the Awards Committee of the PDAC and is Chairman of the PDAC Mining Matters charitable foundation. Mr. Heslop has a Bachelor of Science degree (Honours Geology) from the University of Western Ontario and a Master of Science degree (Economic Geology) from Carleton University.

Page 14
2017 Fundamental Research Corp. “10+ Years of Bringing Undiscovered Investment Opportunities to the Forefront” www.researchfrc.com PLEASE READ THE IMPORTANT DISCLOSURES AT THE BACK OF THIS REPORT
Michael Dehn, Director With over 20 years of experience in the mining industry, Michael was President, CEO and Director of Nayarit Gold Inc. from September 2005 to April 2007. Between 1994 and 2005, he worked as an exploration geologist and later as a Senior Geologist with Goldcorp Inc. Michael has been a director of publicly traded and private junior mining companies. His expertise lies in grassroots to advanced minerals exploration, and marketing and financing junior companies. Michael has extensive technical knowledge of the Red Lake District. Our net rating on RLG’s management team is 3.8 out of 5.00 (see below).
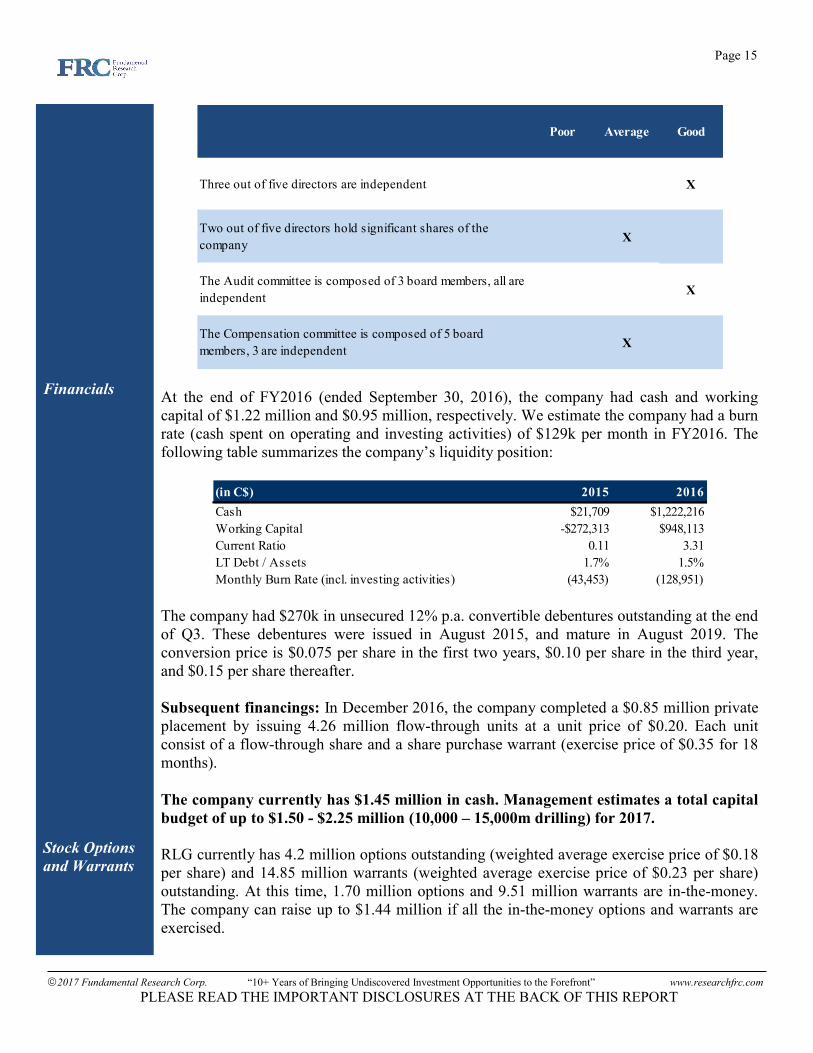
The company’s board has five members, of which, three are independent. We believe that the Board of Directors of a company should include independent or unrelated directors who are free of any relationships or business that could materially interfere with the director’s ability to act in the best interest of the company. An unrelated/independent director can be a shareholder. The following table shows our analysis on the strength of RLG’s board.
Page 15
2017 Fundamental Research Corp. “10+ Years of Bringing Undiscovered Investment Opportunities to the Forefront” www.researchfrc.com PLEASE READ THE IMPORTANT DISCLOSURES AT THE BACK OF THIS REPORT
Financials Stock Options and Warrants
Poor Average Good
Three out of five directors are independent X
Two out of five directors hold significant shares of the company X
The Audit committee is composed of 3 board members, all are independent X
The Compensation committee is composed of 5 board members, 3 are independent X
At the end of FY2016 (ended September 30, 2016), the company had cash and working capital of $1.22 million and $0.95 million, respectively. We estimate the company had a burn rate (cash spent on operating and investing activities) of $129k per month in FY2016. The following table summarizes the company’s liquidity position:
(in C$) 2015 2016Cash $21,709 $1,222,216Working Capital -$272,313 $948,113Current Ratio 0.11 3.31 LT Debt / Assets 1.7% 1.5%Monthly Burn Rate (incl. investing activities) (43,453) (128,951)
The company had $270k in unsecured 12% p.a. convertible debentures outstanding at the end of Q3. These debentures were issued in August 2015, and mature in August 2019. The conversion price is $0.075 per share in the first two years, $0.10 per share in the third year, and $0.15 per share thereafter. Subsequent financings: In December 2016, the company completed a $0.85 million private placement by issuing 4.26 million flow-through units at a unit price of $0.20. Each unit consist of a flow-through share and a share purchase warrant (exercise price of $0.35 for 18 months). The company currently has $1.45 million in cash. Management estimates a total capital budget of up to $1.50 - $2.25 million (10,000 – 15,000m drilling) for 2017. RLG currently has 4.2 million options outstanding (weighted average exercise price of $0.18 per share) and 14.85 million warrants (weighted average exercise price of $0.23 per share) outstanding. At this time, 1.70 million options and 9.51 million warrants are in-the-money. The company can raise up to $1.44 million if all the in-the-money options and warrants are exercised.

Page 16
2017 Fundamental Research Corp. “10+ Years of Bringing Undiscovered Investment Opportunities to the Forefront” www.researchfrc.com PLEASE READ THE IMPORTANT DISCLOSURES AT THE BACK OF THIS REPORT
Valuation and Rating
The following table shows the Enterprise Value (“EV”) to resource ratio of RLG and its comparables in the region.
Resource cut-off grade (gpt) Company M & I (Moz) Inferred
(Moz)Resource*
(Moz)Enterprise
Value (EV) $, M
EV / Resource ($ / oz)
0.85 (open) / 2.2 (UG) Confederation Minerals Ltd 0.10 0.12 0.16 $9.80 $61.06
5 gpt Pure Gold 0.93 0.30 1.08 $76.70 $71.25
4 gpt Rubicon Minerals 0.11 0.31 0.26 $185.10 $713.29
3gpt West Red Lake 0.01 0.66 0.34 $19.05 $55.49
4gpt West Red Lake 0.01 0.59 0.31 $19.05 $62.33
* 100% of M&I + 50% of Inferred As shown in the above table, RLG’s shares are undervalued compared to its comparables. Our Discounted Cash Flow (“DCF”) valuation on RLG is $0.51 per share. Our base-case assumption is that the company will be able to pursue one of the toll milling options. A summary of all the assumptions and estimates are shown in the table below. Note that, as the projects are in early stages, our assumptions are very preliminary and were made based on the historical work conducted on the projects and information on the comparables in the region.

Page 17
2017 Fundamental Research Corp. “10+ Years of Bringing Undiscovered Investment Opportunities to the Forefront” www.researchfrc.com PLEASE READ THE IMPORTANT DISCLOSURES AT THE BACK OF THIS REPORT
DCF ValuationThroughput 550 tpdOperating Life (years) 10 Recovery 90%Average Annual Production (Au oz) 47,874Average Price of Au (US$/oz) $1,300Average exchange rate (US$:C$) 1.10 Operating Cost (LOM) in $/t $210Initial Capital Cost ($) $35,000,000Discount Rate 11.5%Tax 25%After-Tax Net Asset Value ($) of Rowan $81,641,153 RLG's 60% Interest $48,984,692Book Value of Other Projects $6,011,545Working Capital - Debt $1,355,791 Fair Value of RLG $56,352,028 No. of Shares * 109,713,649Fair Value per Share ($) $0.51 * calculated based on the treasury stock method
The following tables show the sensitivity of our fair value estimate to the key inputs, including the gold price, exchange rate, operating cost and discount rate.

Page 18
2017 Fundamental Research Corp. “10+ Years of Bringing Undiscovered Investment Opportunities to the Forefront” www.researchfrc.com PLEASE READ THE IMPORTANT DISCLOSURES AT THE BACK OF THIS REPORT
Risks
0.51 $900 $1,100 $1,300 $1,500 $1,700$1.00 -$0.02 $0.18 $0.38 $0.58 $0.78$1.05 $0.03 $0.24 $0.45 $0.66 $0.87$1.10 $0.07 $0.29 $0.51 $0.73 $0.96$1.20 $0.16 $0.40 $0.64 $0.89 $1.13$1.30 $0.25 $0.51 $0.77 $1.04 $1.30
US$:C$ - 1.10.51 160.00 185.00 210.00 235.00 260.00
5.0% $1.01 $0.87 $0.74 $0.60 $0.478.0% $0.85 $0.74 $0.62 $0.51 $0.3911.5% $0.71 $0.61 $0.51 $0.42 $0.3215.0% $0.59 $0.51 $0.43 $0.35 $0.2620.0% $0.47 $0.41 $0.34 $0.27 $0.20
Gold Price (US$ / oz)
Exchange Rate
(US$:C$)
Operating Cost ($/t)
Discount Rate
Based on the above, we initiate coverage on RLG with a BUY rating and a fair value estimate of $0.51 per share. We believe the company is exposed to the following key risks (not exhaustive): The value of the company is highly dependent on gold prices. Exploration and development risks. Our current valuation is based on the assumption that the company will be able to pursue
one of the toll milling options in the region. The company may have to upgrade and / or increase the identified resource to be a more
attractive acquisition target. Although the Red Lake Gold District is a highly prolific region for mining, the regional
geology is relatively complex. A potential acquisition may take longer than expected. Access to capital and potential share dilution. As with most junior exploration / development companies, we rate RLG’s shares a risk of 5 (Highly Speculative).

Page 19
2017 Fundamental Research Corp. “10+ Years of Bringing Undiscovered Investment Opportunities to the Forefront” www.researchfrc.com PLEASE READ THE IMPORTANT DISCLOSURES AT THE BACK OF THIS REPORT
Fundamental Research Corp. Equity Rating Scale: Buy – Annual expected rate of return exceeds 12% or the expected return is commensurate with risk Hold – Annual expected rate of return is between 5% and 12% Sell – Annual expected rate of return is below 5% or the expected return is not commensurate with risk Suspended or Rating N/A— Coverage and ratings suspended until more information can be obtained from the company regarding recent events. Fundamental Research Corp. Risk Rating Scale: 1 (Low Risk) - The company operates in an industry where it has a strong position (for example a monopoly, high market share etc.) or operates in a regulated industry. The future outlook is stable or positive for the industry. The company generates positive free cash flow and has a history of profitability. The capital structure is conservative with little or no debt. 2 (Below Average Risk) - The company operates in an industry where the fundamentals and outlook are positive. The industry and company are relatively less sensitive to systematic risk than companies with a Risk Rating of 3. The company has a history of profitability and has demonstrated its ability to generate positive free cash flows (though current free cash flow may be negative due to capital investment). The company’s capital structure is conservative with little to modest use of debt. 3 (Average Risk) - The company operates in an industry that has average sensitivity to systematic risk. The industry may be cyclical. Profits and cash flow are sensitive to economic factors although the company has demonstrated its ability to generate positive earnings and cash flow. Debt use is in line with industry averages, and coverage ratios are sufficient. 4 (Speculative) - The company has little or no history of generating earnings or cash flow. Debt use is higher. These companies may be in start-up mode or in a turnaround situation. These companies should be considered speculative. 5 (Highly Speculative) - The company has no history of generating earnings or cash flow. They may operate in a new industry with new, and unproven products. Products may be at the development stage, testing, or seeking regulatory approval. These companies may run into liquidity issues, and may rely on external funding. These stocks are considered highly speculative. Disclaimers and Disclosure The opinions expressed in this report are the true opinions of the analyst about this company and industry. Any “forward looking statements” are our best estimates and opinions based upon information that is publicly available and that we believe to be correct, but we have not independently verified with respect to truth or correctness. There is no guarantee that our forecasts will materialize. Actual results will likely vary. The analyst and Fundamental Research Corp. “FRC” does not own any shares of the subject company, does not make a market or offer shares for sale of the subject company, and does not have any investment banking business with the subject company. Fees were paid by RLG to FRC. The purpose of the fee is to subsidize the high costs of research and monitoring. FRC takes steps to ensure independence including setting fees in advance and utilizing analysts who must abide by CFA Institute Code of Ethics and Standards of Professional Conduct. Additionally, analysts may not trade in any security under coverage. Our full editorial control of all research, timing of release of the reports, and release of liability for negative reports are protected contractually. To further ensure independence, RLG has agreed to a minimum coverage term including an initial report and three updates. Coverage cannot be unilaterally terminated. Distribution procedure: our reports are distributed first to our web-based subscribers on the date shown on this report then made available to delayed access users through various other channels for a limited time. The distribution of FRC’s ratings are as follows: BUY (71%), HOLD (8%), SELL (4%), SUSPEND (17%). To subscribe for real-time access to research, visit http://www.researchfrc.com/subscribe.php for subscription options. This report contains "forward looking" statements. Forward-looking statements regarding the Company and/or stock’s performance inherently involve risks and uncertainties that could cause actual results to differ from such forward-looking statements. Factors that would cause or contribute to such differences include, but are not limited to, continued acceptance of the Company's products/services in the marketplace; acceptance in the marketplace of the Company's new product lines/services; competitive factors; new product/service introductions by others; technological changes; dependence on suppliers; systematic market risks and other risks discussed in the Company's periodic report filings, including interim reports, annual reports, and annual information forms filed with the various securities regulators. By making these forward looking statements, Fundamental Research Corp. and the analyst/author of this report undertakes no obligation to update these statements for revisions or changes after the date of this report. A report initiating coverage will most often be updated quarterly while a report issuing a rating may have no further or less frequent updates because the subject company is likely to be in earlier stages where nothing material may occur quarter to quarter. Fundamental Research Corp DOES NOT MAKE ANY WARRANTIES, EXPRESSED OR IMPLIED, AS TO RESULTS TO BE OBTAINED FROM USING THIS INFORMATION AND MAKES NO EXPRESS OR IMPLIED WARRANTIES OR FITNESS FOR A PARTICULAR USE. ANYONE USING THIS REPORT ASSUMES FULL RESPONSIBILITY FOR WHATEVER RESULTS THEY OBTAIN FROM WHATEVER USE THE INFORMATION WAS PUT TO. ALWAYS TALK TO YOUR FINANCIAL ADVISOR BEFORE YOU INVEST. WHETHER A STOCK SHOULD BE INCLUDED IN A PORTFOLIO DEPENDS ON ONE’S RISK TOLERANCE, OBJECTIVES, SITUATION, RETURN ON OTHER ASSETS, ETC. ONLY YOUR INVESTMENT ADVISOR WHO KNOWS YOUR UNIQUE CIRCUMSTANCES CAN MAKE A PROPER RECOMMENDATION AS TO THE MERIT OF ANY PARTICULAR SECURITY FOR INCLUSION IN YOUR PORTFOLIO. This REPORT is solely for informative purposes and is not a solicitation or an offer to buy or sell any security. It is not intended as being a complete description of the company, industry, securities or developments referred to in the material. Any forecasts contained in this report were independently prepared unless otherwise stated, and HAVE NOT BEEN endorsed by the Management of the company which is the subject of this report. Additional information is available upon request. THIS REPORT IS COPYRIGHT. YOU MAY NOT REDISTRIBUTE THIS REPORT WITHOUT OUR PERMISSION. Please give proper credit, including citing Fundamental Research Corp and/or the analyst, when quoting information from this report. The information contained in this report is intended to be viewed only in jurisdictions where it may be legally viewed and is not intended for use by any person or entity in any jurisdiction where such use would be contrary to local regulations or which would require any registration requirement within such jurisdiction.