West Nile Virus and Other Nationally Notifiable Arboviral ... · Morbidity and Mortality Weekly...
36
Continuing Education examination available at http://www.cdc.gov/mmwr/cme/conted_info.html#weekly. U.S. Department of Health and Human Services Centers for Disease Control and Prevention Morbidity and Mortality Weekly Report Weekly / Vol. 64 / No. 34 September 4, 2015 INSIDE 935 Combustible and Smokeless Tobacco Use Among High School Athletes — United States, 2001–2013 940 Enterovirus and Human Parechovirus Surveillance — United States, 2009–2013 944 Intervals Between PCV13 and PPSV23 Vaccines: Recommendations of the Advisory Committee on Immunization Practices (ACIP) 948 Licensure of a Diphtheria and Tetanus Toxoids and Acellular Pertussis Adsorbed and Inactivated Poliovirus Vaccine and Guidance for Use as a Booster Dose 950 Vital Signs: Predicted Heart Age and Racial Disparities in Heart Age Among U.S. Adults at the State Level 959 Announcements 963 QuickStats Arthropod-borne viruses (arboviruses) are transmitted to humans primarily through the bites of infected mosquitoes and ticks. West Nile virus (WNV) is the leading cause of domestically acquired arboviral disease in the United States (1). However, several other arboviruses also cause sporadic cases and seasonal outbreaks. This report summarizes surveillance data reported to CDC in 2014 for WNV and other nationally notifiable arboviruses, excluding dengue. Forty-two states and the District of Columbia (DC) reported 2,205 cases of WNV disease. Of these, 1,347 (61%) were classified as WNV neuro- invasive disease (e.g., meningitis, encephalitis, or acute flaccid paralysis), for a national incidence of 0.42 cases per 100,000 population. After WNV, the next most commonly reported cause of arboviral disease was La Crosse virus (80 cases), fol- lowed by Jamestown Canyon virus (11), St. Louis encephalitis virus (10), Powassan virus (8), and Eastern equine encephalitis virus (8). WNV and other arboviruses cause serious illness in substantial numbers of persons each year. Maintaining surveil- lance programs is important to help direct prevention activities. In the United States, most arboviruses are maintained in transmission cycles between arthropods and vertebrate hosts (typically birds or small mammals). Humans usually become infected when bitten by infected mosquitoes or ticks. Person- to-person transmission also occurs rarely through blood transfusion and organ transplantation. The majority of human arboviral infections are asymptomatic. Symptomatic infec- tions most often manifest as a systemic febrile illness and, less commonly, as neuroinvasive disease. Most endemic arboviral diseases are nationally notifiable and are reported to CDC through ArboNET, a national arboviral surveillance system managed by CDC and state health departments (2,3). Using standard definitions, human cases with laboratory evidence of recent arboviral infection are classified as neuroinvasive disease or nonneuroinvasive disease (2). Cases reported as encephalitis, meningitis, or acute flaccid paralysis are collectively referred to as neuroinvasive disease; others are considered nonneuroinva- sive disease. Acute flaccid paralysis can occur with or without encephalitis or meningitis. In this report, any case reported as acute flaccid paralysis (with or without another clinical syn- drome) was classified as acute flaccid paralysis and not included in the other categories. Because of the substantial associated morbidity, detection and reporting of neuroinvasive disease cases is assumed to be more consistent and complete than that of nonneuroinvasive disease cases. Therefore, incidence rates were calculated for neuroinvasive disease cases using U.S. Census 2014 mid-year population estimates. West Nile Virus and Other Nationally Notifiable Arboviral Diseases — United States, 2014 Nicole P. Lindsey, MS 1 ; Jennifer A. Lehman 1 ; J. Erin Staples, MD, PhD 1 ; Marc Fischer, MD 1
Transcript of West Nile Virus and Other Nationally Notifiable Arboviral ... · Morbidity and Mortality Weekly...
Continuing Education examination available at http://www.cdc.gov/mmwr/cme/conted_info.html#weekly.
U.S. Department of Health and Human ServicesCenters for Disease Control and Prevention
Morbidity and Mortality Weekly ReportWeekly / Vol. 64 / No. 34 September 4, 2015
INSIDE935 Combustible and Smokeless Tobacco Use Among
High School Athletes — United States, 2001–2013940 Enterovirus and Human Parechovirus Surveillance —
United States, 2009–2013944 Intervals Between PCV13 and PPSV23 Vaccines:
Recommendations of the Advisory Committee on Immunization Practices (ACIP)
948 Licensure of a Diphtheria and Tetanus Toxoids and Acellular Pertussis Adsorbed and Inactivated Poliovirus Vaccine and Guidance for Use as a Booster Dose
950 Vital Signs: Predicted Heart Age and Racial Disparities in Heart Age Among U.S. Adults at the State Level
959 Announcements963 QuickStats
Arthropod-borne viruses (arboviruses) are transmitted to humans primarily through the bites of infected mosquitoes and ticks. West Nile virus (WNV) is the leading cause of domestically acquired arboviral disease in the United States (1). However, several other arboviruses also cause sporadic cases and seasonal outbreaks. This report summarizes surveillance data reported to CDC in 2014 for WNV and other nationally notifiable arboviruses, excluding dengue. Forty-two states and the District of Columbia (DC) reported 2,205 cases of WNV disease. Of these, 1,347 (61%) were classified as WNV neuro-invasive disease (e.g., meningitis, encephalitis, or acute flaccid paralysis), for a national incidence of 0.42 cases per 100,000 population. After WNV, the next most commonly reported cause of arboviral disease was La Crosse virus (80 cases), fol-lowed by Jamestown Canyon virus (11), St. Louis encephalitis virus (10), Powassan virus (8), and Eastern equine encephalitis virus (8). WNV and other arboviruses cause serious illness in substantial numbers of persons each year. Maintaining surveil-lance programs is important to help direct prevention activities.
In the United States, most arboviruses are maintained in transmission cycles between arthropods and vertebrate hosts (typically birds or small mammals). Humans usually become infected when bitten by infected mosquitoes or ticks. Person-to-person transmission also occurs rarely through blood transfusion and organ transplantation. The majority of human arboviral infections are asymptomatic. Symptomatic infec-tions most often manifest as a systemic febrile illness and, less commonly, as neuroinvasive disease. Most endemic arboviral diseases are nationally notifiable and are reported to CDC through ArboNET, a national arboviral surveillance system managed by CDC and state health departments (2,3). Using standard definitions, human cases with laboratory evidence of recent arboviral infection are classified as neuroinvasive disease or nonneuroinvasive disease (2). Cases reported as encephalitis,
meningitis, or acute flaccid paralysis are collectively referred to as neuroinvasive disease; others are considered nonneuroinva-sive disease. Acute flaccid paralysis can occur with or without encephalitis or meningitis. In this report, any case reported as acute flaccid paralysis (with or without another clinical syn-drome) was classified as acute flaccid paralysis and not included in the other categories. Because of the substantial associated morbidity, detection and reporting of neuroinvasive disease cases is assumed to be more consistent and complete than that of nonneuroinvasive disease cases. Therefore, incidence rates were calculated for neuroinvasive disease cases using U.S. Census 2014 mid-year population estimates.
West Nile Virus and Other Nationally Notifiable Arboviral Diseases — United States, 2014
Nicole P. Lindsey, MS1; Jennifer A. Lehman1; J. Erin Staples, MD, PhD1; Marc Fischer, MD1
imt2
Text Box
Please note: Errata have been published for this issue. To view the errata, please click here and here.

Morbidity and Mortality Weekly Report
930 MMWR / September 4, 2015 / Vol. 64 / No. 34
The MMWR series of publications is published by the Center for Surveillance, Epidemiology, and Laboratory Services, Centers for Disease Control and Prevention (CDC), U.S. Department of Health and Human Services, Atlanta, GA 30329-4027.Suggested citation: [Author names; first three, then et al., if more than six.] [Report title]. MMWR Morb Mortal Wkly Rep 2015;64:[inclusive page numbers].
Centers for Disease Control and PreventionThomas R. Frieden, MD, MPH, Director
Harold W. Jaffe, MD, MA, Associate Director for Science Joanne Cono, MD, ScM, Director, Office of Science Quality
Chesley L. Richards, MD, MPH, Deputy Director for Public Health Scientific ServicesMichael F. Iademarco, MD, MPH, Director, Center for Surveillance, Epidemiology, and Laboratory Services
MMWR Editorial and Production Staff (Weekly)Sonja A. Rasmussen, MD, MS, Editor-in-Chief
Charlotte K. Kent, PhD, MPH, Executive Editor Jacqueline Gindler, MD, Acting EditorTeresa F. Rutledge, Managing Editor
Douglas W. Weatherwax, Lead Technical Writer-EditorTeresa M. Hood, MS, Jude C. Rutledge, Writer-Editors
Martha F. Boyd, Lead Visual Information SpecialistMaureen A. Leahy, Julia C. Martinroe,
Stephen R. Spriggs, Brian E. Wood,Visual Information Specialists
Quang M. Doan, MBA, Phyllis H. King,Teresa C. Moreland, Terraye M. Starr
Information Technology Specialists
MMWR Editorial BoardTimothy F. Jones, MD, Nashville, TN, ChairmanMatthew L. Boulton, MD, MPH, Ann Arbor, MI
Virginia A. Caine, MD, Indianapolis, INJonathan E. Fielding, MD, MPH, MBA, Los Angeles, CA
David W. Fleming, MD, Seattle, WAWilliam E. Halperin, MD, DrPH, MPH, Newark, NJ
King K. Holmes, MD, PhD, Seattle, WARima F. Khabbaz, MD, Atlanta, GA
Patricia Quinlisk, MD, MPH, Des Moines, IAPatrick L. Remington, MD, MPH, Madison, WIWilliam L. Roper, MD, MPH, Chapel Hill, NC
William Schaffner, MD, Nashville, TN
In 2014, CDC received reports of 2,327 cases of nationally notifiable arboviral disease, among which 1,453 (62%) were classified as neuroinvasive disease. Cases were caused by WNV (2,205 cases, 95%), La Crosse virus (80), Jamestown Canyon virus (11), St. Louis encephalitis virus (10), Powassan virus (8), Eastern equine encephalitis virus (8), and unspecified California serogroup virus (5). Cases were reported from 568 (18%) of the 3,141 U.S. counties; no cases were reported from Alaska, Delaware, Rhode Island, or Vermont.
A total of 2,205 WNV disease cases, including 1,347 (61%) neuroinvasive cases, were reported from 503 counties in 42 states and the District of Columbia. WNV disease cases peaked in late August; 90% of cases had illness onset during July–September (Table 1). The median age of patients was 57 years (interquartile range [IQR] = 44–67 years); 1,403 (64%) were male. Overall, 1,589 (72%) patients were hospital-ized, and 97 (4%) died. The median age of patients who died was 75 years (IQR = 65–83 years).
Of the 1,347 WNV neuroinvasive disease cases, 620 (46%) were reported as encephalitis, 565 (42%) as meningitis, 132 (10%) as acute flaccid paralysis, and 30 (2%) as other neu-rologic presentation. Among the 132 patients reported to have acute flaccid paralysis, 102 (77%) also had encephalitis or meningitis. Among all patients with WNV neuroinvasive disease, 1,294 (96%) were hospitalized, and 87 (6%) died.
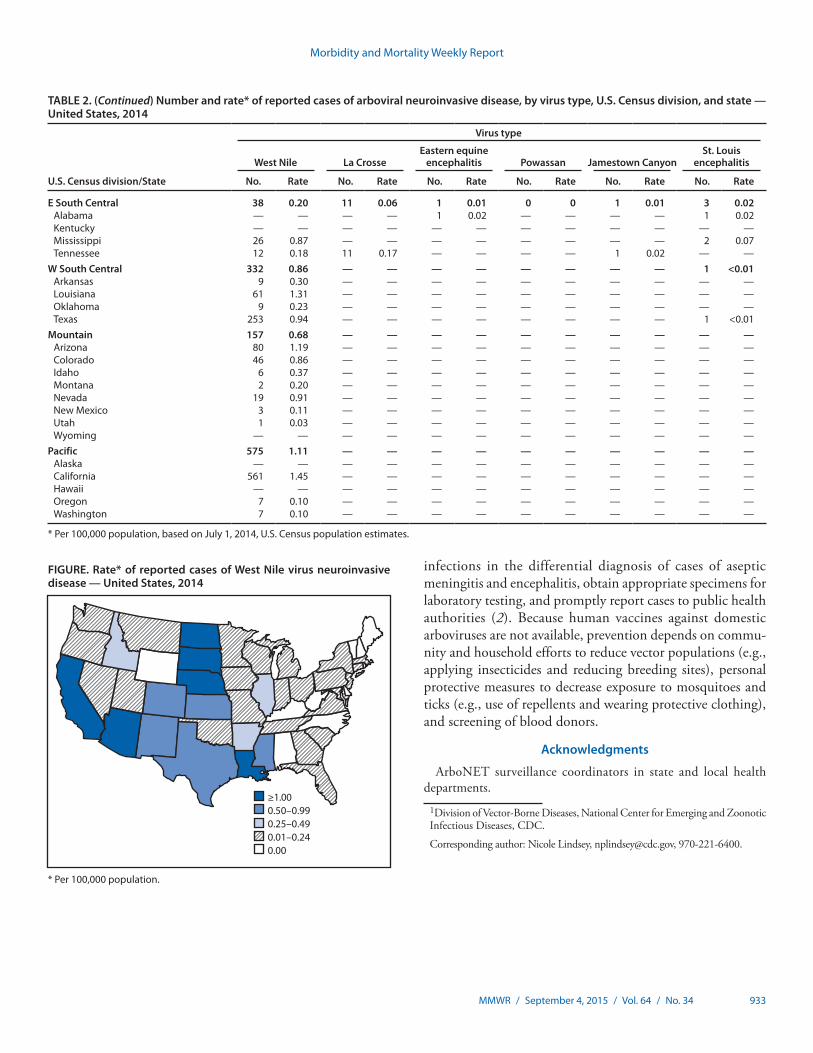
The national incidence of WNV neuroinvasive disease was 0.42 per 100,000 population (Table 2). States with the highest incidence rates included Nebraska (2.2 per 100,000),
North Dakota (1.6), California (1.4), South Dakota (1.4), Louisiana (1.3) and Arizona (1.2) (Table 2) (Figure). Three states reported two thirds (66%) of the neuroinvasive disease cases: California (561 cases), Texas (253), and Arizona (80). WNV neuroinvasive disease incidence increased with increas-ing age, ranging from 0.03 per 100,000 among persons aged <10 years to 1.15 per 100,000 among those aged ≥70 years, and was higher among males (0.57 per 100,000) than among females (0.29).
Eighty La Crosse virus disease cases were reported from nine states; 76 (95%) were neuroinvasive (Table 1). Dates of illness onset for La Crosse virus disease cases ranged from March to October; 73 (91%) had onset during July–September. Forty-two (53%) patients were female. The median age of patients was 8 years (IQR = 6–11 years); 72 (90%) were aged <18 years. A total of 79 (99%) patients were hospitalized; three (4%) died. La Crosse virus neuroinvasive disease incidence was highest in Ohio (0.26 per 100,000), North Carolina (0.23), and Tennessee (0.17) (Table 2).
Eleven Jamestown Canyon virus disease cases were reported from four states (Massachusetts, Minnesota, Tennessee, and Wisconsin); six were neuroinvasive (Table 1). Tennessee reported its first Jamestown Canyon virus disease cases in 2014. Dates of illness onset ranged from May to September, with eight occurring during July–September. The age distribution of patients was bimodal, with four patients aged <18 years and six aged >60 years. Six patients were female. Seven patients were hospitalized; none died. In addition to the La Crosse virus and
Morbidity and Mortality Weekly Report
MMWR / September 4, 2015 / Vol. 64 / No. 34 931
Jamestown Canyon virus cases, five other cases of California serogroup virus disease were reported for which the specific infecting virus was unknown.
Ten St. Louis encephalitis virus disease cases were reported from five states (Alabama, Arizona, Florida, Mississippi, and Texas); six were neuroinvasive (Table 1). Dates of illness onset ranged from January–October; six had onset during July–September. The median age of patients was 55 years (IQR: 47–60 years); six were female. All patients were hospi-talized; none died.
Eight Powassan virus disease cases were reported from four states (Massachusetts, New Jersey, New York, and Wisconsin); seven were neuroinvasive (Table 1). Three patients (38%) had onset in May, and 5 (62%) had onset during July–September. The median age of patients was 65 years (IQR = 51–70 years); six were male. All patients were hospitalized; none died.
Eight Eastern equine encephalitis virus neuroinvasive dis-ease cases were reported from five states (Alabama, Maine, Michigan, New Hampshire, and New York (Table 1). All eight patients had illness onset during July–September. The median age of patients was 60 years (IQR = 52–69 years); four were male. All eight patients were hospitalized; two died.
Discussion
In 2014, WNV was the most common cause of neuroinva-sive arboviral disease in the United States, accounting for 93% of all neuroinvasive cases. Nationally, WNV neuroinvasive disease incidence was similar to the median incidence dur-ing 2002–2013 (median = 0.40; range = 0.13–1.02) (3,4). However, California reported a record 561 neuroinvasive disease cases, 83% more than the next highest year (2005). Within California, 70% of all neuroinvasive disease cases were reported from just two counties (Los Angeles and Orange). These findings highlight the focal nature of WNV outbreaks.
As has been reported in previous years, La Crosse virus was the most common cause of neuroinvasive arboviral disease among children (1); it is not known why the incidence of La Crosse virus disease is highest among children (5). Jamestown Canyon virus disease cases continue to be reported from new locations (e.g., Tennessee) following the implementation of routine Jamestown Canyon virus antibody testing at CDC in 2013 (6). Eastern equine encephalitis virus disease, although rare, remained the most severe domestic arboviral disease, with two deaths among eight patients. Over 90% of arboviral disease cases occurred during April–September, emphasizing
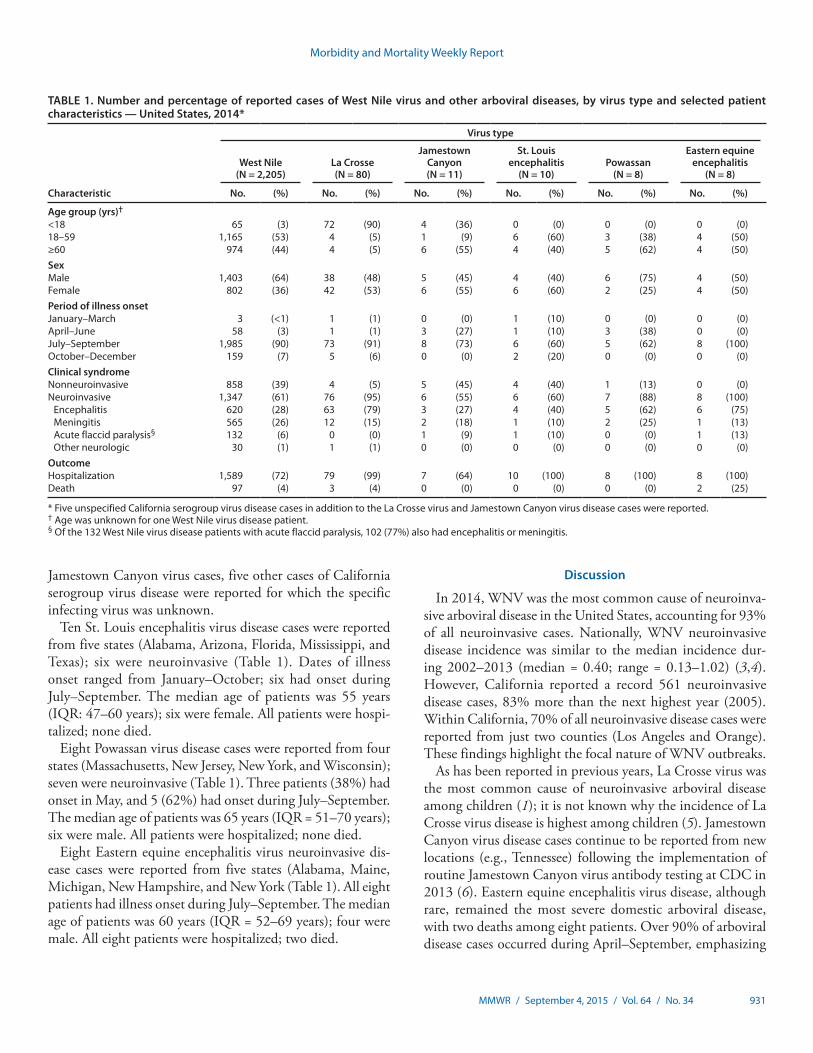
TABLE 1. Number and percentage of reported cases of West Nile virus and other arboviral diseases, by virus type and selected patient characteristics — United States, 2014*
Characteristic
Virus type
West Nile (N = 2,205)
La Crosse (N = 80)
Jamestown Canyon (N = 11)
St. Louis encephalitis
(N = 10)Powassan
(N = 8)
Eastern equine encephalitis
(N = 8)
No. (%) No. (%) No. (%) No. (%) No. (%) No. (%)
Age group (yrs)†
<18 65 (3) 72 (90) 4 (36) 0 (0) 0 (0) 0 (0)18–59 1,165 (53) 4 (5) 1 (9) 6 (60) 3 (38) 4 (50)≥60 974 (44) 4 (5) 6 (55) 4 (40) 5 (62) 4 (50)SexMale 1,403 (64) 38 (48) 5 (45) 4 (40) 6 (75) 4 (50)Female 802 (36) 42 (53) 6 (55) 6 (60) 2 (25) 4 (50)Period of illness onsetJanuary–March 3 (<1) 1 (1) 0 (0) 1 (10) 0 (0) 0 (0)April–June 58 (3) 1 (1) 3 (27) 1 (10) 3 (38) 0 (0)July–September 1,985 (90) 73 (91) 8 (73) 6 (60) 5 (62) 8 (100)October–December 159 (7) 5 (6) 0 (0) 2 (20) 0 (0) 0 (0)Clinical syndromeNonneuroinvasive 858 (39) 4 (5) 5 (45) 4 (40) 1 (13) 0 (0)Neuroinvasive 1,347 (61) 76 (95) 6 (55) 6 (60) 7 (88) 8 (100)
Encephalitis 620 (28) 63 (79) 3 (27) 4 (40) 5 (62) 6 (75)Meningitis 565 (26) 12 (15) 2 (18) 1 (10) 2 (25) 1 (13)Acute flaccid paralysis§ 132 (6) 0 (0) 1 (9) 1 (10) 0 (0) 1 (13)Other neurologic 30 (1) 1 (1) 0 (0) 0 (0) 0 (0) 0 (0)
OutcomeHospitalization 1,589 (72) 79 (99) 7 (64) 10 (100) 8 (100) 8 (100)Death 97 (4) 3 (4) 0 (0) 0 (0) 0 (0) 2 (25)
* Five unspecified California serogroup virus disease cases in addition to the La Crosse virus and Jamestown Canyon virus disease cases were reported.† Age was unknown for one West Nile virus disease patient.§ Of the 132 West Nile virus disease patients with acute flaccid paralysis, 102 (77%) also had encephalitis or meningitis.

Morbidity and Mortality Weekly Report
932 MMWR / September 4, 2015 / Vol. 64 / No. 34
the importance of focusing public health interventions during this period.
The findings in this report are subject to at least three limi-tations. First, ArboNET is a passive surveillance system that relies on clinicians to consider the diagnosis of an arboviral disease and obtain appropriate diagnostic tests, and on health care providers and laboratories to report laboratory-confirmed cases to public health authorities. Second, testing and reporting are incomplete, leading to a substantial underestimate of the actual number of cases (7). For example, data from previous studies suggest there are an estimated 30–70 nonneuroinvasive disease cases for every reported case of WNV neuroinvasive disease (8–10). Extrapolating from the 1,347 WNV neuro-invasive disease cases reported, an estimated 40,000–94,000 nonneuroinvasive disease cases might have occurred in 2014. However, only 858 (1%–2%) were diagnosed and reported.
Finally, this report underestimates the overall disease bur-den for arboviral diseases in the United States during 2014, because it does not include dengue or arboviral diseases that were not nationally notifiable such as Colorado tick fever and chikungunya. Chikungunya became a nationally notifiable condition in 2015.
Arboviruses continue to cause substantial morbidity in the United States, although reported numbers of cases vary annu-ally. Cases occur sporadically, and the epidemiology varies by virus and geographic area. The weather, zoonotic host and vector abundance, and human behavior are all factors that can influence when and where outbreaks occur. Because of this complex ecology, it is difficult to predict how many cases of disease might occur in the future and in what areas; therefore, surveillance is essential to identify outbreaks and guide preven-tion efforts. Health care providers should consider arboviral
TABLE 2. Number and rate* of reported cases of arboviral neuroinvasive disease, by virus type, U.S. Census division, and state — United States, 2014
U.S. Census division/State
Virus type
West Nile La CrosseEastern equine
encephalitis Powassan Jamestown CanyonSt. Louis
encephalitis
No. Rate No. Rate No. Rate No. Rate No. Rate No. Rate
United States 1,347 0.42 76 0.02 8 <0.01 7 <0.01 6 <0.01 6 <0.01New England 8 0.05 — — 4 0.03 4 0.03 1 0.01 — —
Connecticut 3 0.08 — — — — — — — — — —Maine — — — — 1 0.08 — — — — — —Massachusetts 5 0.07 — — — — 4 0.06 1 0.01 — —New Hampshire — — — — 3 0.23 — — — — — —Rhode Island — — — — — — — — — — — —Vermont — — — — — — — — — — — —
Mid Atlantic 36 0.09 — — 2 <0.01 1 <0.01 — — — —New Jersey 6 0.07 — — — — 1 0.01 — — — —New York 19 0.10 — — 2 0.01 — — — — — —Pennsylvania 11 0.09 — — — — — — — — — —
E North Central 59 0.13 33 0.07 1 <0.01 2 <0.01 2 <0.01 — —Illinois 36 0.28 — — — — — — — — — —Indiana 9 0.14 — — — — — — — — — —Michigan 1 0.01 — — 1 0.01 — — — — — —Ohio 10 0.09 30 0.26 — — — — — — — —Wisconsin 3 0.05 3 0.05 — — 2 0.03 2 0.03 — —
W North Central 104 0.50 4 0.02 — — — — 2 0.01 — —Iowa 5 0.16 — — — — — — — — — —Kansas 18 0.62 — — — — — — — — — —Minnesota 6 0.11 4 0.07 — — — — 2 0.04 — —Missouri 10 0.16 — — — — — — — — — —Nebraska 41 2.18 — — — — — — — — — —North Dakota 12 1.62 — — — — — — — — — —South Dakota 12 1.41 — — — — — — — — — —
S Atlantic 38 0.06 28 0.04 — — — — — — 2 <0.01Delaware — — — — — — — — — — — —District of Columbia 1 0.15 — — — — — — — — — —Florida 12 0.06 1 0.01 — — — — — — 2 0.01Georgia 11 0.11 1 0.01 — — — — — — — —Maryland 6 0.10 — — — — — — — — — —North Carolina — — 23 0.23 — — — — — — — —South Carolina 3 0.06 — — — — — — — — — —Virginia 5 0.06 2 0.02 — — — — — — — —West Virginia — — 1 0.05 — — — — — — — —
See table footnotes on next page.
Morbidity and Mortality Weekly Report
MMWR / September 4, 2015 / Vol. 64 / No. 34 933
infections in the differential diagnosis of cases of aseptic meningitis and encephalitis, obtain appropriate specimens for laboratory testing, and promptly report cases to public health authorities (2). Because human vaccines against domestic arboviruses are not available, prevention depends on commu-nity and household efforts to reduce vector populations (e.g., applying insecticides and reducing breeding sites), personal protective measures to decrease exposure to mosquitoes and ticks (e.g., use of repellents and wearing protective clothing), and screening of blood donors.
Acknowledgments
ArboNET surveillance coordinators in state and local health departments.
1Division of Vector-Borne Diseases, National Center for Emerging and Zoonotic Infectious Diseases, CDC.
Corresponding author: Nicole Lindsey, [email protected], 970-221-6400.
TABLE 2. (Continued) Number and rate* of reported cases of arboviral neuroinvasive disease, by virus type, U.S. Census division, and state — United States, 2014
U.S. Census division/State
Virus type
West Nile La CrosseEastern equine
encephalitis Powassan Jamestown CanyonSt. Louis
encephalitis
No. Rate No. Rate No. Rate No. Rate No. Rate No. Rate
E South Central 38 0.20 11 0.06 1 0.01 0 0 1 0.01 3 0.02Alabama — — — — 1 0.02 — — — — 1 0.02Kentucky — — — — — — — — — — — —Mississippi 26 0.87 — — — — — — — — 2 0.07Tennessee 12 0.18 11 0.17 — — — — 1 0.02 — —
W South Central 332 0.86 — — — — — — — — 1 <0.01Arkansas 9 0.30 — — — — — — — — — —Louisiana 61 1.31 — — — — — — — — — —Oklahoma 9 0.23 — — — — — — — — — —Texas 253 0.94 — — — — — — — — 1 <0.01
Mountain 157 0.68 — — — — — — — — — —Arizona 80 1.19 — — — — — — — — — —Colorado 46 0.86 — — — — — — — — — —Idaho 6 0.37 — — — — — — — — — —Montana 2 0.20 — — — — — — — — — —Nevada 19 0.91 — — — — — — — — — —New Mexico 3 0.11 — — — — — — — — — —Utah 1 0.03 — — — — — — — — — —Wyoming — — — — — — — — — — — —
Pacific 575 1.11 — — — — — — — — — —Alaska — — — — — — — — — — — —California 561 1.45 — — — — — — — — — —Hawaii — — — — — — — — — — — —Oregon 7 0.10 — — — — — — — — — —Washington 7 0.10 — — — — — — — — — —
* Per 100,000 population, based on July 1, 2014, U.S. Census population estimates.
FIGURE. Rate* of reported cases of West Nile virus neuroinvasive disease — United States, 2014
≥1.000.50–0.990.25–0.490.01–0.240.00
* Per 100,000 population.
Morbidity and Mortality Weekly Report
934 MMWR / September 4, 2015 / Vol. 64 / No. 34
References 1. Reimann CA, Hayes EB, DiGuiseppi C, et al. Epidemiology of
neuroinvasive arboviral disease in the United States, 1999–2007. Am J Trop Med Hyg 2008;79:974–9.
2. CDC. Arboviral diseases, neuroinvasive and non-neuroinvasive: 2014 case definition. Atlanta, GA: US Department of Health and Human Services, CDC; 2014. Available at http://wwwn.cdc.gov/nndss/conditions/arboviral-diseases-neuroinvasive-and-non-neuroinvasive/case-definition/2014/.
3. Lindsey NP, Staples JE, Lehman JA, Fischer M. Surveillance for human West Nile virus disease—United States, 1999–2008. MMWR Surveill Summ 2010;59(No. SS-2).
4. CDC. West Nile virus: statistics & maps. Fort Collins, CO: US Department of Health and Human Services, CDC; 2015. Available at http://www.cdc.gov/westnile/statsMaps/index.html.
5. Rust RS, Thompson WH, Matthews CG, Beaty BJ, Chun RW. La Crosse and other forms of California encephalitis. J Child Neurol 1999;14:1–14.
6. Pastula DM, Hoang Johnson DK, White JL, Dupuis AP 2nd, Fischer M, Staples JE. Jamestown Canyon virus disease in the United States—2000–2013. Am J Trop Med Hyg 2015;93:384–9.
7. Weber IB, Lindsey NP, Bunko-Patterson AM, et al. Completeness of West Nile virus testing in patients with meningitis and encephalitis during an outbreak in Arizona, USA. Epidemiol Infect 2012;140:1632–6.
8. Mostashari F, Bunning ML, Kitsutani PT, et al. Epidemic West Nile encephalitis, New York, 1999: results of a household-based seroepidemiological survey. Lancet 2001;358:261–4.
9. Busch MP, Wright DJ, Custer B, et al. West Nile virus infections projected from blood donor screening data, United States, 2003. Emerg Infect Dis 2006;12:395–402.
10. Carson PJ, Borchardt SM, Custer B, et al. Neuroinvasive disease and West Nile virus infection, North Dakota, USA, 1999–2008. Emerg Infect Dis 2012;18:684–6.
Summary
What is already known on this topic?
West Nile virus (WNV) is the leading cause of domestically acquired arboviral disease in the United States. However, several other arboviruses can cause sporadic cases and outbreaks of neuroinvasive disease, mainly in the summer.
What is added by this report?
In 2014, WNV was the most common cause of neuroinvasive arboviral disease in the United States. Nationally, WNV neuroin-vasive disease incidence in 2014 was similar to the median incidence from 2002–2013; however, California reported a record number of neuroinvasive disease cases. La Crosse virus was the most common cause of neuroinvasive arboviral disease among children. Eastern equine encephalitis virus disease, although rare, remained the most severe domestic arboviral disease, with two deaths among eight patients.
What are the implications for public health practice?
WNV and other arboviruses continue to be a source of severe illness each year for substantial numbers of persons in the United States. Maintaining surveillance remains important to identify outbreaks and guide prevention efforts.
Morbidity and Mortality Weekly Report
MMWR / September 4, 2015 / Vol. 64 / No. 34 935
Athletes are not a typical at-risk group for smoking com-bustible tobacco products, because they are generally health conscious and desire to remain fit and optimize athletic per-formance (1). In contrast, smokeless tobacco use historically has been associated with certain sports, such as baseball (2). Athletes might be more likely to use certain tobacco products, such as smokeless tobacco, if they perceive them to be harmless (3); however, smokeless tobacco use is not safe and is associ-ated with increased risk for pancreatic, esophageal, and oral cancers (4). Tobacco use among youth athletes is of particular concern, because most adult tobacco users first try tobacco before age 18 years (5). To examine prevalence and trends in current (≥1 day during the past 30 days) use of combustible tobacco (cigarettes, cigars) and smokeless tobacco (chewing tobacco, snuff, or dip [moist snuff ]) products among athlete and nonathlete high school students, CDC analyzed data from the 2001–2013 National Youth Risk Behavior Surveys. Current use of any tobacco (combustible or smokeless tobacco) significantly declined from 33.9% in 2001 to 22.4% in 2013; however, current smokeless tobacco use significantly increased from 10.0% to 11.1% among athletes, and did not change (5.9%) among nonathletes. Furthermore, in 2013, compared with nonathletes, athletes had significantly higher odds of being current smokeless tobacco users (adjusted odds ratio [AOR] = 1.77, p<0.05), but significantly lower odds of being current combustible tobacco users (AOR = 0.80, p<0.05). These findings suggest that opportunities exist for develop-ment of stronger tobacco control and prevention measures targeting youth athletes regarding the health risks associated with all forms of tobacco use.
The national Youth Risk Behavior Survey is a biennial, school-based survey of U.S. high school students.* For each survey, a three-stage cluster sample design was used to produce a nationally representative sample of students in grades 9–12 who attend public and private schools. Students completed the self-administered questionnaire during one class period and recorded their responses directly on a computer scannable
booklet or answer sheet. During 2001–2013, sample sizes ranged from 13,583 to 16,410; overall response rates ranged from 63% to 71%.
Current use of combustible tobacco products, smokeless tobacco products, and any tobacco product was self-reported.† Athletic status was assessed with the question, “During the past 12 months, on how many sports teams did you play? (Count any teams run by your school or community groups.)” Response options were “0 teams,” “1 team,” “2 teams,” or “3 or more teams.” Students who selected a response other than “0 teams” were categorized as athletes; all other responses were categorized as nonathletes.
Data were weighted to yield nationally representative estimates. Prevalence estimates were computed overall and by grade (9th, 10th, 11th, or 12th), sex (male or female), race/ethnicity (non-Hispanic white, non-Hispanic black, or Hispanic),§ and athletic status (athlete or nonathlete). Estimates were also computed on the basis of the number of sports teams on which students participated (0, 1, 2, ≥3). Estimates with relative standard errors >30% are not reported. Logistic regression models were fit, controlling for grade, sex, and race/ethnicity, to assess linear trends in tobacco use during 2001–2013, as well as measure the association between athletic status and tobacco use during each survey year.
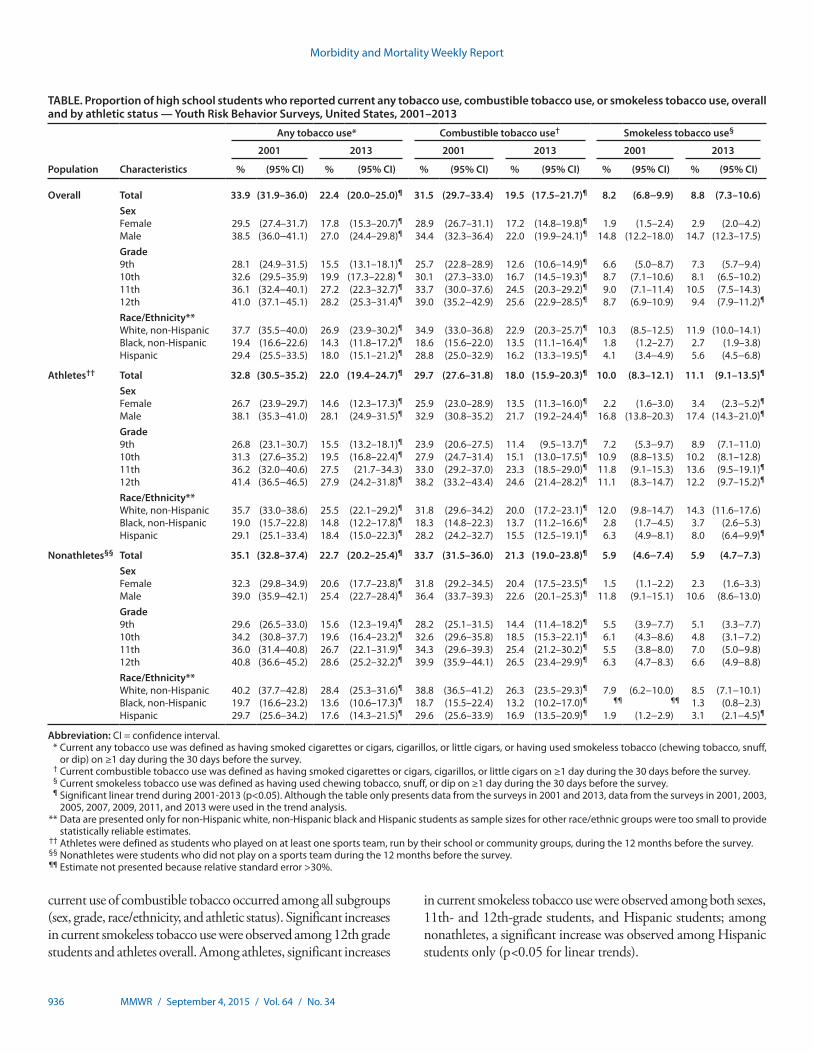
Among U.S. high school students during 2001–2013, signifi-cant declines occurred in current use of any tobacco (33.9% to 22.4%) and combustible tobacco products (31.5% to 19.5%) (p<0.05 for linear trend); no significant change was observed in current smokeless tobacco use (Table). During the same period, significant declines in current use of any tobacco product occurred among all subgroups (sex, grade, race/ethnicity, and athletic status), with the exception of 11th grade athletes. Significant declines in
Combustible and Smokeless Tobacco Use Among High School Athletes — United States, 2001–2013
Israel T. Agaku, DMD1; Tushar Singh, MD, PhD1,2; Sherry Everett Jones, PhD, JD3; Brian A. King, PhD1; Ahmed Jamal, MBBS1; Linda Neff, PhD1; Ralph S. Caraballo, PhD1
* The national Youth Risk Behavior Survey (YRBS), conducted by CDC, is part of a larger school-based surveillance system, the Youth Risk Behavior Surveillance System (YRBSS). In addition to the national YRBS, the YRBSS includes other state, territorial, tribal government, and local surveys, conducted by departments of health and education, which provide data representative of mostly public high school students in each jurisdiction. Available at http://www.cdc.gov/yrbss.
† To ascertain past 30-day use of cigarettes, cigars, and smokeless tobacco, respondents were asked the following questions: 1) “During the past 30 days, on how many days did you smoke cigarettes?”; 2) “During the past 30 days, on how many days did you smoke cigars, cigarillos, or little cigars?”; and 3) “During the past 30 days, on how many days did you use chewing tobacco, snuff, or dip, such as Redman, Levi Garrett, Beechnut, Skoal, Skoal Bandits, or Copenhagen?” Categorical response options to all three questions were “0 days,” “1 or 2 days,” “3 to 5 days,” “6 to 9 days,” “10 to 19 days,” “20 to 29 days,” or “all 30 days.” Students who provided a response other than “0 days” were categorized as current users of each respective product.
§ Data are presented only for non-Hispanic white, non-Hispanic black, and Hispanic students because sample sizes for other race/ethnic groups were too small to provide statistically reliable estimates.
Morbidity and Mortality Weekly Report
936 MMWR / September 4, 2015 / Vol. 64 / No. 34
current use of combustible tobacco occurred among all subgroups (sex, grade, race/ethnicity, and athletic status). Significant increases in current smokeless tobacco use were observed among 12th grade students and athletes overall. Among athletes, significant increases
in current smokeless tobacco use were observed among both sexes, 11th- and 12th-grade students, and Hispanic students; among nonathletes, a significant increase was observed among Hispanic students only (p<0.05 for linear trends).
TABLE. Proportion of high school students who reported current any tobacco use, combustible tobacco use, or smokeless tobacco use, overall and by athletic status — Youth Risk Behavior Surveys, United States, 2001–2013
Population Characteristics
Any tobacco use* Combustible tobacco use† Smokeless tobacco use§
2001 2013 2001 2013 2001 2013
% (95% CI) % (95% CI) % (95% CI) % (95% CI) % (95% CI) % (95% CI)
Overall Total 33.9 (31.9–36.0) 22.4 (20.0–25.0)¶ 31.5 (29.7–33.4) 19.5 (17.5–21.7)¶ 8.2 (6.8−9.9) 8.8 (7.3–10.6)SexFemale 29.5 (27.4–31.7) 17.8 (15.3–20.7)¶ 28.9 (26.7–31.1) 17.2 (14.8–19.8)¶ 1.9 (1.5–2.4) 2.9 (2.0−4.2)Male 38.5 (36.0−41.1) 27.0 (24.4–29.8)¶ 34.4 (32.3–36.4) 22.0 (19.9–24.1)¶ 14.8 (12.2–18.0) 14.7 (12.3–17.5)Grade9th 28.1 (24.9–31.5) 15.5 (13.1–18.1)¶ 25.7 (22.8–28.9) 12.6 (10.6–14.9)¶ 6.6 (5.0−8.7) 7.3 (5.7−9.4)10th 32.6 (29.5–35.9) 19.9 (17.3–22.8) ¶ 30.1 (27.3–33.0) 16.7 (14.5–19.3)¶ 8.7 (7.1–10.6) 8.1 (6.5–10.2)11th 36.1 (32.4−40.1) 27.2 (22.3–32.7)¶ 33.7 (30.0–37.6) 24.5 (20.3–29.2)¶ 9.0 (7.1–11.4) 10.5 (7.5–14.3)12th 41.0 (37.1−45.1) 28.2 (25.3–31.4)¶ 39.0 (35.2−42.9) 25.6 (22.9–28.5)¶ 8.7 (6.9–10.9) 9.4 (7.9–11.2)¶
Race/Ethnicity**White, non-Hispanic 37.7 (35.5−40.0) 26.9 (23.9–30.2)¶ 34.9 (33.0–36.8) 22.9 (20.3–25.7)¶ 10.3 (8.5–12.5) 11.9 (10.0–14.1)Black, non-Hispanic 19.4 (16.6–22.6) 14.3 (11.8–17.2)¶ 18.6 (15.6–22.0) 13.5 (11.1–16.4)¶ 1.8 (1.2–2.7) 2.7 (1.9–3.8)Hispanic 29.4 (25.5–33.5) 18.0 (15.1–21.2)¶ 28.8 (25.0–32.9) 16.2 (13.3–19.5)¶ 4.1 (3.4−4.9) 5.6 (4.5−6.8)
Athletes†† Total 32.8 (30.5–35.2) 22.0 (19.4–24.7)¶ 29.7 (27.6–31.8) 18.0 (15.9–20.3)¶ 10.0 (8.3–12.1) 11.1 (9.1–13.5)¶
SexFemale 26.7 (23.9–29.7) 14.6 (12.3–17.3)¶ 25.9 (23.0–28.9) 13.5 (11.3–16.0)¶ 2.2 (1.6–3.0) 3.4 (2.3−5.2)¶
Male 38.1 (35.3−41.0) 28.1 (24.9–31.5)¶ 32.9 (30.8–35.2) 21.7 (19.2–24.4)¶ 16.8 (13.8–20.3) 17.4 (14.3–21.0)¶
Grade9th 26.8 (23.1–30.7) 15.5 (13.2–18.1)¶ 23.9 (20.6–27.5) 11.4 (9.5–13.7)¶ 7.2 (5.3−9.7) 8.9 (7.1–11.0)10th 31.3 (27.6–35.2) 19.5 (16.8–22.4)¶ 27.9 (24.7–31.4) 15.1 (13.0–17.5)¶ 10.9 (8.8–13.5) 10.2 (8.1–12.8)11th 36.2 (32.0−40.6) 27.5 (21.7–34.3) 33.0 (29.2–37.0) 23.3 (18.5–29.0)¶ 11.8 (9.1–15.3) 13.6 (9.5–19.1)¶
12th 41.4 (36.5−46.5) 27.9 (24.2–31.8)¶ 38.2 (33.2−43.4) 24.6 (21.4–28.2)¶ 11.1 (8.3–14.7) 12.2 (9.7–15.2)¶
Race/Ethnicity**White, non-Hispanic 35.7 (33.0–38.6) 25.5 (22.1–29.2)¶ 31.8 (29.6–34.2) 20.0 (17.2–23.1)¶ 12.0 (9.8–14.7) 14.3 (11.6–17.6)Black, non-Hispanic 19.0 (15.7–22.8) 14.8 (12.2–17.8)¶ 18.3 (14.8–22.3) 13.7 (11.2–16.6)¶ 2.8 (1.7−4.5) 3.7 (2.6−5.3)Hispanic 29.1 (25.1–33.4) 18.4 (15.0–22.3)¶ 28.2 (24.2–32.7) 15.5 (12.5–19.1)¶ 6.3 (4.9−8.1) 8.0 (6.4−9.9)¶
Nonathletes§§ Total 35.1 (32.8–37.4) 22.7 (20.2–25.4)¶ 33.7 (31.5–36.0) 21.3 (19.0–23.8)¶ 5.9 (4.6−7.4) 5.9 (4.7−7.3)SexFemale 32.3 (29.8–34.9) 20.6 (17.7–23.8)¶ 31.8 (29.2–34.5) 20.4 (17.5–23.5)¶ 1.5 (1.1–2.2) 2.3 (1.6–3.3)Male 39.0 (35.9−42.1) 25.4 (22.7–28.4)¶ 36.4 (33.7–39.3) 22.6 (20.1–25.3)¶ 11.8 (9.1–15.1) 10.6 (8.6–13.0)Grade9th 29.6 (26.5–33.0) 15.6 (12.3–19.4)¶ 28.2 (25.1–31.5) 14.4 (11.4–18.2)¶ 5.5 (3.9−7.7) 5.1 (3.3−7.7)10th 34.2 (30.8–37.7) 19.6 (16.4–23.2)¶ 32.6 (29.6–35.8) 18.5 (15.3–22.1)¶ 6.1 (4.3−8.6) 4.8 (3.1−7.2)11th 36.0 (31.4−40.8) 26.7 (22.1–31.9)¶ 34.3 (29.6–39.3) 25.4 (21.2–30.2)¶ 5.5 (3.8−8.0) 7.0 (5.0−9.8)12th 40.8 (36.6−45.2) 28.6 (25.2–32.2)¶ 39.9 (35.9−44.1) 26.5 (23.4–29.9)¶ 6.3 (4.7−8.3) 6.6 (4.9−8.8)Race/Ethnicity**White, non-Hispanic 40.2 (37.7−42.8) 28.4 (25.3–31.6)¶ 38.8 (36.5−41.2) 26.3 (23.5–29.3)¶ 7.9 (6.2−10.0) 8.5 (7.1−10.1)Black, non-Hispanic 19.7 (16.6–23.2) 13.6 (10.6–17.3)¶ 18.7 (15.5–22.4) 13.2 (10.2–17.0)¶ ¶¶ ¶¶ 1.3 (0.8−2.3)Hispanic 29.7 (25.6–34.2) 17.6 (14.3–21.5)¶ 29.6 (25.6–33.9) 16.9 (13.5–20.9)¶ 1.9 (1.2−2.9) 3.1 (2.1−4.5)¶
Abbreviation: CI = confidence interval. * Current any tobacco use was defined as having smoked cigarettes or cigars, cigarillos, or little cigars, or having used smokeless tobacco (chewing tobacco, snuff,
or dip) on ≥1 day during the 30 days before the survey. † Current combustible tobacco use was defined as having smoked cigarettes or cigars, cigarillos, or little cigars on ≥1 day during the 30 days before the survey. § Current smokeless tobacco use was defined as having used chewing tobacco, snuff, or dip on ≥1 day during the 30 days before the survey. ¶ Significant linear trend during 2001-2013 (p<0.05). Although the table only presents data from the surveys in 2001 and 2013, data from the surveys in 2001, 2003,
2005, 2007, 2009, 2011, and 2013 were used in the trend analysis. ** Data are presented only for non-Hispanic white, non-Hispanic black and Hispanic students as sample sizes for other race/ethnic groups were too small to provide
statistically reliable estimates. †† Athletes were defined as students who played on at least one sports team, run by their school or community groups, during the 12 months before the survey. §§ Nonathletes were students who did not play on a sports team during the 12 months before the survey. ¶¶ Estimate not presented because relative standard error >30%.
Morbidity and Mortality Weekly Report
MMWR / September 4, 2015 / Vol. 64 / No. 34 937
During 2013, the adjusted odds of current use of any tobacco, combustible tobacco, and smokeless tobacco were significantly higher among male students than female students, overall, and among athletes (p<0.05). Among nonathletes, the odds of current use of any tobacco and smokeless tobacco were signifi-cantly higher among male students, whereas no sex difference was observed for combustible tobacco use. Students in 9th and 10th grades had significantly lower odds of current use of any tobacco and combustible tobacco than 12th grade students, overall as well as among athletes and nonathletes; however, with the exception of 9th grade athletes, no significant grade dif-ferences existed for current use of smokeless tobacco. Students in 11th grade did not differ significantly in current use of any tobacco, combustible tobacco, or smokeless tobacco compared with 12th grade students, overall or among athletes or nonathletes. Overall and among both athletes and nonathletes, non-Hispanic black and Hispanic students had significantly lower odds of current use of any tobacco, combustible tobacco, and smokeless tobacco compared with non-Hispanic white students, with one exception: Hispanic athletes did not differ significantly from non-Hispanic white athletes in current use of combustible tobacco.
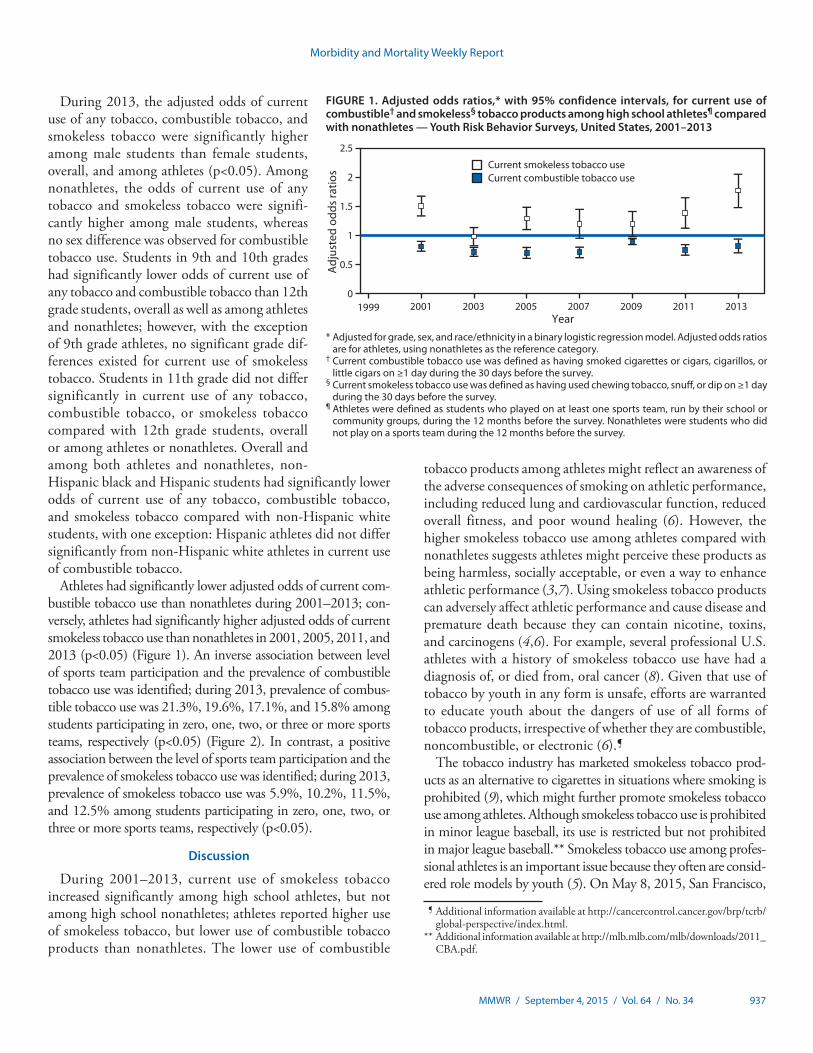
Athletes had significantly lower adjusted odds of current com-bustible tobacco use than nonathletes during 2001–2013; con-versely, athletes had significantly higher adjusted odds of current smokeless tobacco use than nonathletes in 2001, 2005, 2011, and 2013 (p<0.05) (Figure 1). An inverse association between level of sports team participation and the prevalence of combustible tobacco use was identified; during 2013, prevalence of combus-tible tobacco use was 21.3%, 19.6%, 17.1%, and 15.8% among students participating in zero, one, two, or three or more sports teams, respectively (p<0.05) (Figure 2). In contrast, a positive association between the level of sports team participation and the prevalence of smokeless tobacco use was identified; during 2013, prevalence of smokeless tobacco use was 5.9%, 10.2%, 11.5%, and 12.5% among students participating in zero, one, two, or three or more sports teams, respectively (p<0.05).
Discussion
During 2001–2013, current use of smokeless tobacco increased significantly among high school athletes, but not among high school nonathletes; athletes reported higher use of smokeless tobacco, but lower use of combustible tobacco products than nonathletes. The lower use of combustible
tobacco products among athletes might reflect an awareness of the adverse consequences of smoking on athletic performance, including reduced lung and cardiovascular function, reduced overall fitness, and poor wound healing (6). However, the higher smokeless tobacco use among athletes compared with nonathletes suggests athletes might perceive these products as being harmless, socially acceptable, or even a way to enhance athletic performance (3,7). Using smokeless tobacco products can adversely affect athletic performance and cause disease and premature death because they can contain nicotine, toxins, and carcinogens (4,6). For example, several professional U.S. athletes with a history of smokeless tobacco use have had a diagnosis of, or died from, oral cancer (8). Given that use of tobacco by youth in any form is unsafe, efforts are warranted to educate youth about the dangers of use of all forms of tobacco products, irrespective of whether they are combustible, noncombustible, or electronic (6).¶
The tobacco industry has marketed smokeless tobacco prod-ucts as an alternative to cigarettes in situations where smoking is prohibited (9), which might further promote smokeless tobacco use among athletes. Although smokeless tobacco use is prohibited in minor league baseball, its use is restricted but not prohibited in major league baseball.** Smokeless tobacco use among profes-sional athletes is an important issue because they often are consid-ered role models by youth (5). On May 8, 2015, San Francisco,
FIGURE 1. Adjusted odds ratios,* with 95% confidence intervals, for current use of combustible† and smokeless§ tobacco products among high school athletes¶ compared with nonathletes — Youth Risk Behavior Surveys, United States, 2001–2013
Current smokeless tobacco useCurrent combustible tobacco use
0
0.5
1
1.5
2
2.5
1999 2001 2003 2005 2007 2009 2011 2013
Adj
uste
d od
ds ra
tios
Year* Adjusted for grade, sex, and race/ethnicity in a binary logistic regression model. Adjusted odds ratios
are for athletes, using nonathletes as the reference category.† Current combustible tobacco use was defined as having smoked cigarettes or cigars, cigarillos, or
little cigars on ≥1 day during the 30 days before the survey. § Current smokeless tobacco use was defined as having used chewing tobacco, snuff, or dip on ≥1 day
during the 30 days before the survey.¶ Athletes were defined as students who played on at least one sports team, run by their school or
community groups, during the 12 months before the survey. Nonathletes were students who did not play on a sports team during the 12 months before the survey.
¶ Additional information available at http://cancercontrol.cancer.gov/brp/tcrb/global-perspective/index.html.
** Additional information available at http://mlb.mlb.com/mlb/downloads/2011_CBA.pdf.

Morbidity and Mortality Weekly Report
938 MMWR / September 4, 2015 / Vol. 64 / No. 34
California, became the first U.S. city to pass a law prohibiting the use of smokeless tobacco at all baseball venues and athletic fields, effective January 1, 2016.†† The city of Boston, Massachusetts has also proposed an ordinance prohibiting smokeless tobacco use at all professional and amateur sports venues in Boston.§§ Implementing and enforcing tobacco-free policies that prohibit all tobacco use on school campuses and at all public recreational facilities, including stadiums, parks, and school gymnasiums, by players, coaches, referees, and fans might help reduce tobacco use among student athletes (5). In addition to tobacco-free policies, continued implementation of other population level, evidence-based interventions outlined in the CDC Best Practices for Comprehensive Tobacco Control Programs¶¶ is also critical to
reducing all forms of tobacco use among youth; these interven-tions include increasing tobacco product prices, warning about the dangers of tobacco use, and increasing access to tobacco use cessation resources.
The differences in tobacco use among population subgroups (overall and among athletes), including the higher prevalence of both combustible tobacco and smokeless tobacco use among male students, non-Hispanic white students, and students in 11th and 12th grade, might be related to dissimilarities among these groups in socialization with tobacco-using peers, expo-sure and receptivity to pro-tobacco advertising, and targeted marketing of tobacco products by the tobacco industry (5).
The findings in this report are subject to at least six limitations. First, sports team participation and tobacco use were self-reported and might be subject to misreporting of tobacco use, which could lead to under- or overestimating tobacco use, as well as misclas-sification of athlete status (e.g., respondents who engaged fitness activities, but did not play on a school or community team would
FIGURE 2. Percentage of high school students who reported current use of combustible tobacco* and smokeless tobacco,† by extent of sport team participation§ — Youth Risk Behavior Surveys, United States, 2001–2013
0
5
10
15
20
25
30
35
2001 2003 2005 2007 2009 2011 2013
Year
≥3 sports teams: combustible≥3 sports teams: smokeless2 sports teams: combustible 2 sports teams: smokeless
1 sports team: combustible 1 sports team: smokeless No sports team: combustible No sports team: smokeless
Perc
enta
ge
* Current combustible tobacco use was defined as having smoked cigarettes or cigars, cigarillos, or little cigars on ≥1 day during the 30 days before the survey.† Current smokeless tobacco use was defined as have used chewing tobacco, snuff, or dip on ≥1 day during the 30 days before the survey.§ Extent of sport participation was defined with the question “During the past 12 months, on how many sports teams did you play? (Count any teams run by your
school or community groups.)” Response options were “0 teams,” “1 team,” “2 teams,” or “3 or more teams.”
†† Additional information available at https://www.tobaccofreekids.org/press_releases/post/2015_05_08_baseball.
§§ Additional information available at http://tobaccofreebaseball.org/content/press-release-08_05_15/.
¶¶ Additional information available at http://www.cdc.gov/tobacco/stateandcommunity/best_practices/pdfs/2014/comprehensive.pdf.
Morbidity and Mortality Weekly Report
MMWR / September 4, 2015 / Vol. 64 / No. 34 939
have been classified as nonathletes). Second, the prevalence of tobacco use among athletes and nonathletes might be underes-timated since emerging smokeless tobacco products (e.g., snus [a smokeless tobacco product developed in Sweden], electronic cigarettes, hookah, and dissolvable tobacco) were not assessed. Third, differential time frames in assessing current tobacco use (past 30 days) and sports team participation (past 12 months) might miss seasonal patterns of tobacco use (e.g., tobacco use patterns during a sports season might differ from off-season use among athletes). Fourth, tobacco use by type of sport could not be assessed, because these data were not collected. Fifth, although the data were weighted to adjust for school and student nonre-sponse and the distribution of students by grade, sex, and race/ethnicity in each jurisdiction, nonresponse bias is possible and might have affected the results. Finally, these data apply only to youth who attend school and are not representative of all youth, including those who are homeschooled or who have dropped out of school nationwide. However, in 2013, 96.1% of U.S. youth aged 14–17 years were enrolled in traditional schools (10); thus, the extent of any bias from this exclusion is likely minimal.
Sports activities present opportunities to reach young per-sons with public health interventions.*** Tobacco education programs tailored to high school athletes, coupled with other population-level evidence-based interventions, have the poten-tial to increase awareness of the dangers of tobacco use and to reduce the use of all forms of tobacco, including smokeless tobacco, among youth.
1Office on Smoking and Health, National Center for Chronic Disease Prevention and Health Promotion, CDC; 2Epidemic Intelligence Service, CDC; 3Division of Adolescent and School Health, National Center for HIV/AIDS, Viral Hepatitis, STD, and TB Prevention, CDC.
Corresponding author: Israel Agaku, [email protected], 770-488-5138.
References 1. Terry-McElrath YM, O’Malley PM, Johnston LD. Exercise and substance use
among American youth, 1991–2009. Am J Prev Med 2011;40:530–40. 2. Severson HH, Klein K, Lichtensein E, Kaufman N, Orleans CT.
Smokeless tobacco use among professional baseball players: survey results, 1998 to 2003. Tob Control 2005;14:31–6.
3. Walsh MM, Ellison J, Hilton JF, Chesney M, Ernster VL. Spit (smokeless) tobacco use by high school baseball athletes in California. Tob Control 2000;9(Suppl 2):II32–9.
4. International Agency for Research on Cancer. IARC monographs on the evaluation of carcinogenic risks to humans: personal habits and indoor combustions. Vol. 100E. Lyon, France: International Agency for Research on Cancer, World Health Organization; 2012. Available at http://monographs.iarc.fr/ENG/Monographs/vol100E/index.php.
5. US Department of Health and Human Services. Preventing tobacco use among youth and young adults: a report of the surgeon general. Atlanta, GA: U.S. Department of Health and Human Services, CDC; 2012.
6. US Department of Health and Human Services. The health consequences of smoking: 50 years of progress: a report of the surgeon general. Atlanta, GA: US Department of Health and Human Services, CDC; 2014. Available at http://www.surgeongeneral.gov/library/reports/50-years-of-progress.
7. Myers KA. Cigarette smoking: an underused tool in high-performance endurance training. CMAJ 2010;182:E867–9.
8. The Oral Cancer Foundation. Sports figures. Newport Beach, CA: The Oral Cancer Foundation; 2014. Available at http://www.oralcancerfoundation.org/people/sports-figures.php.
9. Carpenter CM, Connolly GN, Ayo-Yusuf OA, Wayne GF. Developing smokeless tobacco products for smokers: an examination of tobacco industry documents. Tob Control 2009;18:54–9.
10. US Census Bureau. School enrollment: current population survey 2013 [detailed tables]. Washington, DC: US Census Bureau. Available at https://www.census.gov/hhes/school/data/cps/2013/tables.html.
Summary
What is already known on this topic?
Athletes might be more likely to use certain tobacco products, such as smokeless tobacco, if they perceive them to be harmless; however, smokeless tobacco use is not safe, and is associated with increased risk for oral, esophageal, and pancreatic cancers.
What is added by this report?
Data from national Youth Risk Behavior Surveys indicate that current (≥1 day during the past 30 days) use of any tobacco product by U.S. high school students declined from 33.9% in 2001 to 22.4% in 2013; however, current smokeless tobacco use increased from 10.0% to 11.1% among high school athletes. Compared with nonathletes, athletes had higher odds of being current smokeless tobacco users, but lower odds of being current combustible tobacco users.
What are the implications for public health?
Tobacco education programs tailored to high school athletes, coupled with other population-level, evidence-based interven-tions, have the potential to increase awareness of the harmful-ness of all tobacco products and reduce all forms of tobacco use, including smokeless tobacco, among youth.
*** Additional information available at http://www.cdc.gov/tobacco/youth/sports.
Morbidity and Mortality Weekly Report
940 MMWR / September 4, 2015 / Vol. 64 / No. 34
Enteroviruses (EVs) and human parechoviruses (HPeVs) are small, non-enveloped RNA viruses in the Picornaviridae family, which are known or suspected to cause a spectrum of clinical manifestations in humans. Although most infected persons are asymptomatic, mild presentations can include respiratory infections, herpangina, and hand, foot, and mouth disease. Among the more severe syndromes associated with EV and HPeV infection are acute flaccid paralysis, meningitis, encephalitis, myocarditis, and sepsis. Neonates and infants are at higher risk for infection and for severe clinical outcomes than older children or adults (1–3). As of August 2015, a total of 16 HPeV types and 118 EV types (within four EV species known to infect humans: A, B, C, and D) had been identi-fied, and the spectrum of illness caused differed among virus types (4). To describe trends in EV and HPeV circulating in the United States during 2009–2013, CDC summarized detections reported through two surveillance systems. The most commonly reported types of EV and HPeV during this period were coxsackievirus (CV) A6 and HPeV3. The large number of CVA6 detections likely reflected an increase in testing in response to an outbreak of severe hand, foot, and mouth disease in late 2011 and 2012 (5). Most HPeV3 detec-tions originated from a single hospital that routinely tested for HPeV (6). Clinicians and public health practitioners should consider the EV and HPeV types recently circulating in the United States to inform diagnostic and surveillance activities. When EV and HPeV typing is performed, clinical and public health laboratories should routinely report their results to improve the reliability and generalizability of surveillance data.
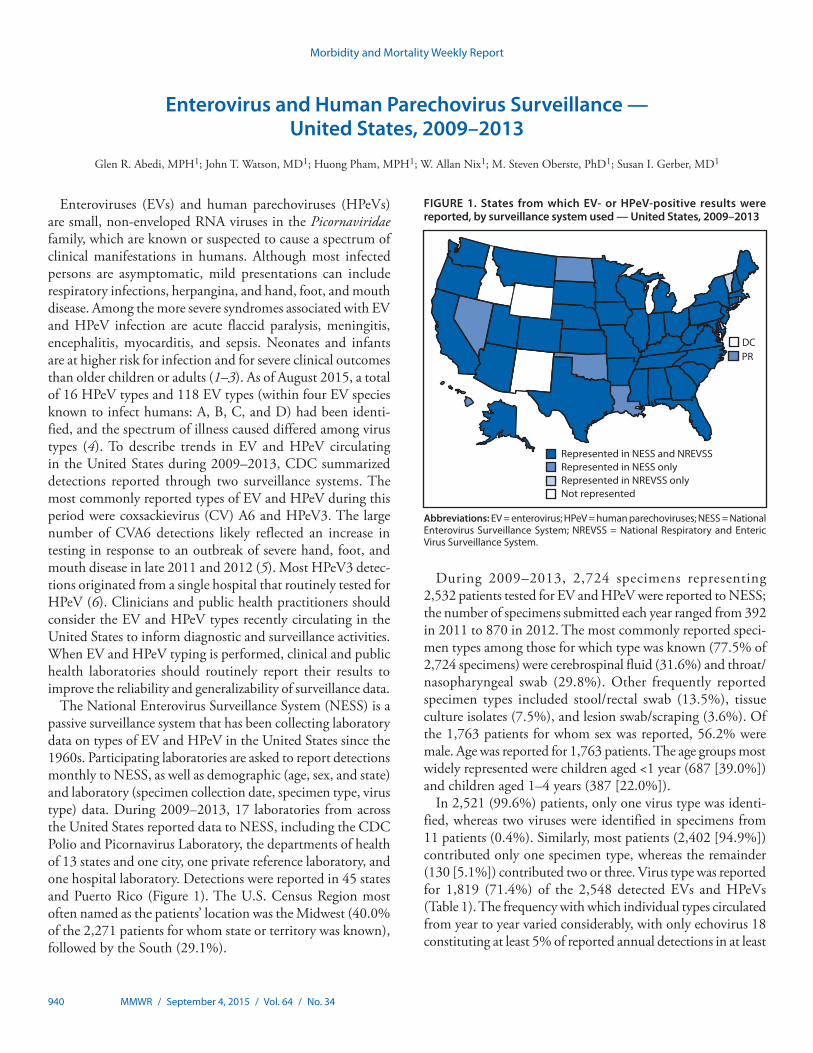
The National Enterovirus Surveillance System (NESS) is a passive surveillance system that has been collecting laboratory data on types of EV and HPeV in the United States since the 1960s. Participating laboratories are asked to report detections monthly to NESS, as well as demographic (age, sex, and state) and laboratory (specimen collection date, specimen type, virus type) data. During 2009–2013, 17 laboratories from across the United States reported data to NESS, including the CDC Polio and Picornavirus Laboratory, the departments of health of 13 states and one city, one private reference laboratory, and one hospital laboratory. Detections were reported in 45 states and Puerto Rico (Figure 1). The U.S. Census Region most often named as the patients’ location was the Midwest (40.0% of the 2,271 patients for whom state or territory was known), followed by the South (29.1%).
During 2009–2013, 2,724 specimens representing 2,532 patients tested for EV and HPeV were reported to NESS; the number of specimens submitted each year ranged from 392 in 2011 to 870 in 2012. The most commonly reported speci-men types among those for which type was known (77.5% of 2,724 specimens) were cerebrospinal fluid (31.6%) and throat/nasopharyngeal swab (29.8%). Other frequently reported specimen types included stool/rectal swab (13.5%), tissue culture isolates (7.5%), and lesion swab/scraping (3.6%). Of the 1,763 patients for whom sex was reported, 56.2% were male. Age was reported for 1,763 patients. The age groups most widely represented were children aged <1 year (687 [39.0%]) and children aged 1–4 years (387 [22.0%]).
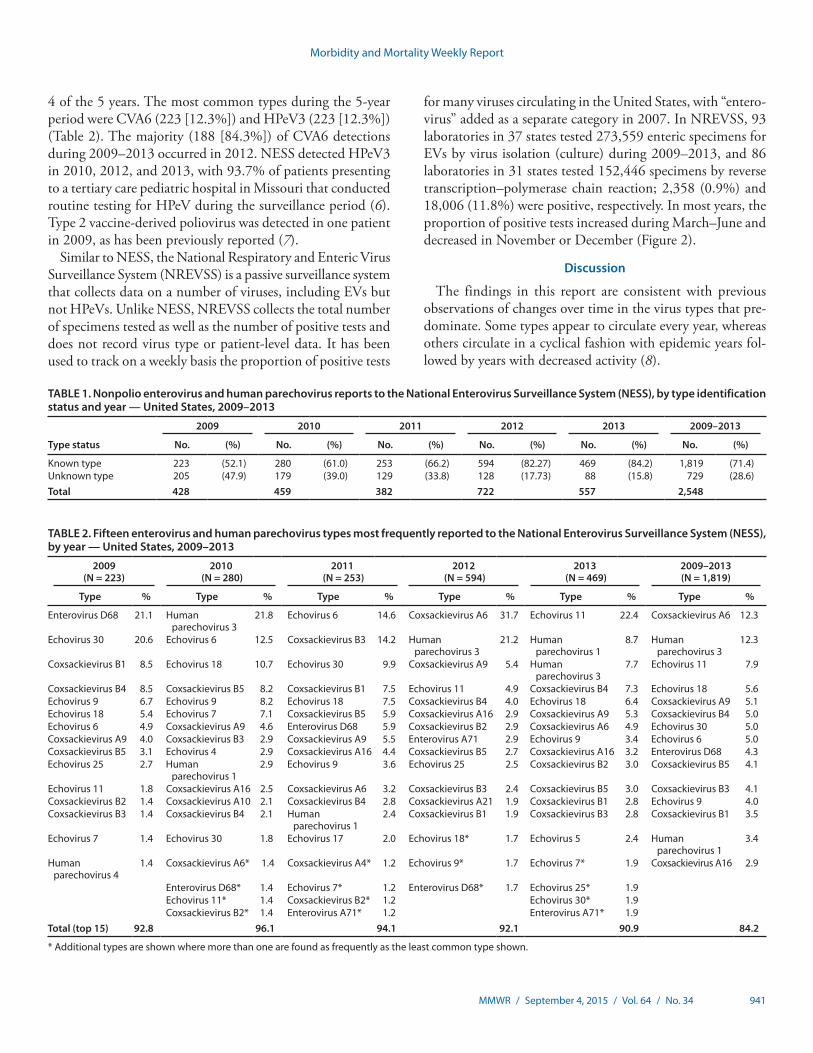
In 2,521 (99.6%) patients, only one virus type was identi-fied, whereas two viruses were identified in specimens from 11 patients (0.4%). Similarly, most patients (2,402 [94.9%]) contributed only one specimen type, whereas the remainder (130 [5.1%]) contributed two or three. Virus type was reported for 1,819 (71.4%) of the 2,548 detected EVs and HPeVs (Table 1). The frequency with which individual types circulated from year to year varied considerably, with only echovirus 18 constituting at least 5% of reported annual detections in at least
Enterovirus and Human Parechovirus Surveillance — United States, 2009–2013
Glen R. Abedi, MPH1; John T. Watson, MD1; Huong Pham, MPH1; W. Allan Nix1; M. Steven Oberste, PhD1; Susan I. Gerber, MD1
FIGURE 1. States from which EV- or HPeV-positive results were reported, by surveillance system used — United States, 2009–2013
Represented in NESS and NREVSSRepresented in NESS onlyRepresented in NREVSS onlyNot represented
DCPR
Abbreviations: EV = enterovirus; HPeV = human parechoviruses; NESS = National Enterovirus Surveillance System; NREVSS = National Respiratory and Enteric Virus Surveillance System.
Morbidity and Mortality Weekly Report
MMWR / September 4, 2015 / Vol. 64 / No. 34 941
4 of the 5 years. The most common types during the 5-year period were CVA6 (223 [12.3%]) and HPeV3 (223 [12.3%]) (Table 2). The majority (188 [84.3%]) of CVA6 detections during 2009–2013 occurred in 2012. NESS detected HPeV3 in 2010, 2012, and 2013, with 93.7% of patients presenting to a tertiary care pediatric hospital in Missouri that conducted routine testing for HPeV during the surveillance period (6). Type 2 vaccine-derived poliovirus was detected in one patient in 2009, as has been previously reported (7).
Similar to NESS, the National Respiratory and Enteric Virus Surveillance System (NREVSS) is a passive surveillance system that collects data on a number of viruses, including EVs but not HPeVs. Unlike NESS, NREVSS collects the total number of specimens tested as well as the number of positive tests and does not record virus type or patient-level data. It has been used to track on a weekly basis the proportion of positive tests
for many viruses circulating in the United States, with “entero-virus” added as a separate category in 2007. In NREVSS, 93 laboratories in 37 states tested 273,559 enteric specimens for EVs by virus isolation (culture) during 2009–2013, and 86 laboratories in 31 states tested 152,446 specimens by reverse transcription–polymerase chain reaction; 2,358 (0.9%) and 18,006 (11.8%) were positive, respectively. In most years, the proportion of positive tests increased during March–June and decreased in November or December (Figure 2).
Discussion
The findings in this report are consistent with previous observations of changes over time in the virus types that pre-dominate. Some types appear to circulate every year, whereas others circulate in a cyclical fashion with epidemic years fol-lowed by years with decreased activity (8).
TABLE 1. Nonpolio enterovirus and human parechovirus reports to the National Enterovirus Surveillance System (NESS), by type identification status and year — United States, 2009–2013
Type status
2009 2010 2011 2012 2013 2009–2013
No. (%) No. (%) No. (%) No. (%) No. (%) No. (%)
Known type 223 (52.1) 280 (61.0) 253 (66.2) 594 (82.27) 469 (84.2) 1,819 (71.4)Unknown type 205 (47.9) 179 (39.0) 129 (33.8) 128 (17.73) 88 (15.8) 729 (28.6)Total 428 459 382 722 557 2,548
TABLE 2. Fifteen enterovirus and human parechovirus types most frequently reported to the National Enterovirus Surveillance System (NESS), by year — United States, 2009–2013
2009 (N = 223)
2010 (N = 280)
2011 (N = 253)
2012 (N = 594)
2013 (N = 469)
2009–2013 (N = 1,819)
Type % Type % Type % Type % Type % Type %
Enterovirus D68 21.1 Human parechovirus 3
21.8 Echovirus 6 14.6 Coxsackievirus A6 31.7 Echovirus 11 22.4 Coxsackievirus A6 12.3
Echovirus 30 20.6 Echovirus 6 12.5 Coxsackievirus B3 14.2 Human parechovirus 3
21.2 Human parechovirus 1
8.7 Human parechovirus 3
12.3
Coxsackievirus B1 8.5 Echovirus 18 10.7 Echovirus 30 9.9 Coxsackievirus A9 5.4 Human parechovirus 3
7.7 Echovirus 11 7.9
Coxsackievirus B4 8.5 Coxsackievirus B5 8.2 Coxsackievirus B1 7.5 Echovirus 11 4.9 Coxsackievirus B4 7.3 Echovirus 18 5.6Echovirus 9 6.7 Echovirus 9 8.2 Echovirus 18 7.5 Coxsackievirus B4 4.0 Echovirus 18 6.4 Coxsackievirus A9 5.1Echovirus 18 5.4 Echovirus 7 7.1 Coxsackievirus B5 5.9 Coxsackievirus A16 2.9 Coxsackievirus A9 5.3 Coxsackievirus B4 5.0Echovirus 6 4.9 Coxsackievirus A9 4.6 Enterovirus D68 5.9 Coxsackievirus B2 2.9 Coxsackievirus A6 4.9 Echovirus 30 5.0Coxsackievirus A9 4.0 Coxsackievirus B3 2.9 Coxsackievirus A9 5.5 Enterovirus A71 2.9 Echovirus 9 3.4 Echovirus 6 5.0Coxsackievirus B5 3.1 Echovirus 4 2.9 Coxsackievirus A16 4.4 Coxsackievirus B5 2.7 Coxsackievirus A16 3.2 Enterovirus D68 4.3Echovirus 25 2.7 Human
parechovirus 12.9 Echovirus 9 3.6 Echovirus 25 2.5 Coxsackievirus B2 3.0 Coxsackievirus B5 4.1
Echovirus 11 1.8 Coxsackievirus A16 2.5 Coxsackievirus A6 3.2 Coxsackievirus B3 2.4 Coxsackievirus B5 3.0 Coxsackievirus B3 4.1Coxsackievirus B2 1.4 Coxsackievirus A10 2.1 Coxsackievirus B4 2.8 Coxsackievirus A21 1.9 Coxsackievirus B1 2.8 Echovirus 9 4.0Coxsackievirus B3 1.4 Coxsackievirus B4 2.1 Human
parechovirus 12.4 Coxsackievirus B1 1.9 Coxsackievirus B3 2.8 Coxsackievirus B1 3.5
Echovirus 7 1.4 Echovirus 30 1.8 Echovirus 17 2.0 Echovirus 18* 1.7 Echovirus 5 2.4 Human parechovirus 1
3.4
Human parechovirus 4
1.4 Coxsackievirus A6* 1.4 Coxsackievirus A4* 1.2 Echovirus 9* 1.7 Echovirus 7* 1.9 Coxsackievirus A16 2.9
Enterovirus D68* 1.4 Echovirus 7* 1.2 Enterovirus D68* 1.7 Echovirus 25* 1.9Echovirus 11* 1.4 Coxsackievirus B2* 1.2 Echovirus 30* 1.9Coxsackievirus B2* 1.4 Enterovirus A71* 1.2 Enterovirus A71* 1.9
Total (top 15) 92.8 96.1 94.1 92.1 90.9 84.2
* Additional types are shown where more than one are found as frequently as the least common type shown.

Morbidity and Mortality Weekly Report
942 MMWR / September 4, 2015 / Vol. 64 / No. 34
Type-based enterovirus surveillance in the United States has five objectives: 1) to help public health practitioners determine long-term patterns of circulation for individual EVs; 2) to help interpret trends in enteroviral diseases (e.g., aseptic meningitis) by associating them with circulating types; 3) to assist with recognition of outbreaks associated with circulating types; 4) to help guide development of new diagnostic tests and therapies; and 5) to monitor poliovirus detections, thereby supplement-ing clinician-based poliomyelitis testing in the United States. Both paralytic poliomyelitis and nonparalytic poliovirus infec-tions are nationally notifiable.
Frequency of reports to NESS is greatly influenced by increased awareness and demand for testing during outbreak periods. As a result, reports to NESS might be a closer reflection of outbreak-driven testing than of endemic circulation of the broader range of enteroviruses. During 2009–2013, the most common EV type reported to NESS was CVA6, of which an outbreak was first reported in the United States in 2010 and which was the predominant circulating type reported in 2012. Outbreaks of hand, foot, and mouth disease associated with CVA6 have been reported internationally since 2008 (9,10), including cases that occurred in multiple U.S. states during 2011–2012 (5). Other frequent reports to NESS include HPeV3, an important cause of neonatal sepsis.
The findings in this report are subject to at least five limita-tions. First, EV and HPeV infections other than poliovirus infections are not nationally notifiable in the United States. NESS is a passive system that relies on voluntary participation from laboratories, so findings are not necessarily representa-tive of national or regional enterovirus activity. Second, the findings are limited by the lack of clinical information. Third, most typing is performed during the summer months; circula-tion during other parts of the year might be underrecognized.
Fourth, although monthly NESS reporting is encouraged, not all participating laboratories submit timely data, which can delay the compilation of accurate data. Finally, the number of laboratories that continue to test for specific EV types has decreased over time as testing requests from clinicians become less frequent and as viral culture methods are discontinued. Only a handful of U.S. laboratories have the capacity to test for HPeV. Although molecular detection methods are gradu-ally coming into wider use, some clinical laboratories use them only to determine the presence of EV and do not further test for type. HPeV are not detected by EV molecular methods. EV and HPeV molecular typing methods are carried out in a small number of state laboratories, but mostly remain the purview of large, specialized reference laboratories.
NESS allows monitoring of temporal patterns of EV and HPeV circulation based on voluntary laboratory reporting of isolates by type. NREVSS demonstrates EV activity over a wider geographic area and has more laboratory participation but does not provide information on type, demographic char-acteristics, or HPeV detections. The combined systems provide the best available data on EV circulation in the United States.
Understanding of currently circulating EV and HPeV types relies on voluntary reports to NESS from public health and clinical laboratories. The long-term viability of NESS depends on 1) maintaining and modernizing the capacity to identify and type EVs and HPeVs among public health and clinical laboratories, 2) continued regular reporting by currently participating laboratories, and 3) increasing the number of participating laboratories.
1Division of Viral Diseases, National Center for Immunization and Respiratory Disease, CDC.
Corresponding author: Glen Abedi, [email protected], 404-639-5979.
FIGURE 2. Proportion of specimens tested that were EV-positive and reported to NREVSS, by week and testing method used — United States, 2009–2013
PCRVirus isolation
0
5
10
15
20
25
30
% o
f EV-
posi
tive
spec
imen
s
Month and year
Jan Apr Jul Oct Jan Apr Jul Oct Jan Apr Jul Oct Jan Apr Jul Oct Jan Apr Jul Oct20132012201120102009
Abbreviations: EV = enterovirus; NREVSS = National Respiratory and Enteric Virus Surveillance System; PCR = polymerase chain reaction.
Morbidity and Mortality Weekly Report
MMWR / September 4, 2015 / Vol. 64 / No. 34 943
References 1. Pallansch MA, Oberste MS, Whitton JL. Enteroviruses: polioviruses,
coxsackieviruses, echoviruses, and newer enteroviruses. In: Fields Virology, Knipe DM, Howley, PM, eds. Philadelphia, PA: Lippincott Williams and Wilkins; 2013:490–530.
2. Abzug MJ. The enteroviruses: problems in need of treatments. J Infect 2014;68(Suppl 1):S108–14.
3. Romero JR, Selvarangan R. The human parechoviruses: an overview. Adv Pediatr 2011;58:65–85.
4. Pirbright Institute. Picornaviridae.com. Available at http://www.picornaviridae.com.
5. CDC. Notes from the field: severe hand, foot, and mouth disease associated with coxsackievirus A6—Alabama, Connecticut, California, and Nevada, November 2011–February 2012. MMWR Morb Mortal Wkly Rep 2012;61:213–4.
6. Sharp J, Harrison CJ, Puckett K, et al. Characteristics of young infants in whom human parechovirus, enterovirus or neither were detected in cerebrospinal fluid during sepsis evaluations. Pediatr Infect Dis J 2013;32:213–6.
7. DeVries AS, Harper J, Murray A, et al. Vaccine-derived poliomyelitis 12 years after infection in Minnesota. N Engl J Med 2011;364:2316–23.
8. Strikas RA, Anderson LJ, Parker RA. Temporal and geographic patterns of isolates of nonpolio enterovirus in the United States, 1970–1983. J Infect Dis 1986;153:346–51.
9. Blomqvist S, Klemola P, Kaijalainen S, et al. Co-circulation of coxsackieviruses A6 and A10 in hand, foot and mouth disease outbreak in Finland. J Clin Virol 2010;48:49–54.
10. Fujimoto T, Iizuka S, Enomoto M, et al. Hand, foot, and mouth disease caused by coxsackievirus A6, Japan, 2011. Emerg Infect Dis 2012;18:337–9.
Summary
What is already known on this topic?
Enteroviruses (EVs) and human parechoviruses (HPeVs) can cause a wide spectrum of clinical illness, ranging from asymptomatic infections to severe illnesses and death. A total of 134 EV and HPeV types have been identified to date, and they cause different but overlapping clinical illnesses, including aseptic meningitis, hand, foot, and mouth disease, and acute flaccid paralysis. Because EV and HPeV infections are not nationally notifiable, with the exception of poliovirus, surveillance for these infections in the United States is passive and voluntary.
What is added by this report?
Based on data from the National Enterovirus Surveillance System, the most commonly reported types of EV and HPeV during 2009–2013 were coxsackievirus A6 (CVA6) and human parechovirus 3 (HPeV3), each of which accounted for 12.3% of reports with known virus type (N = 1,819). The large number of CVA6 detections likely reflect an increase in testing in response to an outbreak of severe hand, foot, and mouth disease in late 2011 and 2012. Most HPeV3 detections originated from a single hospital that routinely tested for HPeVs.
What are the implications for public health practice?
EV and HPeV surveillance data might be used to determine patterns of circulation for individual virus types, interpret trends in enteroviral disease, assist with the recognition of outbreaks, and guide development of new diagnostic tests and therapies.
Morbidity and Mortality Weekly Report
944 MMWR / September 4, 2015 / Vol. 64 / No. 34
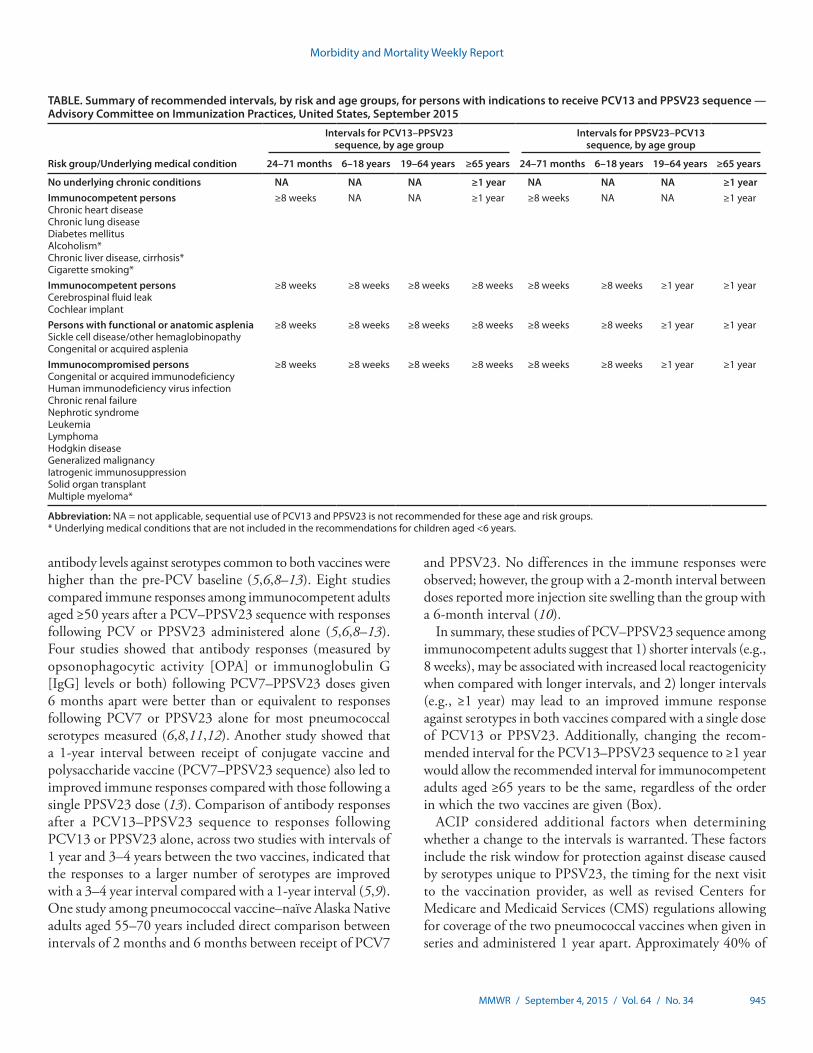
Two pneumococcal vaccines are currently licensed for use in the United States: the 13-valent pneumococcal conjugate vaccine (PCV13 [Prevnar 13, Wyeth Pharmaceuticals, Inc., a subsidiary of Pfizer Inc.]) and the 23-valent pneumococ-cal polysaccharide vaccine (PPSV23 [Pneumovax 23, Merck and Co., Inc.]). The Advisory Committee on Immunization Practices (ACIP) currently recommends that a dose of PCV13 be followed by a dose of PPSV23 in all adults aged ≥65 years who have not previously received pneumococcal vaccine and in persons aged ≥2 years who are at high risk for pneumococcal disease because of underlying medical conditions (Table) (1–4). The recommended intervals between PCV13 and PPSV23 given in series differ by age and risk group and the order in which the two vaccines are given (1–4).
On June 25, 2015, ACIP changed the recommended inter-val between PCV13 followed by PPSV23 (PCV13–PPSV23 sequence) from 6–12 months to ≥1 year for immunocompetent adults aged ≥65 years. Recommended intervals for all other age and risk groups remain unchanged. This report outlines the rationale for this change and summarizes the evidence considered by ACIP to make this recommendation.
In August 2014, ACIP recommended routine use of a dose of PCV13 followed by a dose of PPSV23 6–12 months later
among immunocompetent adults aged ≥65 years (1). Adults aged ≥65 years with immunocompromising conditions, func-tional or anatomic asplenia, cerebrospinal fluid (CSF) leaks, or cochlear implants are recommended to receive PCV13 first, followed by PPSV23 ≥8 weeks later (2). ACIP also recom-mended that all adults aged ≥65 years who already received PPSV23 should receive a dose of PCV13 ≥1 year after receipt of PPSV23 (PPSV23–PCV13 sequence). The difference in the recommended interval depending on the order in which the two vaccines were given added significant complexity to the recommendation and created implementation challenges for this age group. To simplify the recommendations, ACIP reviewed existing data to evaluate potential areas for har-monization of recommended dosing intervals. Specifically, ACIP assessed whether available evidence would support changing the recommended interval for the PCV13–PPSV23 sequence for immunocompetent adults aged ≥65 years from 6–12 months to ≥1 year and thus be harmonized with the recommended interval for the PPSV23–PCV13 sequence in the same age group.
No clinical studies evaluating efficacy of the two vaccines given in series are available. Therefore, current recommenda-tions are based on best available evidence from immunogenic-ity studies. The Grading of Recommendations, Assessment, Development, and Evaluation (GRADE) framework was used by ACIP to formulate the existing recommendations for immunocompromised children (http://www.cdc.gov/vaccines/acip/recs/grade/pneumo-immuno-child.html), immunocom-promised adults (http://www.cdc.gov/vaccines/acip/recs/grade/pneumo-immuno-adults.html), and adults ≥65 years (http://www.cdc.gov/vaccines/acip/recs/grade/pneumo-vac-adult.html) (1–3). No new evidence was available to inform har-monization of intervals; therefore, the GRADE process was not repeated. In addition, the immunogenicity studies were not designed to evaluate the optimal interval between the two vaccines. When both PCV13 and PPSV23 are to be admin-istered, PCV13 is recommended before PPSV23, based on studies demonstrating a better response to serotypes common to both vaccines when PCV was given first (5–7).
Studies evaluating the immune response to a conjugate vac-cine (PCV7 or PCV13) followed by the polysaccharide vaccine (PCV–PPSV23 sequence) at intervals of 2, 6, or 12 months or 3–4 years demonstrated that following the PPSV23 dose,
Intervals Between PCV13 and PPSV23 Vaccines: Recommendations of the Advisory Committee on Immunization Practices (ACIP)
Miwako Kobayashi, MD1,2; Nancy M Bennett, MD3,4; Ryan Gierke, MPH1; Olivia Almendares, MSPH1; Matthew R Moore, MD1; Cynthia G. Whitney, MD1; Tamara Pilishvili, MPH1
Recommendations for routine use of vaccines in children, adolescents and adults are developed by the Advisory Committee on Immunization Practices (ACIP). ACIP is chartered as a federal advisory committee to provide expert external advice and guidance to the Director of the Centers for Disease Control and Prevention (CDC) on use of vaccines and related agents for the control of vaccine-preventable diseases in the civilian population of the United States. Recommendations for routine use of vaccines in children and adolescents are harmonized to the greatest extent possible with recommendations made by the American Academy of Pediatrics (AAP), the American Academy of Family Physicians (AAFP), and the American College of Obstetricians and Gynecologists (ACOG). Recommendations for routine use of vaccines in adults are harmonized with recommendations of AAFP, ACOG, and the American College of Physicians (ACP). ACIP recommendations approved by the CDC Director become agency guidelines on the date published in the Morbidity and Mortality Weekly Report (MMWR). Additional information about ACIP is available at http://www.cdc.gov/vaccines/acip.
Morbidity and Mortality Weekly Report
MMWR / September 4, 2015 / Vol. 64 / No. 34 945
antibody levels against serotypes common to both vaccines were higher than the pre-PCV baseline (5,6,8–13). Eight studies compared immune responses among immunocompetent adults aged ≥50 years after a PCV–PPSV23 sequence with responses following PCV or PPSV23 administered alone (5,6,8–13). Four studies showed that antibody responses (measured by opsonophagocytic activity [OPA] or immunoglobulin G [IgG] levels or both) following PCV7–PPSV23 doses given 6 months apart were better than or equivalent to responses following PCV7 or PPSV23 alone for most pneumococcal serotypes measured (6,8,11,12). Another study showed that a 1-year interval between receipt of conjugate vaccine and polysaccharide vaccine (PCV7–PPSV23 sequence) also led to improved immune responses compared with those following a single PPSV23 dose (13). Comparison of antibody responses after a PCV13–PPSV23 sequence to responses following PCV13 or PPSV23 alone, across two studies with intervals of 1 year and 3–4 years between the two vaccines, indicated that the responses to a larger number of serotypes are improved with a 3–4 year interval compared with a 1-year interval (5,9). One study among pneumococcal vaccine–naïve Alaska Native adults aged 55–70 years included direct comparison between intervals of 2 months and 6 months between receipt of PCV7
and PPSV23. No differences in the immune responses were observed; however, the group with a 2-month interval between doses reported more injection site swelling than the group with a 6-month interval (10).
In summary, these studies of PCV–PPSV23 sequence among immunocompetent adults suggest that 1) shorter intervals (e.g., 8 weeks), may be associated with increased local reactogenicity when compared with longer intervals, and 2) longer intervals (e.g., ≥1 year) may lead to an improved immune response against serotypes in both vaccines compared with a single dose of PCV13 or PPSV23. Additionally, changing the recom-mended interval for the PCV13–PPSV23 sequence to ≥1 year would allow the recommended interval for immunocompetent adults aged ≥65 years to be the same, regardless of the order in which the two vaccines are given (Box).
ACIP considered additional factors when determining whether a change to the intervals is warranted. These factors include the risk window for protection against disease caused by serotypes unique to PPSV23, the timing for the next visit to the vaccination provider, as well as revised Centers for Medicare and Medicaid Services (CMS) regulations allowing for coverage of the two pneumococcal vaccines when given in series and administered 1 year apart. Approximately 40% of
TABLE. Summary of recommended intervals, by risk and age groups, for persons with indications to receive PCV13 and PPSV23 sequence — Advisory Committee on Immunization Practices, United States, September 2015
Risk group/Underlying medical condition
Intervals for PCV13–PPSV23 sequence, by age group
Intervals for PPSV23–PCV13 sequence, by age group
24–71 months 6–18 years 19–64 years ≥65 years 24–71 months 6–18 years 19–64 years ≥65 years
No underlying chronic conditions NA NA NA ≥1 year NA NA NA ≥1 yearImmunocompetent personsChronic heart diseaseChronic lung diseaseDiabetes mellitusAlcoholism*Chronic liver disease, cirrhosis*Cigarette smoking*
≥8 weeks NA NA ≥1 year ≥8 weeks NA NA ≥1 year
Immunocompetent personsCerebrospinal fluid leakCochlear implant
≥8 weeks ≥8 weeks ≥8 weeks ≥8 weeks ≥8 weeks ≥8 weeks ≥1 year ≥1 year
Persons with functional or anatomic aspleniaSickle cell disease/other hemaglobinopathyCongenital or acquired asplenia
≥8 weeks ≥8 weeks ≥8 weeks ≥8 weeks ≥8 weeks ≥8 weeks ≥1 year ≥1 year
Immunocompromised personsCongenital or acquired immunodeficiencyHuman immunodeficiency virus infectionChronic renal failureNephrotic syndromeLeukemiaLymphomaHodgkin diseaseGeneralized malignancyIatrogenic immunosuppressionSolid organ transplantMultiple myeloma*
≥8 weeks ≥8 weeks ≥8 weeks ≥8 weeks ≥8 weeks ≥8 weeks ≥1 year ≥1 year
Abbreviation: NA = not applicable, sequential use of PCV13 and PPSV23 is not recommended for these age and risk groups.* Underlying medical conditions that are not included in the recommendations for children aged <6 years.
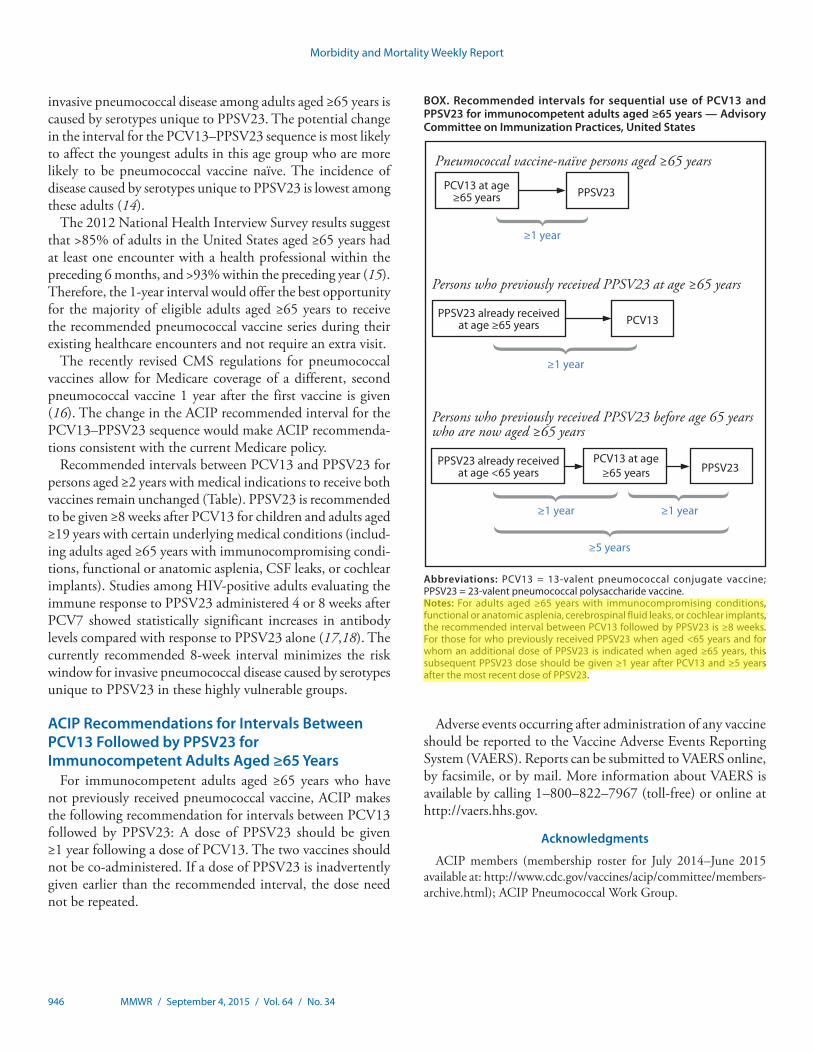
Morbidity and Mortality Weekly Report
946 MMWR / September 4, 2015 / Vol. 64 / No. 34
invasive pneumococcal disease among adults aged ≥65 years is caused by serotypes unique to PPSV23. The potential change in the interval for the PCV13–PPSV23 sequence is most likely to affect the youngest adults in this age group who are more likely to be pneumococcal vaccine naïve. The incidence of disease caused by serotypes unique to PPSV23 is lowest among these adults (14).
The 2012 National Health Interview Survey results suggest that >85% of adults in the United States aged ≥65 years had at least one encounter with a health professional within the preceding 6 months, and >93% within the preceding year (15).Therefore, the 1-year interval would offer the best opportunity for the majority of eligible adults aged ≥65 years to receive the recommended pneumococcal vaccine series during their existing healthcare encounters and not require an extra visit.
The recently revised CMS regulations for pneumococcal vaccines allow for Medicare coverage of a different, second pneumococcal vaccine 1 year after the first vaccine is given (16). The change in the ACIP recommended interval for the PCV13–PPSV23 sequence would make ACIP recommenda-tions consistent with the current Medicare policy.
Recommended intervals between PCV13 and PPSV23 for persons aged ≥2 years with medical indications to receive both vaccines remain unchanged (Table). PPSV23 is recommended to be given ≥8 weeks after PCV13 for children and adults aged ≥19 years with certain underlying medical conditions (includ-ing adults aged ≥65 years with immunocompromising condi-tions, functional or anatomic asplenia, CSF leaks, or cochlear implants). Studies among HIV-positive adults evaluating the immune response to PPSV23 administered 4 or 8 weeks after PCV7 showed statistically significant increases in antibody levels compared with response to PPSV23 alone (17,18). The currently recommended 8-week interval minimizes the risk window for invasive pneumococcal disease caused by serotypes unique to PPSV23 in these highly vulnerable groups.
ACIP Recommendations for Intervals Between PCV13 Followed by PPSV23 for Immunocompetent Adults Aged ≥65 Years
For immunocompetent adults aged ≥65 years who have not previously received pneumococcal vaccine, ACIP makes the following recommendation for intervals between PCV13 followed by PPSV23: A dose of PPSV23 should be given ≥1 year following a dose of PCV13. The two vaccines should not be co-administered. If a dose of PPSV23 is inadvertently given earlier than the recommended interval, the dose need not be repeated.
Adverse events occurring after administration of any vaccine should be reported to the Vaccine Adverse Events Reporting System (VAERS). Reports can be submitted to VAERS online, by facsimile, or by mail. More information about VAERS is available by calling 1–800–822–7967 (toll-free) or online at http://vaers.hhs.gov.
Acknowledgments
ACIP members (membership roster for July 2014–June 2015 available at: http://www.cdc.gov/vaccines/acip/committee/members-archive.html); ACIP Pneumococcal Work Group.
BOX. Recommended intervals for sequential use of PCV13 and PPSV23 for immunocompetent adults aged ≥65 years — Advisory Committee on Immunization Practices, United States
Persons who previously received PPSV23 before age 65 years who are now aged ≥65 years
≥1 year
≥5 years
PPSV23 already received at age <65 years
≥1 year
PCV13 at age≥65 years PPSV23
Persons who previously received PPSV23 at age ≥65 years
PPSV23 already received at age ≥65 years
≥1 year
PCV13
Pneumococcal vaccine-naïve persons aged ≥65 years
PCV13 at age ≥65 years PPSV23
≥1 year
Abbreviations: PCV13 = 13-valent pneumococcal conjugate vaccine; PPSV23 = 23-valent pneumococcal polysaccharide vaccine.Notes: For adults aged ≥65 years with immunocompromising conditions, functional or anatomic asplenia, cerebrospinal fluid leaks, or cochlear implants, the recommended interval between PCV13 followed by PPSV23 is ≥8 weeks. For those for who previously received PPSV23 when aged <65 years and for whom an additional dose of PPSV23 is indicated when aged ≥65 years, this subsequent PPSV23 dose should be given ≥1 year after PCV13 and ≥5 years after the most recent dose of PPSV23.
hxv5
Text Box
Please note: Errata have been published for this issue. To view the errata, please click here and here.
hxv5
Highlight

Morbidity and Mortality Weekly Report
MMWR / September 4, 2015 / Vol. 64 / No. 34 947
1National Center for Immunization and Respiratory Diseases, CDC; 2Epidemic Intelligence Service, CDC; 3Pneumococcal Vaccines Working Group Chair, Advisory Committee on Immunization Practices; 4Department of Medicine, University of Rochester School of Medicine and Dentistry, Rochester, New York.
Corresponding author: Tamara Pilishvili, [email protected], 404-639-2215.
References1. Tomczyk S, Bennett NM, Stoecker C, et al. Use of 13-valent pneumococcal
conjugate vaccine and 23-valent pneumococcal polysaccharide vaccine among adults aged ≥65 years: recommendations of the Advisory Committee on Immunization Practices (ACIP). MMWR Morb Mortal Wkly Rep 2014;63:822–5.
2. CDC. Use of 13-valent pneumococcal conjugate vaccine and 23-valent pneumococcal polysaccharide vaccine for adults with immunocompromising conditions: recommendations of the Advisory Committee on Immunization Practices (ACIP). MMWR Morb Mortal Wkly Rep 2012;61:816–9.
3. CDC. Use of 13-valent pneumococcal conjugate vaccine and 23-valent pneumococcal polysaccharide vaccine among children aged 6–18 years with immunocompromising conditions: recommendations of the Advisory Committee on Immunization Practices (ACIP). MMWR Morb Mortal Wkly Rep 2013;62:521–4.
4. Nuorti JP, Whitney CG. Prevention of pneumococcal disease among infants and children—use of 13-valent pneumococcal conjugate vaccine and 23-valent pneumococcal polysaccharide vaccine— recommendations of the Advisory Committee on Immunization Practices (ACIP). MMWR Recomm Rep 2010;59(No. RR-11):1–18.
5. Greenberg RN, Gurtman A, Frenck RW, et al. Sequential administration of 13-valent pneumococcal conjugate vaccine and 23-valent pneumococcal polysaccharide vaccine in pneumococcal vaccine-naïve adults 60–64 years of age. Vaccine 2014;32:2364–74.
6. Musher DM, Rueda AM, Nahm MH, Graviss EA, Rodriguez-Barradas MC. Initial and subsequent response to pneumococcal polysaccharide and protein-conjugate vaccines administered sequentially to adults who have recovered from pneumococcal pneumonia. J Infect Dis 2008;198:1019–27.
7. Blum MD, Dagan R, Mendelman PM, et al. A comparison of multiple regimens of pneumococcal polysaccharide-meningococcal outer membrane protein complex conjugate vaccine and pneumococcal polysaccharide vaccine in toddlers. Vaccine 2000;18:2359–67.
8. Goldblatt D, Southern J, Andrews N, et al. The immunogenicity of 7-valent pneumococcal conjugate vaccine versus 23-valent polysaccharide vaccine in adults aged 50–80 years. Clin Infect Dis 2009;49:1318–25.
9. Jackson LA, Gurtman A, van Cleeff M, et al. Influence of initial vaccination with 13-valent pneumococcal conjugate vaccine or 23-valent pneumococcal polysaccharide vaccine on anti-pneumococcal responses following subsequent pneumococcal vaccination in adults 50 years and older. Vaccine 2013;31:3594–602.
10. Miernyk KM, Butler JC, Bulkow LR, et al. Immunogenicity and reactogenicity of pneumococcal polysaccharide and conjugate vaccines in Alaska native adults 55–70 years of age. Clin Infect Dis 2009;49:241–8.
11. Lazarus R, Clutterbuck E, Yu LM, et al. A randomized study comparing combined pneumococcal conjugate and polysaccharide vaccination schedules in adults. Clin Infect Dis 2011;52:736–42.
12. Macintyre CR, Ridda I, Gao Z, et al. A randomized clinical trial of the immunogenicity of 7-valent pneumococcal conjugate vaccine compared to 23-valent polysaccharide vaccine in frail, hospitalized elderly. PLoS One 2014;9:e94578.
13. de Roux A, Schmöle-Thoma B, Siber GR, et al. Comparison of pneumococcal conjugate polysaccharide and free polysaccharide vaccines in elderly adults: conjugate vaccine elicits improved antibacterial immune responses and immunological memory. Clin Infect Dis 2008;46:1015–23.
14. CDC. Active bacterial core surveilance (ABCs). Atlanta, GA: US Department of Health and Human Services, CDC; 2013. Available from: http://www.cdc.gov/abcs/reports-findings/survreports/spneu13.html.
15. Blackwell DL, Lucas JW, Clarke TC. Summary health statistics for US adults: national health interview survey, 2012. Vital Health Stat 10 2014;10:1–161.
16. Centers for Medicare and Medicaid Services. Modifications to Medicare part B coverage of pneumococcal vaccinations. Washington, DC: Department of Health and Human Services, Centers for Medicare and Medicaid Services; 2014. Available at https://www.cms.gov/Outreach-and-Education/Medicare-Learning-Network-MLN/MLNMattersArticles/Downloads/MM9051.pdf.
17. Feikin DR, Elie CM, Goetz MB, et al. Randomized trial of the quantitative and functional antibody responses to a 7-valent pneumococcal conjugate vaccine and/or 23-valent polysaccharide vaccine among HIV-infected adults. Vaccine 2001;20:545–53.
18. Lesprit P, Pédrono G, Molina JM, et al. Immunological efficacy of a prime-boost pneumococcal vaccination in HIV-infected adults. AIDS 2007;21:2425–34.
Summary
What is currently recommended?
The Advisory Committee on Immunization Practices (ACIP) currently recommends that both 13-valent pneumococcal conjugate vaccine (PCV13) and 23-valent pneumococcal polysaccharide vaccine (PPSV23) be given to all immunocompe-tent adults aged ≥65 years. ACIP recommends that PCV13 be given first followed by PPSV23 6–12 months later. ACIP also recommends that adults aged ≥65 years who already received a dose of PPSV23, should also receive a dose of PCV13 ≥1 year after the dose of PPSV23. Among persons aged ≥2 years with medical indications to receive both PCV13 and PPSV23 in a series, including adults aged ≥65 years with immunocompro-mising conditions, functional or anatomic asplenia, cochlear implants, or cerebrospinal fluid leaks, a dose of PPSV23 should be given ≥8 weeks after a dose of PCV13.
Why are the recommendations being modified now?
To simplify the recommendations for PCV13 and PPSV23 use among immunocompetent adults aged ≥65 years, ACIP recommended harmonization of recommended intervals between PCV13 and PPSV23 regardless of the order in which the two vaccines are given.
What are the new recommendations?
ACIP recommends that both PCV13 and PPSV23 be given in series to adults aged ≥65 years. A dose of PCV13 should be given first followed by a dose of PPSV23 at least 1 year later to immunocompetent adults aged ≥65 years. The two vaccines should not be co-administered. If a dose of PPSV23 is inadver-tently given earlier than the recommended interval, the dose need not be repeated.

Morbidity and Mortality Weekly Report
948 MMWR / September 4, 2015 / Vol. 64 / No. 34
On March 24, 2015, the Food and Drug Administration licensed an additional combined diphtheria and tetanus toxoids and acellular pertussis adsorbed (DTaP) and inactivated polio-virus (IPV) vaccine (DTaP-IPV) (Quadracel, Sanofi Pasteur Inc.). Quadracel is the second DTaP-IPV vaccine to be licensed for use among children aged 4 through 6 years in the United States (1). Quadracel is approved for administration as a fifth dose in the DTaP series and as a fourth or fifth dose in the IPV series in children aged 4 through 6 years who have received 4 doses of DTaP-IPV-Hib (Pentacel, Sanofi Pasteur) and/or DTaP (Daptacel, Sanofi Pasteur) vaccine (2,3). This report summarizes the indications for Quadracel vaccine and provides guidance from the Advisory Committee on Immunization Practices (ACIP) for its use.
The ACIP Combination Vaccines Work Group, includ-ing liaison representatives from the American Academy of Pediatrics, the American Academy of Family Physicians, the National Association of Pediatric Nurse Practitioners, and the American Academy of Physician Assistants, reviewed data on the safety and immunogenicity of Quadracel vaccine. On the basis of the clinical data reviewed, expert opinion of the work group, and feedback from ACIP liaison organizations, ACIP endorsed the licensed indications for this vaccine. Both licensed DTaP-IPV vaccine formulations are included in the federal Vaccines for Children Program (4).
The individual antigens (diphtheria and tetanus toxoids; pertussis antigens [pertussis toxoid, filamentous hemaggluti-nin, pertactin, and fimbriae types 2 and 3]; and inactivated poliovirus types 1, 2, and 3) contained in a dose of Quadracel are identical to the antigens contained in Sanofi Pasteur’s DTaP-IPV-Hib (Pentacel) vaccine (3,5). Quadracel contains no preservatives and is administered as an intramuscular injec-tion, preferably into the deltoid muscle of the upper arm. One clinical trial conducted in U.S. children aged 4 through 6 years showed that Quadracel and separately administered DTaP (Daptacel) and IPV (Ipol, Sanofi Pasteur) vaccines had comparable safety and reactogenicity profiles, with or without a coadministered second dose of measles, mumps, and rubella (MMR) and varicella (VAR) vaccines (3). The immunogenicity of all antigens was noninferior among the treatment groups, with or without a coadministered second dose of MMR and VAR vaccines.
Indications and Guidance for UseQuadracel is indicated for use as the fifth dose of DTaP
and fourth or fifth dose of IPV in children aged 4 through 6 years who received DTaP-IPV-Hib (Pentacel) and/or DTaP (Daptacel) vaccine as the first 4 doses (2,3). This vaccine should not be administered to children aged <4 years or ≥7 years. If Quadracel vaccine is inadvertently administered before age 4 years for an earlier dose of the DTaP and/or IPV series and if minimum interval requirements have been met, the dose may be counted as valid for the DTaP and/or IPV series and does not need to be repeated (6). Note that the final dose in the IPV series must be administered at age ≥4 years regard-less of the number of previous doses, and with a minimum interval of 6 months from the previous dose (7). Therefore, a dose of Quadracel vaccine administered before the fourth birthday cannot be counted as a valid final dose of IPV. Data are limited on the safety and immunogenicity of interchanging DTaP vaccines from different manufacturers (8).
ACIP recommends that, whenever feasible, the same manu-facturer’s DTaP vaccines should be used for each dose in the series. However, vaccination should not be deferred because the type of DTaP vaccine previously administered is unavail-able or unknown (6).
1Division of Bacterial Diseases, National Center for Immunization and Respiratory Diseases; 2Division of Viral Diseases, National Center for Immunization and Respiratory Diseases, CDC.
Corresponding author: Jennifer Liang, [email protected].
References1. CDC. Licensure of a diphtheria and tetanus toxoids and acellular pertussis
adsorbed and inactivated poliovirus vaccine and guidance for use as a booster dose. MMWR Morb Mortal Wkly Rep 2008;57:1078–9.
2. Strikas RA; Advisory Committee on Immunization Practices (ACIP); ACIP Child/Adolescent Immunization Work Group. Advisory committee on immunization practices recommended immunization schedules for persons aged 0 through 18 years—United States, 2015. MMWR Morb Mortal Wkly Rep 2015;64:93–4.
3. Food and Drug Administration. Product approval information: package insert. Quadracel (diphtheria and tetanus toxoids and acellular pertussis adsorbed and inactivated poliovirus vaccine). Available at http://www.fda.gov/downloads/BiologicsBloodVaccines/Vaccines/ApprovedProducts/UCM439903.pdf.
4. CDC. Advisory Committee on Immunization Practices. Vaccines for Children Program. Vaccines to prevent diphtheria, tetanus and pertussis. Resolution No. 10/12–1. Available at http://www.cdc.gov/vaccines/programs/vfc/downloads/resolutions/1012-1-dtap.pdf.
Licensure of a Diphtheria and Tetanus Toxoids and Acellular Pertussis Adsorbed and Inactivated Poliovirus Vaccine and Guidance for
Use as a Booster DoseJennifer Liang, DVM1; Greg Wallace, MD2; Gina Mootrey, DO1
Morbidity and Mortality Weekly Report
MMWR / September 4, 2015 / Vol. 64 / No. 34 949
5. Food and Drug Administration. Product approval information: package insert. Pentacel (diphtheria and tetanus toxoids and acellular pertussis adsorbed, inactivated poliovirus) and Haemophilus b conjugate (tetanus toxoid conjugate) vaccine). Available at http://www.fda.gov/downloads/BiologicsBloodVaccines/Vaccines/ApprovedProducts/UCM109810.pdf.
6. CDC. General recommendations on immunization—recommendations of the Advisory Committee on Immunization Practices (ACIP). MMWR Recomm Rep 2011;60(No. RR-2):1–64.
7. CDC. Updated recommendations of the Advisory Committee on Immunization Practices (ACIP) regarding routine poliovirus vaccination. MMWR Morb Mortal Wkly Rep 2009;58:829–30.
8. Greenberg DP, Pickering LK, Senders SD, et al. Interchangeability of 2 diphtheria-tetanus-acellular pertussis vaccines in infancy. Pediatrics 2002;109:666–72.

Morbidity and Mortality Weekly Report
950 MMWR / September 4, 2015 / Vol. 64 / No. 34
IntroductionCardiovascular disease (CVD) is responsible for nearly
800,000 deaths and approximately $320 billion in costs in the United States each year (1). Studies have identified a number of modifiable CVD risk factors, including high blood pressure, smoking, high blood cholesterol, diabetes, and being over-weight or obese (1,2). Differences in prevalence of CVD risk factors play important roles in persistent racial, socioeconomic, and regional disparities in CVD morbidity and mortality in the United States (3,4).
To help with the prevention and management of CVD, several multivariable prediction models have been developed to predict the risk for developing CVD based on a person’s cardiovascular risk factor profile (2,5,6). Most of these models estimate a person’s absolute risk for having a coronary heart disease event or stroke within a certain period (e.g., in the next 10 years). However, predicted absolute risk is an epidemiologic concept that might
be difficult for members of the public to interpret and, therefore, its usefulness in motivating lifestyle changes or adherence to recommended therapeutic interventions might be limited (7,8). Moreover, its use might provide false assurance, especially among younger persons whose chronological age might conceal the effects that risk factors (e.g., smoking and uncontrolled hypertension) have on their long-term CVD risk (9).
In 2008, the Framingham Heart Study introduced the concept of heart age (i.e., the predicted age of the vascular system of a person based on his or her cardiovascular risk factor profile) (10). The comparison of heart age to chronological age represents an alternative way to express a person’s risk for hav-ing a CVD event* and provides information about a person’s
Abstract
Introduction: Cardiovascular disease is a leading cause of morbidity and mortality in the United States. Heart age (the predicted age of a person’s vascular system based on their cardiovascular risk factor profile) and its comparison with chronological age represent a new way to express risk for developing cardiovascular disease. This study estimates heart age and differences between heart age and chronological age (excess heart age) and examines racial, sociodemographic, and regional disparities in heart age among U.S. adults aged 30–74 years.
Methods: Weighted 2011 and 2013 Behavioral Risk Factor Surveillance System data were applied to the sex-specific non–laboratory-based Framingham risk score models, stratifying the results by age and race/ethnic group, educational and income level, and state. These results were then translated into age-standardized heart age values, mean excess heart age was calculated, and the findings were compared across groups.
Results: Overall, average predicted heart age for adult men and women was 7.8 and 5.4 years older than their chronologi-cal age, respectively. Statistically significant (p<0.05) racial/ethnic, sociodemographic, and regional differences in heart age were observed: heart age among non-Hispanic black men (58.7 years) and women (58.9 years) was greater than other racial/ethnic groups, including non-Hispanic white men (55.3 years) and women (52.5 years). Excess heart age was lowest for men and women in Utah (5.8 and 2.8 years, respectively) and highest in Mississippi (10.1 and 9.1 years, respectively).
Conclusions and Implications for Public Health Practice: The predicted heart age among U.S. adults aged 30–74 years was significantly higher than their chronological age. Use of predicted heart age might 1) simplify risk communication and motivate more persons to live heart-healthy lifestyles and better comply with recommended therapeutic interven-tions, and 2) motivate communities to implement programs and policies that support cardiovascular health.
Vital Signs: Predicted Heart Age and Racial Disparities in Heart Age Among U.S. Adults at the State Level
Quanhe Yang, PhD1; Yuna Zhong, MSPH1; Matthew Ritchey, DPT1; Mark Cobain, PhD2; Cathleen Gillespie, MS1; Robert Merritt, MA1; Yuling Hong, MD, PhD1; Mary G. George, MD1; Barbara A Bowman, PhD1
* A CVD event is the development of coronary heart disease (coronary death, myocardial infarction, coronary insufficiency, and angina), cerebrovascular disease (ischemic stroke, hemorrhagic stroke, and transient ischemic attack), peripheral artery disease (intermittent claudication), or heart failure.
On September 1, 2015, this report was posted as an MMWR Early Release on the MMWR website (http://www.cdc.gov/mmwr).
imt2
Text Box
Please note: Errata have been published for this issue. To view the errata, please click here and here.
Morbidity and Mortality Weekly Report
MMWR / September 4, 2015 / Vol. 64 / No. 34 951
cardiovascular health that is not clear from the 10-year risk score alone. This method might simplify risk communication and motivate more persons, especially younger persons, to establish heart-healthy lifestyle changes and adhere to recom-mended treatment strategies (7,8,11). However, no study has provided population-level estimates of heart age and examined disparities in heart age among U.S. adults. This study pro-vides national estimates for heart age, identifies differences between heart age and chronological age, and examines the racial, sociodemographic, and state-level disparities in heart age among U.S. adults aged 30–74 years using 2011 and 2013 Behavioral Risk Factor Surveillance System (BRFSS) data.
MethodsBRFSS is a state-based, random-digit–dialed telephone
survey that uses a multistage sampling design to select a state-specific sample from noninstitutionalized U.S. civilian adults aged ≥18 years; a CVD-specific module is conducted in odd-numbered years. Detailed methodology on BRFSS is available at http://www.cdc.gov/brfss. Weighted 2011 and 2013 BRFSS data collected from all 50 states and the District of Columbia were combined to obtain stable estimates; the median combined response rate for each year was 49.7% and 45.9%, respectively. Among 981,660 participants, 403,135 (41%) were excluded, including 234,936 participants aged <30 or ≥75 years, to meet the recommended age range for heart age calculation; 74,834 participants with self-reported coronary heart disease, myocardial infarction, or stroke at baseline; 2,929 pregnant women; and 90,409 participants with missing covariates used for blood pressure prediction, leaving 578,525 participants for analysis.
For estimation of heart age, the sex-specific non–laboratory-based Framingham Risk Score (FRS) was used to estimate the risk for developing CVD in the next 10 years among BRFSS participants, which required the use of the following self-reported attributes: age, current smoking status, antihy-pertensive medication use, diabetes status, and body mass index (BMI) (10). In addition, because the non–laboratory-based FRS requires the use of systolic blood pressure and BRFSS data do not include measured systolic blood pressure for participants, a previously published method to estimate participants’ systolic blood pressure was used (12). In brief, using National Health and Nutrition Examination Survey (NHANES) 2007–2012 data, four sex- and hypertension-status–specific multivariable linear regression models were developed to predict systolic blood pressure. These NHANES-derived parameters were then applied to the comparable variables among BRFSS participants to predict each person’s systolic blood pressure. After calculating participants’ FRS using their predicted systolic blood pressure, their FRS result
was translated to the corresponding predicted heart age, with the upper limit of predicted heart age set at 100 years (10).
Age-standardized and weighted means and prevalence and 95% confidence intervals (CIs) were calculated for participants’ chronological age, predicted heart age, the difference between predicted heart age and chronological age (defined as excess heart age). Prevalence of participants whose excess heart age was ≥5 years was calculated by age group (30–39, 40–49, 50–59, and 60–74 years), race/ethnicity (non-Hispanic white [white], non-Hispanic black [black], Hispanic, and others), education (<high school, high school, and >high school), annual house-hold income (<$35,000 or ≥$35,000), and state. Multivariable linear regression models were used to estimate racial dispari-ties in the difference of excess heart age among racial/ethnic groups by age, education, and household income group. Data were analyzed using statistical software that accounted for each surveys’ complex sampling design.
ResultsAmong 236,101 men and 342,424 women, the mean
weighted chronological ages were 47.8 and 47.9 years, respectively (Table 1). The corresponding predicted heart ages and excess heart ages were 55.6 and 53.3 and 7.8 and 5.4 years for men and women, respectively (Table 1). Among men, blacks had the highest predicted heart age (58.7 years) followed by Hispanics (55.7 years), whites (55.3 years) and others (54.7 years). Among women, the corresponding values by race/ethnicity were 58.9 years, 53.5 years, 52.5 years, and 52.3 years, respectively. Excess heart age increased with age and decreased as education and household income increased. Overall, approximately 69.1 million (43.7%) U.S. adults aged 30–74 years had excess heart age ≥5 years.† Prevalence of excess heart age ≥5 years was 48.8% among men and 38.5% among women; among both sexes, prevalence was higher among blacks compared with whites, increased with age, and decreased with greater education and household income (Table 1).
Among men, the adjusted difference in excess heart age between blacks and whites was 2.7 years, -1.2 years between Hispanics and whites, and 3.8 years between blacks and Hispanics (Table 2). The corresponding numbers for women were 5.3 years, -1.6 years, and 7.0 years, respectively. The racial differences in predicted excess heart age tended to increase
† To determine the number of persons with heart age greater than chronological age, the sex-specific prevalence of adults aged 30–39, 40–49, 50–59, and 60–74 years free from CVD was determined using NHANES 2007–2012 data. Next, these prevalence estimates were applied to the NHANES 2011–2012 age- and sex-specific noninstitutionalized U.S. civilian population counts to determine the number of adults by age category free from CVD during that period. Finally, the BRFSS 2011 and 2013 derived age- and sex-specific heart age prevalence estimates were applied to these population estimates to determine the age- and sex-specific count estimates averaged across 2011 and 2013.

Morbidity and Mortality Weekly Report
952 MMWR / September 4, 2015 / Vol. 64 / No. 34
with greater age, education, and household income for blacks compared with whites, but decrease for Hispanics compared with whites (Table 2). For blacks compared with Hispanics, predicted excess heart age tended to increase with greater age, but decrease with greater education and household income.
At the state level, age-standardized excess heart age was low-est in Utah for men (5.8 years) and women (2.8 years) and was highest in Mississippi for men (10.1 years) and women (9.1 years) (Table 3). Similar patterns were observed in the distribution of prevalence of excess heart age ≥5 years by sex and state (Table 3).
Conclusions and CommentThe predicted heart age among surveyed U.S. adults aged
30–74 years was substantially higher than their chronological age. On average, men and women had a predicted heart age 7.8 and 5.4 years older, respectively, than their chronological age, if the selected CVD risk factors were in an ideal range (not smoking, having normal systolic blood pressure (≤120 mmHg) and BMI <25, and not having diabetes). One in two men and two in five women had a predicted heart age ≥5 years older than their chronological age. This finding of high prevalence of excess heart age was consistent with the findings of other studies that have documented only a small proportion of U.S. adults meeting ideal cardiovascular health metrics (13,14).
Among younger adults, predicted excess heart age was higher among men compared with women. For example, among men aged 30–39 years, the average predicted heart age was 3.8 years older than their chronological age, compared with -0.3 years among similarly aged women. This disparity aligns with other findings showing that the mean chronological age of men who have suffered an initial heart attack is about 7 years younger than that of women (65.0 versus 71.8 years) (1). This pattern of greater excess heart age among men was consistent across all the age groups until age 60–74 years, where women’s excess heart age surpassed that of men’s.
This analysis revealed substantial racial/ethnic disparities in the predicted heart age, with blacks having significantly higher predicted heart age compared with that of other groups. When adjusted for age, education and household income, the excess heart age among black men was 3 or 4 years more than white or Hispanic men, respectively, and among black women was 5 or 7 years more than white and Hispanic women, respectively. The higher predicted heart age among blacks might reflect persistent racial disparities in CVD risk factors,§ especially elevated hypertension prevalence among blacks (3,4).
TABLE 1. Age-standardized and weighted mean and prevalence of chronological age, heart age, and excess heart age, by sex and selected characteristics, among adults aged 30–74 years — Behavioral Risk Factor Surveillance System, United States, 2011 and 2013
Characteristic
Men* Women*
Chronological age Heart ageExcess
heart age†
Prevalence of excess heart
age ≥5 yrs Chronological age Heart ageExcess
heart age†
Prevalence of excess heart
age ≥5 yrs
No. Yrs (95% CI) Yrs (95% CI) Yrs (95% CI) % (95% CI) No. Yrs (95% CI) Yrs (95% CI) Yrs (95% CI) % (95% CI)
Total 236,101 47.8 (47.8–47.8) 55.6 (55.6–55.7) 7.8 (7.8–7.9) 48.8 (48.4–49.2) 342,424 47.9 (47.9–47.9) 53.3 (53.2–53.3) 5.4 (5.3–5.5) 38.5 (38.2–38.8)
Age group (yrs)30–39 39,195 34.3 (34.3–34.4) 38.1 (38.0–38.2) 3.8 (3.7–3.9) 33.4 (32.5–34.2) 52,054 34.3 (34.3–34.4) 34.0 (33.9–34.1) -0.3 (-0.4– -0.2) 16.0 (15.5–16.6)40–49 50,493 44.4 (44.3–44.4) 50.3 (50.1–50.4) 5.9 (5.8–6.0) 40.8 (40.0–41.6) 67,631 44.4 (44.4–44.4) 47.1 (47.0–47.3) 2.7 (2.6–2.9) 31.1 (30.4–31.7)50–59 67,020 54.1 (54.1–54.2) 64.5 (64.3–64.6) 10.3 (10.2–10.5) 58.4 (57.7–59.1) 95,632 54.2 (54.1–54.2) 62.3 (62.2–62.5) 8.2 (8.0–8.3) 48.9 (48.3–49.6)60–74 79,393 65.7 (65.6–65.7) 79.5 (79.3–79.7) 13.8 (13.7–14.0) 72.8 (72.2–73.5) 127,107 66.0 (65.9–66.0) 80.5 (80.4–80.7) 14.6 (14.4–14.7) 71.0 (70.5–71.5)
Race/EthnicityWhite,
non-Hispanic191,984 47.8 (47.8–47.9) 55.3 (55.2–55.4) 7.4 (7.4–7.5) 48.0 (47.5–48.4) 273,391 48.0 (48.0–48.0) 52.5 (52.5–52.6) 4.6 (4.5–4.6) 36.4 (36.1–36.8)
Black, non-Hispanic
15,446 47.8 (47.7–47.8) 58.7 (58.4–59.0) 11.0 (10.7–11.2) 60.9 (59.5–62.2) 30,531 47.7 (47.7–47.8) 58.9 (58.6–59.1) 11.1 (10.9–11.4) 56.9 (55.9–57.8)
Hispanic 14,136 47.7 (47.6–47.8) 55.7 (55.4–56.0) 8.1 (7.8–8.3) 47.9 (46.4–49.3) 20,518 47.6 (47.5–47.7) 53.5 (53.2–53.8) 5.9 (5.7–6.2) 37.6 (36.4–38.7)Other 14,535 47.6 (47.5–47.8) 54.7 (54.4–55.1) 7.1 (6.7–7.4) 44.0 (42.4–45.6) 17,984 47.8 (47.6–47.9) 52.3 (51.9–52.7) 4.5 (4.2–4.9) 35.0 (33.5–36.5)
Education<High school 15,467 47.9 (47.9–48.0) 58.4 (58.2–58.7) 10.5 (10.2–10.7) 61.2 (59.8–62.6) 21,282 47.9 (47.8–48.0) 57.9 (57.6–58.3) 10.0 (9.8–10.3) 54.0 (52.7–55.2)High school 63,586 47.9 (47.8–47.9) 57.5 (57.4–57.6) 9.6 (9.5–9.8) 58.1 (57.4–58.9) 90,064 48.0 (48.0–48.1) 55.3 (55.2–55.5) 7.3 (7.2–7.5) 46.9 (46.3–47.6)>High school 157,048 47.7 (47.7–47.8) 54.1 (54.0–54.2) 6.3 (6.3–6.4) 41.5 (41.1–42.0) 231,078 47.8 (47.8–47.8) 51.5 (51.5–51.6) 3.7 (3.6–3.8) 32.2 (31.9–32.6)
Annual household income§
<$35,000 63,342 47.8 (47.8–47.9) 58.0 (57.9–58.2) 10.2 (10.1–10.4) 60.4 (59.6–61.2) 112,186 47.9 (47.8–47.9) 57.1 (57.0–57.2) 9.2 (9.1–9.4) 52.4 (51.8–53.0)≥$35,000 154,389 47.8 (47.8–47.8) 54.5 (54.4–54.6) 6.7 (6.6–6.8) 43.2 (42.7–43.7) 193,042 47.8 (47.8–47.9) 51.1 (51.0–51.1) 3.2 (3.2–3.3) 30.8 (30.4–31.2)
Abbreviation: CI = confidence interval.* Age-standardized by the direct method to the U.S. 2010 census population using the age groups 30–39, 40–49, 50–59, 60–69, and 70–74 years.† Excess heart age = predicted heart age - chronological age.§ Information on household income was not available for 55,566 participants.
§ Supplementary Tables 1 and 2 (available at http://stacks.cdc.gov/view/cdc/33002) demonstrate the age-standardized distribution of CVD risk factors included in non–laboratory-based FRS heart age calculations, by race/ethnic group and sex.
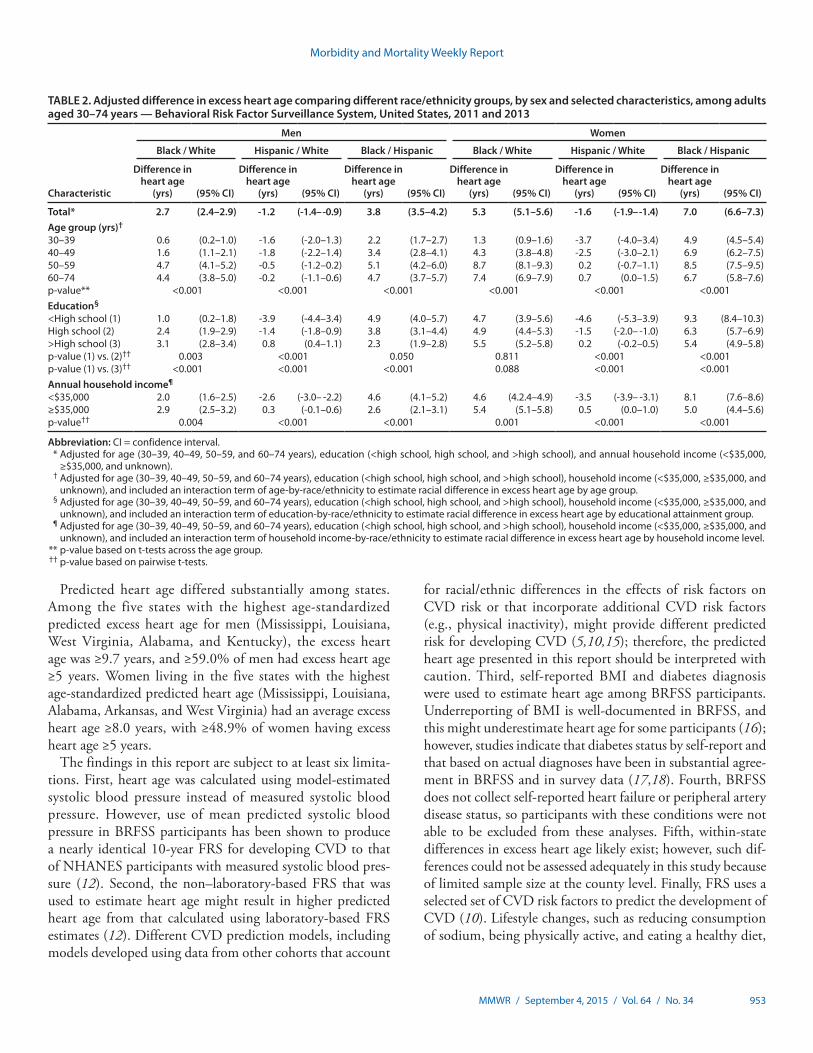
Morbidity and Mortality Weekly Report
MMWR / September 4, 2015 / Vol. 64 / No. 34 953
Predicted heart age differed substantially among states. Among the five states with the highest age-standardized predicted excess heart age for men (Mississippi, Louisiana, West Virginia, Alabama, and Kentucky), the excess heart age was ≥9.7 years, and ≥59.0% of men had excess heart age ≥5 years. Women living in the five states with the highest age-standardized predicted heart age (Mississippi, Louisiana, Alabama, Arkansas, and West Virginia) had an average excess heart age ≥8.0 years, with ≥48.9% of women having excess heart age ≥5 years.
The findings in this report are subject to at least six limita-tions. First, heart age was calculated using model-estimated systolic blood pressure instead of measured systolic blood pressure. However, use of mean predicted systolic blood pressure in BRFSS participants has been shown to produce a nearly identical 10-year FRS for developing CVD to that of NHANES participants with measured systolic blood pres-sure (12). Second, the non–laboratory-based FRS that was used to estimate heart age might result in higher predicted heart age from that calculated using laboratory-based FRS estimates (12). Different CVD prediction models, including models developed using data from other cohorts that account
for racial/ethnic differences in the effects of risk factors on CVD risk or that incorporate additional CVD risk factors (e.g., physical inactivity), might provide different predicted risk for developing CVD (5,10,15); therefore, the predicted heart age presented in this report should be interpreted with caution. Third, self-reported BMI and diabetes diagnosis were used to estimate heart age among BRFSS participants. Underreporting of BMI is well-documented in BRFSS, and this might underestimate heart age for some participants (16); however, studies indicate that diabetes status by self-report and that based on actual diagnoses have been in substantial agree-ment in BRFSS and in survey data (17,18). Fourth, BRFSS does not collect self-reported heart failure or peripheral artery disease status, so participants with these conditions were not able to be excluded from these analyses. Fifth, within-state differences in excess heart age likely exist; however, such dif-ferences could not be assessed adequately in this study because of limited sample size at the county level. Finally, FRS uses a selected set of CVD risk factors to predict the development of CVD (10). Lifestyle changes, such as reducing consumption of sodium, being physically active, and eating a healthy diet,
TABLE 2. Adjusted difference in excess heart age comparing different race/ethnicity groups, by sex and selected characteristics, among adults aged 30–74 years — Behavioral Risk Factor Surveillance System, United States, 2011 and 2013
Characteristic
Men Women
Black / White Hispanic / White Black / Hispanic Black / White Hispanic / White Black / Hispanic
Difference in heart age
(yrs) (95% CI)
Difference in heart age
(yrs) (95% CI)
Difference in heart age
(yrs) (95% CI)
Difference in heart age
(yrs) (95% CI)
Difference in heart age
(yrs) (95% CI)
Difference in heart age
(yrs) (95% CI)
Total* 2.7 (2.4–2.9) -1.2 (-1.4– -0.9) 3.8 (3.5–4.2) 5.3 (5.1–5.6) -1.6 (-1.9– -1.4) 7.0 (6.6–7.3)Age group (yrs)†
30–39 0.6 (0.2–1.0) -1.6 (-2.0–1.3) 2.2 (1.7–2.7) 1.3 (0.9–1.6) -3.7 (-4.0–3.4) 4.9 (4.5–5.4)40–49 1.6 (1.1–2.1) -1.8 (-2.2–1.4) 3.4 (2.8–4.1) 4.3 (3.8–4.8) -2.5 (-3.0–2.1) 6.9 (6.2–7.5)50–59 4.7 (4.1–5.2) -0.5 (-1.2–0.2) 5.1 (4.2–6.0) 8.7 (8.1–9.3) 0.2 (-0.7–1.1) 8.5 (7.5–9.5)60–74 4.4 (3.8–5.0) -0.2 (-1.1–0.6) 4.7 (3.7–5.7) 7.4 (6.9–7.9) 0.7 (0.0–1.5) 6.7 (5.8–7.6)p-value** <0.001 <0.001 <0.001 <0.001 <0.001 <0.001Education§
<High school (1) 1.0 (0.2–1.8) -3.9 (-4.4–3.4) 4.9 (4.0–5.7) 4.7 (3.9–5.6) -4.6 (-5.3–3.9) 9.3 (8.4–10.3)High school (2) 2.4 (1.9–2.9) -1.4 (-1.8–0.9) 3.8 (3.1–4.4) 4.9 (4.4–5.3) -1.5 (-2.0– -1.0) 6.3 (5.7–6.9)>High school (3) 3.1 (2.8–3.4) 0.8 (0.4–1.1) 2.3 (1.9–2.8) 5.5 (5.2–5.8) 0.2 (-0.2–0.5) 5.4 (4.9–5.8)p-value (1) vs. (2)†† 0.003 <0.001 0.050 0.811 <0.001 <0.001p-value (1) vs. (3)†† <0.001 <0.001 <0.001 0.088 <0.001 <0.001Annual household income¶
<$35,000 2.0 (1.6–2.5) -2.6 (-3.0– -2.2) 4.6 (4.1–5.2) 4.6 (4.2.4–4.9) -3.5 (-3.9– -3.1) 8.1 (7.6–8.6)≥$35,000 2.9 (2.5–3.2) 0.3 (-0.1–0.6) 2.6 (2.1–3.1) 5.4 (5.1–5.8) 0.5 (0.0–1.0) 5.0 (4.4–5.6)p-value†† 0.004 <0.001 <0.001 0.001 <0.001 <0.001
Abbreviation: CI = confidence interval. * Adjusted for age (30–39, 40–49, 50–59, and 60–74 years), education (<high school, high school, and >high school), and annual household income (<$35,000,
≥$35,000, and unknown). † Adjusted for age (30–39, 40–49, 50–59, and 60–74 years), education (<high school, high school, and >high school), household income (<$35,000, ≥$35,000, and
unknown), and included an interaction term of age-by-race/ethnicity to estimate racial difference in excess heart age by age group. § Adjusted for age (30–39, 40–49, 50–59, and 60–74 years), education (<high school, high school, and >high school), household income (<$35,000, ≥$35,000, and
unknown), and included an interaction term of education-by-race/ethnicity to estimate racial difference in excess heart age by educational attainment group. ¶ Adjusted for age (30–39, 40–49, 50–59, and 60–74 years), education (<high school, high school, and >high school), household income (<$35,000, ≥$35,000, and
unknown), and included an interaction term of household income-by-race/ethnicity to estimate racial difference in excess heart age by household income level. ** p-value based on t-tests across the age group. †† p-value based on pairwise t-tests.
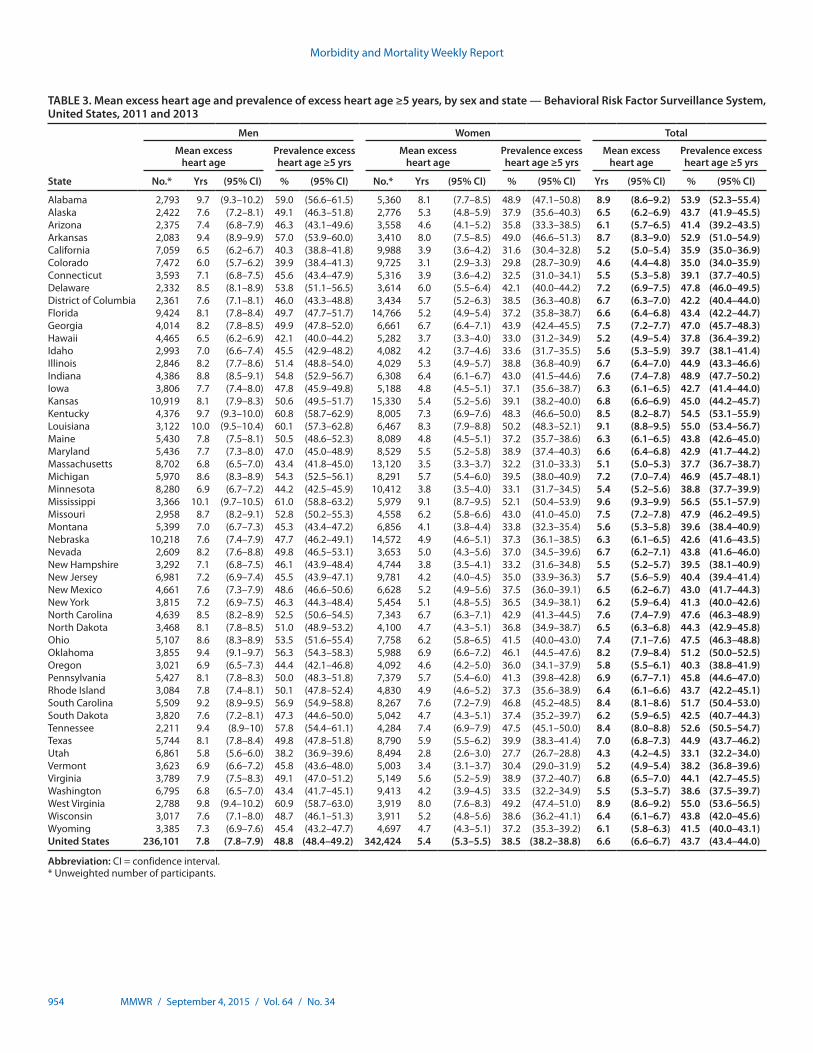
Morbidity and Mortality Weekly Report
954 MMWR / September 4, 2015 / Vol. 64 / No. 34
TABLE 3. Mean excess heart age and prevalence of excess heart age ≥5 years, by sex and state — Behavioral Risk Factor Surveillance System, United States, 2011 and 2013
State
Men Women Total
Mean excess heart age
Prevalence excess heart age ≥5 yrs
Mean excess heart age
Prevalence excess heart age ≥5 yrs
Mean excess heart age
Prevalence excess heart age ≥5 yrs
No.* Yrs (95% CI) % (95% CI) No.* Yrs (95% CI) % (95% CI) Yrs (95% CI) % (95% CI)
Alabama 2,793 9.7 (9.3–10.2) 59.0 (56.6–61.5) 5,360 8.1 (7.7–8.5) 48.9 (47.1–50.8) 8.9 (8.6–9.2) 53.9 (52.3–55.4)Alaska 2,422 7.6 (7.2–8.1) 49.1 (46.3–51.8) 2,776 5.3 (4.8–5.9) 37.9 (35.6–40.3) 6.5 (6.2–6.9) 43.7 (41.9–45.5)Arizona 2,375 7.4 (6.8–7.9) 46.3 (43.1–49.6) 3,558 4.6 (4.1–5.2) 35.8 (33.3–38.5) 6.1 (5.7–6.5) 41.4 (39.2–43.5)Arkansas 2,083 9.4 (8.9–9.9) 57.0 (53.9–60.0) 3,410 8.0 (7.5–8.5) 49.0 (46.6–51.3) 8.7 (8.3–9.0) 52.9 (51.0–54.9)California 7,059 6.5 (6.2–6.7) 40.3 (38.8–41.8) 9,988 3.9 (3.6–4.2) 31.6 (30.4–32.8) 5.2 (5.0–5.4) 35.9 (35.0–36.9)Colorado 7,472 6.0 (5.7–6.2) 39.9 (38.4–41.3) 9,725 3.1 (2.9–3.3) 29.8 (28.7–30.9) 4.6 (4.4–4.8) 35.0 (34.0–35.9)Connecticut 3,593 7.1 (6.8–7.5) 45.6 (43.4–47.9) 5,316 3.9 (3.6–4.2) 32.5 (31.0–34.1) 5.5 (5.3–5.8) 39.1 (37.7–40.5)Delaware 2,332 8.5 (8.1–8.9) 53.8 (51.1–56.5) 3,614 6.0 (5.5–6.4) 42.1 (40.0–44.2) 7.2 (6.9–7.5) 47.8 (46.0–49.5)District of Columbia 2,361 7.6 (7.1–8.1) 46.0 (43.3–48.8) 3,434 5.7 (5.2–6.3) 38.5 (36.3–40.8) 6.7 (6.3–7.0) 42.2 (40.4–44.0)Florida 9,424 8.1 (7.8–8.4) 49.7 (47.7–51.7) 14,766 5.2 (4.9–5.4) 37.2 (35.8–38.7) 6.6 (6.4–6.8) 43.4 (42.2–44.7)Georgia 4,014 8.2 (7.8–8.5) 49.9 (47.8–52.0) 6,661 6.7 (6.4–7.1) 43.9 (42.4–45.5) 7.5 (7.2–7.7) 47.0 (45.7–48.3)Hawaii 4,465 6.5 (6.2–6.9) 42.1 (40.0–44.2) 5,282 3.7 (3.3–4.0) 33.0 (31.2–34.9) 5.2 (4.9–5.4) 37.8 (36.4–39.2)Idaho 2,993 7.0 (6.6–7.4) 45.5 (42.9–48.2) 4,082 4.2 (3.7–4.6) 33.6 (31.7–35.5) 5.6 (5.3–5.9) 39.7 (38.1–41.4)Illinois 2,846 8.2 (7.7–8.6) 51.4 (48.8–54.0) 4,029 5.3 (4.9–5.7) 38.8 (36.8–40.9) 6.7 (6.4–7.0) 44.9 (43.3–46.6)Indiana 4,386 8.8 (8.5–9.1) 54.8 (52.9–56.7) 6,308 6.4 (6.1–6.7) 43.0 (41.5–44.6) 7.6 (7.4–7.8) 48.9 (47.7–50.2)Iowa 3,806 7.7 (7.4–8.0) 47.8 (45.9–49.8) 5,188 4.8 (4.5–5.1) 37.1 (35.6–38.7) 6.3 (6.1–6.5) 42.7 (41.4–44.0)Kansas 10,919 8.1 (7.9–8.3) 50.6 (49.5–51.7) 15,330 5.4 (5.2–5.6) 39.1 (38.2–40.0) 6.8 (6.6–6.9) 45.0 (44.2–45.7)Kentucky 4,376 9.7 (9.3–10.0) 60.8 (58.7–62.9) 8,005 7.3 (6.9–7.6) 48.3 (46.6–50.0) 8.5 (8.2–8.7) 54.5 (53.1–55.9)Louisiana 3,122 10.0 (9.5–10.4) 60.1 (57.3–62.8) 6,467 8.3 (7.9–8.8) 50.2 (48.3–52.1) 9.1 (8.8–9.5) 55.0 (53.4–56.7)Maine 5,430 7.8 (7.5–8.1) 50.5 (48.6–52.3) 8,089 4.8 (4.5–5.1) 37.2 (35.7–38.6) 6.3 (6.1–6.5) 43.8 (42.6–45.0)Maryland 5,436 7.7 (7.3–8.0) 47.0 (45.0–48.9) 8,529 5.5 (5.2–5.8) 38.9 (37.4–40.3) 6.6 (6.4–6.8) 42.9 (41.7–44.2)Massachusetts 8,702 6.8 (6.5–7.0) 43.4 (41.8–45.0) 13,120 3.5 (3.3–3.7) 32.2 (31.0–33.3) 5.1 (5.0–5.3) 37.7 (36.7–38.7)Michigan 5,970 8.6 (8.3–8.9) 54.3 (52.5–56.1) 8,291 5.7 (5.4–6.0) 39.5 (38.0–40.9) 7.2 (7.0–7.4) 46.9 (45.7–48.1)Minnesota 8,280 6.9 (6.7–7.2) 44.2 (42.5–45.9) 10,412 3.8 (3.5–4.0) 33.1 (31.7–34.5) 5.4 (5.2–5.6) 38.8 (37.7–39.9)Mississippi 3,366 10.1 (9.7–10.5) 61.0 (58.8–63.2) 5,979 9.1 (8.7–9.5) 52.1 (50.4–53.9) 9.6 (9.3–9.9) 56.5 (55.1–57.9)Missouri 2,958 8.7 (8.2–9.1) 52.8 (50.2–55.3) 4,558 6.2 (5.8–6.6) 43.0 (41.0–45.0) 7.5 (7.2–7.8) 47.9 (46.2–49.5)Montana 5,399 7.0 (6.7–7.3) 45.3 (43.4–47.2) 6,856 4.1 (3.8–4.4) 33.8 (32.3–35.4) 5.6 (5.3–5.8) 39.6 (38.4–40.9)Nebraska 10,218 7.6 (7.4–7.9) 47.7 (46.2–49.1) 14,572 4.9 (4.6–5.1) 37.3 (36.1–38.5) 6.3 (6.1–6.5) 42.6 (41.6–43.5)Nevada 2,609 8.2 (7.6–8.8) 49.8 (46.5–53.1) 3,653 5.0 (4.3–5.6) 37.0 (34.5–39.6) 6.7 (6.2–7.1) 43.8 (41.6–46.0)New Hampshire 3,292 7.1 (6.8–7.5) 46.1 (43.9–48.4) 4,744 3.8 (3.5–4.1) 33.2 (31.6–34.8) 5.5 (5.2–5.7) 39.5 (38.1–40.9)New Jersey 6,981 7.2 (6.9–7.4) 45.5 (43.9–47.1) 9,781 4.2 (4.0–4.5) 35.0 (33.9–36.3) 5.7 (5.6–5.9) 40.4 (39.4–41.4)New Mexico 4,661 7.6 (7.3–7.9) 48.6 (46.6–50.6) 6,628 5.2 (4.9–5.6) 37.5 (36.0–39.1) 6.5 (6.2–6.7) 43.0 (41.7–44.3)New York 3,815 7.2 (6.9–7.5) 46.3 (44.3–48.4) 5,454 5.1 (4.8–5.5) 36.5 (34.9–38.1) 6.2 (5.9–6.4) 41.3 (40.0–42.6)North Carolina 4,639 8.5 (8.2–8.9) 52.5 (50.6–54.5) 7,343 6.7 (6.3–7.1) 42.9 (41.3–44.5) 7.6 (7.4–7.9) 47.6 (46.3–48.9)North Dakota 3,468 8.1 (7.8–8.5) 51.0 (48.9–53.2) 4,100 4.7 (4.3–5.1) 36.8 (34.9–38.7) 6.5 (6.3–6.8) 44.3 (42.9–45.8)Ohio 5,107 8.6 (8.3–8.9) 53.5 (51.6–55.4) 7,758 6.2 (5.8–6.5) 41.5 (40.0–43.0) 7.4 (7.1–7.6) 47.5 (46.3–48.8)Oklahoma 3,855 9.4 (9.1–9.7) 56.3 (54.3–58.3) 5,988 6.9 (6.6–7.2) 46.1 (44.5–47.6) 8.2 (7.9–8.4) 51.2 (50.0–52.5)Oregon 3,021 6.9 (6.5–7.3) 44.4 (42.1–46.8) 4,092 4.6 (4.2–5.0) 36.0 (34.1–37.9) 5.8 (5.5–6.1) 40.3 (38.8–41.9)Pennsylvania 5,427 8.1 (7.8–8.3) 50.0 (48.3–51.8) 7,379 5.7 (5.4–6.0) 41.3 (39.8–42.8) 6.9 (6.7–7.1) 45.8 (44.6–47.0)Rhode Island 3,084 7.8 (7.4–8.1) 50.1 (47.8–52.4) 4,830 4.9 (4.6–5.2) 37.3 (35.6–38.9) 6.4 (6.1–6.6) 43.7 (42.2–45.1)South Carolina 5,509 9.2 (8.9–9.5) 56.9 (54.9–58.8) 8,267 7.6 (7.2–7.9) 46.8 (45.2–48.5) 8.4 (8.1–8.6) 51.7 (50.4–53.0)South Dakota 3,820 7.6 (7.2–8.1) 47.3 (44.6–50.0) 5,042 4.7 (4.3–5.1) 37.4 (35.2–39.7) 6.2 (5.9–6.5) 42.5 (40.7–44.3)Tennessee 2,211 9.4 (8.9–10) 57.8 (54.4–61.1) 4,284 7.4 (6.9–7.9) 47.5 (45.1–50.0) 8.4 (8.0–8.8) 52.6 (50.5–54.7)Texas 5,744 8.1 (7.8–8.4) 49.8 (47.8–51.8) 8,790 5.9 (5.5–6.2) 39.9 (38.3–41.4) 7.0 (6.8–7.3) 44.9 (43.7–46.2)Utah 6,861 5.8 (5.6–6.0) 38.2 (36.9–39.6) 8,494 2.8 (2.6–3.0) 27.7 (26.7–28.8) 4.3 (4.2–4.5) 33.1 (32.2–34.0)Vermont 3,623 6.9 (6.6–7.2) 45.8 (43.6–48.0) 5,003 3.4 (3.1–3.7) 30.4 (29.0–31.9) 5.2 (4.9–5.4) 38.2 (36.8–39.6)Virginia 3,789 7.9 (7.5–8.3) 49.1 (47.0–51.2) 5,149 5.6 (5.2–5.9) 38.9 (37.2–40.7) 6.8 (6.5–7.0) 44.1 (42.7–45.5)Washington 6,795 6.8 (6.5–7.0) 43.4 (41.7–45.1) 9,413 4.2 (3.9–4.5) 33.5 (32.2–34.9) 5.5 (5.3–5.7) 38.6 (37.5–39.7)West Virginia 2,788 9.8 (9.4–10.2) 60.9 (58.7–63.0) 3,919 8.0 (7.6–8.3) 49.2 (47.4–51.0) 8.9 (8.6–9.2) 55.0 (53.6–56.5)Wisconsin 3,017 7.6 (7.1–8.0) 48.7 (46.1–51.3) 3,911 5.2 (4.8–5.6) 38.6 (36.2–41.1) 6.4 (6.1–6.7) 43.8 (42.0–45.6)Wyoming 3,385 7.3 (6.9–7.6) 45.4 (43.2–47.7) 4,697 4.7 (4.3–5.1) 37.2 (35.3–39.2) 6.1 (5.8–6.3) 41.5 (40.0–43.1)United States 236,101 7.8 (7.8–7.9) 48.8 (48.4–49.2) 342,424 5.4 (5.3–5.5) 38.5 (38.2–38.8) 6.6 (6.6–6.7) 43.7 (43.4–44.0)
Abbreviation: CI = confidence interval.* Unweighted number of participants.
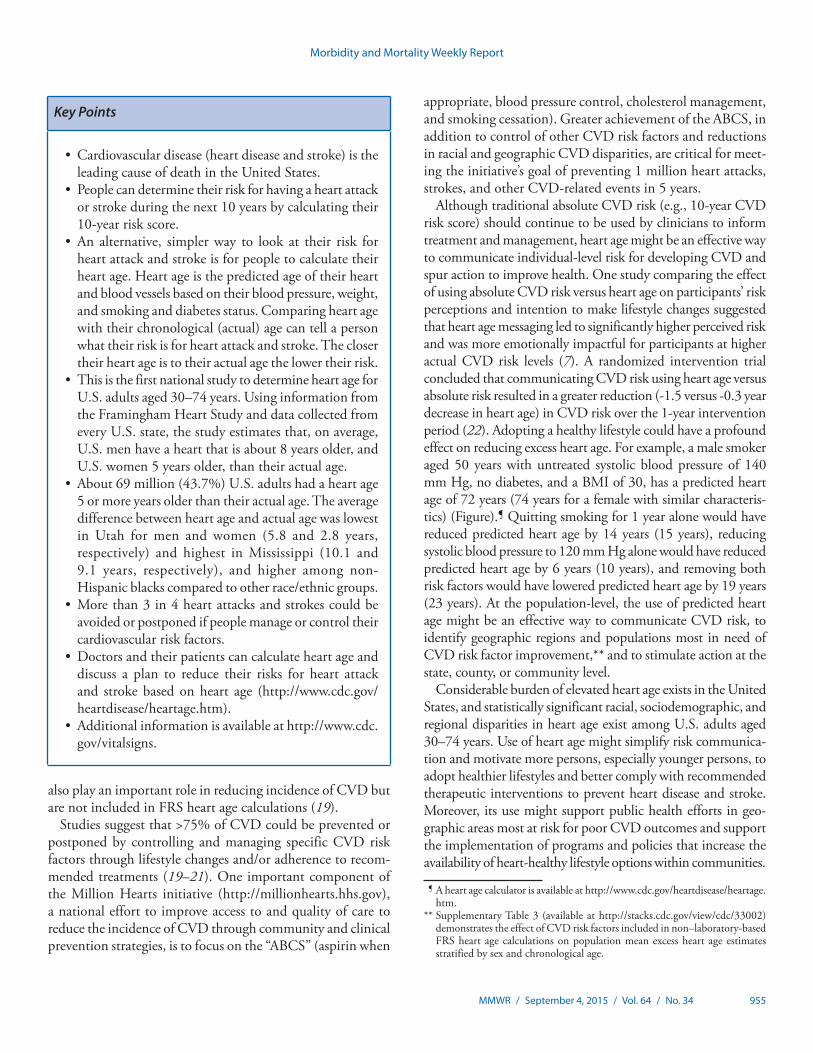
Morbidity and Mortality Weekly Report
MMWR / September 4, 2015 / Vol. 64 / No. 34 955
also play an important role in reducing incidence of CVD but are not included in FRS heart age calculations (19).
Studies suggest that >75% of CVD could be prevented or postponed by controlling and managing specific CVD risk factors through lifestyle changes and/or adherence to recom-mended treatments (19–21). One important component of the Million Hearts initiative (http://millionhearts.hhs.gov), a national effort to improve access to and quality of care to reduce the incidence of CVD through community and clinical prevention strategies, is to focus on the “ABCS” (aspirin when
appropriate, blood pressure control, cholesterol management, and smoking cessation). Greater achievement of the ABCS, in addition to control of other CVD risk factors and reductions in racial and geographic CVD disparities, are critical for meet-ing the initiative’s goal of preventing 1 million heart attacks, strokes, and other CVD-related events in 5 years.
Although traditional absolute CVD risk (e.g., 10-year CVD risk score) should continue to be used by clinicians to inform treatment and management, heart age might be an effective way to communicate individual-level risk for developing CVD and spur action to improve health. One study comparing the effect of using absolute CVD risk versus heart age on participants’ risk perceptions and intention to make lifestyle changes suggested that heart age messaging led to significantly higher perceived risk and was more emotionally impactful for participants at higher actual CVD risk levels (7). A randomized intervention trial concluded that communicating CVD risk using heart age versus absolute risk resulted in a greater reduction (-1.5 versus -0.3 year decrease in heart age) in CVD risk over the 1-year intervention period (22). Adopting a healthy lifestyle could have a profound effect on reducing excess heart age. For example, a male smoker aged 50 years with untreated systolic blood pressure of 140 mm Hg, no diabetes, and a BMI of 30, has a predicted heart age of 72 years (74 years for a female with similar characteris-tics) (Figure).¶ Quitting smoking for 1 year alone would have reduced predicted heart age by 14 years (15 years), reducing systolic blood pressure to 120 mm Hg alone would have reduced predicted heart age by 6 years (10 years), and removing both risk factors would have lowered predicted heart age by 19 years (23 years). At the population-level, the use of predicted heart age might be an effective way to communicate CVD risk, to identify geographic regions and populations most in need of CVD risk factor improvement,** and to stimulate action at the state, county, or community level.
Considerable burden of elevated heart age exists in the United States, and statistically significant racial, sociodemographic, and regional disparities in heart age exist among U.S. adults aged 30–74 years. Use of heart age might simplify risk communica-tion and motivate more persons, especially younger persons, to adopt healthier lifestyles and better comply with recommended therapeutic interventions to prevent heart disease and stroke. Moreover, its use might support public health efforts in geo-graphic areas most at risk for poor CVD outcomes and support the implementation of programs and policies that increase the availability of heart-healthy lifestyle options within communities.
¶ A heart age calculator is available at http://www.cdc.gov/heartdisease/heartage.htm.
** Supplementary Table 3 (available at http://stacks.cdc.gov/view/cdc/33002) demonstrates the effect of CVD risk factors included in non–laboratory-based FRS heart age calculations on population mean excess heart age estimates stratified by sex and chronological age.
Key Points
•Cardiovascular disease (heart disease and stroke) is the leading cause of death in the United States.
• People can determine their risk for having a heart attack or stroke during the next 10 years by calculating their 10-year risk score.
•An alternative, simpler way to look at their risk for heart attack and stroke is for people to calculate their heart age. Heart age is the predicted age of their heart and blood vessels based on their blood pressure, weight, and smoking and diabetes status. Comparing heart age with their chronological (actual) age can tell a person what their risk is for heart attack and stroke. The closer their heart age is to their actual age the lower their risk.
•This is the first national study to determine heart age for U.S. adults aged 30–74 years. Using information from the Framingham Heart Study and data collected from every U.S. state, the study estimates that, on average, U.S. men have a heart that is about 8 years older, and U.S. women 5 years older, than their actual age.
•About 69 million (43.7%) U.S. adults had a heart age 5 or more years older than their actual age. The average difference between heart age and actual age was lowest in Utah for men and women (5.8 and 2.8 years, respectively) and highest in Mississippi (10.1 and 9.1 years, respectively), and higher among non-Hispanic blacks compared to other race/ethnic groups.
•More than 3 in 4 heart attacks and strokes could be avoided or postponed if people manage or control their cardiovascular risk factors.
•Doctors and their patients can calculate heart age and discuss a plan to reduce their risks for heart attack and stroke based on heart age (http://www.cdc.gov/heartdisease/heartage.htm).
•Additional information is available at http://www.cdc.gov/vitalsigns.
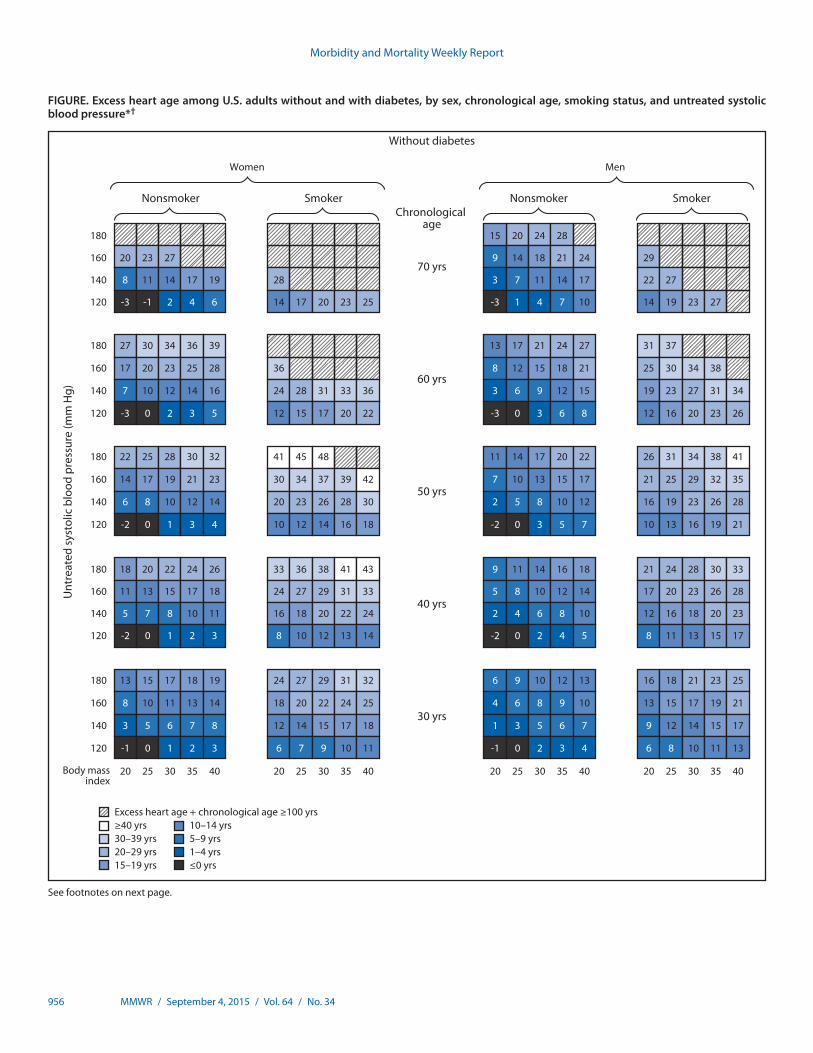
Morbidity and Mortality Weekly Report
956 MMWR / September 4, 2015 / Vol. 64 / No. 34
FIGURE. Excess heart age among U.S. adults without and with diabetes, by sex, chronological age, smoking status, and untreated systolic blood pressure*†
Excess heart age + chronological age ≥100 yrs≥40 yrs30–39 yrs20–29 yrs15–19 yrs
10–14 yrs5–9 yrs1–4 yrs≤0 yrs
180 15 20 24 28
160 20 23 27 9 14 18 21 24 29
140 8 11 14 17 19 28 3 7 11 14 17 22 27
180 27 30 34 36 39 13 17 21 24 27 31 37
120 -3 -1 2 4 6 14 17 20 23 25 -3 1 4 7 10 14 19 23 27
160 17 20 23 25 28 36 8 12 15 18 21 25 30 34 38
140 7 10 12 14 16 24 28 31 33 36 3 6 9 12 15 19 23 27 31 34
120 -3 0 2 3 5 12 15 17 20 22 -3 0 3 6 8 12 16 20 23 26
180 22 25 28 30 32 41 45 48 11 14 17 20 22 26 31 34 38 41
160 14 17 19 21 23 30 34 37 39 42 7 10 13 15 17 21 25 29 32 35
140 6 8 10 12 14 20 23 26 28 30 2 5 8 10 12 16 19 23 26 28
120 -2 0 1 3 4 10 12 14 16 18 -2 0 3 5 7 10 13 16 19 21
180 18 20 22 24 26 33 36 38 41 43 9 11 14 16 18 21 24 28 30 33
160 11 13 15 17 18 24 27 29 31 33 5 8 10 12 14 17 20 23 26 28
140 5 7 8 10 11 16 18 20 22 24 2 4 6 8 10 12 16 18 20 23
120 -2 0 1 2 3 8 10 12 13 14 -2 0 2 4 5 8 11 13 15 17
180 13 15 17 18 19 24 27 29 31 32 6 9 10 12 13 16 18 21 23 25
160 8 10 11 13 14 18 20 22 24 25 4 6 8 9 10 13 15 17 19 21
140 3 5 6 7 8 12 14 15 17 18 1 3 5 6 7 9 12 14 15 17
120 -1 0 1 2 3 6 7 9 10 11 -1 0 2 3 4 6 8 10 11 13
20 25 30 35 40 20 25 30 35 40 20 25 30 35 40 20 25 30 35 40
Unt
reat
ed s
ysto
lic b
lood
pre
ssur
e (m
m H
g)
Nonsmoker Smoker Nonsmoker Smoker
Women Men
Chronological age
70 yrs
60 yrs
50 yrs
40 yrs
30 yrs
Body mass index
Without diabetes
See footnotes on next page.
imt2
Text Box
Please note: Errata have been published for this issue. To view the errata, please click here and here.
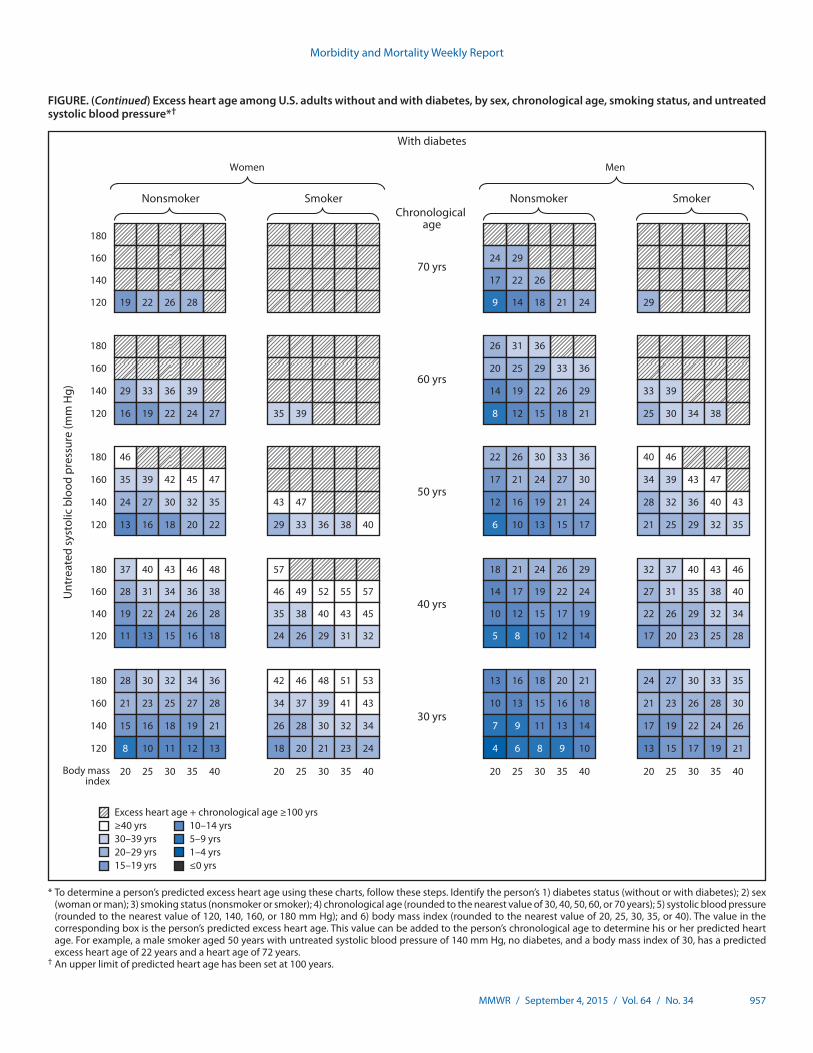
Morbidity and Mortality Weekly Report
MMWR / September 4, 2015 / Vol. 64 / No. 34 957
FIGURE. (Continued) Excess heart age among U.S. adults without and with diabetes, by sex, chronological age, smoking status, and untreated systolic blood pressure*†
Excess heart age + chronological age ≥100 yrs≥40 yrs30–39 yrs20–29 yrs15–19 yrs
10–14 yrs5–9 yrs1–4 yrs≤0 yrs
180
160 24 29
140 17 22 26
180 26 31 36
120 19 22 26 28 9 14 18 21 24 29
160 20 25 29 33 36
140 29 33 36 39 14 19 22 26 29 33 39
120 16 19 22 24 27 35 39 8 12 15 18 21 25 30 34 38
180 46 22 26 30 33 36 40 46
160 35 39 42 45 47 17 21 24 27 30 34 39 43 47
140 24 27 30 32 35 43 47 12 16 19 21 24 28 32 36 40 43
120 13 16 18 20 22 29 33 36 38 40 6 10 13 15 17 21 25 29 32 35
180 37 40 43 46 48 57 18 21 24 26 29 32 37 40 43 46
160 28 31 34 36 38 46 49 52 55 57 14 17 19 22 24 27 31 35 38 40
140 19 22 24 26 28 35 38 40 43 45 10 12 15 17 19 22 26 29 32 34
120 11 13 15 16 18 24 26 29 31 32 5 8 10 12 14 17 20 23 25 28
180 28 30 32 34 36 42 46 48 51 53 13 16 18 20 21 24 27 30 33 35
160 21 23 25 27 28 34 37 39 41 43 10 13 15 16 18 21 23 26 28 30
140 15 16 18 19 21 26 28 30 32 34 7 9 11 13 14 17 19 22 24 26
120 8 10 11 12 13 18 20 21 23 24 4 6 8 9 10 13 15 17 19 21
20 25 30 35 40 20 25 30 35 40 20 25 30 35 40 20 25 30 35 40
Unt
reat
ed s
ysto
lic b
lood
pre
ssur
e (m
m H
g)
Nonsmoker Smoker Nonsmoker Smoker
Women Men
Chronological age
70 yrs
60 yrs
50 yrs
40 yrs
30 yrs
Body mass index
With diabetes
* To determine a person’s predicted excess heart age using these charts, follow these steps. Identify the person’s 1) diabetes status (without or with diabetes); 2) sex (woman or man); 3) smoking status (nonsmoker or smoker); 4) chronological age (rounded to the nearest value of 30, 40, 50, 60, or 70 years); 5) systolic blood pressure (rounded to the nearest value of 120, 140, 160, or 180 mm Hg); and 6) body mass index (rounded to the nearest value of 20, 25, 30, 35, or 40). The value in the corresponding box is the person’s predicted excess heart age. This value can be added to the person’s chronological age to determine his or her predicted heart age. For example, a male smoker aged 50 years with untreated systolic blood pressure of 140 mm Hg, no diabetes, and a body mass index of 30, has a predicted excess heart age of 22 years and a heart age of 72 years.
† An upper limit of predicted heart age has been set at 100 years.
imt2
Text Box
Please note: Errata have been published for this issue. To view the errata, please click here and here.

Morbidity and Mortality Weekly Report
958 MMWR / September 4, 2015 / Vol. 64 / No. 34
Acknowledgments
BRFSS coordinators from states and the District of Columbia; Survey Operation Team, Division of Population Health, National Center for Chronic Disease Prevention and Health Promotion, CDC.
1Division for Heart Disease and Stroke Prevention, CDC; 2Habit Partners Community Interest Company, London, United Kingdom.
Corresponding author: Quanhe Yang, [email protected], 770-488-8559.
References 1. Mozaffarian D, Benjamin EJ, Go AS, et al.; American Heart Association
Statistics Committee and Stroke Statistics Subcommittee. Heart disease and stroke statistics—2015 update: a report from the American Heart Association. Circulation 2015;131:e29–322.
2. Wilson PW, D’Agostino RB, Levy D, Belanger AM, Silbershatz H, Kannel WB. Prediction of coronary heart disease using risk factor categories. Circulation 1998;97:1837–47.
3. Kurian AK, Cardarelli KM. Racial and ethnic differences in cardiovascular disease risk factors: a systematic review. Ethn Dis 2007;17:143–52.
4. Mensah GA, Mokdad AH, Ford ES, Greenlund KJ, Croft JB. State of disparities in cardiovascular health in the United States. Circulation 2005;111:1233–41.
5. Siontis GC, Tzoulaki I, Siontis KC, Ioannidis JP. Comparisons of established risk prediction models for cardiovascular disease: systematic review. BMJ 2012;344:e3318.
6. Goff DC Jr, Lloyd-Jones DM, Bennett G, et al.; American College of Cardiology/American Heart Association Task Force on Practice Guidelines. 2013 ACC/AHA guideline on the assessment of cardiovascular risk: a report of the American College of Cardiology/American Heart Association Task Force on Practice Guidelines. Circulation 2014;129(Suppl 2):S49–73.
7. Soureti A, Hurling R, Murray P, van Mechelen W, Cobain M. Evaluation of a cardiovascular disease risk assessment tool for the promotion of healthier lifestyles. Eur J Cardiovasc Prev Rehabil 2010;17:519–23.
8. Groenewegen K, den Ruijter H, Pasterkamp G, Polak J, Bots M, Peters SA. Vascular age to determine cardiovascular disease risk: a systematic review of its concepts, definitions, and clinical applications. Eur J Prev Cardiol 2015 [Epub ahead of print].
9. Berry JD, Liu K, Folsom AR, et al. Prevalence and progression of subclinical atherosclerosis in younger adults with low short-term but high lifetime estimated risk for cardiovascular disease: the coronary artery risk development in young adults study and multi-ethnic study of atherosclerosis. Circulation 2009;119:382–9.
10. D’Agostino RB Sr, Vasan RS, Pencina MJ, et al. General cardiovascular risk profile for use in primary care: the Framingham Heart Study. Circulation 2008;117:743–53.
11. Anderson TJ, Grégoire J, Hegele RA, et al. 2012 update of the Canadian Cardiovascular Society guidelines for the diagnosis and treatment of dyslipidemia for the prevention of cardiovascular disease in the adult. Can J Cardiol 2013;29:151–67.
12. Yang Q, Zhong Y, Ritchey M, et al. Predicted 10-year risk of developing cardiovascular disease at the state level in the U.S. Am J. Prev Med 2015;48:58–69.
13. Ford ES, Greenlund KJ, Hong Y. Ideal cardiovascular health and mortality from all causes and diseases of the circulatory system among adults in the United States. Circulation 2012;125:987–95.
14. Yang Q, Cogswell ME, Flanders WD, et al. Trends in cardiovascular health metrics and associations with all-cause and CVD mortality among US adults. JAMA 2012;307:1273–83.
15. Allan GM, Nouri F, Korownyk C, Kolber MR, Vandermeer B, McCormack J. Agreement among cardiovascular disease risk calculators. Circulation 2013;127:1948–56.
16. Yun S, Zhu BP, Black W, Brownson RC. A comparison of national estimates of obesity prevalence from the behavioral risk factor surveillance system and the National Health and Nutrition Examination Survey. Int J Obes 2006;30:164–70.
17. Bowlin SJ, Morrill BD, Nafziger AN, Jenkins PL, Lewis C, Pearson TA. Validity of cardiovascular disease risk factors assessed by telephone survey: the Behavioral Risk Factor Survey. J Clin Epidemiol 1993;46:561–71.
18. Saydah SH, Geiss LS, Tierney E, Benjamin SM, Engelgau M, Brancati F. Review of the performance of methods to identify diabetes cases among vital statistics, administrative, and survey data. Ann Epidemiol 2004;14:507–16.
19. Eckel RH, Jakicic JM, Ard JD, et al.; American College of Cardiology/American Heart Association Task Force on Practice Guidelines. 2013 AHA/ACC guideline on lifestyle management to reduce cardiovascular risk: a report of the American College of Cardiology/American Heart Association Task Force on Practice Guidelines. Circulation 2014;129(Suppl 2):S76–99.
20. Magnus P, Beaglehole R. The real contribution of the major risk factors to the coronary epidemics: time to end the “only-50%” myth. Arch Intern Med 2001;161:2657–60.
21. Stamler J, Stamler R, Neaton JD, et al. Low risk-factor profile and long-term cardiovascular and noncardiovascular mortality and life expectancy: findings for 5 large cohorts of young adult and middle-aged men and women. JAMA 1999;282:2012–8.
22. Lopez-Gonzalez AA, Aguilo A, Frontera M, et al. Effectiveness of the Heart Age tool for improving modifiable cardiovascular risk factors in a Southern European population: a randomized trial. Eur J Prev Cardiol 2015;22:389–96.
Morbidity and Mortality Weekly Report
MMWR / September 4, 2015 / Vol. 64 / No. 34 959
Announcements
International Fetal Alcohol Spectrum Disorders Awareness Day — September 9, 2015
Alcohol use during pregnancy can cause a range of lifelong physical, behavioral, and intellectual disabilities known as fetal alcohol spectrum disorders (FASDs) (1). Alcohol use during pregnancy can also cause miscarriage, stillbirth, prematurity, and sudden infant death syndrome (2). During pregnancy, there is no known safe amount of alcohol use as well as no safe time and no safe type of alcohol to drink.
Each year, the ninth day of the ninth month (September 9) marks FASD Awareness Day. This day was chosen to commem-orate the 9 months of pregnancy and to serve as a reminder that the best advice is to avoid any alcohol use during pregnancy. The first awareness day was recognized on 9/9/1999.
CDC is working with FASD Practice and Implementation Centers and national partners to promote systems-level practice changes among providers through training and implementation of evidence-based approaches in the prevention, identification, and management of FASDs. More information is available at http://www.cdc.gov/ncbddd/fasd/training.html. Healthcare professionals can use alcohol screening and brief counseling to help people who are drinking too much to reduce their alcohol use and advise women not to drink at all if there is any chance they could be pregnant (3). More information is available at http://www.cdc.gov/ncbddd/fasd/alcohol-screening.html.
FASDs are completely preventable if a woman does not drink alcohol during pregnancy. More information about FASDs and alcohol use during pregnancy is available at http://www.cdc.gov/fasd.
References1. Sokol RJ, Delaney-Black V, Nordstrom B. Fetal alcohol spectrum disorder.
JAMA 2003;290:2996–9.2. Bailey BA, Sokol RJ. Prenatal alcohol exposure and miscarriage, stillbirth,
preterm delivery, and sudden infant death syndrome. Alcohol Res Health 2011;34:86–91.
3. McKnight-Eily LR, Liu Y, Brewer RD, et al. Vital signs: communication between health professionals and their patients about alcohol use—44 states and the District of Columbia, 2011. MMWR Morb Mortal Wkly Rep 2014;63:16–22.
Recommendations Regarding Interventions to Increase Appropriate Vaccination — Community Preventive Services Task Force
The Community Preventive Services Task Force posted new information about two recommendations to increase appropriate vaccination on its website: 1) “Community-Based Interventions Implemented in Combination,” available at http://www.thecommunityguide.org/vaccines/communityinterventions.html, and 2) “Health Care System-Based Interventions Implemented in Combination,” available at http://www.thecommunityguide.org/vaccines/healthsysteminterventions.html.
Established in 1996 by the U.S. Department of Health and Human Services, the task force is an independent, nonfederal, uncompensated panel of public health and prevention experts whose members are appointed by the Director of CDC. The task force provides information for a wide range of decision makers on programs, services, and policies aimed at improving population health. Although CDC provides administrative, research, and technical support for the task force, the recom-mendations developed are those of the task force and do not undergo review or approval by CDC.
Morbidity and Mortality Weekly Report
960 MMWR / September 4, 2015 / Vol. 64 / No. 34
Errata
Vol. 64, No. 34In the report, “Vital Signs: Predicted Heart Age and Racial
Disparities in Heart Age Among U.S. Adults at the State Level,” on pages 956–7, the Figure had multiple errors. The corrected Figure follows.
imt2
Highlight

Morbidity and Mortality Weekly Report
MMWR / September 4, 2015 / Vol. 64 / No. 34 961
FIGURE. Excess heart age among U.S. adults without and with diabetes, by sex, chronological age, smoking status, and untreated systolic blood pressure*†
Excess heart age + chronological age ≥100 yrs≥40 yrs30–39 yrs20–29 yrs15–19 yrs
10–14 yrs5–9 yrs1–4 yrs≤0 yrs
180 14 19 24 27
160 18 22 25 28 9 13 17 21 24 29
140 7 10 13 16 18 27 3 7 11 14 17 21 27
180 26 29 32 35 37 12 17 20 23 26 31 36
120 -4 -2 1 3 5 12 16 19 22 24 -4 0 4 6 9 13 18 22 26 29
160 16 19 22 24 26 35 39 7 11 15 18 20 25 30 34 38
140 6 9 11 13 15 23 26 29 32 34 2 6 9 12 14 18 23 27 30 33
120 -4 -1 1 2 4 11 14 16 18 20 -3 0 3 6 8 11 16 19 22 25
180 21 24 27 29 31 39 43 47 49 10 14 17 20 22 26 30 34 37 40
160 13 16 18 20 22 29 33 36 38 40 6 9 12 15 17 21 25 28 31 34
140 5 7 9 11 13 19 22 25 27 29 2 5 8 10 12 15 19 22 25 28
120 -3 -1 1 2 3 9 11 14 15 17 -3 0 3 5 6 9 13 16 19 21
180 17 19 22 23 25 32 35 37 40 42 8 11 13 16 18 21 24 27 30 32
160 10 13 14 16 18 23 26 28 30 32 5 8 10 12 14 16 20 23 25 27
140 4 6 7 9 10 15 18 20 21 23 2 4 6 8 10 12 15 18 20 22
120 -2 -1 0 2 3 7 9 11 12 14 -2 0 2 4 5 8 10 13 15 17
180 13 15 16 18 19 24 26 28 30 31 6 8 10 12 13 15 18 20 22 24
160 8 9 11 12 13 18 20 21 23 24 4 6 7 9 10 12 15 17 19 21
140 3 4 6 7 8 11 13 15 16 17 1 3 5 6 7 9 11 13 15 17
120 -2 -1 0 1 2 5 7 8 9 10 -2 0 2 3 4 6 8 10 11 13
20 25 30 35 40 20 25 30 35 40 20 25 30 35 40 20 25 30 35 40
Unt
reat
ed s
ysto
lic b
lood
pre
ssur
e (m
m H
g)
Nonsmoker Smoker Nonsmoker Smoker
Women Men
Chronological age
70 yrs
60 yrs
50 yrs
40 yrs
30 yrs
Body mass index
Without diabetes
See footnotes on next page.

Morbidity and Mortality Weekly Report
962 MMWR / September 4, 2015 / Vol. 64 / No. 34
FIGURE. (Continued) Excess heart age among U.S. adults without and with diabetes, by sex, chronological age, smoking status, and untreated systolic blood pressure*†
Excess heart age + chronological age ≥100 yrs≥40 yrs30–39 yrs20–29 yrs15–19 yrs
10–14 yrs5–9 yrs1–4 yrs≤0 yrs
180
160 23 29
140 16 21 26 29
180 26 31 35 39
120 17 21 24 27 9 13 17 21 24 29
160 20 25 29 32 35
140 28 32 35 38 14 18 22 25 28 33 38
120 15 18 21 23 25 34 38 7 11 15 18 20 25 30 34 38
180 45 49 22 26 29 32 35 40 45
160 34 38 41 43 46 17 21 24 27 30 34 39 43 47
140 23 26 29 31 33 42 46 49 50 12 15 18 21 23 27 32 36 39 42
120 12 15 17 19 21 28 32 35 37 39 6 9 12 15 17 21 25 28 31 34
180 36 39 42 44 46 55 59 17 21 23 26 28 32 36 40 43 46
160 27 30 33 35 37 44 48 51 54 56 13 16 19 22 24 27 31 34 37 40
140 19 21 23 25 27 33 37 39 42 44 9 12 15 17 19 22 25 29 31 34
120 10 12 14 15 17 23 25 28 30 31 5 8 10 12 14 16 20 23 25 27
180 27 29 31 33 35 41 45 47 49 51 13 15 18 19 21 24 27 30 32 34
160 20 23 24 26 27 33 36 38 40 42 10 12 14 16 18 20 23 26 28 30
140 14 16 17 19 20 25 27 29 31 33 7 9 11 13 14 16 19 21 24 25
120 7 9 10 12 13 17 19 21 22 24 4 6 7 9 10 12 15 17 19 21
20 25 30 35 40 20 25 30 35 40 20 25 30 35 40 20 25 30 35 40
Unt
reat
ed s
ysto
lic b
lood
pre
ssur
e (m
m H
g)
Nonsmoker Smoker Nonsmoker Smoker
Women Men
Chronological age
70 yrs
60 yrs
50 yrs
40 yrs
30 yrs
Body mass index
With diabetes
* To determine a person’s predicted excess heart age using these charts, follow these steps. Identify the person’s 1) diabetes status (without or with diabetes); 2) sex (woman or man); 3) smoking status (nonsmoker or smoker); 4) chronological age (rounded to the nearest value of 30, 40, 50, 60, or 70 years); 5) systolic blood pressure (rounded to the nearest value of 120, 140, 160, or 180 mm Hg); and 6) body mass index (rounded to the nearest value of 20, 25, 30, 35, or 40). The value in the corresponding box is the person’s predicted excess heart age. This value can be added to the person’s chronological age to determine his or her predicted heart age. For example, a male smoker aged 50 years with untreated systolic blood pressure of 140 mm Hg, no diabetes, and a body mass index of 30, has a predicted excess heart age of 22 years and a heart age of 72 years.
† An upper limit of predicted heart age has been set at 100 years.
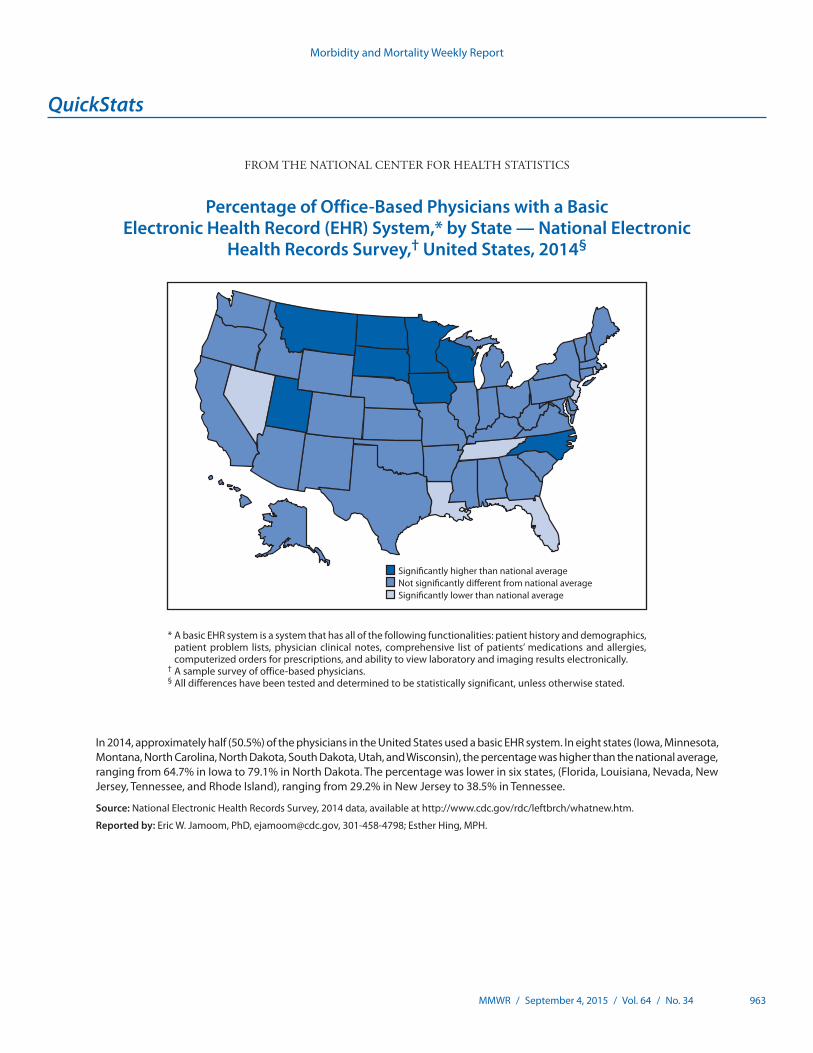
Morbidity and Mortality Weekly Report
MMWR / September 4, 2015 / Vol. 64 / No. 34 963
* A basic EHR system is a system that has all of the following functionalities: patient history and demographics, patient problem lists, physician clinical notes, comprehensive list of patients’ medications and allergies, computerized orders for prescriptions, and ability to view laboratory and imaging results electronically.
† A sample survey of office-based physicians.§ All differences have been tested and determined to be statistically significant, unless otherwise stated.
In 2014, approximately half (50.5%) of the physicians in the United States used a basic EHR system. In eight states (Iowa, Minnesota, Montana, North Carolina, North Dakota, South Dakota, Utah, and Wisconsin), the percentage was higher than the national average, ranging from 64.7% in Iowa to 79.1% in North Dakota. The percentage was lower in six states, (Florida, Louisiana, Nevada, New Jersey, Tennessee, and Rhode Island), ranging from 29.2% in New Jersey to 38.5% in Tennessee.
Source: National Electronic Health Records Survey, 2014 data, available at http://www.cdc.gov/rdc/leftbrch/whatnew.htm.
Reported by: Eric W. Jamoom, PhD, [email protected], 301-458-4798; Esther Hing, MPH.
Signi�cantly higher than national averageNot signi�cantly di�erent from national averageSigni�cantly lower than national average
QuickStats
FROM THE NATIONAL CENTER FOR HEALTH STATISTICS
Percentage of Office-Based Physicians with a Basic Electronic Health Record (EHR) System,* by State — National Electronic
Health Records Survey,† United States, 2014§

ISSN: 0149-2195
The Morbidity and Mortality Weekly Report (MMWR) Series is prepared by the Centers for Disease Control and Prevention (CDC) and is available free of charge in electronic format. To receive an electronic copy each week, visit MMWR’s free subscription page at http://www.cdc.gov/mmwr/mmwrsubscribe.html. Paper copy subscriptions are available through the Superintendent of Documents, U.S. Government Printing Office, Washington, DC 20402; telephone 202-512-1800.
Readers who have difficulty accessing this PDF file may access the HTML file at http://www.cdc.gov/mmwr/index2015.html. Address all inquiries about the MMWR Series, including material to be considered for publication, to Executive Editor, MMWR Series, Mailstop E-90, CDC, 1600 Clifton Rd., N.E., Atlanta, GA 30329-4027 or to [email protected].
All material in the MMWR Series is in the public domain and may be used and reprinted without permission; citation as to source, however, is appreciated.
Use of trade names and commercial sources is for identification only and does not imply endorsement by the U.S. Department of Health and Human Services.
References to non-CDC sites on the Internet are provided as a service to MMWR readers and do not constitute or imply endorsement of these organizations or their programs by CDC or the U.S. Department of Health and Human Services. CDC is not responsible for the content of these sites. URL addresses listed in MMWR were current as of the date of publication.
Morbidity and Mortality Weekly Report


![NORMAS DE VANCOUVER - …€¦ · Web viewDisponible en: Transmission of Hepatitis C Virus infection associated infusion therapy for hemophilia. MMWR [en línea] 1997 July 4 ...](https://static.fdocuments.net/doc/165x107/5bb2abf609d3f249438d1d92/normas-de-vancouver-web-viewdisponible-en-transmission-of-hepatitis-c-virus.jpg)


